 Open Access Article
Evaluation of the effect of site substitution of Pr doping in the lithium garnet system Li5La3Nb2O12†
M. P.
Stockham
 *a,
B.
Dong
a,
Y.
Ding
b,
Y.
Li
b and
P. R.
Slater
 *a
*a
aSchool of Chemistry, University of Birmingham, Birmingham B15 2TT, UK. E-mail: p.r.slater@bham.ac.uk
bSchool of Chemical Engineering, University of Birmingham, Birmingham B15 2TT, UK
First published on 29th May 2020
Abstract
Li ion conducting garnets have been attracting considerable interest for use as the electrolyte in all solid-state batteries, due to their high ionic conductivity and wide electrochemical stability window. Consequently, there have been a number of doping studies aimed at optimising the conductivity, focusing on both doping in Li7La3Zr2O12 and Li5La3(Nb/Ta)2O12 systems. In this paper, we report a detailed study of Pr doping in Li5La3Nb2O12, and show that this is a rare example of an ambi-site dopant, being able to be doped onto either the La or Nb site. Interestingly the resultant Pr oxidation state is determined by the site substitution, with oxidation states of 3+ for the La site, and 4+ for the Nb site. While the conductivity is essentially unchanged for the La site substitution, Pr4+ substitution on the Nb site leads to a large increase in the conductivity associated with the increase in Li content (Li5+xLa3Nb2−xPrxO12) up to 0.56 mS cm−1 (at 50 °C) for x = 0.8. Overall, this work highlights the flexibility of these garnet materials to doping, and suggests that further consideration of site substitution be considered for other dopants.
Introduction
Increased demand for portable electronic devices, electric vehicles and renewable energy has significantly expanded demand for efficient, safe, low cost and high-power energy storage. Lithium ion batteries (LIB) are principally used for these purposes, due to their high volumetric and gravimetric energy densities.1 However, current LIBs have a variety of safety, thermal and efficiency issues, which are often attributed to the liquid organic electrolytes used in the cell. These liquid electrolytes also limit the cell potential by preventing the use of lithium metal anodes.2 These disadvantages, and advantages, are covered in many review articles.1,3–7 Therefore, the replacement of liquid electrolytes with a solid-state electrolyte (SSE) to give an all solid-state battery (ASSB) remains the key challenge to deliver this next leap in energy storage.8 Such batteries, when compared to traditional LIBs, offer the potential for increased safety, operate over a wider electrochemical window, have increased thermal stability and are ideally stable against Li metal, hence increasing energy density per cell.8–12As a result, there is considerable interest in the identification and optimisation of new solid state electrolyte materials. However, many of these electrolytes, such as LISICON, sulphides/glass and LiPON, are limited by either low ionic conductivity or a poor electrochemical stability window.13–15 Of these reports, the lithium containing garnet type systems are one of the few which present with high lithium ion conductivity (reportedly >10−4 S cm−1![[thin space (1/6-em)]](https://www.rsc.org/images/entities/char_2009.gif) 16), a wide electrochemical stability window and are chemically stable against Li metal.9,13,17–19 Hence these systems are attracting considerable interest for use in ASSBs.
16), a wide electrochemical stability window and are chemically stable against Li metal.9,13,17–19 Hence these systems are attracting considerable interest for use in ASSBs.
However, there still remain challenges for these garnet systems, and so there continues to be interest in new doping studies in these materials. In particular, there is a need to further improve the ionic conductivity, as well as improve the interface between the electrolyte and electrodes.9,10,13 Traditional garnet materials have the general formula A3B2X3O12,13,20–22 where the A, B, C cations are located in 8, 6, 4 coordinate sites respectively. In the Li containing garnets, excess Li can be accommodated in interstitial sites, such that the general formula of these can be classed as A3B2Li3+xO12 (0 ≤ x ≤ 4), so that the Li content can be varied between 3 (as in Li3Ln3Te2O12), and 7 (as in Li7La3(Zr/Sn/Hf)2O12). Those systems with <7 lithium atoms crystallise in a cubic structure which has high Li-ion conductivity. In contrast, the stoichiometric Li7La3(Zr/Sn/Hf)2O12 systems crystallise in the less conductive tetragonal phase, although doping to reduce the Li content allows the formation of the cubic cell with enhanced conductivity.
For cubic garnets, such as Li5La3Nb2O12 (LLNO), ionic migration pathways have been attributed to two tetrahedral sites bridged by a single face sharing octahedron. As the lithium sites are not fully occupied in these systems, lithium partially occupies the interstitial octahedral sites 48 h and 96 g, in a disordered fashion. This gives a disordered Li sublattice and a migration pathway which leads to high ionic conductivity via the Li+ charge carrier, which is thought to follow the hopping mechanism of 24 d → 96 h → 48 g → 96 h → 24 d, as determined by high temperature neutron diffraction studies.23
Of the wide variety of garnet systems, particular attention has been afforded to Li7La3Zr2O12 (LLZO). This stoichiometric system is tetragonal at room temperature, with comparatively low conductivity, and changes to a cubic cell at around 750° C; this temperature can be reduced to 350 °C by doping at the Zr site with Ce, leading to an increase in conductivity.24 Stabilisation of the cubic cell at room temperature (c-LLZO) requires a reduction of the lithium content, often using Al or Ga substitution at the Li site.16,25,26 Dopants at the Zr site (e.g. Nb, Ta27,28) also can stabilise c-LLZO.
Although c-LLZO has been reported with conductivities >10−4 S cm−1, these often require complex methodologies and/or equipment, such as field assisted sintering, which presents a barrier to commercial scalability.16,29,30 Consequently, the majority of c-LLZO doping strategies lead to conductivities ∼10−4 S cm−1, or lower, and are suboptimal compared with current LIB liquid electrolytes.31–38 Therefore, it is of interest to investigate alternative doping strategies of other lithium garnet systems, such as Li5La3Nb2O12 (LLNO). This system was the first to show fast Li-ion conductivity, and outside of detailed examinations of the lithium migration pathways, has now been superseded by research on c-LLZO.39,40 However, of the prior reports of doping into the LLNO system, many show room temperature conductivities of ∼10−4 S cm−1 and are thus similar to c-LLZO.13,41 Therefore, further doping studies on the LLNO system are warranted. Herein we report an examination of Pr doping in this system. Pr was chosen because of its ability to adopt different oxidation states (3+, 4+), and so potential, based on size considerations, to dope onto either the Nb or the La site according to the following formula Li5+xLa3Nb2−xPrxO12 (Pr4+) and Li5La3−xPrxNb2O12 (Pr3+). We confirm this ambi-site substitutional ability of Pr, and illustrate in particular that Pr doping on the Nb site leads to samples with high Li ion conductivity.
Methods
Synthesis
Li5+xLa3Nb2−xPrxO12 garnets were prepared via the solid-state route from stochiometric quantities of Li2CO3, La2O3, Nb2O5 and Pr6O11 under air. A 40% mol excess of lithium was added to compensate for lithium loss during high temperature sintering. All powders were ball milled for 1 h (500 rpm) and heated to 950 °C (16 hours). Impure phases (x > 0.25) were subsequently ball milled with a 20% lithium mol excess and heated to 950 °C (12 hours). Samples where x ≥ 0.8 were synthesised in a dry room with a dewpoint between −45 °C to −64 °C (the elimination of humidity was found to be necessary to prepare good quality samples for these high Pr contents: it is known that moisture can be an issue in the synthesis of Li garnet systems).42–44Li5La3−xPrxNb2O12 was also prepared via the solid-state route in either air or 5%H2/N2. Samples were heated to 950 °C for 16 hours, cooled to room temperature and reheated to 950 °C for 16 hours. After synthesis, all samples were stored in an argon glove box.
Characterisation
Samples were characterised by X-ray diffraction (XRD) using a Bruker D8 diffractometer with Cu Kα radiation. Cell parameters were determined from Rietveld refinement using GSAS II software.45 In order to evaluate the Pr oxidation states X-ray absorption near edge spectroscopy (XANES) data were recorded at Diamond Light Source on beamline B18 and data interpreted via the Athena/Artemis software.46 Scanning electron microscopy (SEM) was performed using a TM4000plus SEM, with elemental compositions evaluated by the corresponding AZtecOne EDX attachment. The Pr–LLNO garnet powders were placed on carbon tape, attached to the SEM stub and evaluated at 15 kV in back scattered electron mode.Impedance spectroscopy
Pellets for conductivity measurements were prepared as follows: 10 mm diameter pellets were uniaxially hot pressed with an atlas heating platen to ca. 3 tonnes at 300 °C and, subsequently, heated to 1000–1050 °C for 12 hours under dry N2 to densify the SSE membrane. During N2 treatment sacrificial powders were used to protect pellets from Li loss and to prevent Al contamination from the Al2O3 crucible. Pellets were then polished, painted with gold electrodes and heated to 800 °C for 1 hour in air to cure the Au paste. The pellets were then quenched from 700 °C to limit any H+/Li+ on cooling, as has been shown to occur for garnet samples at lower temperatures in air.26,47 A.C. impedance spectroscopy data were collected during heating over a temperature range of 50 °C to 250 °C (with 16 measurements taken), using a Hewlett Packard 4192A instrument. Data for the most conductive phases (∼10−4 S cm−1) were also measured at room temperature. All measurements were conducted in air.Results and discussion
Praseodymium doping on the Nb Site: Li5+xLa3Nb2−xPrxO12
The powder XRD patterns for Li5+xLa3Nb2−xPrxO12 (0 ≤ x ≥ 1) are shown in Fig. 1, illustrating pure garnet samples across the range. All patterns could be indexed based on a cubic garnet with space group Ia![[3 with combining macron]](https://www.rsc.org/images/entities/char_0033_0304.gif) d (no. 230).22,39,40 Phases where x > 0.25 initially demonstrated Pr2O3 and La2O3 impurity phases which were overcome by addition of 20% excess lithium and reheating. Phases where x > 0.8 showed decreased conductivity (see later), hence the synthesis method was not undertaken past x = 1. The colour of the samples became increasingly yellow as a function of Pr content, which is attributed to the presence of Pr4+, which is commonly believed to be responsible for the colour in the yellow pigment Pr–ZrSiO4 (although some debate persists behind the chemistry of Pr–ZrSiO4).48–50
d (no. 230).22,39,40 Phases where x > 0.25 initially demonstrated Pr2O3 and La2O3 impurity phases which were overcome by addition of 20% excess lithium and reheating. Phases where x > 0.8 showed decreased conductivity (see later), hence the synthesis method was not undertaken past x = 1. The colour of the samples became increasingly yellow as a function of Pr content, which is attributed to the presence of Pr4+, which is commonly believed to be responsible for the colour in the yellow pigment Pr–ZrSiO4 (although some debate persists behind the chemistry of Pr–ZrSiO4).48–50
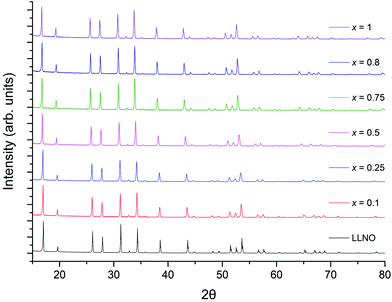 | ||
| Fig. 1 Powder XRD patterns for Li5+xLa3Nb2−xPrxO12 (0 ≤ x ≥ 1) synthesised in air, showing the formation of single phase garnet samples across the range. | ||
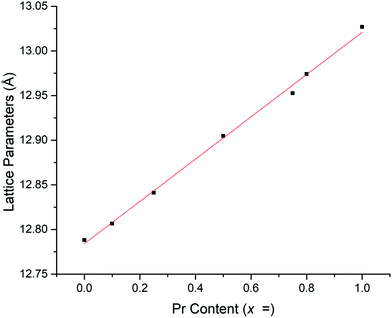
Rietveld refinements, based on the structural model from Cussen39 showed a linear increase in lattice parameters with increasing Pr content (Fig. 2 and Table 1), in agreement with Vegard's law and so confirming the solid solution range. This increase is due to the larger ionic radius of Pr4+ compared to Nb5+.39,41,51 The refined Pr occupancies on the Nb site were similar to the expected stoichiometric ratio across the series, however, did deviate slightly from the ideal ratio as the Pr content increased, see Table 1.
| Hot pressed samples | Pellet density (g cm−1) | Refined density (g cm−1) | Relative density (%) | Lattice parameters (Å) | Pr fractional site occupancies on the Nb site | Conductivity (50 °C) (S cm−1) | Activation energy (eV) |
|---|---|---|---|---|---|---|---|
| LLNO reference39 | — | 5.259 | — | 12.79432 | ∼ × 10−6 | ||
| LLNO | 4.52 | 5.248 | 86 | 12.7880(3) | 4.3 × 10⁻⁶ | 0.32 | |
| x = 0.1 | 4.32 | 5.284 | 82 | 12.8066(3) | 0.0649 | 5.6 × 10⁻⁵ | 0.28 |
| x = 0.25 | 4.50 | 5.300 | 85 | 12.8410(4) | 0.1265 | 7.3 × 10⁻⁵ | 0.32 |
| x = 0.5 | 4.33 | 5.321 | 81 | 12.9048(3) | 0.2568 | 1.6 × 10⁻⁴ | 0.29 |
| x = 0.75 | 4.72 | 5.361 | 88 | 12.9527(3) | 0.3876 | 3.4 × 10⁻⁴ | 0.37 |
| x = 0.8 | 4.53 | 5.358 | 85 | 12.9741(5) | 0.4179 | 5.6 × 10⁻⁴ | 0.36 |
| x = 1 | 3.50 | 5.366 | 65 | 13.0269(4) | 0.5160 | 1.9 × 10⁻⁴ | — |
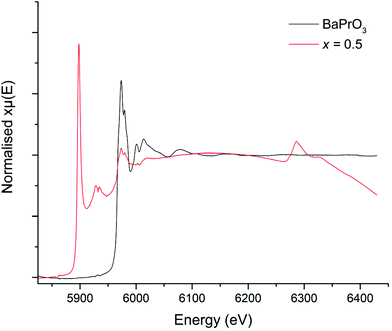
In order to try to confirm the Pr oxidation state, X-ray absorption near edge spectroscopy (XANES) data were collected for the Li5+xLa3Nb2−xPrxO12 systems. However, the La L2 edge of La (∼5897 eV) interfered with the Pr L3 edge (∼5968 eV) to some degree. Nevertheless, when compared to the Pr3+ and Pr4+ reference (Pr2O3 and BaPrO3 respectively), the peaks are qualitatively characteristic of Pr4+, see Fig. 3. These data show a peak at 5973 eV with a shoulder at 5980 eV, which closely matches the Pr4+ (BaPrO3) reference (Fig. 3) and can be assigned to Pr4+. Further support for the assignment of Pr4+ in the Li5.5La3Nb1.5Pr0.5O12 samples is provided by comparison with Pr0.5Ce0.5O2, a Pr4+ reference used elsewhere,52,53 which shows peaks at 5970 and 5980 eV.
Therefore, considering the XRD, XANES and refinement data, there is compelling evidence that Pr4+ has been doped into the LLNO structure at the Nb site (16a).
SEM and EDX
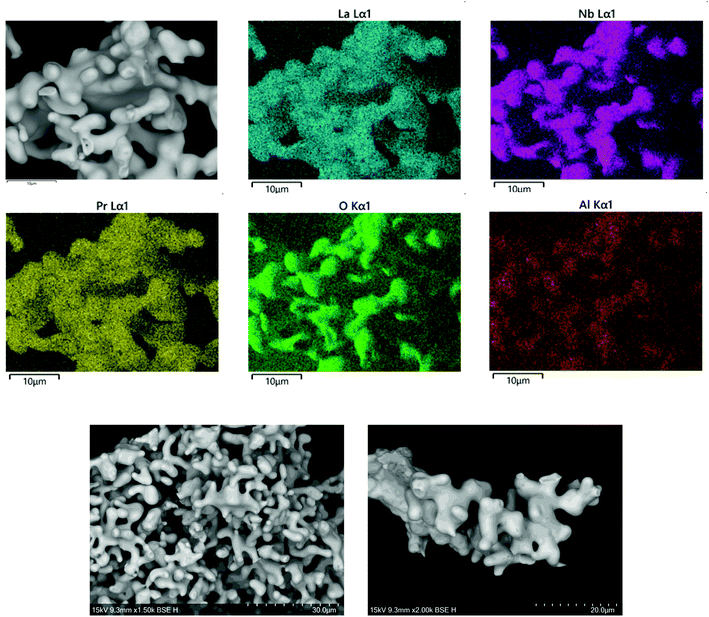
SEM and EDX on a singular grain of Li5.5La3Nb1.5Pr0.5O12 demonstrated uniform Pr presence (in the expected stoichiometric ratio) when compared to La, Nb and O. However, for Pr (x) contents ≥0.5 Al contamination from the Al2O3 crucible became increasingly apparent25 (Fig. 4).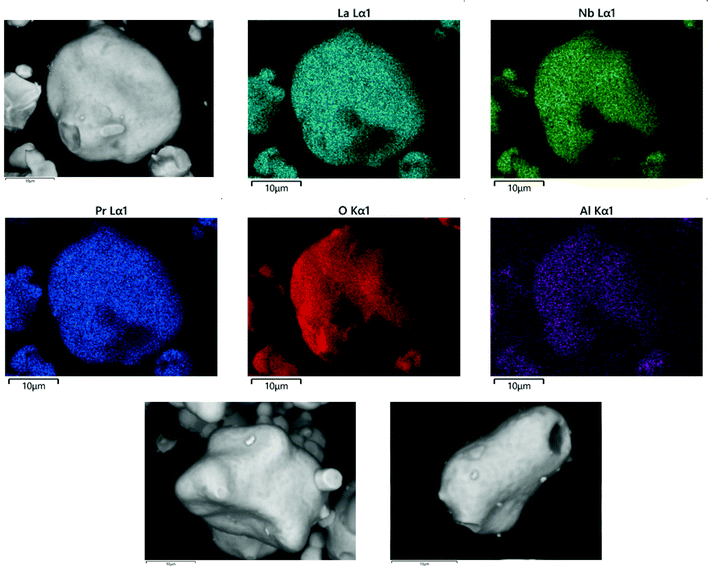 | ||
| Fig. 4 SEM image and EDX map of elemental distribution in Li5.5La3Nb1.5Pr0.5O12. Scale bar at 10 μm in all images. | ||
Praseodymium doping on the La site (Pr3+): Li5La3−xPrxNb2O12
The successful synthesis of Li5La3−xPrxNb2O12 garnets in air was limited to samples in the range 0 ≤ x ≤ 1. In contrast synthesis under 5%H2/N2 permitted a complete solid solution range for the replacement of La with Pr, 0 ≤ x ≤ 3. Both XRD patterns for air prepared samples (0 ≤ x ≤ 1) and 5%H2 prepared samples (0 ≤ x ≤ 3) could be indexed on a cubic garnet cell with space group Ia![[3 with combining macron]](https://www.rsc.org/images/entities/char_0033_0304.gif) d (no. 230);22,39,40 see Fig. 5 and 8 respectively. In some cases, particularly for the air-based synthesis, a small amount of Li3NbO4 impurity was observed marked in the respective figures (also see ESI†).
d (no. 230);22,39,40 see Fig. 5 and 8 respectively. In some cases, particularly for the air-based synthesis, a small amount of Li3NbO4 impurity was observed marked in the respective figures (also see ESI†).
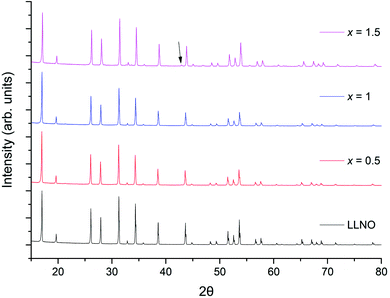 | ||
| Fig. 5 The powder XRD patterns for Li5La3−xPrxNb2O12 (0 ≤ x ≤ 1.5) synthesised in air. Phase pure samples are shown up to x = 1, but all show garnet type symmetry. Li3NbO4 impurity marked by arrow. See ESI† for expanded XRD pattern. | ||
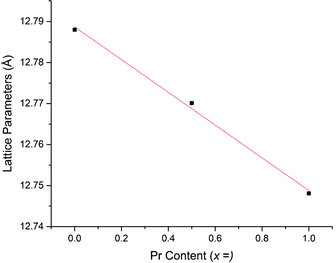
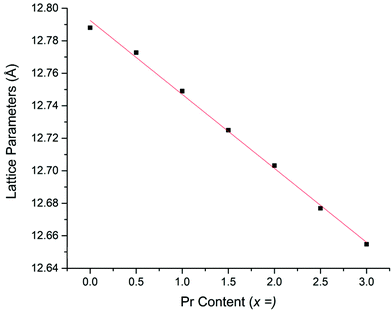
Li5La3−xPrxNb2O12 samples prepared in air demonstrated an increasingly straw yellow/brown colour, which was distinctly different from the colour of the Li5+xLa3Nb2−xPrxO12 samples discussed earlier. Cell parameters determined from Rietveld refinement indicated the expected decrease with increasing Pr content (due to the smaller size of Pr3+versus La3+) (Fig. 6) and were similar to the results for equivalent Li5La3−xPrxNb2O12 phases synthesised under 5%H2 (discussed below). The presence of the Li3NbO4 impurity in the air synthesised samples may suggest Nb site vacancies in the LLNO structure which have been filled by Pr4+, which could account for the yellow powder colour. It could also be the case the Pr4+ is located on the La site. Therefore, these data suggest that there may be some partitioning of the Pr over both sites however, more work is needed to confirm whether this is so and to what extent.
In order to confirm the oxidation state of Pr in these samples, XANES data were collected on both x = 0.5 and 1, however, as outlined previously, in all cases the La L2 edge interfered somewhat with the Pr L3 edge. Nevertheless, the XANES spectra of the Li5La2.5Pr0.5Nb2O12 phase, which was prepared in air, does demonstrate characteristics of the Pr4+ reference (which would be consistent with presence of Pr4+ on either the Nb or La site), such as the peak broadness and the shoulder noted at 5982 eV, however the main peak appears to be positioned in line with the Pr2O3 reference at 5969 eV, consistent with mainly La site substitution, see Fig. 7a. However, the XANES spectra of the higher Pr content phase, Li5La2Pr1Nb2O12, possesses only an absorption peak which is consistent with the Pr3+ reference at 5970 eV, Fig. 7b. Therefore, these spectra are somewhat contradictory but indicate, potentially, the presence of Pr in different oxidation states for x = 0.5, but not when x = 1 where only Pr3+ is seen.
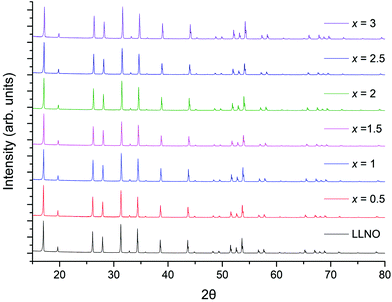 | ||
| Fig. 8 The powder XRD patterns of Li5La3−xPrxNb2O12 (0 ≤ x ≤ 3) prepared in a reducing atmosphere (5%H2). Phase pure samples with garnet type symmetry were obtained for all. For the small Li3NbO3 impurity see ESI† for expanded XRD pattern. | ||
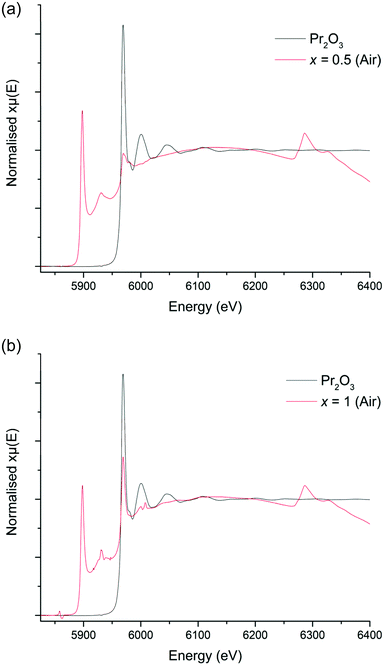
The colours of the 5%H2 synthesised garnets were increasingly vibrant green as the Pr content was increased, which indicates the presence of Pr3+. Cell parameters determined from Rietveld refinement show a linear decrease with increasing Pr content, consistent with the smaller ionic radius of Pr3+ compared to La3+, see Fig. 9. Despite the interference from the La L2 edge, the XANES data for these garnets are somewhat clearer than those derived from the Li5+xLa3Nb2−xPrxO12 phases (Fig. 10a and b). The 5%H2 prepared samples show a clear correlation with the Pr3+ reference (Pr2O3) in terms of peak intensity and characteristics, in both x = 0.5 and 1. Each phase has a strong absorption peak noted at 5970 eV, characteristic of Pr3+, which matches both the Pr2O3 reference and other Pr3+ references used elsewhere.52 When the Pr content is increased to x = 1, only increased absorbance occurs, as expected, but the peak characteristics remain unchanged. Hence, the characterisation data support the conclusion that only Pr3+ is present, and the different characteristics of the x = 0.5 phase prepared in air are unique to the synthesis method, as seen in the XANES data.
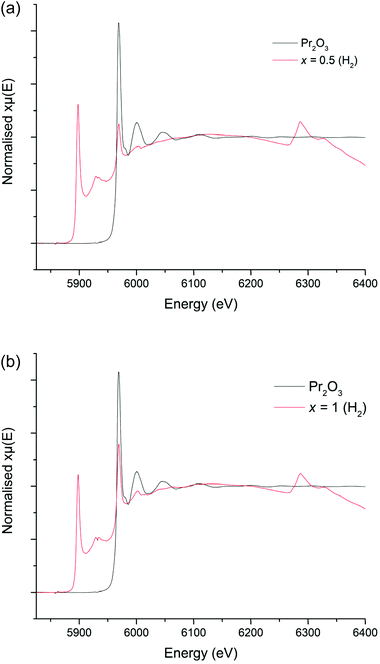 | ||
| Fig. 10 (a) XANES spectra for Li5La2.5Pr0.5Nb2O12 (5%H2) compared to the Pr2O3 (Pr3+) reference. (b) XANES spectrum for Li5La2Pr1Nb2O12 (5%H2) compared to the Pr2O3 (Pr3+) reference. | ||
The XANES and XRD data for the H2 synthesised samples therefore support the conclusion that Pr3+ has successfully been doped into the LLNO structure at the La site (24c).
SEM and EDX
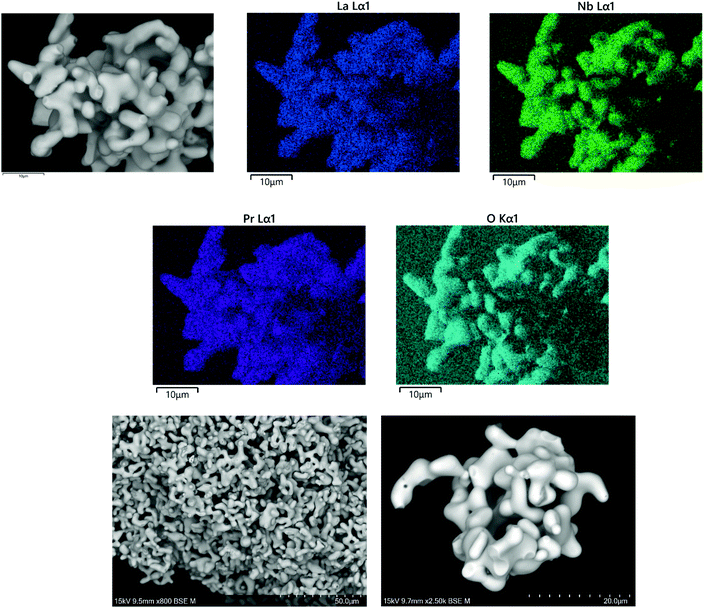
SEM/EDX data for Li5La3−xPrxNb2O12 garnets, synthesised in air or H2, showed uniform elemental distribution throughout the analysed grains, and have similar grain characteristics, see Fig. 11 and 12 respectively. The data for both air and H2 synthesised samples demonstrated Pr and La present in the expected ratio. Hence EDX data supports the stoichiometric incorporation. However, the air synthesised samples did show some aluminium contamination, see Fig. 11, attributed to a reaction with the Al2O3 crucible.Conductivity data for Nb site substitution: Li5+xLa3Nb2−xPrxO12
Lithium ion conductivity was evaluated via impedance spectroscopy (a typical Nyquist impedance plot is shown in Fig. 13). A single non ideal semicircle was observed. A resistor, R1, in parallel with a constant phase element, CPE1, were used to fit the semicircle, and an inductor, L1, in series with R1/CPE1 was used to account for the inductance effect due to the limitations of the HP impedance spectroscopy equipment.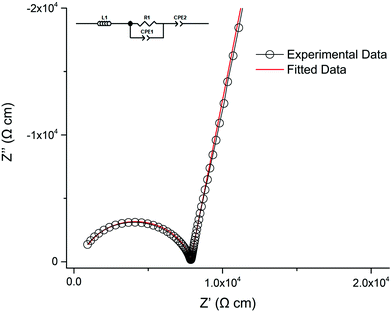 | ||
| Fig. 13 Nyquist impedance plot for Li5.75La3Nb1.25Pr0.75O12 at 30 °C which was fit the equivalent circuit in the top left. | ||
A characteristic spike relative to the semi-circle is present in all plots. This is attributed to a sample – electrode double layer effect. This spike represents the Li-ion transfer resistance between the garnet electrolyte and the Au electrode and corresponds to the capacitive behaviour of the gold electrodes which block Li-ion diffusion. As the semi-circle and tail were obtained in high and low frequency regions respectively it can be considered that conduction is primarily ionic in nature.31
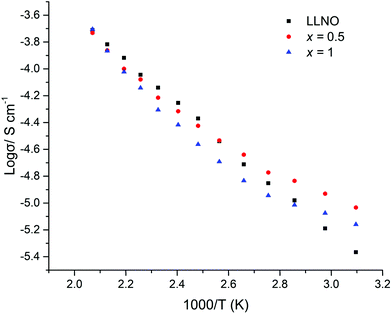
The ionic conductivity of the Li5+xLa3Nb2−xPrxO12 samples increased in line with increased Pr and hence lithium content (Fig. 14). The highest ionic conductivity of 5.6 × 10⁻⁴ S cm−1 at 50 °C was observed for x = 0.8, with a measured conductivity of 4.1 × 10⁻⁴ S cm−1 at 21 °C. See Table 1 and Fig. 14. These conductivity values represent some of the highest ever reported for garnets with Li content <6 per formula unit.
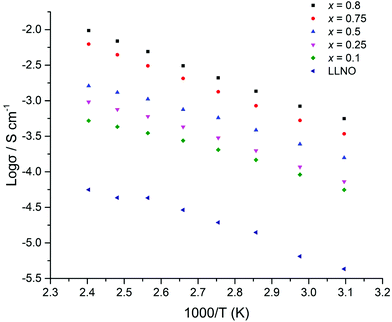 | ||
| Fig. 14 Arrhenius plots for Li5+xLa3Nb2−xPrxO12 (x = 0.1–0.8) samples which were hot pressed prior to sintering under N2. | ||
Higher content Pr phases (x > 0.75) were, however, prone to degradation during the high temperature densification treatment under N2, resulting in small Pr2O3, La2O3 and PrNb5O14 impurities. In particular the XRD patterns for the x = 1 sample after N2 sintering showed a more severe phase degradation. This degradation most likely accounts for the low relative pellet density of this sample and the resultant lower conductivity associated with this phase, as well as the non-linear temperature dependence of the Arrhenius plot, see Table 1 and ESI.† Consequently, further studies of samples with higher Pr contents, x > 1, were not performed (see ESI† for comparative XRD patterns before and after sintering treatments).
The activation energies for all samples (Fig. 14) ranged between 0.24–0.38 eV, which are similar to reports for other garnets, see Table 1.51,54
Conductivity data for La site substitution: Li5La3−xPrxNb2O12
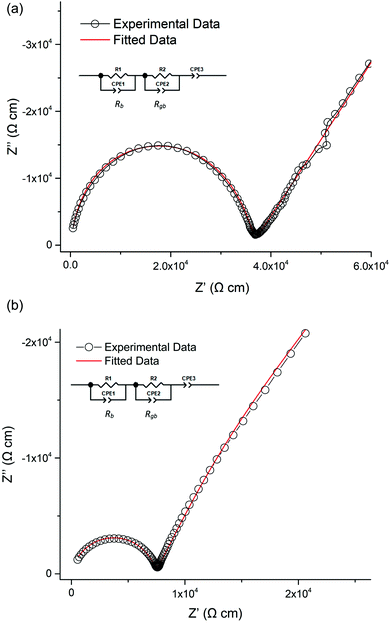
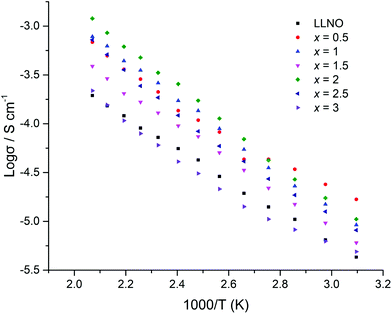
All samples where Pr was doped on the La site showed similar conductivities to LLNO consistent with no change in Li content for this series. A typical Nyquist plot is displayed in Fig. 15a and b for air-based and H2 synthesis respectively. These plots were fitted to two R/CPE components, representative of overlapping bulk and grain boundary resistance.It was noted earlier that in the air synthesis samples, there may be some small level of Pr4+ substitution on the Nb site, which would be expected to give a small increase in Li content and hence conductivity. This was not observed, however these pellets proved difficult to densify, hence present with much lower relative densities than the corresponding undoped LLNO pellet. The influence of the poorer sintering may therefore mask any increase in conductivity from any Nb site substitution. Activation energies are similar to other reported garnets, see Table 2 and Fig. 16.51,54
| Sample | Pellet density (g cm−1) | Refined density (g cm−1) | Relative density (%) | Lattice parameters (Å) | Conductivity at 50 °C (S cm−1) | Activation energy 50–210 °C (eV) |
|---|---|---|---|---|---|---|
| LLNO | 4.52 | 5.248 | 86 | 12.7880(3) | 4.3 × 10⁻⁶ | 0.32 |
| x = 0.5 | 3.08 | 5.289 | 58 | 12.7701(3) | 9.3 × 10⁻⁶ | 0.25 |
| x = 1 | 3.21 | 5.317 | 60 | 12.7481(3) | 6.9 × 10⁻⁶ | 0.28 |
The H2 synthesised samples showed similar conductivities for all samples, with a small peak in the conductivity of the series (1.7 × 10⁻⁵ S cm−1 (50 °C)) for x = 0.5, see Fig. 17 for Arrhenius plots. Activation energies fall within the 0.3–0.4 eV range, hence are similar to reports for other garnets, see Table 3.51,54
| Sample | Pellet density (g cm−1) | Refined density (g cm−1) | Relative density (%) | Lattice parameters (Å) | Conductivity at 50 °C (S cm−1) | Activation energy 50–210 °C (eV) |
|---|---|---|---|---|---|---|
| LLNO reference39 | 5.259 | — | 12.79432 | ∼ × 10−6 | ||
| LLNO synthesized | 4.52 | 5.248 | 86 | 12.7880(3) | 4.3 × 10⁻⁶ | 0.32 |
| x = 0.5 | 3.87 | 5.286 | 73 | 12.7727(3) | 1.7 × 10⁻⁵ | 0.31 |
| x = 1 | 3.40 | 5.316 | 64 | 12.7490(2) | 9.2 × 10⁻⁶ | 0.38 |
| x = 1.5 | 3.47 | 5.346 | 65 | 12.7250(5) | 6.0 × 10⁻⁶ | 0.35 |
| x = 2 | 3.91 | 5.373 | 73 | 12.7032(3) | 1.1 × 10⁻⁵ | 0.40 |
| x = 2.5 | 3.72 | 5.407 | 69 | 12.6769(3) | 8.1 × 10⁻⁶ | 0.38 |
| x = 3 | 4.01 | 5.435 | 74 | 12.6548(5) | 4.9 × 10⁻⁶ | 0.32 |
Samples with Pr doping at the La site showed far lower densities than the samples with Pr doping on the Nb site (see Tables 1–3). Hence Pr doping on the Nb site appears to also enhance the sintering compared to Pr doping on the La site, which may be related to the higher lithium content in these Li5+xLa3Nb2−xPrxO12 systems.
Conclusions
In summary, we have shown for the first time a dopant (Pr) that can be substituted onto both the La and Nb site in Li5La3Nb2O12. Furthermore, the oxidation state of the Pr is dictated by the site substitution; +3 on the La site, and +4 on the Nb site. Due to the resultant increase in Li content for Nb site substitution, a significant increase in conductivity is observed. These Li5+xLa3Nb2−xPrxO12 samples show some of the highest conductivities for garnets with Li contents less than 6, with values up to 0.56 mS cm−1 (at 50 °C) for x = 0.8. A final point of note, Pr doped phases at the Nb site (x ≤ 0.25) were a vibrant yellow, with a vibrant green colour obtained from H2 based synthesis of Li5+xLa3Nb2−xPrxO12 garnets when x ≥ 2.5. Hence the optical properties of these garnets may merit further investigation, especially with respect to potential interest as pigments (see ESI†), however the effect of moisture on the Pr oxidation states, and therefore the sample colour, requires further investigation. It may also be of interest to study the optical properties of these Pr garnets under U.V. light.Conflicts of interest
There are no conflicts of interest to declare.Acknowledgements
We would like to thank the University of Birmingham for the studentship funding of Mark Stockham and the EPSRC for funding the GENESIS project (under EP/R024006/1). We thank the Diamond Light Source for the award of beam time as part of the Energy Materials Block Allocation Group SP14239. We would also like to thank Prof. Emma Kendrick for the continued use of the dry room facilities. Raw experimental data can be found at: https://doi.org/10.25500/edata.bham.00000490.References
- C.-X. Zu and H. Li, Energy Environ. Sci., 2011, 4, 2614–2624 RSC.
- Y. Zhu, X. He and Y. Mo, ACS Appl. Mater. Interfaces, 2015, 7, 23685–23693 CrossRef CAS PubMed.
- V. A. Agubra and J. W. Fergus, J. Power Sources, 2014, 268, 153–162 CrossRef CAS.
- M. Armand and J. M. Tarascon, Nature, 2008, 451, 652 CrossRef CAS PubMed.
- N. Nitta, F. Wu, J. T. Lee and G. Yushin, Mater. Today, 2015, 18, 252–264 CrossRef CAS.
- M. Winter and R. J. Brodd, Chem. Rev., 2004, 104, 4245–4270 CrossRef CAS PubMed.
- J. M. Tarascon and M. Armand, Nature, 2001, 414, 359 CrossRef CAS PubMed.
- J. Li, C. Ma, M. Chi, C. Liang and N. J. Dudney, Adv. Energy Mater., 2015, 5, 1401408 CrossRef.
- Q. Liu, Z. Geng, C. Han, Y. Fu, S. Li, Y.-B. He, F. Kang and B. Li, J. Power Sources, 2018, 389, 120–134 CrossRef CAS.
- A. C. Luntz, J. Voss and K. Reuter, J. Phys. Chem. Lett., 2015, 6, 4599–4604 CrossRef CAS PubMed.
- K. Fu, Y. Gong, B. Liu, Y. Zhu, S. Xu, Y. Yao, W. Luo, C. Wang, S. Lacey, J. Dai, Y. Chen, Y. Mo, E. Wachsman and L. Hu, Sci. Adv., 2017, 3, e1601659 CrossRef PubMed.
- Y. Kato, S. Hori, T. Saito, K. Suzuki, M. Hirayama, A. Mitsui, M. Yonemura, H. Iba and R. Kanno, Nat. Energy, 2016, 1, 16030 CrossRef CAS.
- V. Thangadurai, S. Narayanan and D. Pinzaru, Chem. Soc. Rev., 2014, 43, 4714–4727 RSC.
- W. D. Richards, L. J. Miara, Y. Wang, J. C. Kim and G. Ceder, Chem. Mater., 2016, 28, 266–273 CrossRef CAS.
- B. Dong, R. Jarkaneh, S. Hull, N. Reeves-McLaren, J. J. Biendicho and A. R. West, J. Mater. Chem. A, 2016, 4, 1408–1413 RSC.
- C. Bernuy-Lopez, W. Manalastas, J. M. Lopez del Amo, A. Aguadero, F. Aguesse and J. A. Kilner, Chem. Mater., 2014, 26, 3610–3617 CrossRef CAS.
- H. Buschmann, J. Dölle, S. Berendts, A. Kuhn, P. Bottke, M. Wilkening, P. Heitjans, A. Senyshyn, H. Ehrenberg, A. Lotnyk, V. Duppel, L. Kienle and J. Janek, Phys. Chem. Chem. Phys., 2011, 13, 19378–19392 RSC.
- S. Ohta, T. Kobayashi and T. Asaoka, J. Power Sources, 2011, 196, 3342–3345 CrossRef CAS.
- T. Thompson, S. Yu, L. Williams, R. D. Schmidt, R. Garcia-Mendez, J. Wolfenstine, J. L. Allen, E. Kioupakis, D. J. Siegel and J. Sakamoto, ACS Energy Lett., 2017, 2, 462–468 CrossRef CAS.
- A. F. Wells, Structural inorganic chemistry, Clarendon Press, 1984 Search PubMed.
- E. J. Cussen and T. W. S. Yip, J. Solid State Chem., 2007, 180, 1832–1839 CrossRef CAS.
- D. Mazza, Mater. Lett., 1988, 7, 205–207 CrossRef CAS.
- J. Han, J. Zhu, Y. Li, X. Yu, S. Wang, G. Wu, H. Xie, S. C. Vogel, F. Izumi, K. Momma, Y. Kawamura, Y. Huang, J. B. Goodenough and Y. Zhao, Chem. Commun., 2012, 48, 9840–9842 RSC.
- B. Dong, S. R. Yeandel, P. Goddard and P. R. Slater, Chem. Mater., 2020, 32, 215–223 CrossRef CAS.
- C. A. Geiger, E. Alekseev, B. Lazic, M. Fisch, T. Armbruster, R. Langner, M. Fechtelkord, N. Kim, T. Pettke and W. Weppner, Inorg. Chem., 2011, 50, 1089–1097 CrossRef CAS PubMed.
- M. A. Howard, O. Clemens, E. Kendrick, K. S. Knight, D. C. Apperley, P. A. Anderson and P. R. Slater, Dalton Trans., 2012, 41, 12048–12053 RSC.
- S. Mukhopadhyay, T. Thompson, J. Sakamoto, A. Huq, J. Wolfenstine, J. L. Allen, N. Bernstein, D. A. Stewart and M. D. Johannes, Chem. Mater., 2015, 27, 3658–3665 CrossRef CAS.
- J. L. Allen, J. Wolfenstine, E. Rangasamy and J. Sakamoto, J. Power Sources, 2012, 206, 315–319 CrossRef CAS.
- S.-W. Baek, J.-M. Lee, T. Y. Kim, M.-S. Song and Y. Park, J. Power Sources, 2014, 249, 197–206 CrossRef CAS.
- M. Botros, R. Djenadic, O. Clemens, M. Möller and H. Hahn, J. Power Sources, 2016, 309, 108–115 CrossRef CAS.
- R. Murugan, V. Thangadurai and W. Weppner, Angew. Chem., Int. Ed., 2007, 46, 7778–7781 CrossRef CAS PubMed.
- R. H. Brugge, J. A. Kilner and A. Aguadero, Solid State Ionics, 2019, 337, 154–160 CrossRef CAS.
- Y. Jin and P. J. McGinn, J. Power Sources, 2011, 196, 8683–8687 CrossRef CAS.
- S. Kim, M. Hirayama, S. Taminato and R. Kanno, Dalton Trans., 2013, 42, 13112–13117 RSC.
- C. Loho, R. Djenadic, M. Bruns, O. Clemens and H. Hahn, J. Electrochem. Soc., 2017, 164, A6131–A6139 CrossRef CAS.
- S. Lobe, C. Dellen, M. Finsterbusch, H. G. Gehrke, D. Sebold, C. L. Tsai, S. Uhlenbruck and O. Guillon, J. Power Sources, 2016, 307, 684–689 CrossRef CAS.
- C.-W. Ahn, J.-J. Choi, J. Ryu, B.-D. Hahn, J.-W. Kim, W.-H. Yoon, J.-H. Choi and D.-S. Park, J. Electrochem. Soc., 2015, 162, A60–A63 CrossRef CAS.
- B. Dong, L. L. Driscoll, M. P. Stockham, E. Kendrick and P. R. Slater, Solid State Ionics, 2020, 350, 115317 CrossRef CAS.
- E. J. Cussen, Chem. Commun., 2006, 412–413, 10.1039/B514640B.
- V. Thangadurai, H. Kaack and W. J. F. Weppner, J. Am. Ceram. Soc., 2004, 86, 437–440 CrossRef.
- S. Narayanan, F. Ramezanipour and V. Thangadurai, J. Phys. Chem. C, 2012, 116, 20154–20162 CrossRef CAS.
- R. H. Brugge, A. K. O. Hekselman, A. Cavallaro, F. M. Pesci, R. J. Chater, J. A. Kilner and A. Aguadero, Chem. Mater., 2018, 30, 3704–3713 CrossRef CAS.
- G. Larraz, A. Orera and M. L. Sanjuán, J. Mater. Chem. A, 2013, 1, 11419–11428 RSC.
- C. Galven, J. Dittmer, E. Suard, F. Le Berre and M.-P. Crosnier-Lopez, Chem. Mater., 2012, 24, 3335–3345 CrossRef CAS.
- B. Toby and R. Dreele, J. Appl. Crystallogr., 2013, 46, 544–549 CrossRef CAS.
- B. Ravel and M. Newville, J. Synchrotron Radiat., 2005, 12, 537–541 CrossRef CAS PubMed.
- J. Percival, D. Apperley and P. R. Slater, Solid State Ion., 2008, 179, 1693–1696 CrossRef CAS.
- J. A. Badenes, J. B. Vicent, M. Llusar, M. A. Tena and G. Monr, J. Mater. Sci., 2002, 37, 1413–1420 CrossRef CAS.
- G. Del Nero, G. Cappelletti, S. Ardizzone, P. Fermo and S. Gilardoni, J. Eur. Ceram. Soc., 2004, 24, 3603–3611 CrossRef CAS.
- M. Shoyama, H. Nasu and K. Kamiya, Preparation of Rare Earth-Zircon Pigments by the Sol-Gel Method, 1998 Search PubMed.
- S. Ramakumar, C. Deviannapoorani, L. Dhivya, L. S. Shankar and R. Murugan, Prog. Mater. Sci., 2017, 88, 325–411 CrossRef CAS.
- T. Ogier, C. Prestipino, S. Figueroa, F. Mauvy, J. Mougin, J. C. Grenier, A. Demourgues and J. M. Bassat, Chem. Phys. Lett., 2019, 727, 116–120 CrossRef CAS.
- R. C. Karnatak, J. M. Esteva, H. Dexpert, M. Gasgnier, P. E. Caro and L. Albert, Phys. Rev. B: Condens. Matter Mater. Phys., 1987, 36, 1745–1749 CrossRef CAS PubMed.
- J.-F. Wu, E.-Y. Chen, Y. Yu, L. Liu, Y. Wu, W. K. Pang, V. K. Peterson and X. Guo, ACS Appl. Mater. Interfaces, 2017, 9, 1542–1552 CrossRef CAS PubMed.
Footnote |
| † Electronic supplementary information (ESI) available. See DOI: 10.1039/d0dt01497d |
| This journal is © The Royal Society of Chemistry 2020 |

