 Open Access Article
Creative Commons Attribution 3.0 Unported Licence
Exchange couplings and quantum phases in two dissimilar arrays of similar copper dinuclear units†
Rosana P.
Sartoris
 *a,
Vinicius T.
Santana
 b,
Eleonora
Freire
cd,
Ricardo F.
Baggio
c,
Otaciro R.
Nascimento
 e and
Rafael
Calvo
 *af
*af
aDepartamento de Física, Facultad de Bioquímica y Ciencias Biológicas, Universidad Nacional del Litoral, Ciudad Universitaria, 3000, Santa Fe, Argentina. E-mail: sartoris@fbcb.unl.edu.ar
bCEITEC - Central European Institute of Technology, Brno University of Technology, Purkyňova 123, 61200, Brno, Czech Republic
cGerencia de Investigación y Aplicaciones, Centro Atómico Constituyentes, Comisión Nacional de Energía Atómica, Buenos Aires, Argentina
dEscuela de Ciencia y Tecnología, Universidad Nacional General San Martín, Buenos Aires, Argentina
eDepartamento de Física e Ciencias Interdisciplinares, Instituto de Física de São Carlos, Universidade de São Paulo - USP, CP 369, 13560-970, São Carlos, SP, Brazil
fInstituto de Física del Litoral, Consejo Nacional de Investigaciones Científicas y Técnicas, Güemes 3450, 3000, Santa Fe, Argentina. E-mail: calvo.rafael@conicet.gov.ar
First published on 2nd April 2020
Abstract
To investigate the magnetic properties and the spin entanglement of dinuclear arrays, we prepared compounds [{Cu(pAB)(phen)H2O}2·NO3·pABH·2H2O], 1, and [Cu2(pAB)2(phen)2pz]n, 2 (pABH = p-aminobenzoic acid, phen = 1,10-phenanthroline and pz = pyrazine). The structure of 1 is known and we report here that of 2. They contain similar dinuclear units of CuII ions with 1/2-spins S1 and S2 bridged by pairs of pAB molecules, with similar intradinuclear exchange  and fine interactions
  , but different 3D crystal arrays with weak interdinuclear exchange J′, stronger in 2 than in 1. To investigate the magnetic properties and the spin entanglement produced by J′, we collected the powder spectra of 1 and 2 at 9.4 GHz and T between 5 and 298 K, and at 34.4 GHz and T = 298 K and single-crystal spectra at room T and 34.4 GHz as a function of magnetic field (B0) orientation in three crystal planes, calculating intradinuclear magnetic parameters J(1)0 = (−75 ± 1) cm−1, J(2)0 = (−78 ± 2) cm−1, |D(1)| = (0.142 ± 0.006) cm−1, |D(2)| = (0.141 ± 0.006) cm−1 and E(1) ∼ E(2) ∼ 0. Single crystal data indicate a quantum entangled phase in 2 around the crossing between two fine structure EPR absorption peaks within the spin triplet. This phase also shows up in powder samples of 2 as a U-peak collecting the signals of the entangled microcrystals, a feature that allows estimating |J′|. Transitions between the two quantum phases are observed in single crystals of 2 changing the orientation of B0. We estimate interdinuclear exchange couplings |J′(1)| < 0.003 cm−1 and |J′(2)| = (0.013 ± 0.005) cm−1, in 1 and 2, respectively. Our analysis indicates that the standard approximation of a spin Hamiltonian with S = 1 for the dinuclear spectra is valid only when the interdinuclear coupling is large enough, as for compound 2 (|J′(2)/J(2)0| ∼ 1.7 × 10⁻⁴). When J′ is negligible as in 1, the real spin Hamiltonian with two spins 1/2 has to be used. Broken-symmetry DFT predicts correctly the nature and magnitude of the antiferromagnetic exchange coupling in 1 and 2 and ferromagnetic interdinuclear coupling for compound 2.
1 Introduction
Great advances in dinuclear units (DUs) have been achieved since the pioneering electron paramagnetic resonance (EPR) study of Bleaney and Bowers1 on dinuclear copper acetate hydrate. A large number of dinuclear compounds having unpaired spins S1 and S2 coupled by an exchange coupling J0,2,3 | (1) |
Attention has also been paid to the effect of weak exchange interactions J′ interconnecting finite5,19,20 and infinite21–24 arrays of DUs in a molecule or a periodic structure. The periodic structures give rise to travelling spin excitation (triplons)25–27 transforming the finite quantum dinuclear units into infinite collective systems with quantum many-body effects modifying the magnetic properties and showing the fascinating properties of molecular magnets, including quantum phase transitions,28,29 Bose–Einstein condensation,27,29 quantum spin ladders30 and more.31,32
EPR played the most relevant role in the studies of individual DUs and, as well, in the studies of weak interdinuclear exchange interactions J′ in compounds having infinite21–24,33–35 arrays of DUs. Detailed single-crystal measurements show that the spin entanglement and the spin dynamics arising from J′ merge the peaks of the fine structure for the magnetic field B0 = μ0H (μ0 is the vacuum permeability) around the directions where the EPR absorptions intersect23,34,35 and collapse the hyperfine structure. Changes in the spectra of weakly coupled monomeric spins as a function of J′ were initially explained using the exchange narrowing theory36,37 and rigorously proved by classical Anderson–Kubo's general theories of magnetic resonance.38,39 In later years, experimental and theoretical investigations were done on infinite coupled-spin systems and the understanding of the exchange narrowing process evolved for monomeric spins40 and for AFM DUs,23,24,34,41 where the process is thermally activated. The purpose of this work is to study weak interdinuclear couplings through their effects on the EPR spectra. We investigate two weakly interacting arrays of DUs in compounds [{Cu(pAB)(phen)H2O}2·NO3·pABH·2H2O], 1, and [Cu2(pAB)2(phen)2pz]n, 2, where pABH = p-aminobenzoic acid, phen = 1,10-phenanthroline, pz = pyrazine, synthesizing, crystallizing, solving their crystal structures and performing EPR studies on powder and single crystal samples. Compounds 1 and 2 contain similar DUs, and thus similar intradinuclear coupling J0. However, different paths connect them, leading to different interdinuclear coupling J′ between the neighbouring DUs. Therefore, comparing the EPR results of these compounds based on their structures allows a deeper understanding of the effects of interdinuclear interactions.
We collected the EPR spectra of single crystal samples of 1 and 2 at the Q-band and room T as a function of the orientation of B0, also for powder samples at the X-band as a function of temperature T between 5 and 293 K and at the Q-band and 293 K, and used these spectra to determine the intradinuclear magnetic parameters. For orientations of B0 around the fields at which the fine structure peaks ±1 ↔ 0 cross and the energy distance between them become smaller than |J′|, the spectra change abruptly into a collapsed line reflecting the spin entanglement and allowing the estimation of interdinuclear coupling. In single-crystals, quantum phases differing in the spin entanglement can be tuned with B0; in the powder spectra, the couplings J′ give rise to an extra peak, which was reported as arising from the interdinuclear exchange by Gavrilov et al.,33 who associated this behavior with travelling triplet excitons in the crystalline lattice. Others also observed this peak in the powder spectra of polynuclear CuII compounds, suggesting the interdinuclear exchange as a potential explanation for it.42,43 Single crystal EPR measurements on chains of copper dinuclear paddlewheel units reported by Perec et al. demonstrated that this so-called “U” peak24 in powder spectra collects the signal arising from microcrystals oriented in the angular range of the collapsed line and its intensity allows estimating both |J′| and the temperature dependence of the entanglement due to the population of excited triplet states.35
The behaviors of the spectra of 1 and 2 are discussed in terms of the interdinuclear exchange couplings and the consequent spin entanglement. The magnitudes of the intra- and inter dinuclear exchange couplings J0 and J′ are related to the structures of the corresponding paths connecting the metal ions. Their experimental values for 1 and 2 are compared with the results of theoretically calculated separation between the singlet and triplet states using broken-symmetry density functional theory (BS-DFT).
2 Experimental details
2.1 Materials and preparation
All chemicals, of analytical or reagent-grade purity, were commercially available and used as received. Water was purified with a Millipore Milli-Q system, yielding a resistivity of 18 MΩ cm−1.Compound 1: we added slowly 0.75 mmol of Cu(NO3)2·5H2O to an aqueous solution (30 cm3) of pABH (0.75 mmol) and phen (0.75 mmol) while the pH was adjusted to 4 with HNO3 and NaOH. Keeping this solution at 35° for slow evaporation, green square crystals were obtained after ∼4 days.
Compound
2: pABH (1 mmol), phen (1 mmol) and pyrazine (0.5 mmol) were added to 40 ml of methanolic-acetonitrile solution (1![[thin space (1/6-em)]](https://www.rsc.org/images/entities/char_2009.gif) :
:![[thin space (1/6-em)]](https://www.rsc.org/images/entities/char_2009.gif) 1 v/v) and kept under continuous agitation at room T until full dilution, and then 1 mmol of Cu(NO3)2·5H2O was added. This solution was gravity-filtered and the filtrate kept for slow evaporation at 20°. Dark green crystals were obtained after ∼5 days.
1 v/v) and kept under continuous agitation at room T until full dilution, and then 1 mmol of Cu(NO3)2·5H2O was added. This solution was gravity-filtered and the filtrate kept for slow evaporation at 20°. Dark green crystals were obtained after ∼5 days.
2.2 Crystallographic methods
Diffraction intensities were measured with an Oxford Diffraction Gemini CCD S Ultra diffractometer. Crysalis45 was used for data collection, data reduction, and empirical absorption correction. Calculations to solve the structures, refine the models, and obtain derived results were carried out with the computer programs SHELXS-97,46 SHELXL,47 and PLATON.48 For structure graphics we used SHELXTL49 and Mercury.502.3 Electron paramagnetic resonance methods
We used a Varian EPR spectrometer working at ∼9.476 GHz (X-band) and at ∼34.28 GHz (Q-band), with a fixed amplitude of ∼0.1 mT at 100 kHz field modulation and 1 mW microwave power, values precluding overmodulation and saturation of the signal at any T. The spectrometer gain was kept constant in order to obtain comparable signal amplitudes. EPR spectra in powder samples were obtained from finely ground single crystals of 1 and 2, stored in thin glass capillary tubes. They were gathered as a function of T between 5 and 298 K at the X-band and 293 K at the Q-band. The position and amplitude of the narrow EPR signal of a CrIII![[thin space (1/6-em)]](https://www.rsc.org/images/entities/char_2009.gif) :
:![[thin space (1/6-em)]](https://www.rsc.org/images/entities/char_2009.gif) MgO spin marker (g = 1.9797) were used to calibrate B0 and to control the experimental factors affecting the signal amplitude. The CrIII impurities in MgO occupy cubic positions in the lattice. It has S = 3/2, the fine structure D-term is zero, and the fourth-order fine structure terms are very small.51 So, it is paramagnetic and its susceptibility is proportional to 1/T, at T > 1 K. Therefore, it was satisfactorily used to detect changes with temperature in the frequency and Q-factor of the microwave cavity.
MgO spin marker (g = 1.9797) were used to calibrate B0 and to control the experimental factors affecting the signal amplitude. The CrIII impurities in MgO occupy cubic positions in the lattice. It has S = 3/2, the fine structure D-term is zero, and the fourth-order fine structure terms are very small.51 So, it is paramagnetic and its susceptibility is proportional to 1/T, at T > 1 K. Therefore, it was satisfactorily used to detect changes with temperature in the frequency and Q-factor of the microwave cavity.
The crystal habit of the samples was identified with a goniometric optical microscope; the angles between crystal edges were used to orient the samples by comparing the results with crystallographic information. Cubic sample holders made by cleaving pieces of KCl single crystals were used to define laboratory orthogonal reference frames xyz to mount the samples. Specimens of 1 and 2 were glued with the bc plane parallel to the xy faces of the holders, with the b axis parallel to a holder edge. This allows obtaining the relationship between the sample holder and crystal axes mounting the holders on top of a pedestal inside the cavity with each face (xy, zx or zy) on the horizontal plane. The orientation of B0 was varied by rotating the magnet and the EPR spectra dχ′′/dB0 of single crystal samples of 1 and 2 were collected with B0 at 5° intervals (or smaller in some ranges) along 180° in the planes a*b, ca* and bc at 298 K and 34.4 GHz (a* = b × c). Single crystal and powder spectra were analyzed using EasySpin (v. 5.2.24),52 a package of programs working under Matlab53 that simulates and fits a given Hamiltonian to spectral line shapes dχ′′/dB0vs. B0 and to the angular variation of the centers of the resonances in a single crystal. Gaussian and Lorentzian lineshapes defined following Weil and Bolton54 were used to fit different situations (see discussion). In all fittings the mean square deviations between experimental and calculated values were minimized.
2.4 DFT methods
The calculations were performed using the software ORCA version 4.2.0.55 The geometries used in the calculations were extracted from X-ray diffraction data for compounds 1 and 2 and optimized using the method PBEh-3c.56 Broken-symmetry DFT (BS-DFT)57 was used to calculate the exchange coupling between metal centers. This approach has been previously applied to copper compounds and other exchange-coupled electron spin systems with reasonable agreement between theoretical and experimental parameters.16,58–60 The inter-DU exchange was calculated by substituting Cu with Zn inside a molecule and adding a symmetry-related neighboring molecule with a Cu/Zn substituted site as well. Isosurfaces of molecular orbitals and spin density were prepared using the software Chemcraft.613 Crystal structures and interdinuclear chemical paths
X-ray diffraction data obtained for compound 1 allowed us to assign it to that reported by Battaglia et al. in 1991,44 for which no further crystallographic efforts were made. Compound 2, instead, has not been reported previously and the corresponding cif file has been deposited in the CCDC (deposition number 1942943†). Table 1 provides some crystallographic data for both compounds, while Tables S1 and S2 in the ESI† provide some comparative bond distances and angles.| Compound 1 | Compound 2 | |
|---|---|---|
| Computer programs: SHELXS,46 SHELXL2018/1.47a The chemical formula and Mr are not accurately reported because solvates/counterions could not be resolved/refined and their effect was discounted with the SQUEEZE procedure implemented in PLATON.48 | ||
| Chemical formula (as dimeric unit + solvates) | C38H32Cu2N6O62+ + 2(NO3−)·(C7H7NO2)·2(H2O) | C42H32Cu2N8O4+ + unknowna |
| M r (as dimeric unit + solvates) | 795.77 + 434.32 | 839.83 + unknowna |
| Crystal system, space group | Monoclinic, C2/c | Monoclinic, C2/c |
| Temperature [K] | 295 | 295 |
| a, b, c (Å) | 26.000(8), 10.253(3), 21.004(5) | 24.5552(17), 9.9210(6), 19.9673(12) |
| β (°) | 106.90(2) | 102.042(2) |
| Volume (Å3) | 5357.39 | 4757.2(5) |
| Z | 4 | 4 |
| Radiation type | Mo Kα, λ = 0.71071 Å | Mo Kα, λ = 0.71071 Å |
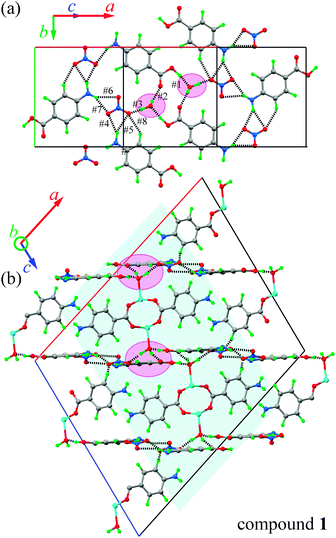
The asymmetric unit in 1 contains half a DU [Cu(pAB)(phen)(H2O)]22+, one free pABH, one phen molecule, a nitrate ion and a water of crystallization (Fig. 1a). In turn, compound 2 (Fig. 1b) contains half a DU [Cu(pAB)(phen)pz]22+. The uncoordinated part of the structure of 2 (the counterion/solvate content) was impossible to identify with some certainty, due to extreme disorder. The structural model was refined employing the SQUEEZE procedure implemented in PLATON,48 an alternative taking into account the lacking electron content in the data set under consideration. In the refinement of the data set, the program estimated this to be about 700 electrons for the whole unit cell. It is to be noted that the whole electron count for the counterion/solvates in 1 affords 616 electrons, which suggests that the unaccounted-for part of the structure in 2 may be similar to the one in 1. Both DUs are almost identical and result from the bridging of two copper ions by the carboxylate groups of two symmetry-related pAB molecules. The Cu ions are in square pyramidal coordination, bonded equatorially to two carboxylic oxygens of two pAB molecules and two N from phen molecules, with the apical position occupied by a water molecule in 1 and a pz nitrogen in 2 (Fig. 1a and b). The intra-dinuclear exchange coupling J0 is mainly supported by two symmetry-related O–C–O bridges with C–O average distances 1.268(12) Å and angle 124.6(2)° for compound 1 and 1.266(3) Å and 124.57(17)° for compound 2. The π–π interactions arising from the stacking of the phen rings, with an average distance of ∼3.42 Å and angle of ∼0.9° for 1 and ∼3.38 Å and ∼2.8° for 2, should be less relevant for the magnitude of J0.
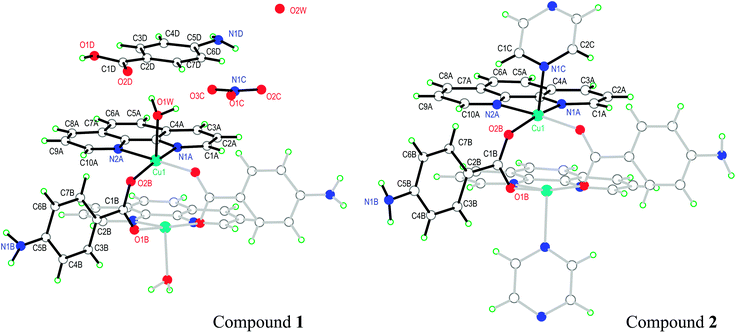 | ||
| Fig. 1 Schematic representation of the molecules of 1 and 2, showing the used labeling scheme. In full (hollow) bonds, the independent (symmetry related) parts. The structure of compound 1 is taken from Battaglia et al.,44 but the labeling of the atoms was changed in order to help the comparison of the two structures. | ||
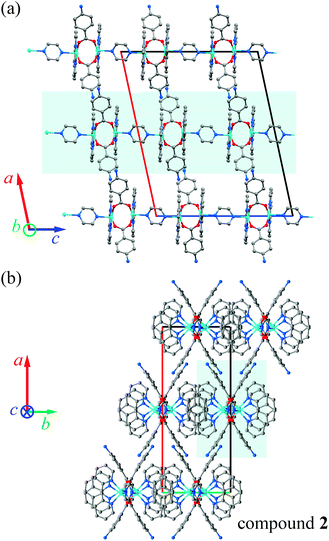
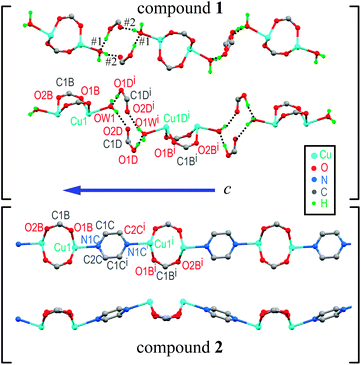
Similarities in the DU geometry in both structures are no longer valid when the crystal organization is analyzed, for which we shall discuss each structure in turn, looking for the interaction paths, whenever possible. The isolated nitrate and pABH molecules in 1 are roughly coplanar and arranged in layers parallel to the (−1,0,1) plane. Since the interlayer distance is one half d(−1,0,1), these layers should, in fact, be described as parallel to the (−2, 0, 2) family. The planar arrays also include the coordinated water molecule O1W, and all three molecules (nitrate, pABH and water) determine a tightly bound H-bonded structure shown in Fig. 2a (the “#n” codes used for easy reference to each interaction are defined in Table 2, which presents information about these H-bonds). The DUs expand between adjacent planes, as shown in Fig. 2b, acting as linkers between the planar H-bonded arrays. The latter, in turn, act as weak coupling agents between neighbouring DUs. It is interesting to point out that the DUs are related along the c-axis by inversion centers, while along a they are related by C-centering ([0.5,0.5,0]) translations. Thus, even if the symmetry-related copper centres are magnetically different, the EPR spectra of all dimeric units should be identical for all orientations of B0. In the case of compound 2, the replacement of the apical water molecule in 1 by a pz bidentate linker in 2 has the effect of generating ⋯pz-DU-pz-DU-pz⋯ chains running along c (Fig. 3a and b). These chains, in turn, are presumably connected through the disordered solvates/counteranions. As displayed in Fig. 4, in both compounds, the DUs form chains along the c-axes; in 1 the neighbouring DUs are connected by H-bonds from the coordinated water molecules and the free pABH, which acts as a linker between the DUs.
| Code | D-H⋯A H-bond | D-H (Å) | H⋯A (Å) | D⋯A (Å) | (D-H⋯A)° |
|---|---|---|---|---|---|
| Symmetry codes: (i) −x, 2 − y, −z; (ii) x, 1 + y, z; (iii) 1/2 − x, 1/2 + y, 1/2 − z; (iv) 1/2 − x, 3/2 − y, 1 − z. | |||||
| #1 | O1D–H1OD⋯O1Wi | 0.86 | 1.88 | 2.7348(8) | 173 |
| #2 | O1W–H1WA⋯O2D | 0.86 | 1.91 | 2.7301(8) | 158 |
| #3 | O1W–H1WB⋯O3Cii | 0.86 | 1.88 | 2.7324(8) | 173 |
| #4 | N1D–H1ND⋯O2C | 0.86 | 2.36 | 3.1442(10) | 151 |
| #5 | N1D–H1ND⋯O3C | 0.86 | 2.53 | 3.3375(10) | 157 |
| #6 | N1D–H2ND⋯O1Ciii | 0.86 | 2.45 | 3.2366(10) | 152 |
| #7 | N1D–H2ND⋯O2Ciii | 0.86 | 2.44 | 3.2427(10) | 156 |
| #8 | C4D–H4DA⋯O3C | 0.96 | 2.54 | 3.3952(10) | 148 |
| #9 | N1B–H1NB⋯O2Wiv | 0.86 | 2.22 | 3.0154(9) | 154 |
4 Modeling EPR results
We describe the EPR spectra of a system made of weakly coupled DUs with 1/2 spins S1 and S2 and with a spin Hamiltonian as:5,54
 | (2) |
 is the hyperfine coupling of S1 and S2 and the nuclear spins I1 and I2 of copper whose isotopes 63 and 65 have both spins I = 3/2 and natural abundances 69 and 31%, respectively. The dinuclear character of the spin system indicates that the number of hyperfine components (2IT + 1) depends on the total nuclear spin IT = I1 + I2, having values I = 3, 2, 1 or 0, resulting in seven observed peaks with relative intensities 1
![[thin space (1/6-em)]](https://www.rsc.org/images/entities/char_2009.gif) :
:![[thin space (1/6-em)]](https://www.rsc.org/images/entities/char_2009.gif) 2
2![[thin space (1/6-em)]](https://www.rsc.org/images/entities/char_2009.gif) :
:![[thin space (1/6-em)]](https://www.rsc.org/images/entities/char_2009.gif) 3
3![[thin space (1/6-em)]](https://www.rsc.org/images/entities/char_2009.gif) :
:![[thin space (1/6-em)]](https://www.rsc.org/images/entities/char_2009.gif) 4
4![[thin space (1/6-em)]](https://www.rsc.org/images/entities/char_2009.gif) :
:![[thin space (1/6-em)]](https://www.rsc.org/images/entities/char_2009.gif) 3
3![[thin space (1/6-em)]](https://www.rsc.org/images/entities/char_2009.gif) :
:![[thin space (1/6-em)]](https://www.rsc.org/images/entities/char_2009.gif) 2
2![[thin space (1/6-em)]](https://www.rsc.org/images/entities/char_2009.gif) :
:![[thin space (1/6-em)]](https://www.rsc.org/images/entities/char_2009.gif) 1 and half the hyperfine splitting A observed for each isotope of monomeric copper ions.54 The sum over the curly brackets in eqn (2) is over all DUs in the lattice and
1 and half the hyperfine splitting A observed for each isotope of monomeric copper ions.54 The sum over the curly brackets in eqn (2) is over all DUs in the lattice and  is a spatially random function considering weak isotropic exchange couplings between the neighbouring DUs. Dipole–dipole couplings between copper spins in the neighboring DUs are considered smaller than the exchange coupling and are accordingly disregarded. In terms of the total spin of a DU, S = S1 + S2 and their difference s = S1 − S2 and defining g = (g1 + g2)/2 and G = (g1 − g2)/2 one obtains:34
 | (3) |
 and are not modified. However, since
  , s is randomly time modulated and the terms s·G·B0 and s·D·s are averaged out by
  .38,39 Thus,
 | (4) |
 because
  . For
. For  but
but  we may approximate the predicted EPR spectrum as that of an effective spin triplet S = 1, with two allowed EPR transitions Sz = ±1 ↔ 0 at a distance |S·D·S|, and in certain cases20 a forbidden EPR transition Sz = ±1 ↔ ∓1. Since
  is strongly anisotropic for CuII ions in ∼C4v symmetry,54 the hyperfine structure is merged only in the field orientation ranges where
  . The splitting J0 between singlet and triplet states does not affect the shape or structure of the resonances but acts as an activation energy introducing a variation with T of the spectral intensities proportional to the population of the spin triplet. For antiferromagnetic DUs the EPR signal disappears at
  , when the excited triplet state depopulates. The splitting of the allowed resonances introduced by the D-term in a single crystal is responsible for the EPR spectral shape of a powder sample. The eigenvalues and principal directions of the matrices g and D can be evaluated from the angular variation of the positions of these peaks and the effect of
  on the terms μBs·G·B0, and s·D·s can be observed experimentally. Finally, possible merging of the two strongly anisotropic fine structure peaks arising from the excited triplet state may occur for a few orientations when
  . An experimental study of these processes allows gathering information about
  .
.
5 EPR results
5.1 Single crystal spectra
The spectra observed for 1 and 2 display two anisotropic main peaks corresponding to the fine structure peaks M = ±1 ↔ 0 of the S = 1 spin Hamiltonian of eqn (4) that cross at the magic angles54 in the ca* and cb planes as a result of the D term of eqn (4). We also observe the forbidden M = ±1 ↔ ∓1 EPR transition at the half field (not included in Fig. 5 and 6). Gaussian and Lorentzian lineshapes54 were used to fit the observed spectra. Partially collapsed hyperfine structures observed for certain field orientations complicate the fittings and, when appropriate, are discussed with some details. The positions B0 and the widths Γ of these peaks were calculated from least-squares fittings to the observed spectra proposing one or two field derivative Gaussian line shapes54 in compound 1 and one or two derivative Lorentzian line shapes54 in compound 2 that fit best the observed peaks in each case. The angular variations of the observed line positions are shown in Fig. 5a–c and 6a–c. The angular dependence of the line widths Γ is shown in Fig. S1a–c in the ESI† only for compound 2. The sudden changes in the line width at the magic angles in Fig. S1† could be related to “exchange narrowing in one dimensional systems”,62 a characteristic of 1D spin dynamics. However, these abrupt changes in the line width are interpreted in this work as a consequence of very small J′ regardless of the dimension of the problem, as has been shown before with EPR spectra in 3D arrays.23,35 The 1D characteristics of 1 and 2 are solely helpful in reducing the number of exchange paths contributing to J′. The broadening due to the unresolved hyperfine structure hinders a meaningful analysis of the angular variation of Γ in 1.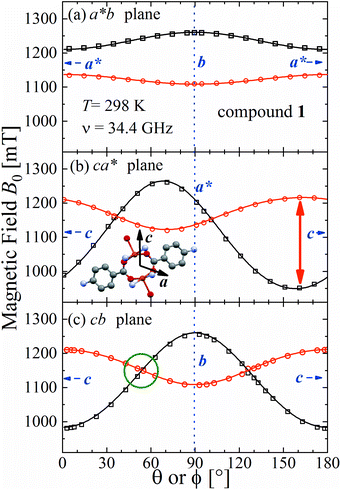 | ||
| Fig. 5 Angular variation of the position of the ±1 ↔ 0 EPR absorptions observed at the Q-band in compound 1 in the three studied planes. Solid lines are obtained from a global fit of eqn (2) to the data. The positions of the axes within each plane are indicated. The green circle in (c) indicates the range of the collapse. Crystal axes are shown in blue. | ||
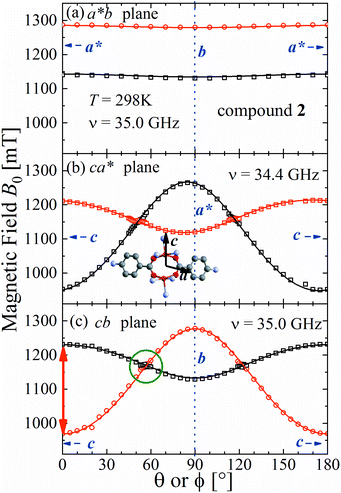 | ||
| Fig. 6 Angular variation of the position of the ±1 ↔ 0 EPR absorptions observed at the Q-band for compound 2 in the studied planes. Symbols are experimental values; solid lines are obtained from a global fit of eqn (2) to the data. Similar fitted curves are obtained with eqn (4). The parameters obtained in this fit are given in Table 3. The green circle in (c) indicates the range of the collapse. Crystal axes are shown in blue. | ||
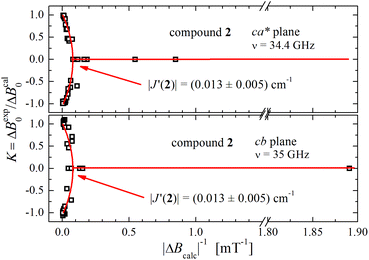
Positions and widths display small changes and no crossings in the plane a*b, indicating that this plane is perpendicular to the axis of symmetry of the DUs as expected from the structural results. The splitting between the allowed EPR transitions is maximum when B0 is approximately parallel to the c axis of the chains of DUs. The crossings are sharp in compound 1, while they merge within an angular range around the expected crossing points in compound 2. We obtained the principal values and directions of the g- and D-matrices by fitting eqn (2) (spin-Hamiltonian with two spins 1/2) and the approximate eqn (4) (one spin 1) to the data in Fig. 5a–c (for compound 1) and in Fig. 6a–c (for compound 2), excluding the merged peaks in angular ranges around the magic angles in compound 2. In the case of compound 1, eqn (4) gives poorer agreement than eqn (2) with the observed result, indicating that the spin S = 1 approximation does not strictly apply. Meanwhile, both equations provide similar quality fittings to the data for compound 2. Since one obtains eqn (4) from eqn (2) cancelling out the contribution [μBs·G·B0 − s·D·s] this result indicates the presence of interdinuclear interactions in compound 2 (finite |J′|) and that in compound 1 this coupling is negligible (|J′| ∼ 0). Quantitatively, for compound 1 the mean square dispersion of the fitting of eqn (2) to the angular variation in Fig. 6 is σ = 0.0010 (attributed to small misalignments of B0), while that of eqn (4) to the same data is σ = 0.0020. Meanwhile, for compound 2, fittings with eqn (2) and (4) give both σ ∼ 0.0010, meaning that the approximations made to obtain eqn (4) are appropriate. Fig. 7 further emphasizes this result, plotting the difference between the experimental and calculated distances between the two fine structure peaks, obtained through the fittings to each model. This is experimental proof that the approximation of a spin Hamiltonian with S = 1 used by most authors to fit the angular variation is valid only when sizeable interdinuclear interactions exist and the whole contribution [μBs·G·B0 − s·D·s] is cancelled out by  . The resulting principal components of the g- and D-matrices54 are included in Table 3. The values of D obtained for 1 and 2 are similar and the rhombic contribution |E| is much smaller than the axial parameter |D| and may be neglected in the analysis. Also, the equatorial components g1 and g2 of the g-matrices differ within the experimental uncertainties, indicating an approximate axial symmetry with g1 ≈ g2 ≈ g⊥ and g3 = g||. It is observed for compound 1 and orientations of B0 around 160° of the c-axes in the ca* plane where the distance between the resonances Sz = ±1 ↔ 0 is largest (Fig. 8a) that each resonance splits into seven peaks due to the hyperfine coupling with the nuclear spins (see above). For other orientations of B0, only some peaks of the hyperfine structure are observed for sample 1. Fitting the hyperfine coupling to the data in Fig. 8a, we obtained the parallel components of the A-matrix, A|| = (63 ± 2) × 10−4 cm−1 and estimated A⊥ ≈ 0 for compound 1. Hyperfine structure is not observed for compound 2. To emphasize the different behavior of compounds 1 and 2 around the magic angles, Fig. 8c and d display spectra observed at the Q-band. In compound 1 (Fig. 8c) the resonances (and their structures) cross; meanwhile, in compound 2, the two peaks merge into one within angular ranges around this angle (Fig. 8d). Fig. 9a and b displays the ratio K = ΔBexp0/ΔBcal0 between the observed splitting of the collapsing resonances and those calculated in the absence of interaction, as a function of the reciprocal of the calculated splitting, for the magnetic field oriented near the magic angles in the planes ca* and cb in compound 2 (Fig. S2† shows the experimental data and the global fit around the collapse for 2). When (ΔBcal0)−1 is large, close to the magic angles, the signals are collapsed, and K = 0. When (ΔBcal0)−1 is small, far from the magic angles, K ∼ ±1.63,64 The collapse is abrupt and occurs when gμB[ΔBcal0]collapse = ħωex = |J′|, a condition allowing the exchange frequency ωex to be obtained. From the fittings of the equation
 | (5) |
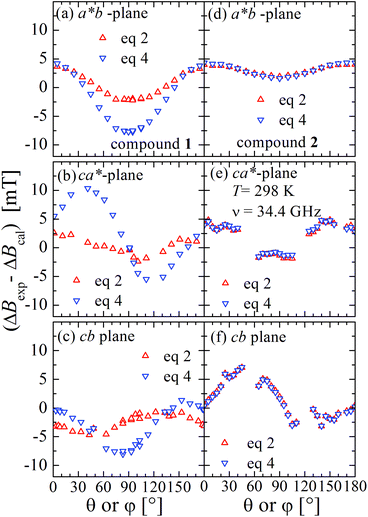 | ||
| Fig. 7 Difference between the experimental and calculated distances between the positions of the fine structure EPR peaks obtained using the parameters obtained with the best fits to eqn (2) (two spins 1/2, red symbols and lines) and eqn (4) (one spin 1, blue symbols and lines). Left side for compound 1 and right side for compound 2. | ||
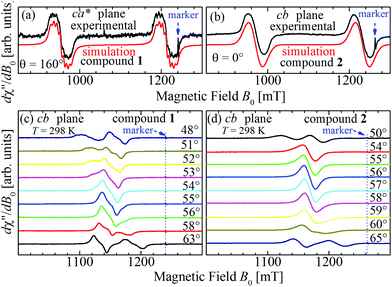 | ||
| Fig. 8 Spectra collected at the Q-band for (a) B0 at 160° of the c-axes in the ca* plane in compound 1 and (b) along the c-axis (θ = 0°) in the cb plane for compound 2 (see red arrows in Fig. 5b and 6c). Selected EPR spectra of single crystals of compounds 1 (c) and 2 (d) observed at the Q-band and 298 K as a function of the orientation of B0 around magic angles (green circles in Fig. 5c and 6c). In (c) a crossing of the resonances occurs for compound 1 while in (d) a merging of the resonances of compound 2 is observed at the magic angles. Note that the signals of compound 1 display some hyperfine structure, which is fully merged for compound 2. | ||
| Compound 1 | |||||
|---|---|---|---|---|---|
| g 1 | g 2 | g 3 | D [cm−1] | E [cm−1] | |
| Single crystal, Q-band | 2.050(2) | 2.066(2) | 2.275(2) | 0.142(2) | 0.003(3) |
| Powder X-band | 2.063(5) | 2.064(5) | 2.261(5) | 0.142(2) | 0.003 (2) |
| Powder Q-band | 2.068(5) | 2.068(5) | 2.271(5) | 0.143(6) | 0.003(2) |
| Compound 2 | |||||
| Single crystal, Q-band | 2.058(2) | 2.072(2) | 2.275(2) | 0.141(2) | 0.002(2) |
| Powder, X-band | 2.064(4) | 2.064(4) | 2.261(4) | 0.140(6) | 0.003(2) |
| Powder, Q-band | 2.064(4) | 2.064(4) | 2.261(4) | 0.140(6) | 0.003(2) |
5.2 Powder spectra
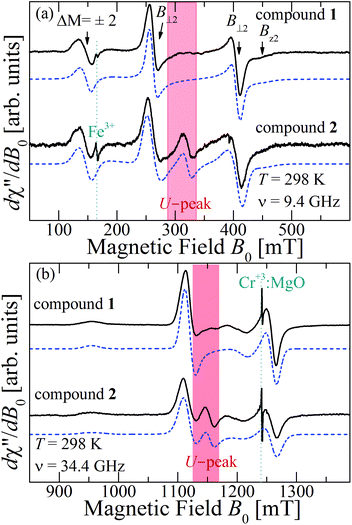
Fig. 10a and b show the EPR spectra dχ′′/dB0 of powder samples of 1 and 2 at T = 298 K and Q- and X-bands. They display the characteristic dinuclear EPR peaks B⊥1, B⊥2 and Bz2, labeled according to the standard notation.54 The narrow peak at 165 mT at the X-band (Fig. 10a) arises from FeIII impurities in the glass tube and that at 1240 mT at the Q-band (Fig. 10b) from the CrIII![[thin space (1/6-em)]](https://www.rsc.org/images/entities/char_2009.gif) :
:![[thin space (1/6-em)]](https://www.rsc.org/images/entities/char_2009.gif) MgO marker. Weaker forbidden EPR transitions Sz = ±1 ↔ ∓1 are observed at 145 mT at the X-band and ∼550 mT at the Q-band (see Fig. 10a and b). Most importantly, the spectra of compound 2 show the so called “U-peak” at ∼1150 mT and ∼320 mT at Q- and X-bands, respectively,24,34,35 fields at which the EPR peaks M = ±1 ↔ 0 intersect in a single crystal sample. We attribute this peak to the accumulation of signal merged for field orientations near the magic angles and consider the powder spectra of compound 2 as the sum of two contributions: dinuclear units (spin Hamiltonian of eqn (4)) and single Lorentzian peaks reproducing the shape of the U-peak. Compound 1 does not show a U-peak, and the dinuclear component fits well the experimental result. The U-peak could be confused with a double-quantum transition (DQT)54 often observed for the dinuclear units. However, DQT does not display a strong temperature dependence as the U-peak.35 Besides, preliminary measurements of the EPR signal as a function of microwave power performed at selected temperatures did not display a behaviour like that corresponding to DQT in the whole tested range for the spectra of 1 and 2. Using EasySpin, we simulated the data at each microwave frequency, to obtain the components of the g- and D-matrices from the powder samples given in Table 3, which are similar to those obtained from single crystal data. New information provided by the powder spectra about
MgO marker. Weaker forbidden EPR transitions Sz = ±1 ↔ ∓1 are observed at 145 mT at the X-band and ∼550 mT at the Q-band (see Fig. 10a and b). Most importantly, the spectra of compound 2 show the so called “U-peak” at ∼1150 mT and ∼320 mT at Q- and X-bands, respectively,24,34,35 fields at which the EPR peaks M = ±1 ↔ 0 intersect in a single crystal sample. We attribute this peak to the accumulation of signal merged for field orientations near the magic angles and consider the powder spectra of compound 2 as the sum of two contributions: dinuclear units (spin Hamiltonian of eqn (4)) and single Lorentzian peaks reproducing the shape of the U-peak. Compound 1 does not show a U-peak, and the dinuclear component fits well the experimental result. The U-peak could be confused with a double-quantum transition (DQT)54 often observed for the dinuclear units. However, DQT does not display a strong temperature dependence as the U-peak.35 Besides, preliminary measurements of the EPR signal as a function of microwave power performed at selected temperatures did not display a behaviour like that corresponding to DQT in the whole tested range for the spectra of 1 and 2. Using EasySpin, we simulated the data at each microwave frequency, to obtain the components of the g- and D-matrices from the powder samples given in Table 3, which are similar to those obtained from single crystal data. New information provided by the powder spectra about  is contained in the U-peak of compound 2, which is absent in the single crystal spectra. Powder spectra at selected T in the interval 4 < T < 298 K at the X-band in compounds 1 and 2 are displayed in Fig. 11a and b. Their intensities I(T) evaluated as the area of χ′′(B0) obtained by integrating dχ′′/dB0 (B0) follow the results obtained by Bleaney and Bowers1 with maximum at T = 80 K and vanishing at T < 10 K as a consequence of the depopulation of the S = 1 triplet state,
 | (6) |
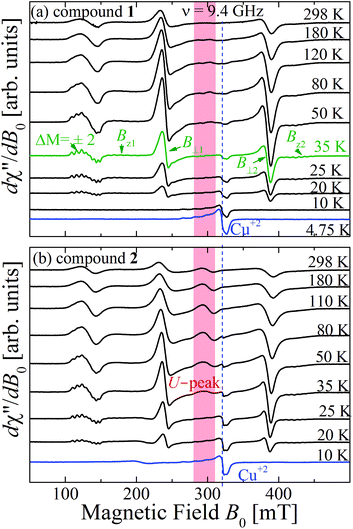 | ||
| Fig. 11 Temperature dependence of the powder EPR spectra collected at the X-band at selected T. (a) compound 1 and (b) compound 2. The field ranges of the U-peaks are emphasized with red backgrounds. | ||
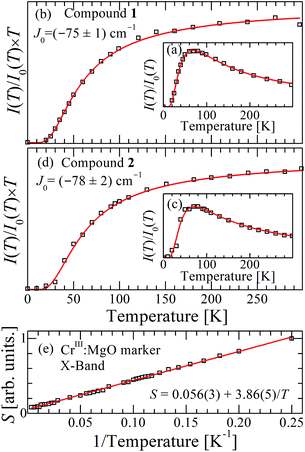 | ||
Fig. 12 (a) and (b) display the normalized dependence I(T)/I(0) vs. T, where I(0) is the maximum value of the signal intensity I(T) for compounds 1 and 2 at the X-band. (c) and (d) display I(T) × T/I(0) vs. T. Black symbols are experimental results, red curves are fittings of eqn (6) to the data allowing us to obtain the values of J0. (e) The Curie behavior of the area of the EPR signal S of the marker CrIII![[thin space (1/6-em)]](https://www.rsc.org/images/entities/char_2009.gif) : :![[thin space (1/6-em)]](https://www.rsc.org/images/entities/char_2009.gif) MgO confirms that there is no quantitative experimental error in J0 due to changes in the parameters of the microwave cavity within the temperature range of the experiments, allowing us to evaluate the error indicated for the exchange couplings. MgO confirms that there is no quantitative experimental error in J0 due to changes in the parameters of the microwave cavity within the temperature range of the experiments, allowing us to evaluate the error indicated for the exchange couplings. | ||
6 Analysis and discussion
Comparison of our structural results for the dinuclear compound 2 with those reported by Battaglia et al.44 for compound 1 shows that the structures of the DUs are very similar, a result reflected by the equal intradinuclear magnetic parameters obtained from powder and single-crystal EPR spectra (Table 3). These values are also similar to J0 = (−74 ± 3) cm−1 obtained by Calvo et al.34 for the Cu2Ac2phen2 compound, where the main path for exchange coupling J0 is similar to those in 1 and 2.34 The BS-DFT results predict correctly an antiferromagnetic coupling, with an excited triplet and a ground singlet allowing the calculation of J(1,DFT)0 = −69 cm−1 and J(2,DFT)0 = −66 cm−1, according to eqn (1), which are in good agreement with the experimental results. Rodríguez-Fortea et al.16 extensively studied the factors influencing the exchange coupling in carboxylate bridged compounds using BS-DFT, with the formiate compound [Cu2(m-CH3COO)2-(phen)2(H2O)2](NO3)2·4H2O as an example. In a square pyramidal symmetry, the strength of the axial ligand determines the mixing of the dx2−y2 orbital, which lies in the equatorial plane and contributes to the Cu–Cu superexchange path through the carboxylate bridge. The substitution of the axial ligand O1W in compound 1 by N1C in compound 2 modulates only slightly the equatorial angles, and consequently, the bridging angles without affecting the value of the exchange coupling. The DFT-calculated exchange coupling is almost the same for both compounds, and the SOMO orbitals and the spin densities for both are very similar (Fig. S3 and S4 in the ESI†).On the other hand, the interdinuclear paths for superexchange between DUs arranged in chains shown in Fig. 4a and b are very different. In 1, two symmetry-related paths, each containing a carboxylate ion O1D–C1D–O2D, are connected through two H-bonds O–H–O to the water oxygens O1W of the apical ligands of the copper ions in the neighbouring DUs along the chains (Fig. 4a). Meanwhile, in 2, these apical O1W are connected by two symmetry-related covalent paths provided by pyrazole rings (Fig. 4b). Even if paths connecting apical ligands are expected to support weak interactions, it is clear that this weakness is extreme when the covalent path in 2 is replaced by a pair of consecutive H-bonds in 1. The minimum straight distances between the Cu ions in the neighbouring DUs are 7.678 Å in 1 and 7.304 Å in 2, while the distances measured along the paths are 12.572 Å in 1 and 8.857 Å in 2, providing the picture searched for when programming this investigation. These results are a consequence of the structures of 1 and 2 wherein each Cu ion in the DU is equatorially coordinated by two O from acidic groups and two N from a phenanthroline molecule. The experimental values of g|| > g⊥ indicate that the CuII unpaired electron resides in the orbital dx2−y2, as expected from its square-pyramidal environment.54,66
The magnetic behavior of compounds 1 and 2 (Fig. 4) could also be explained as alternate magnetic chains with x = |J′/J0| ≤ 1.7 × 10⁻⁴ using the theory reported by Duffy and Barr,67 following that of Bonner and Fisher68 for uniform chains, which allows the calculation of the eigenstates and the thermodynamic properties (magnetic susceptibility and specific heat) of these chains as a function of x (see, for example, Calvo et al.69). However, the EPR spectra of magnetic compounds depend on the spin dynamics which is not considered in these theories. As explained before, the EPR spectra of a coupled infinity spin system can be studied using the statistical theories of Anderson, and Kubo and Tomita.38,39 On the other hand, when the coupling between DUs is very small, as for 1 and 2, the magnetic susceptibility of the coupled system is accurately explained by the Bleaney and Bowers equation (eqn (6), which neglects the coupling J′.
It has been proposed that the U-peak arises from the discussed interdimeric coupling |J′|, which can be evaluated from its relative intensity R.24,35Fig. 13 displays the ratio R between the integrated intensities of the U-peak and the total signal of the DUs of compound 2 as a function of T. Following the method described by Calvo et al.35 and using the data in Fig. 6b and c, we determine that |J′(T)| [cm−1] = 0.48R(T), and using this relationship and the data in Fig. 13 we obtain |J′(2)| = (0.013 ± 0.005) cm−1 at 298 K. This value agrees with the one obtained using eqn (5) in Fig. 9 within the experimental error. Since the U-peak is absent within the experimental uncertainty in the spectra of 1, and that the hyperfine coupling can be observed in a wide range of field orientations, we conclude that |J′(1)| < A||/2 = (0.003) cm−1. The order of magnitude of J′ lies outside of the reasonable precision of the BS-DFT method. Nevertheless, we performed the calculation for the prediction of the sign of the exchange and the calculated intermolecular exchange coupling for compound 2 is presented in Table 4. The results point to a ferromagnetic J′ for compound 2. For compound 1 the calculation did not converge.
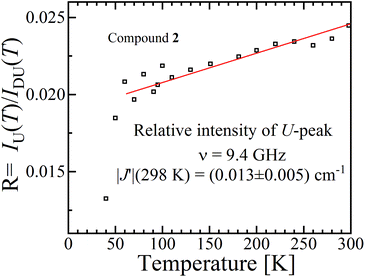 | ||
| Fig. 13 Ratio R(T) between the areas of the U-peak and of the powder spectrum of compound 2 using the data in Fig. 6b and c. We calculated35 that |J′(T)| [cm−1] = 0.48R(T), and using this relationship and the data in Fig. 13 we obtain |J′(2)| = (0.013 ± 0.005) cm−1 at 298 K. | ||
7 Conclusions
Spin entanglement is generated when the quantum state of each particle cannot be described independent of the state of the others. In a lattice containing magnetic atoms or molecules with an unpaired spin, it may be produced by exchange interactions connecting these spins. When these interactions are weak, the spin entanglement can be detected under certain situations that escalate their effects and make them detectable and even produce phase transitions observable as changes in the observed properties. We study here antiferromagnetic dinuclear compounds, where two atoms with unpaired spin 1/2 are coupled by isotropic (exchange J0) and anisotropic (matrix D) spin–spin interactions, plus Zeeman coupling with B0 (eqn (2)). Each DU displays a ground spin singlet state and an excited triplet state. A small but important additional component to the system is the coupling between these DUs contained within in eqn (2). This system should be compared with that considered by Tachiki and Yamada in 1970.70,71 They studied the effect of the magnetic response of a “spin pair” or dinuclear compound of the crossing of one level of the triplet state with the singlet state, produced as a function of the magnitude of the applied magnetic field. This crossing generates spin ordering and gives rise to spin waves, which are detected as peaks in the magnetization of the material. Years later, and starting with Oosawa et al.72,73 similar phenomena were studied and interpreted in terms of Bose–Einstein condensation and quantum phase transitions. Zapf et al. summarized much of these results.27 In previous works23,24,35 we showed that the crossings of the EPR transitions within the triplet state as a function of field orientation also play a fundamental role in the spin entanglement of dinuclear compounds that can be observed in EPR experiments. This work was intended to study comparatively the magnetic properties and the spin entanglement of two compounds chosen from careful analysis of the crystal structures containing similar dinuclear units (shown by nearly identical isotropic exchange (J0) and anisotropic (D) intradinuclear spin–spin interactions) connected by different three-dimensional arrays of chemical paths with clearly different interdinuclear couplings
  , using EPR from different perspectives. Compound 1 and its structure were reported previously.44 Compound 2 is new, and its structure was solved and is reported here. Fig. 1 and 4 show, respectively, the similarity between the DUs of 1 and 2, and the deep differences between the weak chemical paths connecting the DUs. Our EPR measurements on single crystal and powder samples were designed to highlight and evaluate the effects of the interdinuclear coupling on the collective properties. Our EPR results reflect the characteristics of the magnetic properties and the spin entanglement indicated by the structures of 1 and 2 and provide a procedure that can be applied in the future investigation of spin entanglement in dinuclear compounds. As closing remarks, we summarize our results as follows:
1. We observed spin entanglement produced when the absorption peaks within the spin triplet cross as a function of the orientation of the applied magnetic field. This occurs within the angular range wherein the distance between the EPR transitions is smaller than the magnitude of the interdinuclear spin exchange coupling J′, giving rise to two, entangled and unentangled, spin phases. This is clearly observed in the single crystal study of compound 2 and allows the evaluation of J′. This effect is absent in compound 1, indicating negligible interdinuclear coupling J′.
2. The spin entanglement described above is also shown in the spectra of powder samples of compound 2, wherein an additional U-peak collects the EPR response of the spins in the entangled phase. This peak is not shown by the powder spectra of compound 1.
3. The coupling J′ modulates and average outs the hyperfine structure allowing another method to detect and estimate interdinuclear interactions. This is observed by comparing the spectra of compounds 1 and 2. In 2, the larger couplings J′ completely destroy the hyperfine coupling, although in 1 it can be detected for orientations of B0 where A is large. Since copper has two natural isotopes, dinuclear units with different hyperfine couplings coexist in the samples, complicating any quantitative evaluation of the spin entanglement and |J′| from the hyperfine structure in 1, and only provide a higher limit. Nevertheless, our data for the hyperfine coupling reproduce qualitatively the expected behaviour. This source of uncertainty in the fitting of the line shapes and the evaluation of the line widths in the spectra of compound 1 could be avoided only with Cu isotopically enriched samples.
4. The line shapes and line widths of the peaks of the single crystal spectra also offer a procedure to evaluate interdinuclear couplings. In principle and in agreement with Anderson's theory of exchange narrowing, we observe Lorentzian line shapes in the field orientation ranges wherein the spins are entangled in compound 2. For other field orientations and for compound 1, the results were not easily described and were of little use. The residual hyperfine structure of 1 further complicates this analysis.
As a closing remark, some of the achievements of our work were possible only through careful combined experiments on powder and single crystal samples.
Conflicts of interest
There are no conflicts to declare.Acknowledgements
This work was supported by CNPq (Project 305668/2014-5) in Brazil and by the ESF under the project CZ.02.2.69/0.0/0.0/18_070/0009469. RC is a member of CONICET, Argentina.Notes and references
- B. Bleaney and K. D. Bowers, Proc. R. Soc. London, Ser. A, 1952, 214, 451–465 CAS.
- O. Kahn, Molecular Magnetism, Wiley VCH, New York, 1993 Search PubMed.
- A. Bencini and D. Gatteschi, J. Am. Chem. Soc., 1986, 108, 5763–5771 CrossRef CAS.
- O. Kahn, Angew. Chem., Int. Ed. Engl., 1985, 24, 834–850 CrossRef.
- A. Bencini and D. Gatteschi, Electron Paramagnetic Resonance of Exchange Coupled Systems, Springer-Verlag, Berlin, 1990, p. 287 Search PubMed.
- J. Curély and B. Barbara, Struct. Bonding, 2006, 122, 207–250 CrossRef.
- I. Castro, M. L. Calatayud, C. Yuste, M. Castellano, R. Ruiz-García, J. Cano, J. Faus, M. Verdaguer and F. Lloret, Polyhedron, 2019, 169, 66–77 CrossRef CAS.
- E. I. Solomon, Inorg. Chem., 2006, 45, 8012–8025 CrossRef CAS PubMed.
- E. I. Solomon, D. E. Heppner, E. M. Johnston, J. W. Ginsbach, J. Cirera, M. Qayyum, M. T. Kieber-Emmons, C. H. Kjaergaard, R. G. Hadt and L. Tian, Chem. Rev., 2014, 114, 3659–3853 CrossRef CAS.
- R. Calvo, E. C. Abresch, R. Bittl, G. Feher, W. Hofbauer, R. A. Isaacson, W. Lubitz, M. Y. Okamura and M. L. Paddock, J. Am. Chem. Soc., 2000, 122, 7327–7341 CrossRef CAS.
- R. Calvo, R. A. Isaacson, M. L. Paddock, E. C. Abresch, M. Y. Okamura, A.-L. Maniero, L.-C. Brunel and G. Feher, J. Phys. Chem. B, 2001, 105, 4053–4057 CrossRef CAS.
- B. C. Guha, Proc. R. Soc. London, Ser. A, 1951, 206, 353–373 CAS.
- B. N. Figgis and R. L. Martin, J. Chem. Soc., 1956, 3837–3846 RSC.
- T. Tokii, N. Watanabe, M. Nakashima, Y. Muto, M. Morooka, S. Ohba and Y. Saito, Bull. Chem. Soc. Jpn., 1990, 63, 364–369 CrossRef CAS.
- R. F. Schlam, M. Perec, R. Calvo, L. Lezama, M. Insausti, T. Rojo and B. M. Foxman, Inorg. Chim. Acta, 2000, 310, 81–88 CrossRef CAS.
- A. Rodríguez-Fortea, P. Alemany, S. Alvarez and E. Ruiz, Chem. – Eur. J., 2001, 7, 627–637 CrossRef.
- Y. Muto, M. Nakashima, T. Tokii, I. Suzuki, S. Ohba, O. W. Steward and M. Kato, Bull. Chem. Soc. Jpn., 2002, 75, 511–519 CrossRef CAS.
- R. Baggio, R. Calvo, M. T. Garland, O. Peña, M. Perec and L. D. Slep, Inorg. Chem. Commun., 2007, 10, 1249–1252 CrossRef CAS.
- S. Emori, T. Tokii and Y. Muto, Bull. Chem. Soc. Jpn., 1975, 48, 1649–1650 CrossRef CAS.
- W. Wernsdorfer, N. Aliaga-Alcalde, D. N. Hendrickson and G. Christou, Nature, 2002, 416, 406–409 CrossRef PubMed.
- J. S. Valentine, A. J. Silverstein and Z. G. Soos, J. Am. Chem. Soc., 1974, 96, 97–103 CrossRef CAS.
- S. E. Sebastian, P. Tanedo, P. A. Goddard, S.-C. Lee, A. Wilson, S. Kim, S. Cox, R. D. McDonald, S. Hill, N. Harrison, C. D. Batista and I. R. Fisher, Phys. Rev. B: Condens. Matter Mater. Phys., 2006, 74, 180401 CrossRef.
- L. M. B. Napolitano, O. R. Nascimento, S. Cabaleiro, J. Castro and R. Calvo, Phys. Rev. B: Condens. Matter Mater. Phys., 2008, 77, 214423 CrossRef.
- M. Perec, R. Baggio, R. P. Sartoris, R. C. Santana, O. Peña and R. Calvo, Inorg. Chem., 2010, 49, 695–703 CrossRef CAS PubMed.
- P. L. Nordio, Z. G. Soos and H. M. McConnell, Annu. Rev. Phys. Chem., 1966, 17, 237–260 CrossRef CAS.
- S. Sachdev and R. N. Bhatt, Phys. Rev. B: Condens. Matter Mater. Phys., 1990, 41, 9323–9329 CrossRef PubMed.
- V. Zapf, M. Jaime and C. D. Batista, Rev. Mod. Phys., 2014, 86, 563–614 CrossRef CAS.
- S. Sachdev, Quantum Phase Transitions, Cambridge University Press, Cambridge, 2nd edn, 1999, p. 501 Search PubMed.
- S. E. Sebastian, P. A. Sharma, M. Jaime, N. Harrison, V. Correa, L. Balicas, N. Kawashima, C. D. Batista and I. R. Fisher, Phys. Rev. B: Condens. Matter Mater. Phys., 2005, 72, 100404 CrossRef.
- E. Dagotto, J. Riera and D. Scalapino, Phys. Rev. B: Condens. Matter Mater. Phys., 1992, 45, 5744–5747 CrossRef PubMed.
- C. Mennerich, H.-H. Klauss, A. Wolter, S. Süllow, F. Litterst, C. Golze, R. Klingeler, V. Kataev, B. Büchner, M. Goiran, H. Rakoto, J.-M. Broto, O. Kataeva and D. Price, in Quantum Magnetism, NATO Science for Peace and Security Series B: Physics and Biophysics, ed. B. Barbara, Y. Imry, G. Sawatzky and F. C. E. Stamp, Springer, Dordrecht, 2008, vol. 2, pp. 97–124 Search PubMed.
- S. Takahashi, I. S. Tupitsyn, J. Van Tol, C. C. Beedle, D. N. Hendrickson and P. C. E. Stamp, Nature, 2011, 476, 76–79 CrossRef CAS PubMed.
- V. Gavrilov, Y. V. Yablokov, L. Milkova and A. Ablov, Phys. Status Solidi B, 1971, 45, 603–610 CrossRef CAS.
- R. Calvo, J. E. Abud, R. P. Sartoris and R. C. Santana, Phys. Rev. B: Condens. Matter Mater. Phys., 2011, 84, 104433 CrossRef.
- R. Calvo, V. T. Santana and O. R. Nascimento, Phys. Rev. B, 2017, 96, 064424 CrossRef.
- C. J. Gorter and J. H. Van Vleck, Phys. Rev., 1947, 72, 1128–1129 CrossRef CAS.
- P. W. Anderson and P. R. Weiss, Rev. Mod. Phys., 1953, 25, 269–276 CrossRef CAS.
- P. W. Anderson, J. Phys. Soc. Jpn., 1954, 9, 316–339 CrossRef.
- R. Kubo and K. Tomita, J. Phys. Soc. Jpn., 1954, 9, 888–919 CrossRef CAS.
- V. T. Santana, B. N. Cunha, A. M. Plutín, R. G. Silveira, E. E. Castellano, A. A. Batista, R. Calvo and O. R. Nascimento, Phys. Chem. Chem. Phys., 2019, 21, 4394–4407 RSC.
- S. E. Sebastian, N. Harrison, C. D. Batista, L. Balicas, M. Jaime, P. A. Sharma, N. Kawashima and I. R. Fisher, Nature, 2006, 441, 617–620 CrossRef CAS PubMed.
- B. Kozlevčar, I. Leban, M. Petrič, S. Petriček, O. Roubeau, J. Reedijk and P. Šegedin, Inorg. Chim. Acta, 2004, 357, 4220–4230 CrossRef.
- M. Šiménas, M. Kobalz, M. Mendt, P. Eckold, H. Krautscheid, J. Banys and A. Pöppl, J. Phys. Chem. C, 2015, 119, 4898–4907 CrossRef.
- L. P. Battaglia, A. C. Bonamartini, S. Ianelli, M. A. Zoroddu and G. Sanna, J. Chem. Soc., Faraday Trans., 1991, 87, 3863 RSC.
- CrysAlisPRO, Agilent Technologies, (v. 1.171.33.36d), 2011 Search PubMed.
- G. M. Sheldrick, Acta Crystallogr., Sect. A: Found. Crystallogr., 2008, 64, 112–122 CrossRef CAS PubMed.
- G. M. Sheldrick, Acta Crystallogr., Sect. C: Struct. Chem., 2015, 71, 3–8 Search PubMed.
- A. L. Spek, Acta Crystallogr., Sect. D: Biol. Crystallogr., 2009, 65, 148–155 CrossRef CAS PubMed.
- G. M. Sheldrick, SHELXTL. Structure determination software suite, v.5.1, 1998 Search PubMed.
- C. F. Macrae, I. J. Bruno, J. A. Chisholm, P. R. Edgington, P. McCabe, E. Pidcock, L. Rodriguez-Monge, R. Taylor, J. Van de Streek and P. A. Wood, J. Appl. Crystallogr., 2008, 41, 466–470 CrossRef CAS.
- J. E. Wertz and P. Auzins, Phys. Rev., 1957, 106, 484–488 CrossRef CAS.
- S. Stoll and A. Schweiger, J. Magn. Reson., 2006, 178, 42–55 CrossRef CAS PubMed.
- Matlab, The Mathworks Inc., Natick, MA 01760, 2015 Search PubMed.
- J. A. Weil and J. R. Bolton, Electron Paramagnetic Resonance. Elementary Theory and Practical Applications, Wiley-Interscience, Hoboken, NJ, 2nd edn, 2007 Search PubMed.
- F. Neese, Wiley Interdiscip. Rev.: Comput. Mol. Sci., 2012, 2, 73–78 CAS.
- S. Grimme, J. G. Brandenburg, C. Bannwarth and A. Hansen, J. Chem. Phys., 2015, 143, 054107 CrossRef PubMed.
- A. Bencini, F. Totti, C. A. Daul, K. Doclo, P. Fantucci and V. Barone, Inorg. Chem., 1997, 36, 5022–5030 CrossRef CAS.
- S. I. Levchenkov, I. N. Shcherbakov, L. D. Popov, V. V. Lukov, V. V. Minin, Z. A. Starikova, E. V. Ivannikova, A. A. Tsaturyan and V. A. Kogan, Inorg. Chim. Acta, 2013, 405, 169–175 CrossRef CAS.
- D. Schweinfurth, J. Krzystek, M. Atanasov, J. Klein, S. Hohloch, J. Telser, S. Demeshko, F. Meyer, F. Neese and B. Sarkar, Inorg. Chem., 2017, 56, 5253–5265 CrossRef CAS PubMed.
- E. A. Buvaylo, V. N. Kokozay, V. G. Makhankova, A. K. Melnyk, M. Korabik, M. Witwicki, B. W. Skelton and O. Y. Vassilyeva, Eur. J. Inorg. Chem., 2018, 1603–1619 CrossRef CAS.
- Chemcraft - Graphical software for visualization of quantum chemistry computations.https://www.chemcraftprog.com/.
- R. E. Dietz, F. R. Merritt, R. Dingle, D. Hone, B. G. Silbernagel and P. M. Richards, Phys. Rev. Lett., 1971, 26, 1186–1188 CrossRef CAS.
- D. M. Martino, M. C. G. Passeggi and R. Calvo, Phys. Rev. B: Condens. Matter Mater. Phys., 1995, 52, 9466–9476 CrossRef CAS.
- D. M. Martino, M. C. Passeggi, R. Calvo and O. R. Nascimento, Phys. B, 1996, 225, 63–75 CrossRef CAS.
- R. P. Sartoris, O. R. Nascimento, R. C. Santana, M. Perec, R. F. Baggio and R. Calvo, Dalton Trans., 2015, 44, 4732–4743 RSC.
- M. Atanasov, P. Comba, G. R. Hanson, S. Hausberg, S. Helmle and H. Wadepohl, Inorg. Chem., 2011, 50, 6890–6901 CrossRef CAS.
- W. Duffy and K. P. Barr, Phys. Rev., 1968, 165, 647–654 CrossRef CAS.
- J. C. Bonner and M. E. Fisher, Phys. Rev., 1964, 135, A640–A658 CrossRef.
- R. Calvo, M. C. G. Passeggi, N. O. Moreno, G. E. Barberis, A. B. Chaves, B. C. M. Torres, L. Lezama and T. Rojo, Phys. Rev. B: Condens. Matter Mater. Phys., 1999, 60, 1197–1203 CrossRef CAS.
- M. Tachiki, T. Yamada and S. Maekawa, J. Phys. Soc. Jpn., 1970, 29, 656–663 CrossRef CAS.
- M. Tachiki and T. Yamada, J. Phys. Soc. Jpn., 1970, 28, 1413–1425 CrossRef CAS.
- A. Oosawa, M. Ishii and H. Tanaka, J. Phys.: Condens. Matter, 1999, 11, 265–271 CrossRef CAS.
- T. Nikuni, M. Oshikawa, A. Oosawa and H. Tanaka, Phys. Rev. Lett., 2000, 84, 5868–5871 CrossRef CAS PubMed.
Footnote |
| † Electronic supplementary information (ESI) available. CCDC 1942943. For ESI and crystallographic data in CIF or other electronic format see DOI: 10.1039/D0DT00567C |
| This journal is © The Royal Society of Chemistry 2020 |

