The solvent and zinc source dual-induced synthesis of a two dimensional zeolitic imidazolate framework with a farfalle-shape and its crystal transformation to zeolitic imidazolate framework-8†
Chun-Xin
Jin
a,
Yu
Wang
b,
Qiu-Shan
Gao
a,
Dan-Yang
Yao
c,
Si-Hong
Wang
d,
Donghao
Li
 *ad and
Hai-Bo
Shang
 *ad
*ad
aDepartment of Chemistry, Yanbian University, Park Road 977, Yanji City, Jilin Province 133002, China. E-mail: dhli@ybu.edu.cn; hbshang@ybu.edu.cn
bState Key Laboratory of Separation Membranes and Membrane Processes, School of Material Science and Engineering, Tianjin Polytechnic University, Tianjin, 300387, China
cAgricultural college of Yanbian University, Park Road 977, Yanji City, Jilin Province 133002, China
dKey Laboratory of Biological Resources of the Changbai Mountain & Functional Molecules (Yanbian University), Ministry of Education, Park Road 977, Yanji City, Jilin Province 133002, China
First published on 23rd January 2020
Abstract
Exploring new zeolitic imidazolate frameworks (ZIFs) with specific topologies and pore structures is important for extending applications and improving performances. In this work, a new farfalle-shaped ZIF with an ordered hierarchical structure (named ZIF-F) was easily built with zinc acetate and 2-methylimidazole (MeIm) in an aqueous system at room temperature. The synthesis mechanism of ZIF-F is a dual-induction interaction of a solvent and zinc source based on the synthesis protocol of ZIF-8. The prepared ZIF-F is a 3–5 μm dispersible particle constructed from numerous nanoplates with the same building units as ZIF-8. ZIF-F has a rich 4 nm inter-particle spacing with a 0.1074 cm3 g−1 total pore volume and exhibits high thermo- and solvent stability. It is worth noting that crystal transformation could occur from ZIF-F to ZIF-8 in methanol via the dissolution-recrystallization route. Regarding the adsorption of Congo red (CR), ZIF-F exhibits better adsorption capacity (182.82 mg g−1) than ZIF-8 (149.25 mg g−1) with 6 times higher adsorption rate than that of ZIF-8 because of the positive effect of its larger pore size and hierarchical structure.
1. Introduction
Generally, zeolitic imidazolate frameworks (ZIFs) are formed by coordinating with transition metals and imidazolate units to extend frameworks based on tetrahedral topologies.1–3 As important sub-family metal–organic frameworks (MOFs), ZIFs have a fine structure, excellent solvent and thermal stabilities, and a large specific surface area, which are advantageous in gas storage/selective adsorption,4,5 catalysis,6,7 sensing,8,9 and drug delivery.10–12 Although the classical ZIFs, such as ZIF-8, ZIF-7 and ZIF-90, have permanent channels, both their pores and windows are small. For example, ZIF-8 has a 3.4 Å pore window and a 11.4 Å pore cage, hindering diffusion and mass transfer.13 As research on many of the above applications reveals, the performances of ZIFs reasonably depend on the morphological uniformity and pore structure.14–17 Therefore, it is important to explore new ZIFs with specific topologies and rich pore structures to enhance their performances in some applications or develop their potential applications.In general, the strategies for the functionalities of ZIFs include linker modification, size and morphological control, and encapsulation of guest species.18 Tsung et al. endowed ZIF-90 with the functionality of a biocatalyst by encapsulating catalase enzymes into 2 μm single-crystalline crystals.19 Shieh et al. synthesized microporous ZIF-8 on siliceous mesocellular foams (MCF) for enhancing pervaporation of water/ethanol mixtures.20 Nevertheless, the particle size, morphology and pore size of ZIFs could be controlled by varying the solvent, reagent ratio, surfactant, and imidazolate ligands.21,22 Among hundreds of ZIFs, ZIF-8 is the most outstanding framework in research studies. Pan et al. synthesized ZIF-8 with different sizes from ca. 100 nm to 4 μm and altered the morphology from truncated cubic to a rhombic dodecahedron by adding the surfactant cetyltrimethylammonium bromide (CTAB) as a capping agent in aqueous systems.23 Wu et al. used the co-template method involving CTAB and L-Histidine to produce the hierarchical ZIF-8 with both meso- and microporous structures.24 Abdelhamid et al. provided a rapid and template-free approach to synthesize hierarchical porous ZIF-8 and ZIF-L via forming the intermediates of zinc hydroxide nitrate nanosheets.25 Yang et al. synthesized mesoporous ZIF-8 with nanoribbon morphology using a soft template of tri-block copolymer Pluronic F127.26 Most research studies are based on ZIF-8 synthesis by adding other reagents into the preparation system, which generally gives rise to synthesis-complexity. Even more regrettably, there are no new ZIFs being developed.
Herein, a new two dimensional (2D) ZIF with a farfalle-shape was synthesized by the solvent and zinc source dual-induced method based on the synthetic strategy of ZIF-8, which was denoted as ZIF-F. ZIF-F exhibits an ordered hierarchical structure, deriving from the assembly of numerous nanoplates. The stability of ZIF-F with respect to temperature, solvent and pH was studied by the static immersion method. The crystal transformation from ZIF-F to ZIF-8 was also observed. The induced mechanism of solvent and zinc source on the morphology was investigated. The comparative adsorption of Congo red on ZIF-F and ZIF-8 was also carried out.
2. Experimental section
2.1 Materials and chemicals
All the reagents were of analytical grade and used without any pretreatment. Congo red (CR), N,N-dimethylformamide (DMF), Zn(NO3)2·6H2O, Zn(CH3COO)2·2H2O and MeIm were purchased from Aladdin Chemistry Co. Ltd (Shanghai, China). Methanol and dichloromethane (DCM) were obtained from Fisher Chemical Co. Ltd. (Shang, China). Pure water was prepared by using the ultrapure water purification system (Milli-Q Elix Advantage, France) in our laboratory.2.2 Synthesis of ZIF-8 particles
According to the work of Cravillon et al.,27 a solution of Zn(NO3)2·6H2O (0.73 g, 2.5 mmol) in 50 mL of methanol was poured into a solution of MeIm (0.81 g, 1.0 mmol) in 50 mL of methanol and the mixture was stirred continuously for 24 h. White nanoparticles were obtained by centrifugation, washed with methanol and dried overnight at 70 °C.2.3 Synthesis of ZIF-F particles
Zn(CH3COO)2·2H2O (0.27 g, 1.2 mmol) and MeIm (0.41 g, 5.0 mmol) were dissolved in 15 mL of H2O, respectively. The MeIm solution was added into the zinc solution under stirring for 24 h. The product was collected by centrifugation at 8000 rpm for 10 min and then washed with pure water and methanol at least three times, respectively. The white powder was dried overnight at 60 °C for the following experiments.To demonstrate the reproducibility of ZIF-F, the above process was repeated three times. Furthermore, the reactive system was enlarged fivefold but with unchanged concentrations, which meant that Zn(CH3COO)2·2H2O (1.25 g, 6.0 mmol) and MeIm (2.05 g, 25.0 mmol) were dissolved in 75 mL of H2O, respectively.
Parallel experiments were carried out to investigate the effects of solvent and zinc sources. Following the above synthetic protocol, methanol and Zn(NO3)2·6H2O were used to prepare ZIF-F instead of H2O and Zn(CH3COO)2·2H2O with the same volume of solvent and molar ratio of zinc ion and MeIm.
2.4 Adsorption of CR on ZIF-F and ZIF-8
Generally, 10 mg of adsorbents (ZIF-F and ZIF-8) were added into 5 mL of 500 mg L−1 CR solutions for a certain time, respectively. Then the adsorbents were separated from CR solutions by centrifugation and the CR concentration in the solution was investigated by UV-vis absorption spectroscopy. Eqn (1) was used to calculate the adsorption capacity qt (mg g−1) of CR: | (1) |
2.5 Instrument methods
A D/max-2500 diffractometer (Rigaku, Japan) was used to record the powder X-ray diffraction (PXRD) patterns of the prepared nanoparticles measured using Cu Kα radiation (λ = 1.5418 Å). Morphological characterization was carried out using a scanning electron microscope (SEM) (ZEISS G-500, Germany). The Brunauer–Emmett–Teller (BET) surface area, pore size distribution and pore volume of the prepared ZIF-F were measured with N2 adsorption at 77.3 K using a 3H-2000PM1 gas sorption analyzer (BEISHIDE, China). The thermogravimetric (TG) analyses of ZIF-F and ZIF-8 were performed using a TG 209 F3 Tarsus thermal gravimetric analyzer (NETZSCH, Germany) from room temperature to 700 °C at a ramp rate of 10 °C min−1 under air. Quantitative elemental analysis of ZIF-F was performed using a Vario EL CUBE elemental analyzer (Elementar, Germany) and an AA-6800F/G atomic adsorption spectrum (Shimadzu, Japan). The correlative UV-vis analyses were performed using a V-650 spectrometer (JASCO, Japan).3. Results and discussion
3.1 Characterization of ZIF-F
The synthesized ZIF-F was first characterized by PXRD. As shown in Fig. 1a, the patterns of ZIF-F are different from those simulated for ZIF-8, which is prepared with a similar reactant ratio. Shi et al. prepared a hierarchical ZIF with GIS topology (ZIF-GIS) from numerous nanoplates, and ZIF-GIS was isostructural with TIF-5Zn28,29 with the same PXRD patterns. However, the PXRD patterns of ZIF-F are also inconsistent with that of ZIF-GIS. The results demonstrate that ZIF-F is different from the existing ZIFs in the sense that it had a unique topology, whose building blocks are MeIm and zinc acetate.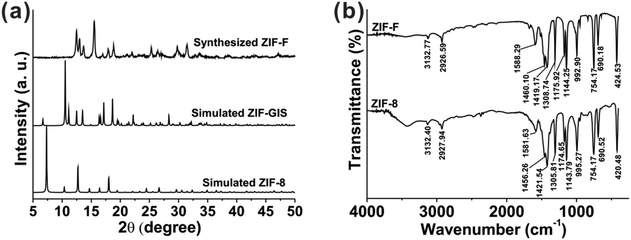 | ||
| Fig. 1 (a) The PXRD patterns of the simulated ZIF-8, simulated ZIF-GIS and synthesized ZIF-F. (b) The FT-IR spectra of the synthesized ZIF-F and ZIF-8. | ||
The composition of ZIF-F found via elemental analysis after activation at 120 °C for 12 h is Zn 26.68, C 40.39, H 4.31, N 23.67, and O 4.95 (wt%) and the calculated molecular formula is Zn(MeIm)2·(H2O)1/2 (C8H11N4O1/2Zn). The TG analysis of ZIF-F in air after activation is shown in Fig. S1.† There is no obvious mass loss at temperatures up to 400 °C, above which decomposition of the framework occurred. The removal of organic ligands results in a mass loss of 63.12% at temperatures up to 700 °C, which corresponds to the calculated mass loss (68.82%). The residue mass is 36.85%, most likely due to ZIF-F totally transforming to ZnO (calc. 33.40%).28,30
As shown in Fig. 1b, the FT-IR spectrum of ZIF-F shows a fair similarity with ZIF-8 in location and number, indicating the same building units as ZIF-8 in spite of the different topological phases.31 According to the attribution and analysis of IR spectrum of previously reported ZIF-8,32–35 the spectrum of ZIF-F is explained as follows: the out-of-plane bending of the MeIm ring is 690.18 and 754.17 cm−1, whereas the peaks between 900 and 1350 cm−1 are assigned as the in-plane bending. The whole ring stretching of MeIm results in the peak at 1421.54 cm−1. The peak at 1588.29 cm−1 is associated with the stretching vibration of C![[double bond, length as m-dash]](https://www.rsc.org/images/entities/char_e001.gif) N specifically, whereas the peaks at 2926.59 and 3132.77 cm−1 are attributed to the stretching vibrations of the aliphatic and aromatic C–H, respectively. The representative peak at 424.53 cm−1 belongs to the Zn–N stretching with a blue shift compared with that of ZIF-8 (420.48 cm−1), probably due to the different Zn–N coordination models.31
N specifically, whereas the peaks at 2926.59 and 3132.77 cm−1 are attributed to the stretching vibrations of the aliphatic and aromatic C–H, respectively. The representative peak at 424.53 cm−1 belongs to the Zn–N stretching with a blue shift compared with that of ZIF-8 (420.48 cm−1), probably due to the different Zn–N coordination models.31
As shown in Fig. 2, the farfalle-like ZIF-F microparticles are about 3–5 μm with a good dispersion. The high-magnification image reveals that ZIF-F consists of numerous nanoplates with an unsmooth surface via the order assembly. It is noticeable that the farfalle-like ZIF is first synthesized at room temperature.
As is well known, different solvents, zinc sources or organic additives can control the morphology and pore structure, and even produce new ZIFs. Compared with the synthesis procedure of ZIF-8, the organic linker and the molar ratio of MeIm to zinc ions are the same as those used for the synthesis of ZIF-F. So, Zn(NO3)2·6H2O and methanol were used to estimate the effects of the zinc source and solvent. When Zn(NO3)2·6H2O was introduced instead of Zn(CH3COO)2·2H2O, ZIF-F could not be synthesized. The XRD patterns of the product with a wafer shape are distinct from those of ZIF-8 (Fig. 3a). Although ZIF-8 could be synthesized with Zn(NO3)2·6H2O and MeIm in an aqueous system at room temperature, a structure directing agent or high MeIm/Zn ratio (more than 20) is essential to produce pure ZIF-8.36,37 A very low ratio of MeIm/Zn results in the formation of irregular products due to the presence of by-products. As expected, when the zinc source is Zn(NO3)2·6H2O (Fig. 3b) or Zn(CH3COO)2·2H2O (Fig. 3c), the products, obtained by using methanol instead of water, are both ZIF-8, which can be proved based on the XRD patterns and SEM images. The particles prepared using zinc nitrate in a methanol system are smaller than those prepared with zinc acetate, possibly because of the fast reaction rate of zinc nitrate. The above results demonstrate that ZIF-F is synthesized by the dual-induction of the solvent and zinc source based on ZIF-8 synthesis with the MeIm/Zn molar ratio of 4.
Furthermore, SEM/EDX analyses were performed to explain the chemical composition and formation mechanism of the farfalle-shaped structure. As shown in Fig. S2,† the N to Zn molar ratio of ZIF-F calculated from the elemental weights (%) by EDX analysis is 4.14![[thin space (1/6-em)]](https://www.rsc.org/images/entities/char_2009.gif) :
:![[thin space (1/6-em)]](https://www.rsc.org/images/entities/char_2009.gif) 1, which is close to the simulated elemental ratio (4
1, which is close to the simulated elemental ratio (4![[thin space (1/6-em)]](https://www.rsc.org/images/entities/char_2009.gif) :
:![[thin space (1/6-em)]](https://www.rsc.org/images/entities/char_2009.gif) 1) of ZIF-8. However, in an aqueous system, especially with zinc acetate precursors, a higher MeIm concentration, that is an MeIm/Zn ratio of more than 20, is generally required to obtain pure ZIF-8; but ZIF-F is synthesized at a lower MeIm/Zn ratio (4
1) of ZIF-8. However, in an aqueous system, especially with zinc acetate precursors, a higher MeIm concentration, that is an MeIm/Zn ratio of more than 20, is generally required to obtain pure ZIF-8; but ZIF-F is synthesized at a lower MeIm/Zn ratio (4![[thin space (1/6-em)]](https://www.rsc.org/images/entities/char_2009.gif) :
:![[thin space (1/6-em)]](https://www.rsc.org/images/entities/char_2009.gif) 1). In combination with the FT-IR results, the above results demonstrate that obtaining ZIF-F with a 2D flake structure, the intermediate form of ZIF-8, is highly possible and suggest that the other zinc-based clusters can be obtained at a lower MeIm/Zn molar ratio with less deprotonated linkers in the aqueous system, which limits the intermediate phase transformation.31
1). In combination with the FT-IR results, the above results demonstrate that obtaining ZIF-F with a 2D flake structure, the intermediate form of ZIF-8, is highly possible and suggest that the other zinc-based clusters can be obtained at a lower MeIm/Zn molar ratio with less deprotonated linkers in the aqueous system, which limits the intermediate phase transformation.31
3.2 Reproducibility
To indicate the reproducibility of the synthetic process, both repeating the synthesis and expanding the synthesis system were carried out (Fig. S3 and S4†). The XRD patterns of the reproduced ZIF-F are identical to those of the farfalle-shaped ZIF. Thankfully, ZIF-F was also obtained successfully when the synthesis system was expanded fivefold, although the concentrations of the precursors were kept unchanged. Although ZIF-F is an intermediate phase, the synthetic process can be certainly reproduced3.3 Thermal stability
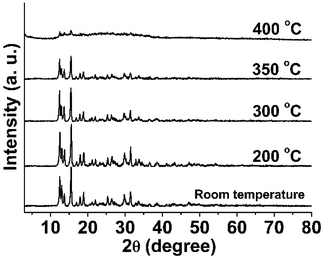
Thermal and chemical stability are important properties of ZIFs and the foundation of their application. To investigate the thermal stability, ZIF-F powder was heated for 12 h under different temperatures (200, 300, 350, and 400 °C). As shown in Fig. 4, there were no obvious changes in the XRD patterns upon treatment at 200 to 300 °C, but the intensity of the characteristic peaks decreased noticeably at 350 °C and even disappeared after being heated for 12 h at 400 °C, which indicates that ZIF-F had started to decompose. The colour of ZIF-F had changed from white at room temperature to brown after thermal treatment. While the SEM results show that the farfalle-shape of ZIF-F was maintained well until 400 °C, it then started to collapse obviously (Fig. S5†). The above results are consistent with the TG analysis of ZIF-F without high-heat treatment showing the beginning of collapse at about 350 °C (Fig. S1†). Not only this, the TG analysis of the calcined samples was also performed. The higher the calcination temperature, the greater the residual mass (Fig. S6†) upto 41.9% of the sample after 400 °C treatment, further indicating that ZIF-F had started to partially decompose from 350 °C. For comparison, the TG analysis of ZIF-8 is also shown in Fig. S7† with almost the same change as ZIF-F without thermal treatment. The above results indicate that ZIF-F possesses a high thermostability in air matching that of ZIF-8.3.4 Chemical stability and crystal transformation
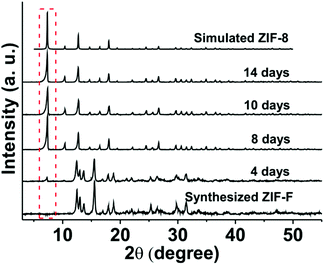
The chemical stability of ZIF-F was first examined in pH 1, 2, and 13 aqueous solutions for 1–3 days, which were prepared with 1 mol L−1 NaOH and 1 mol L−1 HCl. While the structure of ZIF-F can be maintained in pH 2 and 13 aqueous solutions for 3 days, ZIF-F transformed into another crystalline material after immersing in pH 1 aqueous solution for 1 day (Fig. S8†).The solvent stability of ZIF-F was further estimated in methanol, DMF, DCM and toluene for 4–14 days. As shown in Fig. S9,† ZIF-F demonstrates better solvent stability in DMF, DCM and toluene at room temperature with complete crystallinity. However, the characteristic peak of ZIF-8 formed at 2θ = 7.34° beside the complete patterns of ZIF-F after immersion in methanol at room temperature for 4 days. Furthermore, upon extended immersion in methanol, all the characteristic peaks of ZIF-8 that matched with those of the simulated ones were formed (Fig. 5). Meanwhile, ZIF-F retains the farfalle-like morphology even after treatment in DMF, DCM and toluene (Fig. S10†). Upon treatment with methanol, a few ZIF-F particles transformed to ZIF-8 with a rhombic dodecahedron shape after 4 days, and finally they transformed to pure ZIF-8 as expected (Fig. 6), which is in agreement with the PXRD results. The above results also indicate that ZIF-F is the intermediate of ZIF-8, which can transform to ZIF-8 in methanol, similar to that from ZIF-L to ZIF-8.35
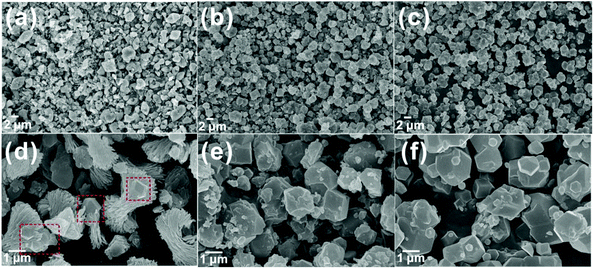 | ||
| Fig. 6 The SEM images of ZIF-F after immersion in methanol for 4 days (a and d), 8 days (b and e) and 14 days (c and f). | ||
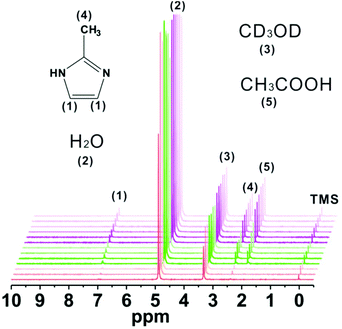
The common crystal transformation mechanisms are dissolution-recrystallization and geometric contraction (R2 model). According to the above SEM and PXRD results, ZIF-8 and ZIF-F with the same composition coexisted perfectly with each appearing upon crystal transformation. So, we assume the dissolution-recrystallization route for the work. Furthermore, the phase transformation process was monitored by in situ1H NMR (Fig. 7). The signals at 2.4 and 7.0 ppm are assigned to –CH3 and –CH of MeIm, respectively, and the resonance peak at 2.0 ppm is ascribed to –CH3 of acetic acid. The other peaks are from H2O, CD3OD, and TMS in commercial CD3OD. The change in the concentration of MeIm is indicated by the intensity of two peaks at 2.4 and 7 ppm. At the initial stage, the amount of MeIm increases with the release of MeIm from the framework due to a gradual dissolution (red lines) and then the amount of MeIm keeps stable during the balance stage between the dissolution of ZIF-F and the recrystallization of ZIF-8 (green lines). Upon completion of phase transformation, the MeIm molecules in the cavities of ZIF-F are released fully because of dissolution, and hence the concentration of MeIm further increases (purple red lines). Remarkably, the presence of a peak at 2 ppm which corresponds to the –CH3 of acetic acid until the balance stage adds evidence to support the dissolution process because the acetic acid molecules only come from the cavities or the framework of ZIF-F. Based on the results of in situ1H NMR, the normalized transformation curve (α-time) was put forward by integrating the peak at 2.4 ppm and assigning a value of 100 to the internal standard peak (TMS, 0.0 ppm) (Fig. S11†). The curve presents clearly three stages similar to the structural evolution of ZIF-8.38 In the first stage, both the gradual collapse of ZIF-F and nucleation of ZIF-8 occur simultaneously with the increase in the relative crystallinity of ZIF-8. More remarkably, the transformation kinetics in this regime accords better with Avrami's classical model (R2 = 0.9708) (eqn (S1) and (S2)†).39 As shown in Fig. S12,†k is the scaling constant with a value of 1.3 × 10⁻⁴ and n is the Avrami's constant with a value of 2.39, which suggests instantaneous nucleation in our case. The second and third stages are attributed to the crystal phase transition and the stationary periods, respectively.
3.4 Sorption studies
To investigate its porosity, ZIF-F was subjected to N2 adsorption experiment after degassing at 150 °C. A type-IV isotherm was obtained with a weak hysteresis-loop in the range of 0.5–1.0P/P0 with the adsorption characteristic of mesoporous materials, but at low pressures, the sorption isotherm does not show a significant uptake, which indicates that ZIF-F is dense and not porous as other ZIFs (Fig. S13a†). Furthermore, in the wide distribution of pore size, the maximum peak at ca. 4 nm is likely due to inter-particle spacing (Fig. S13b†), and the BET surface area (25 m2 g−1) is also consistent with inter-particle porosity.3.5 Adsorption of Congo red
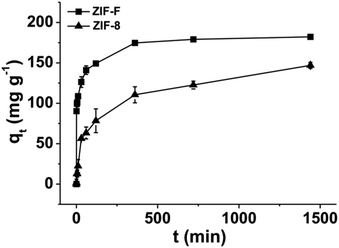
Similar to ZIF-8, ZIF-F shows a good adsorption capacity for Congo red (CR) when the initial concentration of CR is 500 mg L−1, probably due to the same building units (Fig. 8). Although the BET surface area of ZIF-F is much less than that of ZIF-8, the adsorption equilibrium of ZIF-F was reached in just 6 h due to the relatively rapid adsorption compared to 24 h for ZIF-8. Furthermore, the adsorption kinetics of CR on ZIF-F and ZIF-8 are both better fitted with the pseudo-second-order kinetic model with good linearity than the pseudo-first-order kinetic model (Fig. S14†). The kinetic parameters are summarized in Table S1.† The calculated rate constant (k2) of CR on ZIF-F (k2 = 4.93 × 10⁻⁴ g mg−1 min−1) is much larger than that on ZIF-8 (k2 = 8.69 × 10⁻⁵ g mg−1 min−1), which confirms the faster adsorption on ZIF-F. The above results demonstrate that the hierarchical structure is the key factor for CR adsorption on ZIF-F rather than the BET surface area. Although the larger inter-particle spacing (about 40 Å) and pore volume help in multi-layer adsorption, it is difficult to follow up for ZIF-8 despite the gate opening. Certainly, the π–π interaction and electrostatic interaction are also conducive to CR adsorption on ZIF-F.4. Conclusions
In conclusion, a new 2D ZIF-F was synthesized via the dual-induction of solvent (H2O) and zinc source (zinc acetate). The farfalle-shaped ZIF-F has a hierarchical ordered structure with the same units as ZIF-8. Besides the high chemical and thermal stabilities, ZIF-F could transform to ZIF-8 in methanol at room temperature through the dissolution-recrystallization stage, which provides evidence that ZIF-8 is an intermediate. Furthermore, the better and faster adsorption for CR in water samples by ZIF-F shows that the orderly hierarchical structure is beneficial for efficient adsorption.Conflicts of interest
The authors declare no competing financial interest.Acknowledgements
This work was supported by the National Natural Science Foundation of China (no. 21775134, 21904113, and 21964017), the PhD Research Startup Foundation of Yanbian University (no. 602018017) and the Undergraduate Innovation and Entrepreneurship Training Program of Yanbian University (no. 201910184018). The authors thank M. A. Xin-Yun Zhang (Yanbian University) for providing inspiration and also suggestions for naming new materials.References
- A. Phan, C. J. Doonan, F. J. Uribe-Romo, C. B. Knobler, M. O'Keeffe and O. M. Yaghi, Acc. Chem. Res., 2010, 43, 58–67 CrossRef PubMed.
- N. Cheng, L. Ren, X. Xu, Y. Du and S. X. Dou, Adv. Energy Mater., 2018, 8, 1801257 CrossRef.
- Y. V. Kaneti, S. Dutta, M. S. A. Hossain, M. J. A. Shiddiky, K.-L. Tung, F.-K. Shieh, C.-K. Tsung, K. C.-W. Wu and Y. Yamauchi, Adv. Mater., 2017, 29, 1700213 CrossRef PubMed.
- L. Frentzel-Beyme, M. KloSs, P. Kolodzeiski, R. Pallach and S. Henke, J. Am. Chem. Soc., 2019, 141, 12362–12371 CrossRef PubMed.
- V. Timon, M. L. Senent and M. Hochlaf, Microporous Mesoporous Mater., 2015, 218, 33–41 CrossRef.
- A. Zanon, S. Chaemchuen and F. Verpoort, Catal. Lett., 2017, 147, 2410–2420 CrossRef.
- V. Armel, S. Hindocha, F. Salles, S. Bennett, D. Jones and F. Jaouen, J. Am. Chem. Soc., 2017, 139, 453–464 CrossRef PubMed.
- T. Zhou, Y. Sang, X. Wang, C. Wu, D. Zeng and C. Xie, Sens. Actuators, B, 2018, 258, 1099–1106 CrossRef.
- W. Chen, D. Ji, Y. Zhang, P. Xu, X. Gao, J. Fang, X. Li, L. Feng and W. Wen, Nanotechnology, 2019, 30, 335708 CrossRef PubMed.
- L. He, K. Pang, W. Liu, Y. Tian, L. Chang, X. Liu, M. Zhao, Y. Liu, Y. Li, X. Jiang, R. Song and Y. Liu, J. Mater. Chem. B, 2019, 7, 1050–1055 RSC.
- J. Fang, Y. Yang, W. Xiao, B. Zheng, Y.-B. Lv, X.-L. Liu and J. Ding, Nanoscale, 2016, 8, 3259–3263 RSC.
- L. Wang, H. Zhu, Y. Shi, Y. Ge, X. Feng, R. Liu, Y. Li, Y. Ma and L. Wang, Nanoscale, 2018, 10, 11384–11391 RSC.
- N. Chang, Z.-Y. Gu and X.-P. Yan, J. Am. Chem. Soc., 2010, 132, 13645–13647 CrossRef PubMed.
- D. Liu, D. Zou, H. Zhu and J. Zhang, Small, 2018, 14, 1801454 CrossRef PubMed.
- C. Duan, F. Li, M. Yang, H. Zhang, Y. Wu and H. Xi, Ind. Eng. Chem. Res., 2018, 57, 15385–15394 Search PubMed.
- A. Ahmed, M. Forster, J. Jin, P. Myers and H. Zhang, ACS Appl. Mater. Interfaces, 2015, 7, 18054–18063 CrossRef.
- J. Cui, Y. Feng, T. Lin, Z. Tan, C. Zhong and S. Jia, ACS Appl. Mater. Interfaces, 2017, 9, 10587–10594 CrossRef PubMed.
- Y. V. Kaneti, S. Dutta, M. S. A. Hossain, M. J. A. Shiddiky, K.-L Tung, F.-K Shieh, C.-K. Tsung, K. C.-W. Wu and Y. Yamauchi, Adv. Mater., 2017, 29, 1700213 CrossRef PubMed.
- F.-K. Shieh, S.-C. Wang, C.-I. Yen, C.-C. Wu, S. Dutta, L.-Y. Chou, J. V. Morabito, P. Hu, M.-H. Hsu, K. C.-W. Wu and C.-K. Tsung, J. Am. Chem. Soc., 2015, 137, 4276–4279 CrossRef PubMed.
- Y.-C. Sue, J.-W. Wu, S.-E. Chung, C.-H. Kang, K.-L. Tung, K. C.-W. Wu and F.-K. Shieh, ACS Appl. Mater. Interfaces, 2014, 6, 5192–5198 CrossRef PubMed.
- Z. Xin, X. Chen, Q. Wang, Q. Chen and Q. Zhang, Microporous Mesoporous Mater., 2013, 169, 218–221 CrossRef.
- D. Bradshaw, S. El-Hankari and L. Lupica-Spagnolo, Chem. Soc. Rev., 2014, 43, 5431–5443 RSC.
- Y. Pan, D. Heryadi, F. Zhou, L. Zhao, G. Lestari, H. Su and Z. Lai, CrystEngComm, 2011, 13, 6937–6940 RSC.
- Y.-n. Wu, M. Zhou, B. Zhang, B. Wu, J. Li, J. Qiao, X. Guan and F. Li, Nanoscale, 2014, 6, 1105–1112 RSC.
- H. N. Abdelhamid and X. Zou, Green Chem., 2018, 20, 1074–1084 RSC.
- X. Yang, W. Chen, H. Bian, T. Sun, Y. Du, Z. Zhang, W. Zhang, Y. Li, X. Chen and F. Wang, Chem. – Eur. J., 2018, 24, 11185–11192 CrossRef.
- J. Cravillon, R. Nayuk, S. Springer, A. Feldhoff, K. Huber and M. Wiebcke, Chem. Mater., 2011, 23, 2130–2141 CrossRef.
- Q. Shi, Z. Song, X. Kang, J. Dong and Y. Zhang, CrystEngComm, 2012, 14, 8280–8285 RSC.
- T. Wu, X. Bu, J. Zhang and P. Feng, Chem. Mater., 2008, 20, 7377–7382 CrossRef.
- R. Chen, J. Yao, Q. Gu, S. Smeets, C. Baerlocher, H. Gu, D. Zhu, W. Morris, O. M. Yaghi and H. Wang, Chem. Commun., 2013, 49, 9500–9502 RSC.
- M. Jian, B. Liu, R. Liu, J. Qu, H. Wang and X. Zhang, RSC Adv., 2015, 5, 48433–48441 RSC.
- Y. Hu, H. Kazemian, S. Rohani, Y. Huang and Y. Song, Chem. Commun., 2011, 47, 12694–12696 RSC.
- M. He, J. Yao, Q. Liu, K. Wang, F. Chen and H. Wang, Microporous Mesoporous Mater., 2014, 184, 55–60 CrossRef CAS.
- Y. Hu, Z. Liu, J. Xu, Y. Huang and Y. Song, J. Am. Chem. Soc., 2013, 135, 9287–9290 CrossRef CAS.
- Z.-X. Low, J. Yao, Q. Liu, M. He, Z. Wang, A. K. Suresh, J. Bellare and H. Wang, Cryst. Growth Des., 2014, 14, 6589–6598 CrossRef CAS.
- A. F. Gross, E. Sherman and J. J. Vajo, Dalton Trans., 2012, 41, 5458–5460 RSC.
- K. Kida, M. Okita, K. Fujita, S. Tanaka and Y. Miyake, CrystEngComm, 2013, 15, 1794–1801 RSC.
- S. R. Venna, J. B. Jasinski and M. A. Carreon, J. Am. Chem. Soc., 2010, 132, 18030–18033 CrossRef CAS.
- I. H. Hillier, J. Polym. Sci., Part A: Gen. Pap., 1965, 3, 3067–3078 CrossRef CAS.
Footnote |
| † Electronic supplementary information (ESI) available. See DOI: 10.1039/C9DT04747F |
| This journal is © The Royal Society of Chemistry 2020 |


