 Open Access Article
Creative Commons Attribution 3.0 Unported Licence
Selective hydrogen production from formic acid decomposition over Mo carbides supported on carbon materials†
D. H.
Carrales-Alvarado
a,
A. B.
Dongil
*a,
J. M.
Fernández-Morales
 b,
M.
Fernández-García
 ac,
A.
Guerrero-Ruiz
 bc and
I.
Rodríguez-Ramos
 *ac
*ac
aInstituto de Catálisis y Petroleoquímica, CSIC, c/Marie Curie No. 2, Cantoblanco, 28049 Madrid, Spain. E-mail: a.dongil@csic.es
bDpto. Química Inorgánica y Técnica, Facultad de Ciencias UNED, Senda del Rey 9, 28040 Madrid, Spain
cUA UNED-ICP (CSIC), Grupo de Diseño y Aplicación de Catalizadores Heterogéneos, Madrid, Spain
First published on 15th July 2020
Abstract
The decomposition of formic acid to obtain hydrogen has been studied using molybdenum carbides supported on activated carbon and two high surface area graphites, H200 (200 m2 g−1) and H400 (400 m2 g−1). Particular attention is paid to the effect of Mo loading. The catalysts were prepared in situ using a mixture of CH4 and H2 at a temperature of up to 700 °C. Under these conditions, carburization was mostly complete. We observed that the support influenced the MoxC phase obtained so that it seems that the ratio of defective carbon influences the phase. However, for these materials the C/Mo ratio did not influence the obtained crystal phase. Characterization by XRD showed that while the β-Mo2C phase was obtained over activated carbon and over H200, in contrast, MoOxCy was obtained over H400. These catalysts reached 100% conversion on formic acid decomposition at temperatures in the range of 190–250 °C and were also highly selective under these mild conditions, with values for CO2 selectivity in the range of 85.0–96.5%. The best results were achieved over a 10 wt% Mo loading on activated carbon that reached 96.5% selectivity to H2. Also, changes in the molybdenum phases were observed on the spent catalyst. Some redox transformations during reaction were responsible for the transformation of β-Mo2C into oxycarbide MoOxCy. In summary, the results of the catalytic performance indicated that the β-Mo2C phase was more active, selective and stable than MoOxCy under the studied conditions.
1. Introduction
The need to substitute fossil sources with other more environmentally friendly alternatives that match current energy schemes has prompted research on more sustainable energy sources. One of the possibilities is to use hydrogen as an energy vector as it is well known to have a high energy density per mass, and it produces only water upon combustion. However, hydrogen actually holds a low energy per unit volume in the gas phase; thus, it would occupy a large volume which limits its widespread application. Alternatively, hydrogen can be stored in other molecules that are more easily handled and that decompose into hydrogen when required.1 Among them, formic acid, HCOOH, represents an interesting alternative since it offers a high content of hydrogen (4.3 wt%), it is safe and it is produced in large quantities in biorefineries as a subproduct of the Biofine process.2 Its attractiveness is also due to the soft conditions required to decompose it into hydrogen and carbon dioxide in the presence of a catalyst. However, under reaction conditions the catalyst may also promote the dehydration reaction of formic acid, producing carbon monoxide and water, which is an undesirable reaction path not only because of the lower hydrogen production but also because carbon monoxide is a poison of catalysts, especially those most commonly employed in fuel cells such as Pt.3Formic acid decomposition over heterogeneous catalysts has been studied over metals in their reduced state,4 metal oxides and, more recently, immobilized noble metal complexes.5 Despite the clear potential of these latter systems that could provide a high atom efficiency, their high cost and low stability complicates industrial application.
Moreover, an attractive catalyst should also be easy to synthesize using an environmentally safe process and be cost effective. Some studies using oxides such as α-Fe2O3, pure Al2O3 and MgO-doped Al2O3 appeared; however, their activity and selectivity is low even at temperatures above 200 °C.6,7
In this context, the use of transition metal carbides emerges as an interesting alternative since they have proven to be very active and selective in several reactions. The reason for these results seems to be their structural similarity to Pt group metals. The potential of molybdenum carbide in the production of hydrogen by decomposition of several starting molecules such as methanol or formic acid has already been assessed.8–10 It was demonstrated that decomposition of formic acid over molybdenum carbide surfaces was enhanced compared to metallic molybdenum even at low temperatures.9 Indeed, the selectivity obtained over C–Mo (110) was 15 times higher than over Mo (110).
Other authors studied the effect of the carbon source on unsupported molybdenum carbide structure and its relation to formic acid decomposition.11 One of the challenges of molybdenum carbide to be used in heterogeneous catalysis is obtaining a high surface area material to maximize the activity. In this respect, some alternative synthetic procedures such as those using other carbon precursors have been studied, but still surface areas below 40 m2 g−1 were obtained.12 Another possibility is to support the carbide on a high surface area material. In this sense, the use of carbon supports can be beneficial for several reasons. The carbon support may favour the formation of the carbide by providing an additional carbon source for the synthesis. Also, since water might be produced during the reaction, a hydrophobic and stable support under such conditions is preferred.
The effect of the nature of the carbon support and its influence on the catalytic performance on reactions like steam reforming of methanol or dry reforming of methane have been reported.13
Still, the catalytic behaviour of carbon-supported molybdenum carbide in formic acid decomposition has been scarcely investigated and assessing the effect of its structure is highly challenging and not fully understood.
Hence, we have studied the synthesis of molybdenum carbide using a mixture of CH4 and H2 over two commercial high surface area graphites and we have compared their performance with the activated carbon supported counterpart to evaluate the effect of the graphitic structure.
2. Results
2.1 Characterization
The external surface area of the catalysts was measured for each sample and results are summarized in Table 1. The SBET of the parent supports is 950, 400 and 200 m2 g−1 for AC, H400 and H200, respectively. It can be observed that SBET decreases as the amount of carbide increases. The reduction of SBET for the high surface area graphite-based catalysts is higher than the expected value due to the weight percentage of carbide on the surface. The loss of surface area in carbon supports upon carburization has been well reported and ascribed to pore blocking due to carbon growth during the carburization and/or the metal nanoparticles or to partial gasification of the support.14 However, considering the structure of high surface area graphites, the observed decrease in surface area is likely due to the agglomeration of the graphite particles upon thermal treatment. The higher loss of surface area on active carbon could be ascribed either to the easier gasification of carbon on that material or particularly to its large number of pores in the microporous range which are easily blocked. The external surface area of the activated carbon without micropores is 400 m2 g−1.| Catalyst | S BET (m2 g−1) | d TEM (nm) | Mo/CXPS | Activity (mol CO2/mol Mo h−1) |
|---|---|---|---|---|
| 5MoxC/H400 | 217 | 2.0 | 0.0049 | 85 |
| 10MoxC/H400 | 213 | 2.2 | 0.0103 | 112 |
| 20MoxC/H400 | 204 | 3.8 | 0.0105 | 73 |
| 10MoxC/H200 | 107 | na | — | 61 |
| 20MoxC/H200 | 72 | 8.1 | — | 10 |
| 10MoxC/AC | 377 | 2.1 | — | 240 |
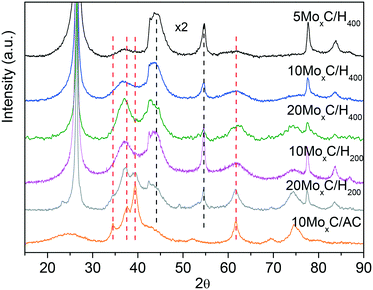
Diffractograms of molybdenum carbide samples, shown in Fig. 1, differ depending mainly on the type of support.
The XRD patterns of 10MoxC/AC and 20MoxC/H200 show quite sharp diffractions at 2θ of 34.4°, 37.7°, 39.4° and 61.5°. On the other hand, the catalysts prepared over H400, 5–20 wt% Mo and 10MoxC/H200, display similar XRD profiles showing wide diffractions with maxima shifted to lower angles, ca. 2θ of 36.7–36.9°, compared to 20MoxC/H200 and 10MoxC/AC, suggesting the contribution of several phases and/or the amorphous structure of the resulting supported nanoparticles. Moreover, none of the XRD patterns of the fresh catalysts prepared over H400 and AC display diffractions of the oxide phases, confirming that the carburization treatment was mostly effective. Nonetheless, the XRD pattern of the catalyst 20MoxC/H200 shows two small diffraction peaks at 2θ of 23.7° and 49.1° corresponding to MoO3 (JCPDS-PDF 05-0508 and 76-1003).
There are several reports with different assignations for the XRD and no clear consensus exists. In order to assess the carburisation mechanism taking place and the obtained structures, we followed the synthesis of 10MoxC/H400 using in situ Mo K-edge X-ray absorption near-edge spectroscopy (XANES). The Mo K-edge spectra, shown in Fig. S1,† show the evolution of molybdenum species under a CH4/H2/He atmosphere during the temperature treatment. Application of principal component analysis (PCA)15 to this set of spectra evaluates the number of Mo chemical species involved during the synthesis process and their concentration evolution. This information is summarized in Fig. 2. The absorption edges (obtained using the derivatives of the spectra) were used to estimate the oxidation state of each species by using the linear correlation obtained with the reference Mo compounds (see Fig. S2 and S3†). In Fig. 2B, the two Mo6+ species spectra exhibit similar characteristics to those of the AHM reference with a pre-edge feature in the spectra that does not appear in the other Mo species. Thus, the sample initially contains the supported ammonium heptamolybdate (AHM), in which Mo6+ is in six-fold coordinated sites (see reference spectra in Fig. S3†). It is possible to observe three characteristic XANES resonances whose relative intensity is influenced by the local order around Mo atoms in octahedral symmetry.16 Upon heating, the supported AHM is transformed into another Mo6+ species also in octahedral coordination, a molybdenum oxide type structure whose XANES spectrum shows a higher intensity of the second XANES resonance relative to the first and third. This indicates changes in the specific surrounding environment of Mo atoms, likely an increase in the cluster size of the molybdenum oxide.16 This process takes place up to 350 °C when the first Mo6+ is mostly absent. Meanwhile, a Mo2+ species ascribed to molybdenum oxycarbide,16 MoOxCy, starts to appear at 300 °C while the second Mo6+ species decreases. In the temperature range of ca. 400–600 °C, the fraction of MoOxCy is mostly constant, indicating that simultaneous formation and consumption of MoOxCy take place with parallel formation of a Mo1+ species with XANES spectrum similar to that corresponding to the molybdenum carbide phase β-Mo2C (Fig. S2†). Upon heating up to 700 °C, it resulted in further carburisation with a final proportion of ca. 90% of β-Mo2C and 10% of MoOxCy.
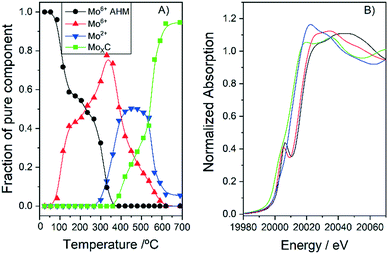 | ||
| Fig. 2 Concentration profiles (A) and Mo K-edge XANES spectra (B) of the different pure Mo species observed during the synthesis of 10MoxC/H400. | ||
Based on XANES experiments we can now assign the XRD peaks as follows. The diffraction peaks observed for the catalyst 10MoxC/AC correspond to the (100), (002), (101) and (110) planes of the β-Mo2C hcp phase (JCPDS-PDF 77-0720). The higher angle at which the maximum is observed for the other catalysts would be in agreement with the presence of the MoOxCy phase that holds a face-centered-cubic (fcc) structure with diffraction peaks at 37.1°, 44.1° and 62.9°.17,18 It must be noted, however, that XANES showed a higher proportion of β-Mo2C on the selected 10MoxC/H400 sample than that observed by XRD. This can be attributed to the small size of the supported carbide particles which would be below the detection limit of XRD, i.e. <5 nm, as the TEM images in Fig. 3 and S4† also confirmed. In contrast, for 10MoxC/AC, both large and small particles are carburised as the XRD and HRTEM images showed. For this sample, well-resolved lattice fringes of 0.23 nm that correspond to the β-Mo2C (101) planes are observed in particles as small as 2 nm. Similar findings are observed for 10MoxC/H400, for which β-Mo2C (101) is also observed in small particles.
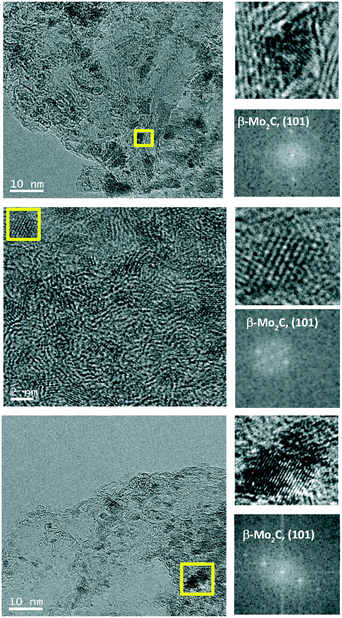 | ||
| Fig. 3 Typical HRTEM images of 10MoxC/H400 (top); 10MoxC/AC (middle) and 20MoxC/H200 (bottom) and the corresponding fast-Fourier transform (FFT) pattern. | ||
Hence, it can as well be inferred that larger particles are more difficult to carburise. This is in agreement with the diffraction peaks ascribed to MoO3 observed on 20MoxC/H200 which is the sample with the largest particle size, ca. 8.1 nm, as estimated by TEM and shown in Table 1.
The XRD patterns of the samples with different Mo loading also seem to indicate that under the studied conditions the Mo/C loading did not influence the obtained carbide phase.
It has been reported that the synthesis of molybdenum carbides through the TPR method may follow one of these paths: (a) first, the decomposition of the molybdate precursor into MoO3 takes place, which is then reduced to MoO2 to finally result in β-Mo2C. (b) Alternatively, after MoO3 formation, this oxide may undergo partial carburization to an oxycarbide MoOxCy, which is eventually transformed into β-Mo2C.19 This latter path, proposed in the literature, agrees quite well with the XANES results obtained in the present work, where both oxycarbide and β phases are observed.
With the aim of gaining more information on the synthesis mechanism and the effect of the support, additional XANES experiments were performed with the 20MoxC/H400 sample but in a H2/He atmosphere. The analysis of the in situ Mo K-edge XANES spectra (Fig. S5†) showed that the same MoO3, MoOxCy and β-Mo2C species are obtained as when CH4/H2/He is employed over the 10MoxC/H400 sample (see Fig. 2 and 4). These results suggest that under the studied conditions, the carbon source that afforded the carbide is the support itself independently of the reaction atmosphere. Similar results were reported previously for temperatures below 600 °C.19 The slight differences between samples, i.e. the 20MoxC/H400 is somewhat more resistant to reduction, in agreement with XRD experiments, may be attributed to effects of the different particle sizes in the samples (Table 1). The 20MoxC/H400 sample with larger particles is more difficult to carburize.
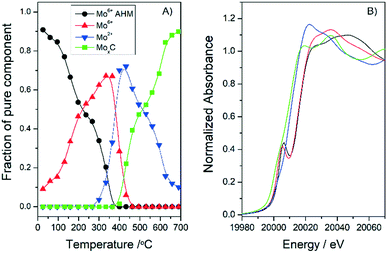 | ||
| Fig. 4 Concentration profiles (A) and Mo K-edge XANES spectra (B) of the different pure Mo species observed during the treatment of Mo20/H400 in a H2/He atmosphere. | ||
Also, considering these stages, it is reasonable to presume that the availability of more reactive carbon atoms from the support would aid in the formation of β-Mo2C. In this sense, the carbon supports are characterized by their different proportions of edges to basal planes, i.e. the size of the graphitic layers, so that a higher proportion of edges means more reactive carbon. This feature is given by the Raman spectra that allow comparison by using the intensity of the so-called D and G bands.20 The Raman spectra of the supports (in Fig. S6)† used in the present work show that the ID/IG ratio follows the trend AC > H400 > H200. Since external CH4 does not seem to be involved in the carburisation mechanism, we performed H2-TPR experiments coupled to mass spectrometry on the impregnated samples 10MoxC/H200, 10MoxC/H400 and 10MoxC/AC to assess for differences among the supports. The masses corresponding to the main fragments of H2O (m/z 18), CO (m/z 28), CO2 (m/z 44) and NH3 (m/z 17) and the secondary fragments of CH4 (m/z 14) were followed along with other secondary fragments of H2O and NH3 (m/z 16, 15) and are shown in Fig. 5.
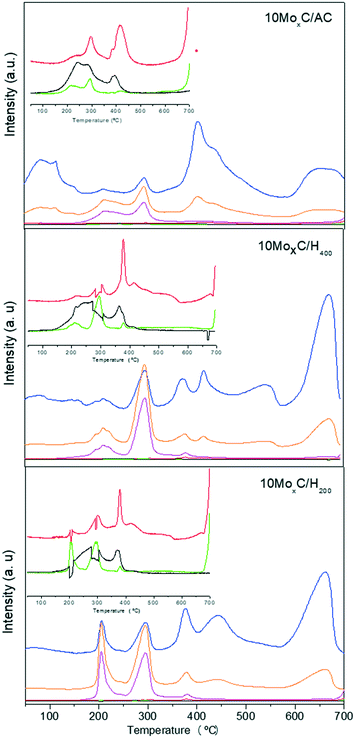 | ||
Fig. 5 MS profiles during H2-TPR of impregnated samples. m/z: ( ) 14, ( ) 14, ( ) 16, ( ) 16, ( ) 17, ( ) 17, ( ) 18, ( ) 18, ( ) 28, ( ) 28, (![[thick line, graph caption]](https://www.rsc.org/images/entities/char_e117.gif) ) 44. ) 44. | ||
The three samples displayed the evolution of m/z 18–16 and 17 with the maxima at 200–210 °C and 290 °C in a proportion that indicates they correspond to NH3 and H2O. These gases would be generated from the decomposition of the precursor, AHM, and the temperature range agrees with that observed in XANES for this transformation.
At higher temperatures, the profile is different for 10MoxC/AC. This sample shows a maximum at 400 °C in which contributions of m/z 18–16 are observed in a proportion that suggests that they correspond to H2O. The same masses are observed at ca. 600 °C but the intensity of these latter peaks is lower. Small intense signals for m/z 28 and 44 at ca. 290 °C and 415 °C are also observed. The samples 10MoxC/H200 and 10MoxC/H400 also display contributions of m/z 18–16 which can be ascribed to H2O. However, the maxima appeared at 400 °C and 660 °C, the latter being the most intense peak. Also, simultaneous evolution of m/z 28 due to CO is also observed, although its intensity is very low.
The XANES results suggested that the source of carbon is the support itself and that carburisation already starts at 300 °C, with the formation of the oxycarbide which is then transformed into β-Mo2C as shown in the following reaction.
| MoO3 + C* + H2 → MoOxCy + H2O → β-Mo2C + CO |
Also, the different intensities of the MS-TPD peaks at 400 °C and 600 °C for AC and the two H samples seem to indicate that the extent to which the first step occurs on AC is greater than on H200 and H400 samples. This is reasonable since in this first step the incorporation of carbon takes place and, as already pointed out, activated carbon holds a larger proportion of reactive carbon atoms. In turn, it also suggests that carburisation took place to a larger extent, as XRD also showed.
Regarding previous literature results, it has been reported that the synthesis of molybdenum carbide over carbon nanofibers and carbon nanotubes using the TPR method (CH4/H2) also led to the formation of β-Mo2C and that above 700 °C no molybdenum oxide was observed.21,22 Other authors also analysed the effect of the surface chemistry and structural properties of the support using an oxidized graphite and oxidized activated carbon.23 Although a clear correlation of surface chemistry and structural properties with the formed molybdenum phase was difficult to obtain, the authors suggested that the defective carbon was somehow responsible for the formation of β-Mo2C and that the controlled reduction of the molybdenum precursor was a critical factor to determine the formed crystal phase.
Some authors proposed that the Mo/C ratio on an ordered mesoporous carbon support controls the MoxC phase.24 We observed that samples with different loading, mainly 10MoxC/H200 and 20MoxC/H200, displayed different XRD profiles. However, this seems to be more related to the contribution of larger particles to the XRD profile, which are present in a higher ratio on samples with greater loading.
Our results are in agreement with some literature reports that indicated oxycarbide and β-Mo2C as the only detected phases. We can add that even in a CH4/H2 atmosphere the source of carbon is the support itself. Also, the fact that the support is the source of carbon is in agreement with the easy carburisation of smaller particles that would be in closer contact with the support.
2.2 Reaction results
The conversion of formic acid decomposition measured at each temperature is given in Fig. 6A for all the tested catalysts. As the figure shows, all the catalysts were active; however the temperature at which 100% conversion was reached varied greatly in the range 190 °C to 250 °C. Among the catalysts, the conversion curve was very similar for the samples 10MoxC/H400, 20MoxC/H400 and 10MoxC/AC, while those of 5MoxC/H400, 10MoxC/H200 and 20MoxC/H200 shifted to higher temperatures.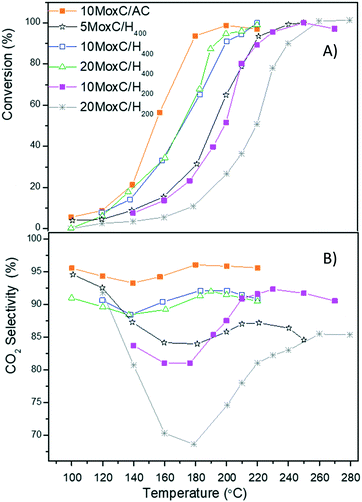 | ||
Fig. 6 (A) Conversion of FA vs. T and (B) CO2 selectivity vs. T. Reaction conditions: 1 bar, GHSV = 20![[thin space (1/6-em)]](https://www.rsc.org/images/entities/char_2009.gif) 000 h−1. 000 h−1. | ||
In order to minimize the effect of Mo loading, the activities at 150 °C were estimated and the results are displayed in Table 1.
The activity follows the trend 10MoxC/AC > 10MoxC/H400 > 5MoxC/H400 > 20MoxC/H400 > 10MoxC/H200 > 20MoxC/H200. The activity values and the similar particle size of the carbide on 10MoxC/H400 and 10MoxC/AC seem to indicate that the catalyst presenting exclusively the β-Mo2C phase is more active than those in which MoOxCy appeared as well. Regarding the effect of metal carbide loading, the activities for the sample with 10 wt% Mo supported on H400 was significantly higher than those of 5 wt% and 20 wt%. According to the microscopy results, carbide nanoparticles are larger on the sample with higher loading, 20MoxC/H400, in agreement with the similar Mo/C surface ratio obtained by XPS for 10MoxC/H400 and 20MoxC/H400, shown in Table 1. This can explain straightforwardly the lower activity of 20MoxC/H400 and suggests that in the studied system, above 10% wt Mo there is an optimum loading before particles tend to form large agglomerates that diminish the active area, as observed in other carbon-supported systems.25 A similar and even more clear effect is observed for the catalysts supported on H200.
The selectivity to CO2 at each temperature (Fig. 6B) was estimated considering the total concentration of CO2 and CO as the only detected products and revealed significant differences. The catalysts displayed maximum selectivity in the range 85.0–96.5%, with the catalyst 10MoxC/AC offering the best selectivity among the tested systems. This also points to a beneficial effect of the β-Mo2C phase compared to MoOxCy.
Indeed, if we compare the selectivity achieved with the catalysts 10MoxC/AC and 10MoxC/H400, it is clear that the different phases influence the concentration of H2 in the products. While with 10MoxC/AC selectivity to CO2 reached 96.5% at conversions above 50%, with 10MoxC/H400 the selectivity for conversions over 50% was 91%.
Regarding molybdenum-based catalysts, previous literature reported that 100% formic acid conversion was achieved at temperatures above 250 °C for unsupported molybdenum carbide systems11 and over 200 °C for supported systems over activated carbon with selectivity of around 98%.26 However, the catalysts employed in ref. 11 and 26 were prepared using a liquid phase mixture with organic compounds that is less attractive from an industrial point of view and may leave impurities on the catalysts.
Nevertheless, the reported catalytic performance using molybdenum carbide and our own results are better than those reported for non-noble metal systems like metal oxides such as α-Fe2O3 for which maximum conversion was around 24% at a temperature of 200 °C with low selectivity to H2 (ref. 7 and 27) and other systems where Ag and Mg were used as dopants for MoxC that reached 90% selectivity.28
Interestingly, the selectivity profiles with temperature shown in Fig. 6B are similar. All the catalysts prepared over high surface area graphite showed an initial selectivity decrease up to 140–180 °C, which corresponds to formic acid conversions in the range of 10–12% followed by a selectivity increase, at temperatures up to above 200–260 °C, i.e. when conversion reached 90%. These results are in agreement with previously reported selectivity profiles where other authors observed that CO2 selectivity decreased with temperature in the temperature range 100–150 °C.6 However, the evaluation of the catalysts at higher temperatures performed in the present work shows that selectivity increased from conversions above 15%, and at 95% conversion the selectivity decreased again.
As long as the stability is concerned, additional experiments in time on stream at temperatures of 180–190 °C for all the catalysts and at 220 °C for 20MoxC/H200 were performed for 12 hours. Both conversion and selectivity profiles (Fig. 7) remain stable with time for all the catalysts, except for the conversion achieved with 20MoxC/H200 that showed a continuous decrease with time, while selectivity was constant.
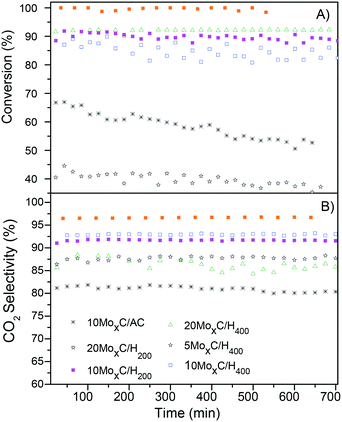 | ||
Fig. 7 Time-on-stream (A) conversion of FA and (B) CO2 selectivity; reaction conditions: 1 bar, T: 180–190 °C (220 °C for 20MoxC/H200), GHSV = 20![[thin space (1/6-em)]](https://www.rsc.org/images/entities/char_2009.gif) 000 h−1. 000 h−1. | ||
It is known that the decomposition of formic acid may take place through two paths: dehydrogenation (HCOOH → H2 + CO2) and dehydration (HCOOH → CO + H2O). Also, the water gas shift and/or the reverse reaction may take place producing CO2 + H2 or CO and H2O, respectively.1
According to DFT studies described in the literature, the surface of molybdenum carbide leads exclusively to the formation of CO2 and H2 since both Mo and C sites can chemisorb oxygen and eliminate it as CO2.8 Also, the simulations performed in that investigation suggested that molybdenum carbide decreased the rate of dehydration (undesired reaction to form CO + H2O).
Regarding the WGS reaction, theoretical studies reported that neither Mo0 nor Mo-terminated Mo2C is active in the WGS reaction.29 However, oxygen-covered C-terminated surfaces, O–C–Mo2C, were active in WGS apparently due to the formation of oxycarbide species as a consequence of the presence of H2O. Moreover, we performed additional reaction tests using molybdenum oxide supported on H400 and tested in the FA decomposition. The results indicated that molybdenum oxide is active above 190 °C when conversion reached 16%, but selectivity to CO2 was 22% (see Fig. S7†).
Thus, considering the potential reactions and the selectivity profiles, we could explain the results as follows. β-Mo2C would be selective to the dehydrogenation of FA, producing mainly CO2 + H2. The presence of small amounts of a different phase other than β-Mo2C produced during the reaction on 10MoxC/AC, i.e. MoOxCy and/or molybdenum oxide, could explain the 96.5% selectivity to CO2 obtained with that catalyst.
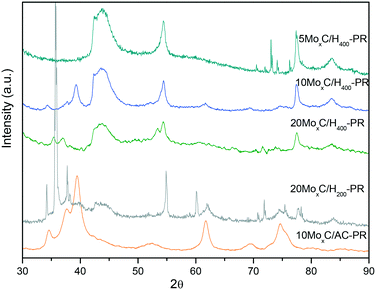
On the other hand, for the catalysts presenting also MoOxCy, it is plausible that both FA dehydrogenation and dehydration occur at the beginning of the experiment and when conversion reaches 10% the CO and H2O formed through dehydration react to produce CO2 and H2via the water gas shift reaction, thus increasing the selectivity. If this happens it is plausible that only limited oxidation of molybdenum carbide occurs since water would be consumed by the WGS reaction. Hence, we performed XRD on the spent catalysts to assess for potential changes and are shown in Fig. 8 labelled as “catalyst-PR”.
However, different results were observed. On the one hand, 10MoxC/H400-PR displayed diffractions at 2θ of 34.4°, 37.7°, 39.6° and 61.5° and sharper than those of the fresh catalyst that correspond to sintered particles of the β-Mo2C phase. On the other hand, 20MoxC/H400-PR shows diffractions at 2θ of 35.2° and 36.7° and at 2θ of 53.5°, which can be ascribed to MoO2.30,31 For 5MoxC/H400-PR, no diffractions other than those of the support were observed. This is probably due to the small particle size and/or the low concentration of species below the detection limit.
In any case, the detected changes on the catalysts phase, either conversion to β-Mo2C or to oxycarbide, agree with the selectivity profiles observed for 10MoxC/H400-PR and 20MoxC/H400-PR since both new phases may promote the CO2 selectivity either by direct transformation of FA to CO2 or through the WGS reaction.
A different case is that of the catalyst 20MoxC/H200. This catalyst initially presented both carbide and oxide phases and the selectivity to CO2 is below that of the other tested catalysts, but it also showed a selectivity increase at around 10% conversion. The XRD pattern of the spent catalyst shows diffractions at 2θ of 34.4°, 37.8°, and 39.8° from β-Mo2C along with peaks at 35.7°, 38.2° and 60.1°. The position of these latter peaks seems to indicate that they correspond to oxycarbide. Again, it seems that oxycarbide is formed during the reaction, and although the β-Mo2C phase is still detected, the intense and sharp diffraction ascribed to oxycarbide seems to indicate that large particles of this species have been formed on the surface. Despite the appearance of these new nanoparticles, the selectivity remained stable with time probably due to the positive effect of the new oxycarbide species which are active in the WGS reaction. However, the larger particle size inferred from the sharp XRD peaks would be responsible for the conversion decrease with time.
In contrast, the XRD pattern of the 10MoxC/AC sample after reaction also corresponds to β-Mo2C and no other diffraction is envisaged, in agreement with the higher selectivity to CO2 and better stability. Nonetheless, the selectivity below 100% could also suggest that small undetected amounts of another phase are present. Thus, even in the presence of oxidants, H2O or CO2, this catalyst was highly stable under the reaction conditions.
The changes of the molybdenum phase under the reaction conditions have already been reported. For example, during dry reforming of methane, deactivation of β-Mo2C catalysts due to oxidation to MoO2 has been reported.32 Ledoux et al. also found that β-Mo2C changed to MoO2, while α-MoxC was transformed into MoO2 and eventually to β-Mo2C.19 Similarly, phase changes were also observed in the spent catalysts after steam reforming of methanol.33
Some authors have reported that other phases such as α-MoC are more active on formic acid decomposition than β-Mo2C.5 However, chloro- and nitrogen-containing compounds were used as the carbon source to prepare the catalysts and the effect of those elements should have been considered. Indeed, in the same report it is also shown that a conventional β-Mo2C prepared from a CH4/H2 mixture was the most active and selective catalyst. In line with our results, molybdenum carbide prepared over activated carbon was more active and selective than when carbon nanotubes were used as support.6 Even though the crystallographic phase of the molybdenum carbides was not shown, it is likely that the β-Mo2C phase was formed over activated carbon as already shown in several literature reports and in the present work.23,26 As demonstrated by XRD, in the present work the main phase on the catalysts was β-Mo2C, although MoOxCy could be found on H400 and H200 based catalysts, so our results are in quite good agreement with the literature, showing that β-Mo2C is more active and selective.
Very recently, the reaction mechanisms of both dehydration and dehydrogenation reactions of formic acid on molybdenum carbide have been studied.34 The authors proposed that the target reaction leading to CO2 and H2 takes place through bridged formate species that evolve into monodentate formate and transformed to CO2 and H* following a Langmuir–Hinshelwood mechanism. On the other hand, the dehydration reaction follows an Eley–Rideal path in which gaseous HCOOH reacts with adsorbed H* to form H2O and CO. Considering these paths, the rate in which dehydrogenation occurs might depend on the ease of the bridge-type adsorption of the formate.
The carbon/molybdenum ratio influences the physicochemical properties of the carbides and thus the catalytic properties. In this sense, it has already been reported that a higher C/Mo ratio has a negative impact on the reactivity. In this respect, the MoOxCy surface would be more saturated and less metallic than the unsaturated Mo2C surface.35 Following this argument, it is plausible that the cleavage of the O–H bond and adsorption of the formate on the less saturated surface of β-Mo2C would be energetically favoured compared to that over MoOxCy.
3. Experimental
3.1 Synthesis of materials
Metal carbides were prepared by wetness impregnation followed by carburization treatment. Activated carbon (Type CO-850 from Petrochil S.A.) was used as support and was first ground and sieved to <150 μm particle size and then dried at 110 °C for 2 h before impregnation. Commercial high surface area graphite (H400 and H200) was obtained from Timcal Graphite.An aqueous solution of the precursor (NH4)6Mo7O24 (99% from Aldrich) was impregnated on the support using the corresponding amount to obtain the metal loading, left for maturation for 6 h, and dried overnight at 80 °C. The carburization was carried out in situ prior to the reaction, under an 80/20 mixture of H2/CH4 (% vol) at 700 °C (5 °C min−1) for 2 h. The resulting catalysts were labelled according to the metal composition, loading and support.
3.2 Characterization
The textural properties were measured from the adsorption isotherm of N2 at −196 °C using a 3Flex instrument from Micromeritics. Around 100 mg were previously degassed for 4 h at 110 °C under vacuum using a SmartVacPrep instrument from Micromeritics. The surface area was calculated from the adsorption branch in the range 0.02 ≤ p/p0 ≤ 0.25 using the Brunauer–Emmett–Teller (BET) theory. Total pore volume was defined as the single-point pore volume at p/p0 = 0.99.X-ray diffraction (XRD) patterns of the passivated catalysts were acquired in the 2θ range between 4° and 90° with a step of 0.04° s−1 using a Polycrystal X'Pert Pro PANalytical diffractometer with Ni-filtered Cu Kα radiation (λ = 1.54 Å) operating at 45 kV and 40 mA.
XPS measurements were performed with an energy analyser (PHOIBOS 150 9MCD, SPECS GmbH) using non-monochromatic Al radiation (200 W, 1486.61 eV). The samples were pelletized and transferred to the outgassed chamber. Prior to the experiments, the samples were outgassed in situ for 24 h to achieve a dynamic vacuum below 10−10 mbar. The binding energy (BE) was measured by reference to the C 1s peak at 284.6 eV, with an equipment error of less than 0.01 eV in the energy determinations.
Information about the supported metal particles was acquired by TEM in a JEOL 2100F field emission gun electron microscope operated at 200 kV and equipped with an energy-dispersive X-ray detector. The sample was ground into powder and a small amount was suspended in ethanol solution using an ultrasonic bath. Some drops were added to the copper grid (Aname, Lacey carbon 200 mesh) and the ethanol was evaporated at room temperature before introducing it into the microscope. Scanning transmission electron microscopy (STEM) was done using a spot size of 1 nm. The average particle size area (dTEM) was calculated as
![[thin space (1/6-em)]](https://www.rsc.org/images/entities/char_2009.gif) 000 eV) X-ray absorption near-edge spectra (XANES) were recorded in dispersive mode at the BM23 beamline at the European Synchrotron Radiation Facility (ESRF, Grenoble, France). The catalysts were pressed into pellets and sieved to a size between 0.090 and 0.140 mm. The samples (ca. 15 mg) were loaded in a quartz plug-flow microreactor system developed at BM23. The reactor was continuously fed with (a) 30 mL min−1 of a 20/5/75 mixture composition of H2/CH4/He for the temperature-programmed carburization experiment or (b) 30 mL min−1 of 20% hydrogen in helium during the temperature-programmed reduction experiment. The temperature was raised by 3 °C min−1 up to 700 °C. XANES spectra were collected every 30 °C or 10 min during the heating.
000 eV) X-ray absorption near-edge spectra (XANES) were recorded in dispersive mode at the BM23 beamline at the European Synchrotron Radiation Facility (ESRF, Grenoble, France). The catalysts were pressed into pellets and sieved to a size between 0.090 and 0.140 mm. The samples (ca. 15 mg) were loaded in a quartz plug-flow microreactor system developed at BM23. The reactor was continuously fed with (a) 30 mL min−1 of a 20/5/75 mixture composition of H2/CH4/He for the temperature-programmed carburization experiment or (b) 30 mL min−1 of 20% hydrogen in helium during the temperature-programmed reduction experiment. The temperature was raised by 3 °C min−1 up to 700 °C. XANES spectra were collected every 30 °C or 10 min during the heating.
3.3 Reaction
The measurements of the catalyst activity in vapor phase formic acid decomposition were carried out in a fixed-bed flow reactor. The catalysts (0.075 g) were placed in a U-tube reactor with an internal diameter of 4 mm. All the samples were in situ carburized in CH4/H2 (20![[thin space (1/6-em)]](https://www.rsc.org/images/entities/char_2009.gif) :
:![[thin space (1/6-em)]](https://www.rsc.org/images/entities/char_2009.gif) 80 vol) at 700 °C for 2 h and cooled in N2 to the reaction temperature prior to testing (in situ reduction). A mixture of 5.5 vol% formic acid/N2 at a total flow rate of 25 cm3 (STP) min−1 was fed to the reactor by a saturator. The reactants and products were analysed using a gas chromatograph (Varian 3400) fitted with a 60/80 Carboxen TM 1000 column and a thermal conductivity detector. At each temperature, a few measurements were performed to ensure that steady-state activity was reached. During the test, the unique products determined were CO, CO2 and H2. The concentrations of these compounds were calculated by the following equations.
80 vol) at 700 °C for 2 h and cooled in N2 to the reaction temperature prior to testing (in situ reduction). A mixture of 5.5 vol% formic acid/N2 at a total flow rate of 25 cm3 (STP) min−1 was fed to the reactor by a saturator. The reactants and products were analysed using a gas chromatograph (Varian 3400) fitted with a 60/80 Carboxen TM 1000 column and a thermal conductivity detector. At each temperature, a few measurements were performed to ensure that steady-state activity was reached. During the test, the unique products determined were CO, CO2 and H2. The concentrations of these compounds were calculated by the following equations.As the formation of products different from those indicated was negligible, the total conversion of formic acid was determined as the sum of CO and CO2 concentrations related to the initial concentration of formic acid.
| [HCOOH]0 = [CO]m + [CO2]m at Tmax to obtain a complete conversion of HCOOH |
 | (2) |
Conclusions
The synthesis of molybdenum carbide by the TPR method using a CH4/H2 feed was performed successfully over activated carbon and two high surface area graphites, H200 and H400, of different graphitic layer dimensions. The formed carbide nanoparticles were between 2.0 and 8.1 nm in size, which depended on the surface area and metal loading. Also, characterization showed that the carbide phase was influenced by the support. Accordingly, when activated carbon was used, the β-Mo2C phase was obtained almost exclusively. However, over H400 and H200, the oxycarbide phase MoOxCy was also observed. We explained the differences based on the graphitic layer size. This is related to the availability of defective carbon which in turn favours the carburisation. Interestingly, XANES experiments showed that even under a CH4/H2 atmosphere the main source of carbon is the support itself. This also implies that smaller particles, which are in closer contact with the support, are more easily carburised.The different molybdenum carbide phases influence the catalytic performance. The results showed that the β-Mo2C phase is more active and selective than MoOxCy. However, since MoOxCy is also active in the WGS reaction, the selectivity to CO2 increases during the reaction. Moreover, β-Mo2C supported on activated carbon proved to be stable under the reaction conditions.
Conflicts of interest
There are no conflicts to declare.Acknowledgements
We acknowledge financial support from the Spanish Agencia Estatal de Investigación (AEI) y el Fondo Europeo de Desarrollo Regional (FEDER), UE (projects CTQ2017-89443-C3-1-R and CTQ2017-89443-C3-3-R). The ESRF synchrotron is thanked for granting beamtime at BM23. A. B. Dongil acknowledges financial support from the Fundación General CSIC (Programa ComFuturo). DHCA thanks the Consejo Nacional de Ciencia y Tecnologia, CONACyT, Mexico for a postdoctoral fellowship [grant numbers 2018-000022-01EXTV-00519, 2019-000029-01EXTV-00057. We acknowledge support of the publication fee by the CSIC Open Access Publication Support Initiative through its Unit of Information Resources for Research (URICI).Notes and references
- B. Dou, H. Zhang, Y. Song, L. Zhao, B. Jiang, M. He, C. Ruan, H. Chen and Y. Xu, Sustainable Energy Fuels, 2019, 3, 314 RSC.
- (a) D. J. Hayes, S. Fitzpatrick, M. H. B. Hayes and J. R. H. Ross, The Biofine Process – Production of Levulinic Acid, Furfural, and Formic Acid from Lignocellulosic Feedstocks in Biorefineries—Industrial Processes and Products: Status Quo and Future Directions, ed. B. Kamm, P. R. Gruber and M. Kamm, Wiley-VCH, Weinheim, 2006, pp. 139–164 Search PubMed; (b) A. Kumar Singh, S. Singh and A. Kumar, Catal. Sci. Technol., 2016, 6, 12–40 RSC.
- (a) J. Wang, J. Zheng, J. Cao, X. Hao, Z. Wang, A. Abudula and G. Guan, Energy Convers. Manage., 2018, 164, 122 CrossRef CAS; (b) J. Wang, J. Cao, Y. Ma, X. Li, P. Xiaokaiti, X. Hao, T. Yu, A. Abudula and G. Guan, Energy Convers. Manage., 2017, 147, 166 CrossRef CAS.
- (a) G. H. Gunasekar, H. Kim and S. Yoon, Sustainable Energy Fuels, 2019, 3, 1042 RSC; (b) W. Gan, P. J. Dyson and G. Laurenczy, ChemCatChem, 2013, 5, 3124 CrossRef CAS; (c) W. Gan, P. J. Dyson and G. Laurenczy, React. Kinet. Catal. Lett., 2009, 98, 205 CrossRef CAS; (d) Y. Zhao, L. Deng, S.-Y. Tang, D.-M. Lai, B. Liao, Y. Fu and Q.-X. Guo, Energy Fuels, 2011, 25, 3693 CrossRef CAS.
- G. H. Gunasekar, H. Kim and S. Yoon, Sustainable Energy Fuels, 2019, 3, 1042–1047 RSC.
- I. E. Wachs and D. E. Fein, J. Catal., 2002, 210, 241–254 CrossRef.
- S. A. Halawy, S. S. Al-Shihry and M. A. Mohamed, Catal. Lett., 1997, 48, 247–251 CrossRef CAS.
- (a) Á. Koós and F. Solymosi, Catal. Lett., 2010, 138, 23–27 CrossRef; (b) Q. Luo, T. Wang, G. Walther, M. Beller and H. Jiao, J. Power Sources, 2014, 246, 548–555 CrossRef CAS.
- Y. Ma, G. Guan, X. Hao, J. Cao and A. Abudula, Renewable Sustainable Energy Rev., 2017, 75, 1101–1129 CrossRef CAS.
- D. W. Flaherty, S. P. Berglund and C. B. Mullins, J. Catal., 2010, 269, 33–43 CrossRef CAS.
- J. Cao, J. Wang, Y. Ma, X. Li, P. Xiaokaiti, X. Hao, A. Abudula and G. Guan, J. Alloys Compd., 2018, 735, 1463–1471 CrossRef CAS.
- J. Q. Chi, K. L. Yan, W. K. Gao, B. Dong, X. Shang, Y. R. Liu, X. Li, Y. M. Chai and C. G. Liu, J. Alloys Compd., 2017, 714, 26–34 CrossRef CAS.
- (a) P. Liang, H. Gao, Z. Yao, R. Jia, Y. Shi, Y. Sun, Q. Fan and H. Wang, Catal. Sci. Technol., 2017, 7, 3312–3324 RSC; (b) H. Gao, Z. Yao, Y. Shi and S. Wang, Catal. Sci. Technol., 2018, 8, 697–701 RSC.
- H. Wang, S. Liu and K. J. Smith, Energy Fuels, 2016, 30, 6039–6049 CrossRef CAS.
- (a) C. Máırquez-Alvarez, I. Rodríguez-Ramos, A. Guerrero-Ruiz, G. L. Haller and M. J. Fernáındez-García, J. Am. Chem. Soc., 1997, 19, 2905–2914 CrossRef; (b) F. R. García-García, M. Fernández-García, M. A. Newton, I. Rodríguez-Ramos and A. Guerrero-Ruiz, ChemCatChem, 2013, 5, 2446–2452 CrossRef.
- A. Tougerti, E. Berrier, A.-S. Mamede, C. La Fontaine, V. Briois, Y. Joly, E. Payen, J.-F. Paul and S. Cristol, Angew. Chem., Int. Ed., 2013, 52, 6440–6444 CrossRef CAS PubMed.
- S. T. Oyama, P. Delporte, C. Pham-Huu and M. J. Ledoux, Chem. Lett., 1997, 949–950 CrossRef CAS.
- A. Hanif, T. Xiao, A. P. E. York, J. Sloan and M. L. H. Green, Chem. Mater., 2002, 14, 1009–1015 CrossRef CAS.
- C. Bouchy, C. Pham-huu and M. J. Ledoux, J. Mol. Catal. A: Chem., 2000, 162, 317–334 CrossRef CAS.
- A. B. Dongil, L. Pastor-Pérez, A. Sepúlveda-Escribano and P. Reyes, Appl. Catal., A, 2015, 505, 98–104 CrossRef CAS.
- L. Souza Macedo, R. R. Oliveira, T. van Haasterecht, V. Teixeira da Silva and H. Bitter, Appl. Catal., B, 2019, 241, 81 CrossRef CAS.
- E. F. Mai, M. A. Machado, T. E. Davies, J. A. Lopez-Sanchez and V. T. da Silva, Green Chem., 2014, 16, 4092–4097 RSC.
- B. Frank, Z. L. Xie, K. F. Ortega, M. Scherzer, R. Schlögl and A. Trunschke, Catal. Sci. Technol., 2016, 6, 3468–3475 RSC.
- J. Han, J. Duan, P. Chen, H. Lou, X. Zheng and H. Hong, ChemSusChem, 2012, 5, 727–733 CrossRef CAS PubMed.
- A. B. Dongil, L. Pastor-Pérez, N. Escalona and A. Sepúlveda-Escribano, Carbon, 2016, 101, 296–304 CrossRef CAS.
- Y. Tao, L. Tao, Z. Pan, S. Qiu and X. Shen, Fuel, 2018, 217, 106–110 CrossRef CAS.
- D. E. J. Fein and I. E. Wachs, J. Catal., 2002, 210, 241–254 CrossRef CAS.
- J. Wang, J. Cao, Y. Ma, X. Li, P. Xiaokaiti, X. Hao and G. Guan, Energy Convers. Manage., 2017, 147, 166–173 CrossRef CAS.
- P. Liu and J. A. Rodriguez, J. Phys. Chem. B, 2006, 110, 19418–19425 CrossRef CAS PubMed.
- P. Delporte, C. Pham-Huu, P. Vennegues, M. J. Ledoux and J. Guille, Catal. Today, 1995, 23, 251–267 CrossRef CAS.
- M. Tsuji, T. Miyao and S. Naito, Catal. Lett., 2000, 69, 195–198 CrossRef CAS.
- J. B. Claridge, A. P. E. York, A. J. Brungs, C. Marquez-Alvarez, J. Sloan, S. C. Tsang and M. L. H. Green, J. Catal., 1998, 180, 85–100 CrossRef CAS.
- B. Frank, K. Friedel, F. Girgsdies, X. Huang, R. Schlögl and A. Trunschke, ChemCatChem, 2013, 5, 2296–2305 CrossRef CAS.
- J. T. Gray, S. W. Kang, J. I. Yang, N. Kruse, J. S. McEwen, J. C. Park and S. Ha, Appl. Catal., B, 2020, 264, 118478 CrossRef.
- T. Wang, X. Tian, Y. Yang, Y. W. Li, J. Wang, M. Beller and H. Jiao, Phys. Chem. Chem. Phys., 2015, 17, 1907–1917 RSC.
Footnote |
| † Electronic supplementary information (ESI) available. See DOI: 10.1039/d0cy01088j |
| This journal is © The Royal Society of Chemistry 2020 |

