
 Open Access Article
 This Open Access Article is licensed under a Creative Commons Attribution-Non Commercial 3.0 Unported Licence
Total oxidation of methane over Pd/Al2O3 at pressures from 1 to 10 atm†
Carl-Robert
Florén‡
 a,
Cansunur
Demirci‡
bc,
Per-Anders
Carlsson
a,
Derek
Creaser
a and
Magnus
Skoglundh
*a
a,
Cansunur
Demirci‡
bc,
Per-Anders
Carlsson
a,
Derek
Creaser
a and
Magnus
Skoglundh
*a
aCompetence Centre for Catalysis, Department of Chemistry and Chemical Engineering, Chalmers University of Technology, SE-41296 Göteborg, Sweden. E-mail: skoglund@chalmers.se
bNanochemistry Department, Istituto Italiano di Tecnologia, IT-16163, Genoa, Italy
cDipartimento di Chimica e Chimica Industriale, Università degli studi di Genova, IT-16126, Genoa, Italy
First published on 14th July 2020
Abstract
The kinetics of total methane oxidation over a 0.15 wt% Pd/Al2O3 monolith catalyst has been measured during temperature programmed methane oxidation experiments at total pressures from 1 to 10 atm and compared with multiscale simulations. The methane conversion can be significantly enhanced by increasing the total pressure at temperatures above 350 °C, which is thanks to a longer residence time that dominates over decreased bulk gas diffusion rates and product inhibition. For the present catalyst, the external mass transfer impacts the methane conversion above 4 atm. With increasing total pressure, the observed methane reactions order decreases at 350 °C whereas it increases at 450 °C due to a more pronounced product inhibition at the lower temperatures. This is also reflected in the apparent activation energy, which increases with increasing total pressure. The multiscale simulations capture the general trends of the experimental results but overestimate the methane conversion at higher temperatures and total pressures. The overestimated activity indicates of an overestimated number of active sites and/or an underestimated external mass transfer resistance.
1 Introduction
Many catalytic processes are operated at high pressures because the chemical reaction may be thermodynamically more favourable and/or the elevated pressure enhances the reaction kinetics. Catalytic cracking of alkenes,1 ammonia production2 and methanol synthesis3 are three important examples. Elevated pressures can also be used to enhance the rate of oxidation reactions. A well-known example is the total oxidation of methane4–11 that is used in the high-temperature catalytic combustion for heat and power generation. For catalytic emission control in general, and exhaust aftertreatment for natural gas vehicles in particular, the total oxidation of methane has almost exclusively been studied at atmospheric pressure conditions. The focus has been on understanding the catalytically active phase and how to formulate more active and durable catalysts.12–26 For large gas engines, which is the main motivation for this work, the possibility of installing catalytic aftertreatment devices between the engine and the turbo charger, as to take advantage of the higher pressure to reduce the overall size of the catalytic system, is tempting.27,28In a recent experimental study including also kinetic modelling, Stotz et al. report a slight suppression of the methane oxidation over Pd/Al2O3 upon increased pressure as compared to atmospheric pressure.29 Our recent theoretical studies, however, indicate that for certain temperatures, an increased pressure may govern the methane turn-over frequency30 and, in the case of a Pd/Al2O3 monolith catalyst, the methane conversion.31 With these possible discrepancies as a starting point, we here focus on whether or not an increased total pressure facilitates the total oxidation of methane over a Pd/Al2O3 monolith catalyst at low temperatures using both experiments and simulations. The experiments were carried out using a chemical reactor designed for operating pressures between 1 and 15 atm and the product stream was continuously monitored with mass spectrometry. The simulation code is based on a multiscale kinetic model free of fitted parameters as described in detail elsewhere.30–32 We show that the methane oxidation indeed can be enhanced but equally well suppressed by increased pressure depending on foremost operational temperature.
2 Material and methods
2.1 Catalyst preparation
The 0.15 wt% Pd/Al2O3 catalyst used for the activity tests was prepared by incipient wetness impregnation where γ-alumina (Puralox SBa 200, Sasol) was mixed with aqueous 10 wt% tetraaminepalladium(II) nitrate solution (Alfa Aesar). The slurry was mixed and frozen, using liquid nitrogen, before being freeze-dried over night. The dry sample was then calcined in air at 600 °C for 2 h. During the calcination the temperature was linearly increased from room temperature to the final value with a rate of 5 °C min−1. A monolith substrate of cordierite (corning) was washcoated with 31 mg of the Pd/Al2O3 catalyst. During the washcoating procedure the monolith was repeatedly dipped in a slurry and dried under a heating gun until the final weight was achieved. The slurry contained 16 wt% powder catalyst, 4 wt% binder material (Boehmite, Disperal P2, Sasol) and 80 wt% of a 50/50 mix of ethanol and Milli-Q water (18 MΩ cm). The monolith dimensions were 15 and 12 mm in length and diameter, respectively, with the cell density of 400 cells per square inch (cpsi). The coated monolith was finally calcined in air at 600 °C for 2 h with a temperature increase of 5 °C min−1 before cooling to room temperature by natural convection.2.2 Catalyst characterization
![[thin space (1/6-em)]](https://www.rsc.org/images/entities/char_2009.gif) :2,33 the Pd dispersion and the mean hemispherical Pd particle diameter were calculated.
:1 ratio of hydrochloric acid and nitric acid, for Trace Metal Analysis, Fisher Chemical), heated up for two hours to 100 °C and was kept in the acid to digest overnight. Then the solution was diluted 1:10 with Milli-Q water and was filtered (syringe filter, PTFE-membrane with 0.2 μm pore diameter) to subsequently be analyzed.
:2,33 the Pd dispersion and the mean hemispherical Pd particle diameter were calculated.
:1 ratio of hydrochloric acid and nitric acid, for Trace Metal Analysis, Fisher Chemical), heated up for two hours to 100 °C and was kept in the acid to digest overnight. Then the solution was diluted 1:10 with Milli-Q water and was filtered (syringe filter, PTFE-membrane with 0.2 μm pore diameter) to subsequently be analyzed.
2.3 Catalytic activity tests
For the TPR experiments the temperature was linearly increased by 2 °C min−1 to reach a maximum temperature of 450 °C, followed by a dwell of 30 min and cooling with a rate of 2 °C min−1. The conversion of methane was measured for a gas flow rate of 100 mL min−1, with 1000 vol ppm CH4 and 2 vol% O2 balanced with Ar. Five different TPR experiments were performed in which the total pressure of the experiment was varied (1, 2, 4 and 10 atm). Furthermore, two TPR experiments were performed in presence of 10 vol% CO2 at 1 and 4 atm. The apparent activation energies for methane oxidation in each TPR experiment were calculated using data points between 7 and 15% methane conversion. Reaction orders were determined by varying the methane concentration from 400 to 1600 ppm with steps of 200 ppm at fixed temperatures and total pressures of 350, 400 and 450 °C and 1, 2 and 4 atm, respectively.
3 Results and discussion
Key physical properties of the catalyst, i.e., specific surface area, porosity and palladium loading and dispersion, were characterised with established methods. The specific surface area of the powder catalyst was determined to be 172 m2 g−1 with an average pore diameter of 9 nm, which is in line with previously published values.15,43,44 The porosity of the catalyst is ascribed to the alumina onto which the Pd particles are supported. CO-Chemisorption revealed a palladium dispersion of 41% assuming hemispherical Pd particles and bridged configuration33 between the Pd and CO. The mean Pd diameter was determined to be 1.9 nm, which is comparable to published values.44 A palladium loading of 0.15 wt% was determined by ICP-OES analysis of three different samples. The determined values of palladium loading and dispersion were used as input parameters for the simulations and can be found in Table 1.Fig. 1 shows the methane conversion as a function of temperature during the cooling phase of the TPR experiments. Considering the experiments, the methane conversion clearly increases with increased total pressure from 1 to 4 atm whereas a further increase to 10 atm only results in a slight increase of the methane conversion above 400 °C. Due to the low flow rate of 100 mL min−1 in the experiments, which corresponds to a gas hourly space velocity of 3500 h−1, it is reasonable to assume that mass transport effects are not significant at the examined conditions. This will be discussed in detail later. It is commonly accepted that kinetics control the reaction below ca. 20% conversion, but for the experiment performed at 1 atm it can be assumed that kinetics are not affected by internal mass transport due to a very thin washcoat thickness (as determined by optical microscopy, see ESI†). When the total pressure is increased from 1 to 2 atm the activity increases for all temperatures, except the lowest where the reaction is not significantly affected. The increased methane conversion is attributed to an increasing residence time, due to a constant molar flow. The same arguments explain the enhanced methane conversion between 2 and 4 atm. Similar observations are reported elsewhere.45,46 At 10 atm the methane conversion is not affected except at temperatures above 400 °C where a slight increase is seen. The fact that the methane conversion is not affected is most likely due to steep concentration gradients of methane in the bulk gas. Hence, external mass transfer resistances are present in the system at 10 atm and at temperatures above 400 °C. This is explained by a linearly decreasing bulk gas diffusion for increasing total pressures. Below 400 °C, where the methane conversion is not affected, it is most likely that the temperature is not sufficient to show an increased conversion for increasing total pressures. Hence, the positive effect of total pressure on methane conversion, at present catalyst properties and reaction conditions, is a combined result between the trade-offs between the positive effect of an increased residence time and the negative effect of stronger external mass transfer resistances. An inevitable feature of the Pd/Al2O3 catalyst for complete oxidation of methane, is the product inhibition by water and carbon dioxide. The inhibition effect by water has been thoroughly discussed before where water promotes long-term sintering of the alumina support and formation of inactive Pd(OH)2. Furthermore, the long-term effect of water on the alumina support is reported to be stronger at elevated total pressures.45 The increased external mass transfer resistance and stronger inhibition of water can explain the low activity enhancement between 4 and 10 atm.
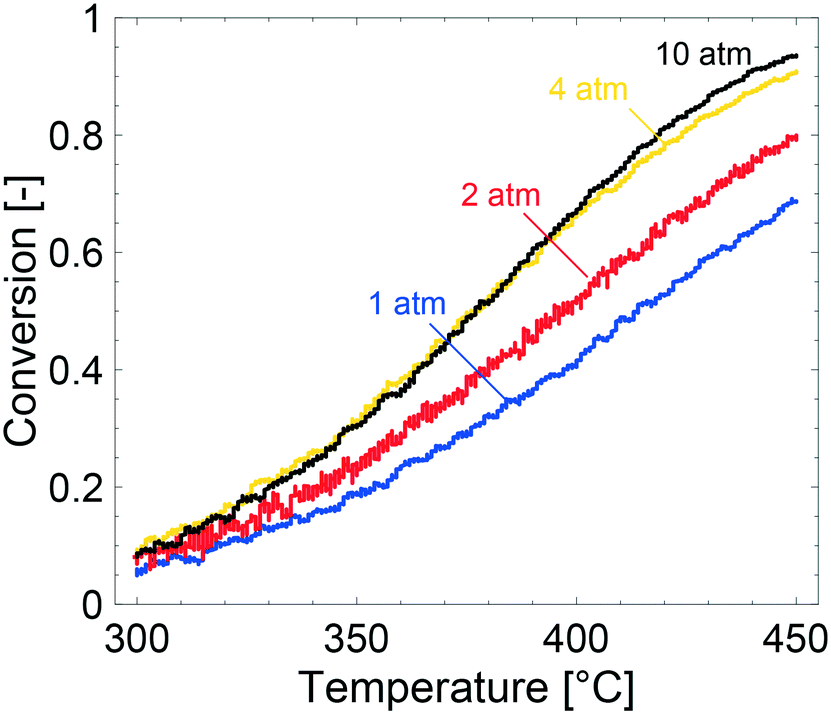 | ||
| Fig. 1 Methane conversion for temperature programmed reaction experiments over a 0.15 wt% Pd/Al2O3 monolith catalyst for a gas composition of 1000 vol ppm CH4, 2 vol% O2 and Ar as balance at 1 (blue), 2 (red), 4 (yellow) and 10 (black) atm. | ||
The effects of product inhibition can be indirectly observed by evaluating how the reaction order for methane changes when the total pressure is increased. The reaction order with respect to methane was obtained by a set of steady-state measurements at different temperatures and total pressures. The experimentally determined reaction orders may not, even in the absence of transport resistances, represent the true orders of the reaction because they are not in all cases calculated at differential reactor conditions. They do however serve to compare the sensitivity of the methane conversion and indirectly reaction rates to methane concentration at the same conditions for experiments. The experimentally determined reaction orders for methane are shown in Fig. 2. The reaction order decreases slightly with increasing total pressures at 350 °C and increases at 400 and 450 °C, at which the reaction order converges towards unity. Further, the measured reaction orders are within the range of published values of 0.7–1 in total oxidation of methane over Pd and PdO for varying methane concentrations.47–49 Based on the results from estimating if internal mass transport may affect the reaction rate using Weisz–Prater's method, it is reasonable to assume that the internal mass transport is not significantly affecting the reaction rate at 350 °C for the investigated total pressures (see ESI†). Product inhibition and an increasing external mass transport resistance are probable causes for the decreasing methane reaction order. The same observation are seen from the apparent activation energies. The apparent activation energy for each TPR experiment in Fig. 1 is estimated by using experimental values between 7 and 15% methane conversion. The Arrhenius plots, with corresponding linear regressions, are included in the ESI.† The apparent activation energy is determined to be 70, 63, 73 and 80 kJ mol−1 for 1, 2, 4 and 10 atm, respectively. The apparent activation energy increases with increasing total pressure, except for 2 atm where the apparent activation energy showed a local minimum. The increasing apparent activation energy originates from readsorbed reaction products. As previously mentioned, water inhibits the palladium particles by formation of Pd(OH)2 but also promotes loss of active sites due to sintering of the alumina support. Such structural changes may contribute to the increased apparent activation energy. Carbon dioxide is reported to show an inhibiting effect by formation of formates and carbonates. However, the effect of carbon dioxide is less severe than the effect of water. For increasing temperature and ultimately at 450 °C, the reaction orders show an increasing trend since the higher temperature can sustain a faster reaction rate and inhibitory effects of water, and especially carbon dioxide, are small at 450 °C.
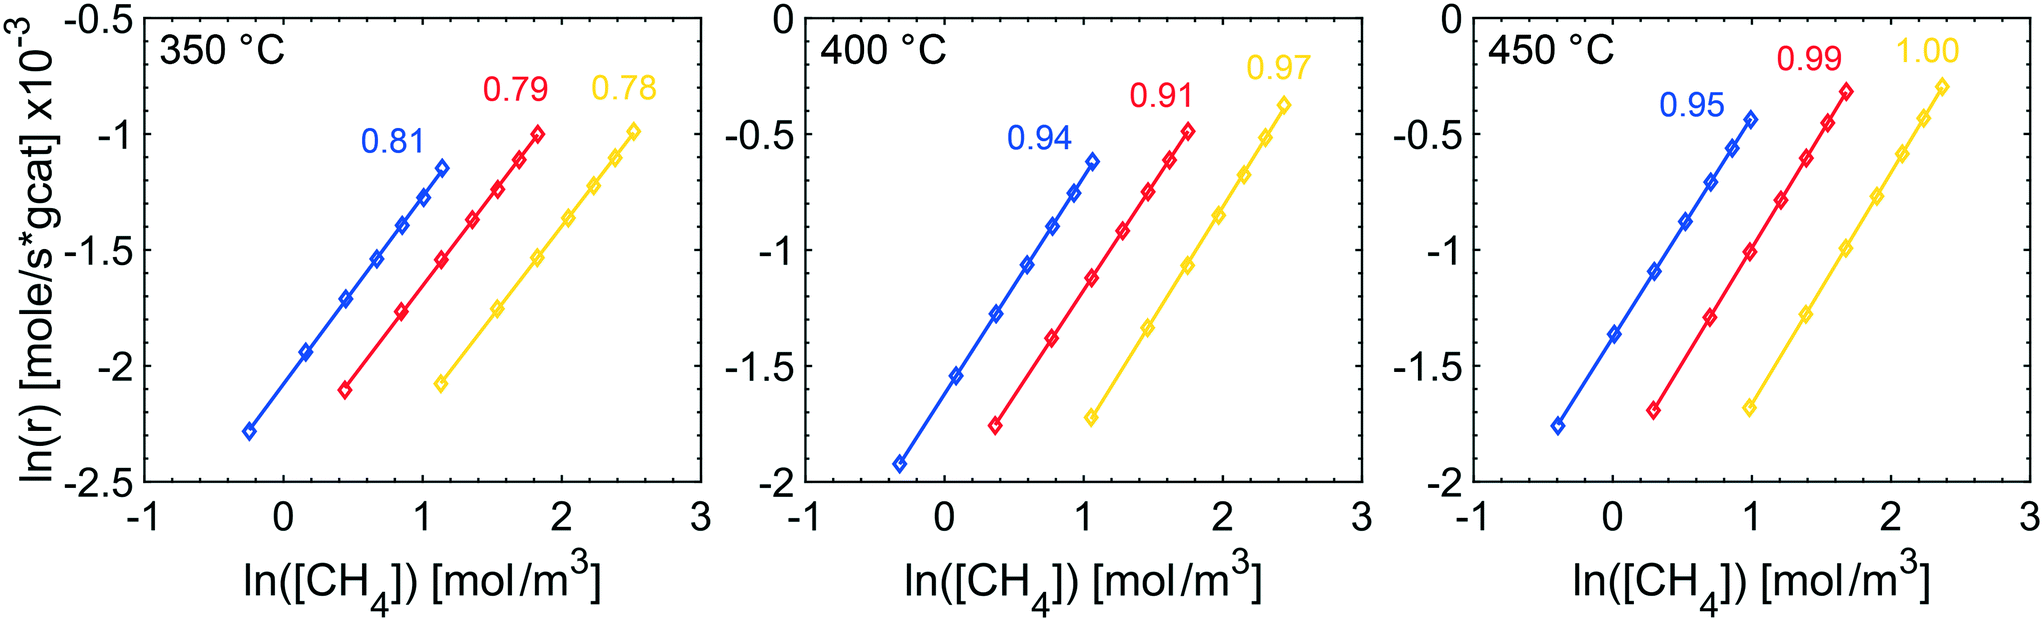 | ||
| Fig. 2 Experimentally determined reaction orders with respect to methane at 350 (left), 400 (center) and 450 °C (right) and 1 (blue), 2 (red) and 4 atm (yellow). | ||
The multiscale simulations reproduce the experimental trends well, but underestimate the methane conversion at low temperatures and overestimate the same at high temperatures (see Table 2). The underestimated simulated activity in Fig. 3 up to around 400 °C, depending on the total pressure, is argued to be either caused by a too low predicted inherent reactivity of the active sites or an over-prediction of the adsorbate coverages by the model. The latter lowers the rate of methane dissociation. The reaction network in the model is based on a dual-site mechanism where both the palladium and oxygen atoms are required as adsorption sites on the active PdO surface. Thus, both the palladium and the oxygen site are important in the catalytic cycle to activate and oxidize methane. Fig. 4 shows the fraction of available palladium (S1(Pd)) and oxygen sites (S2(O)) in the coated monolith calculated by the microkinetic model, averaged over the monolith length. The fraction of available S1(Pd) and S2(O) sites increases with increasing temperature and decreases with increasing total pressure. The availability of S1(Pd) sites is generally high on the catalyst surface for all examined reaction conditions. According to the simulations, the most abundant surface species on the S1(Pd) sites are adsorbed water, hydroxyl and bicarbonates in dry conditions. Adsorbed water comes from the adsorption of produced water from the reaction while hydroxyl species are formed after the dissociation of adsorbed water and as a reaction byproduct. This is similar to the results of previous studies where the negative influence of water on the conversion of methane over Pd/Al2O3, is ascribed to be due to blocking of active sites by adsorbed water species or hydroxyl groups which could explain the observed effect.50–52 Bicarbonates originate from adsorbed carbon dioxide which reacts with surface hydroxyl into bicarbonate species. A discussion about the most abundant surface species is included in the ESI.† Interestingly, the fraction of available S2(O) sites at 350 °C is low where the conversion of methane is underestimated, due to a high coverage of hydrogen atoms (see ESI†). As for S1(Pd), the coverage of S2(O) sites increases with increasing temperatures and decreases with increasing total pressure. The observation of a low availability of S2(O) sites is interesting since no support effects of the alumina are accounted for in the model. Support effects could affect the availability of S2(O) sites or reactivity in terms of oxygen storage capacity, regeneration of the S2(O) sites or interface sites and explain the underestimated simulated methane conversion. For the simulations at temperatures above 400 °C, the positive effect of increased total pressure on the conversion of methane is due to an increased residence time and higher methane impingement rate. The residence time increases, since the inlet mass flow is constant, and a positive effect of impingement rate is due to a sufficiently high number of available S2(O) sites. The simulated methane conversions are in fairly good agreement with the corresponding experimental results except at total pressures of 10 atm, where the simulated methane conversion is overestimated. The overestimated conversion could be caused by an overestimation of the fraction of available active sites and/or insufficiently described external mass transfer process.
| Pressure (atm) | Low T | Moderate T | High T | |||
|---|---|---|---|---|---|---|
| 340 °C | 380 °C | 440 °C | ||||
| Exp. | Sim. | Exp. | Sim. | Exp. | Sim. | |
| 1 | 0.15 | 0.08 | 0.32 | 0.22 | 0.63 | 0.63 |
| 2 | 0.18 | 0.09 | 0.40 | 0.30 | 0.75 | 0.81 |
| 4 | 0.26 | 0.10 | 0.52 | 0.41 | 0.87 | 0.93 |
| 10 | 0.24 | 0.14 | 0.51 | 0.67 | 0.91 | 0.99 |
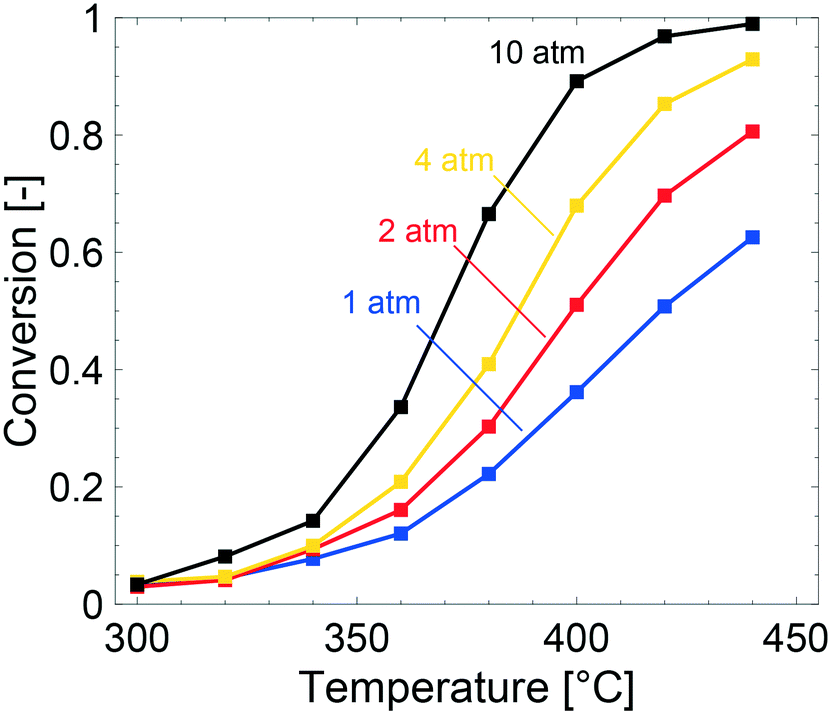 | ||
| Fig. 3 Simulated methane conversions for temperature programmed reaction experiments over 0.15 wt% Pd/Al2O3 monolith for a gas composition of 1000 vol ppm CH4 and 2 vol% O2 at 1 (blue), 2 (red), 4 (yellow) and 10 (black) atm. | ||
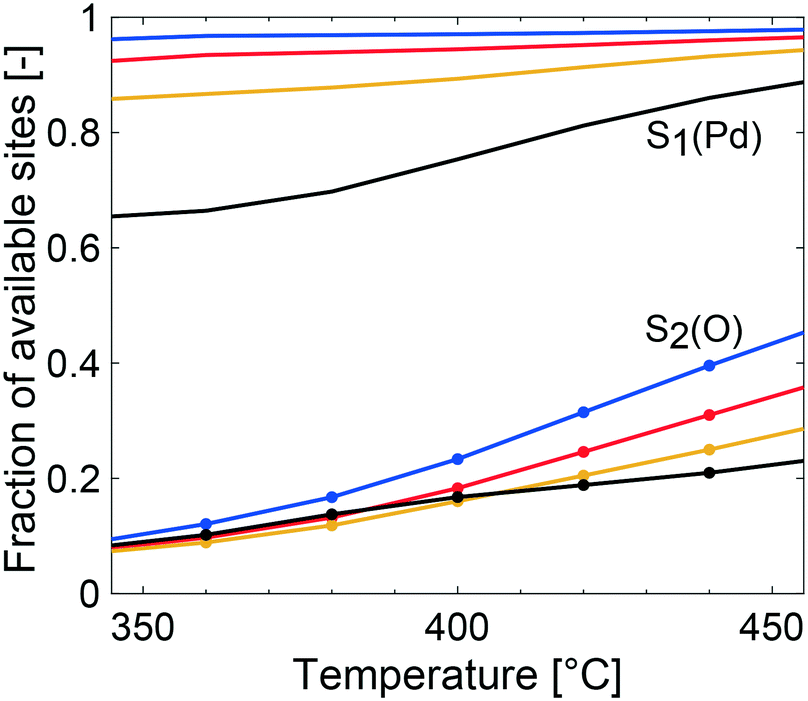 | ||
| Fig. 4 Fraction of available palladium site (S1(Pd)) and available oxygen site (S2(O)) according to the multiscale model in the Pd/Al2O3 coated monolith at 1 (blue), 2 (red), 4 (yellow) and 10 (black) atm. If there is a free S1(Pd) site next to a free S2(O) site, a free Pd–O site pair is available. Methane dissociation occurs most easily on the free Pd–O site pair. | ||
We recall that the model contains no description of support effects nor structural changes that may influence the active sites53 and the overall methane conversion. Experimentally, such effects cannot be avoided. Further, the reactor model assumes an adiabatic vessel with heat radiation losses only from the reactor inlet and outlet whereas in the experiments, other heat losses are present as well. Hence, the heat losses in the simulations are most likely underestimated, which leads to an overestimation of the activity at conditions where the exothermic reaction heat is significant. In contrast to adiabatic simulations, isothermal simulations neglecting the evolved reaction heat and assuming a uniform temperature throughout the monolith showed a severely underestimated methane conversion, see ESI.† The two types of simulations, however, indicate that the experiments most likely are best described by an adiabatic model.
4 Conclusions
The study shows that the total oxidation of methane over a Pd/Al2O3 catalyst is affected by an increased total pressure of the system. In dry conditions and at fixed molar flows, increasing the total pressure results in a higher impingement rate and increased residence time, which have a positive effect on the methane conversion. However, the external mass transfer resistance is more pronounced at higher total pressures due to a linearly decreasing bulk gas diffusion with increasing total pressure. This explains the diminishing effect of increasing the total pressure between 4 and 10 atm. Hence, increasing the total pressure creates a trade-off between the positive effect of a longer residence time and the negative effect of a decreased bulk diffusion. Furthermore, the positive effect requires a sufficiently high fraction of available active sites and a sufficient temperature to sustain the reaction rate of methane oxidation. Here an increased apparent activation energy is observed with increasing total pressure (from 70 to 80 kJ mol−1 at 1 and 10 atm, respectively) probably due to an increased product adsorption which results in adsorbed water, hydroxyl species and to some extent bicarbonates on the active site surface. The reaction order of the system decreases with increasing total pressure at low temperatures (350 °C) whereas at higher temperatures the opposite trend is observed since product adsorption is less frequent.The multiscale simulations captures the general experimental trends. At the lower temperatures the methane conversion is underestimated and the first-principles based microkinetic reaction mechanism shows a low availability of the oxygen sites compared to the palladium sites at all temperatures. The observation is interesting since the model simulations do not account for any support effects or interface sites that can affect the activity. At higher temperatures, and total pressures, the simulated activity is overestimated which indicates of an overestimation of active sites and/or an underestimated external mass transfer resistance.
Conflicts of interest
There are no conflicts to declare.Acknowledgements
This work has been performed within the Competence Centre for Catalysis, which is hosted by Chalmers University of Technology and financially supported by the Swedish Energy Agency (No. 22490-4) and the member companies AB Volvo, ECAPS AB, Johnson Matthey AB, Preem AB, Scania CV AB, Umicore Denmark ApS and Volvo Car Corporation AB. Additional support from the Swedish Research Council is acknowledged as well as computational resources at C3SE (Göteborg) via an SNIC grant. The authors would also like to thank Professor Liberato Manna for valuable comments and support.Notes and references
- A. V. Nikitin, A. S. Dmitruk and V. S. Arutyunov, Russ. Chem. Bull., 2016, 65, 2405–2410 CrossRef CAS.
- M. Appl, in Ammonia, 2. Production Processes, American Cancer Society, 2011 Search PubMed.
- Y. Hartadi, D. Widmann and R. J. Behm, J. Catal., 2016, 333, 238–250 CrossRef CAS.
- A. Ersson, H. Kušar, R. Carroni, T. Griffin and S. Järås, Catal. Today, 2003, 83, 265–277 CrossRef CAS.
- M. Reinke, J. Mantzaras, R. Schaeren, R. Bombach, A. Inauen and S. Schenker, Combust. Flame, 2004, 136, 217–240 CrossRef CAS.
- K. Persson, A. Ersson, A. M. Carrera, J. Jayasuriya, R. Fakhrai, T. Fransson and S. Järås, Catal. Today, 2005, 100, 479–483 CrossRef CAS.
- P. Piermartini, T. Schuhmann, P. Pfeifer and G. Schaub, Top. Catal., 2011, 54, 967 CrossRef CAS.
- P. S. Barbato, A. Di Benedetto, V. Di Sarli, G. Landi and R. Pirone, Ind. Eng. Chem. Res., 2012, 51, 7547–7558 CrossRef CAS.
- A. D. Benedetto, G. Landi, V. D. Sarli, P. Barbato, R. Pirone and G. Russo, Catal. Today, 2012, 197, 206–213 CrossRef.
- A. Di Benedetto, P. S. Barbato and G. Landi, Energy Fuels, 2013, 27, 6017–6023 CrossRef CAS.
- F. Sen, T. Kasper, U. Bergmann, R. Hegner and B. Atakan, Z. Phys. Chem., 2015, 229, 955–976 CAS.
- W. S. Epling and G. B. Hoflund, J. Catal., 1999, 182, 5–12 CrossRef CAS.
- F. H. Ribeiro, M. Chow and R. A. Dalla Betta, J. Catal., 1994, 146, 537–544 CrossRef CAS.
- M. R. Lyubovsky and L. D. Pfefferle, Catal. Today, 1999, 47, 29–44 CrossRef CAS.
- P. Thevenin, E. Pocoroba, L. Pettersson, H. Karhu, I. Väyrynen and S. Järås, J. Catal., 2002, 207, 139–149 CrossRef CAS.
- I. E. Beck, V. I. Bukhtiyarov, I. Y. Pakharukov, V. I. Zaikovsky, V. V. Kriventsov and V. N. Parmon, J. Catal., 2009, 268, 60–67 CrossRef CAS.
- P. Gélin and M. Primet, Appl. Catal., B, 2002, 39, 1–37 CrossRef.
- P. Gélin, L. Urfels, M. Primet and E. Tena, Catal. Today, 2003, 83, 45–57 CrossRef.
- R. Abbasi, L. Wu, S. E. Wanke and R. E. Hayes, Chem. Eng. Res. Des., 2012, 90, 1930–1942 CrossRef CAS.
- Z. Li and G. B. Hoflund, J. Nat. Gas Chem., 2003, 12, 153–160 CAS.
- J. B. Miller and M. Malatpure, Appl. Catal., A, 2015, 495, 54–62 CrossRef CAS.
- N. M. Kinnunen, J. T. Hirvi, K. Kallinen, T. Maunula, M. Keenan and M. Suvanto, Appl. Catal., B, 2017, 207, 114–119 CrossRef CAS.
- M. M. Pakulska, C. M. Grgicak and J. B. Giorgi, Appl. Catal., A, 2007, 332, 124–129 CrossRef CAS.
- R. S. Monteiro, D. Zemlyanov, J. M. Storey and F. H. Ribeiro, J. Catal., 2001, 199, 291–301 CrossRef CAS.
- R. J. Farrauto, J. K. Lampert, M. C. Hobson and E. M. Waterman, Appl. Catal., B, 1995, 6, 263–270 CrossRef CAS.
- R. Ramírez-López, I. Elizalde-Martinez and L. Balderas-Tapia, Catal. Today, 2010, 150, 358–362 CrossRef.
- O. Kröcher, M. Elsener, M.-R. Bothien and W. Dölling, MTZ worldwide, 2014, 75, 46–51 CrossRef.
- R. Bank, U. Etzien, B. Buchholz and H. Harndorf, MTZ Industrial, 2015, 3, 14–21 CrossRef.
- H. Stotz, L. Maier, A. Boubnov, A. Gremminger, J.-D. Grunwaldt and O. Deutschmann, J. Catal., 2019, 370, 152–175 CrossRef CAS.
- C.-R. Florén, M. Van den Bossche, D. Creaser, H. Grönbeck, P.-A. Carlsson, H. Korpi and M. Skoglundh, Catal. Sci. Technol., 2018, 8, 508–520 RSC.
- C.-R. Florén, P.-A. Carlsson, D. Creaser, H. Grönbeck and M. Skoglundh, Catal. Sci. Technol., 2019, 9, 3055–3065 RSC.
- M. Van Den Bossche and H. Grönbeck, J. Am. Chem. Soc., 2015, 137, 12035–12044 CrossRef PubMed.
- P. Canton, G. Fagherazzi, M. Battagliarin, F. Menegazzo, F. Pinna and N. Pernicone, Langmuir, 2002, 18, 6530–6535 CrossRef CAS.
- S. Brunauer, P. H. Emmett and E. Teller, J. Am. Chem. Soc., 1938, 60, 309–319 CrossRef CAS.
- E. P. Barrett, L. G. Joyner and P. P. Halenda, J. Am. Chem. Soc., 1951, 73, 373–380 CrossRef CAS.
- L. G. Joyner, E. P. Barrett and R. Skold, J. Am. Chem. Soc., 1951, 73, 3155–3158 CrossRef CAS.
- P. Velin, U. Stenman, M. Skoglundh and P.-A. Carlsson, Rev. Sci. Instrum., 2017, 88, 115102 CrossRef CAS PubMed.
- A. Hellman, A. Resta, N. M. Martin, J. Gustafson, A. Trinchero, P.-A. Carlsson, O. Balmes, R. Felici, R. van Rijn, J. W. M. Frenken, J. N. Andersen, E. Lundgren and H. Grönbeck, J. Phys. Chem. Lett., 2012, 3, 678–682 CrossRef CAS PubMed.
- A. Trinchero, A. Hellman and H. Grönbeck, Phys. Status Solidi RRL, 2014, 8, 605–609 CrossRef CAS.
- C. Ericson, B. Westerberg and I. Odenbrand, SAE World Congress & Exhibition, 2008 Search PubMed.
- D. Creaser, X. Karatzas, B. Lundberg, L. J. Pettersson and J. Dawody, Appl. Catal., A, 2011, 404, 129–140 CrossRef CAS.
- M. M. Azis, H. Härelind and D. Creaser, Chem. Eng. J., 2013, 221, 382–397 CrossRef CAS.
- S. C. Shekar, K. R. Rao and E. Sahle-Demessie, Appl. Catal., A, 2005, 294, 235–243 CrossRef CAS.
- J. Kim, M. J. Kelly, H. H. Lamb, G. W. Roberts and D. J. Kiserow, J. Phys. Chem. C, 2008, 112, 10446–10452 CrossRef CAS.
- B. Torkashvand, A. Gremminger, S. Valchera, M. Casapu, J.-D. Grunwaldt and O. Deutschmann, SAE Technical Paper Series, 2017 Search PubMed.
- T. Rammelt, B. Torkashvand, C. Hauck, J. Böhm, R. Gläser and O. Deutschmann, Emiss. Control Sci. Technol., 2017, 3, 275–288 CrossRef CAS.
- R. Monteiro, D. Zemlyanov, J. Storey and F. Ribeiro, J. Catal., 2001, 199, 291–301 CrossRef CAS.
- G. Zhu, J. Han, D. Y. Zemlyanov and F. H. Ribeiro, J. Phys. Chem. B, 2005, 109, 2331–2337 CrossRef CAS PubMed.
- R. E. Hayes, S. T. Kolaczkowski, P. K. Li and S. Awdry, Chem. Eng. Sci., 2001, 56, 4815–4835 CrossRef CAS.
- R. Gholami, M. Alyani and K. J. Smith, Catalysts, 2015, 5, 561–594 CrossRef CAS.
- T. Choudhary, S. Banerjee and V. Choudhary, Appl. Catal., A, 2002, 234, 1–23 CrossRef CAS.
- R. Burch, F. Urbano and P. Loader, Appl. Catal., A, 1995, 123, 173–184 CrossRef CAS.
- J. J. Willis, A. Gallo, D. Sokaras, H. Aljama, S. H. Nowak, E. D. Goodman, L. Wu, C. J. Tassone, T. F. Jaramillo, F. Abild-Pedersen and M. Cargnello, ACS Catal., 2017, 7, 7810–7821 CrossRef CAS.
Footnotes |
| † Electronic supplementary information (ESI) available. See DOI: 10.1039/d0cy00813c |
| ‡ These authors contributed equally to this work. |
| This journal is © The Royal Society of Chemistry 2020 |