 Open Access Article
Directing nitrogen-doped carbon support chemistry for improved aqueous phase hydrogenation catalysis†
Monika
Bosilj
 ab,
Lina
Rustam
a,
Ralf
Thomann
c,
Julia
Melke
 bcd,
Anna
Fischer
 *bcd and
Robin J.
White
 *ae
*ae
aFraunhofer Institute for Solar Energy Systems ISE, Heidenhofstraße 2, 79110 Freiburg im Breisgau, Germany
bInstitute for Inorganic and Analytical Chemistry, Albert-Ludwigs-Universität Freiburg, Albertstraße 21, 79104 Freiburg im Breisgau, Germany. E-mail: anna.fischer@ac.uni-freiburg.de
cFreiburg Material Research Center, FMF, Albert-Ludwigs-Universität Freiburg, Stefan-Meier-Straße 21, 79104 Freiburg im Breisgau, Germany
dFreiburg Center for Interactive Materials and Bioinspired Technologies, FIT, Albert-Ludwigs-Universität Freiburg, Georges-Köhler-Allee 105, 79110 Freiburg im Breisgau, Germany
eNetherlands Organization for Applied Scientific Research, TNO, High Tech Campus 25, 5656 AE Eindhoven, Netherlands. E-mail: robin.white@tno.nl
First published on 1st July 2020
Abstract
Selective hydrogenations in the aqueous phase are an important transformation in the context of developing biorefinery concepts. In this report the application and optimisation of nitrogen-doped carbon (NDC) supported Pd nanoparticles as hydrogenation catalysts is discussed in the context of directing support (e.g. N) chemistry for improved catalytic performance in the aqueous phase. As a demonstrative example, the aqueous phase hydrogenation of phenol to cyclohexanone (e.g. a platform for polyamide production) is utilised. Catalyst supports were prepared based on an initial hydrothermal synthesis to yield NDC xerogels (from biomass precursors), the chemistry of which (e.g. functionality) was directed using a secondary thermal carbonisation (Tc) step at different temperatures (i.e. 350, 550, 750, 900 and 1000 °C). After Pd introduction, it was found that size, dispersion and electronic structure of the formed nanoparticles is affected by the surface chemistry of the NDC. This consequently led to higher turn-over frequency (TOF) and stability of the prepared catalysts compared to a “nitrogen-free” carbon supported Pd and a commercial, carbon supported Pd (Pd/AC) catalyst. Pd/NDC 900 (featuring predominantly quaternary and pyridinic N) catalysed the complete conversion of phenol at 99% selectivity to cyclohexanone, with excellent stability over 11 recycles and no discernible catalyst sintering or leaching (in contrast to the commercial catalyst). High catalytic stability, activity and selectivity make the Pd/NDC 900 catalyst highly applicable for aqueous phase hydrogenation reactions, whilst the general principle opens scope for support tailoring for application (e.g. biorefinery hydrogenations) and the development of structure/activity relationships.
Introduction
With a view to utilising phenolic-rich streams from biorefineries (e.g. via lignin deconstruction processes), liquid-phase hydrogenations should be operated under less demanding energy conditions.1,2 Such transformations will be performed in the liquid phase, often in polar (e.g. aqueous/alcoholic) solvents; adding another dimension to designing appropriate heterogeneous catalysts. In this context, cyclohexanone is an important base for the synthesis of caprolactam (i.e. for nylon-6) and adipic acid (i.e. for nylon-6,6).3,4 Industrially, cyclohexanone is manufactured based on the oxidation of cyclohexane5 or the hydrogenation of phenol.6 Through hydrogenation, cyclohexanone is either synthesised in two steps in the vapour phase or via a potentially more energy and cost efficient one-step liquid phase reaction.4,7–9 Further, as a more general consideration, performing liquid phase hydrogenations in environmentally friendly solvents such as water, would also be beneficial as the use of hazardous solvents (e.g. dichloromethane10,11) becomes increasingly regulated.The hydrogenation of phenol follows a consecutive pathway (Scheme 1).12 To synthesize cyclohexanone, the aromatic ring of phenol must be selectively hydrogenated to 1-hydroxy-cyclohexene, itself undergoing tautomerization to cyclohexanone.13 Further hydrogenation leads to the undesired product, cyclohexanol.14,15 Therefore, and with particular reflection on catalyst development, it is important that cyclohexanone is weakly adsorbed on the catalyst surface and thus desorbs readily before further hydrogenation proceeds. This is challenging if the enol is strongly adsorbed on the catalyst, leading to cyclohexanol formation favoured by associated keto/enol equilibrium thermodynamics and kinetic favorability.4
 | ||
| Scheme 1 The reaction pathway of phenol hydrogenation to the desired cyclohexanone in the liquid phase. | ||
Pd/AC is a commonly used industrial catalyst in hydrogenation reactions (e.g. phenol hydrogenation16–18). Despite its wide applications in industrial processes, such as in the hydrogenation of organic fine chemicals, aromatic hydrogenations etc., the morphological changes of Pd entities and consequently a decrease of activity down to uneconomic levels are typical reasons for the deactivation of palladium catalysts supported on carbons.19 With reference to the successful implementation of biorefinery concepts, catalytic materials will be required that possess improved hydrothermal stability under aqueous operating conditions and tailored surface chemistry (e.g. appropriate wettability) to control product/reactant adsorption. With a view to improving on commercial activated carbon, heteroatom doping, most commonly with “N”, is known to positively influence the interaction between support and nanoparticle (NP) (i.e. metal support interaction), often leading to improved catalytic activity and stability in hydrogenation reactions.20,21 The ability to direct N-containing functionality on a porous carbon structure is potentially advantageous with regard to NP size/distribution, NP support attachment as well as NP electronic structure.22–26 Furthermore, N-doping can also lead to improved oxidation and catalyst stability.27 Using HTC to produce carbon materials is also attractive with respect to directing material properties (e.g. surface chemistry, porosity etc.) through sol–gel-like syntheses.28 Combining this with Tc selection opens scope to develop first principle structure–activity relationships. Moreover, using renewable feedstocks for synthesis of N-doped carbon materials is another advantage (e.g. vs. use of toxic or hazardous chemicals or processes to introduce N groups).29
Based on this idea and on previous reports,30–32 the use of nitrogen-doped carbons (NDC) (as prepared through the hydrothermal carbonisation (HTC) of biomass-derived precursors) were investigated in the present manuscript as “tunable” support media for hydrogenation catalysts. The chemistry of these NDC xerogels was then directed through a thermal carbonisation step at a defined temperature (denoted as Tc) (e.g. to direct N bonding motif).32,33 Following an incipient wetness impregnation, the resulting NDC-supported Pd NP catalysts were investigated for the aqueous phase hydrogenation of phenol to cyclohexanone, with the aim of demonstrating the impact of subtle variations in support chemistry on catalytic performance and stability.
In this report, the impact of altering NDC support chemistry on the catalytic activity of deposited Pd NPs has been investigated, using the aqueous phase hydrogenation of phenol as demonstrative reaction. Properties and catalytic performance of Pd/NDC catalysts were compared to Pd NPs supported on a “nitrogen-free” HTC carbon (Pd/HTC) and a commercial AC supported Pd catalyst (Pd/AC) (matrix activated carbon, Degussa type E1003 U/W). Besides a superior performance, Pd/NDC 900 (Tc = 900 °C) was shown to have an improved stability (e.g. inhibition of NP leaching/sintering) when compared to the commercial Pd/AC catalyst.
Results and discussion
NDC xerogels were carbonised at increasing temperatures (Tc = 350, 550, 750, 900, 1000 °C) under N2 flow. The recovered porous carbons were impregnated with tetraaminepalladium(II) nitrate via incipient wetness impregnation. An un-doped “nitrogen-free” HTC supported Pd catalyst was also prepared (denoted as Pd/HTC 550). CHNS elemental analysis (EA) of the NDCs showed decreasing nitrogen amounts with increasing Tc (Table 1). The O content was calculated from the CHNS elemental analysis by assuming that the residual wt% after substraction of the C, H, N, S wt% is ascribed to oxygen. The N content decreased from 4.3 wt% (NDC 350) to 2.1 wt% (NDC 1000), with an O content reducing from 16.2 to 8.3 wt% over the same Tc range. The pristine NDC product, i.e. directly after the HTC synthesis without further carbonisation (denoted as NDC 180) contained 5.6 wt% nitrogen. The trends observed from this bulk EA analysis are consistent with the results obtained from surface XPS analysis, confirming the uniform distribution of C, N and O through the structure of the NDC supports.| Support | S BET [m2 g−1] | V pore [cm3 g−1] | V meso [cm3 g−1] | C/N/H/O [wt%]EA | C/N/O [atom%]XPS |
|---|---|---|---|---|---|
| a Specific surface area from BET method. b Pore size characteristics obtained via the QSDFT model based on N2 adsorption data. | |||||
| NDC 350 | 293 | 0.36 | 0.28 | 75.1/4.3/4.4/16.2 | 84.9/3.6/11.5 |
| NDC 550 | 462 | 0.35 | 0.22 | 83.6/4.3/2.5/9.6 | 88.8/3.2/8.0 |
| NDC 750 | 344 | 0.21 | 0.12 | 86.1/3.6/1.7/8.6 | 93.4/2.8/3.8 |
| NDC 900 | 250 | 0.19 | 0.16 | 87.3/2.9/1.4/8.4 | 94.8/2.4/2.8 |
| NDC 1000 | 173 | 0.16 | 0.14 | 88.3/2.1/1.3/8.3 | 95.6/1.8/2.6 |
| HTC 550 | 476 | 0.43 | 0.29 | 83.0/—/2.7/14.3 | 95.1/—/4.9 |
Regarding porosity, NDC 180 presented a surface area (SBET) and a pore volume (Vpore) of 138 m2 g−1 and 0.20 cm3 g−1, respectively. Thermal carbonisation at Tc ≤ 550 °C, led to an increase in SBET and Vpore, as HTC decomposition products trapped in the NDC 180 pores are thermally removed (Table 1). As Tc further increased (Tc ≥ 750 °C), the porosity and specific surface area was found to decrease, as a result of further carbon structure alterations (pore closure and material contraction). All NDC supports presented type IV/H3 reversible N2 adsorption isotherms with a pore size distribution reflecting the expected xerogel structure, featuring partially defined maxima in the micropore range (pore diameter ∼1 nm) and lower mesopore region (pore diameter ∼3 nm) (Fig. S1† – calculated using a quenched solid density functional theory (QSDFT) method).
SEM images of the prepared NDC materials demonstrated a coral-like continuous porous structure (Fig. S2†); consistent with similar aerogel materials reported previously by White et al.30 At Tc > 550 °C, the NDC structure became increasingly finer due to the carbonisation process(es) and network contraction, which is in good agreement with the N2 sorption results. The structure of the HTC 550 support was by contrast composed of aggregated spherical NPs with diameters ≤20 nm (in agreement with morphologies discussed in an earlier report).33,34
Inductively coupled plasma optical emission spectroscopy (ICP-OES, Table 2), indicated a relatively consistent Pd loading (4.5 ± 0.3 wt%), despite different SBET and pore volumes, approaching the theoretical target of 5.0 wt%. For Pd/AC a similar Pd loading was determined (4.2 wt%).
| Catalyst | S BET [m2 g−1] | V pore [cm3 g−1] | V meso [cm3 g−1] | Average Pd crystallite size [nm]XRD | Pd [wt%]ICP | C/N/Pd [atom%]XPS | Hydrophilicity indexc | Pd dispersiond [%] |
|---|---|---|---|---|---|---|---|---|
a Specific surface area from BET method.
b Pore size characteristics obtained via the QSDFT model.
c Hydrophilicity index calculated: amount of adsorbed H2O/amount of adsorbed N2 at P/P0 = 0.93.
d Pd dispersion calculated from H2 pulsed chemisorption for a Pd/H ratio of 1![[thin space (1/6-em)]](https://www.rsc.org/images/entities/char_2009.gif) : :![[thin space (1/6-em)]](https://www.rsc.org/images/entities/char_2009.gif) 1. 1.
|
||||||||
| Pd/NDC 350 | 287 | 0.18 | 0.17 | 3.3/10.3 | 4.3 | 84.4/4.1/0.4 | 0.36 | 7.9 |
| Pd/NDC 550 | 410 | 0.13 | 0.05 | 5.5/21.6 | 4.1 | 90.4/3.6/0.4 | 0.39 | 4.5 |
| Pd/NDC 750 | 334 | 0.21 | 0.13 | 4.6 | 4.7 | 89.8/3.2/1.1 | 0.24 | 14.2 |
| Pd/NDC 900 | 224 | 0.20 | 0.16 | 4.4 | 4.4 | 91.7/2.7/0.8 | 0.24 | 16.4 |
| Pd/NDC 1000 | 182 | 0.15 | 0.14 | 4.8 | 4.4 | 94.0/1.4/0.6 | 0.04 | 11.1 |
| Pd/HTC 550 | 432 | 0.31 | 0.18 | 1.4 | 4.1 | 93.6/—/1.0 | 0.33 | 9.4 |
| Pd/AC | 835 | 0.57 | 0.34 | 1.6/10.9 | 4.2 | 79.7/—/4.2 | 0.62 | 60.0 |
To investigate the influence of different support properties on Pd crystallite size, XRD patterns were acquired and analysed by Rietveld refinement (Fig. 1 measured in Bragg–Brentano geometry). The broadened reflection with a maximum at 2θ = 24.2° is associated with the carbon support (NDC, HTC, AC). The higher the Tc, the more defined this reflection appears in line with increasing ordering and stacking of the carbon phase. For Pd/AC, reflections with a maximum at 2θ = 34.1°, 43.1°, 55.7°, 61.0° and 72.9° correspond to the (002/101), (110), (112), (103) and (202) reflections of PdO, respectively.35,36 All other catalysts show the typical (111), (200), (220), (311) and (222) reflections of face-centred cubic (fcc) palladium nano-crystallites.
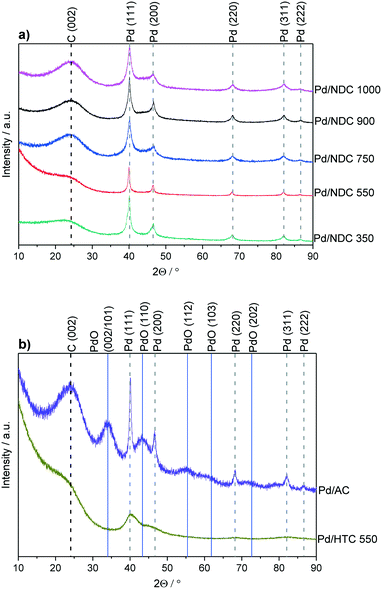 | ||
| Fig. 1 XRD patterns for a) Pd/NDC catalysts and b) Pd/AC and Pd/HTC 550 catalysts. Measured in Bragg–Brentano geometry. | ||
The average Pd crystallite size was determined through Rietveld refinement (see ESI,† Fig. S7 and S8 measured in Debye–Scherrer geometry). Bimodal particle size distribution was revealed for Pd/NDC 350, Pd/NDC 550 and Pd/AC, whilst for Pd/NDC 750, Pd/NDC 900 and Pd/NDC 1000 monomodal distributions were observed (Table 2). For the NDC supports carbonised at higher Tc (≥750 °C) smaller Pd nano-crystallites were obtained than for NDCs carbonised at lower Tc. In addition, very small Pd nano-crystallites were found on HTC 550 with a size of circa 1.4 nm with a monomodal size distribution. Smaller Pd size may be explained by different support morphologies (spherical NPs) and different surface chemistries. The HTC 550 support is “N-free” and contains less oxygen in comparison to the NDC supports (with the exception of the NDC 350 support). Therefore different interactions between Pd and the HTC support in the absence of N doping are expected than for the NDC supports (as discussed in more detail below with regard to XPS analysis). For the commercial Pd/AC the Pd crystallite size was found to be bimodal – 1.6 nm for the smaller and 10.9 nm for the larger size ranges.
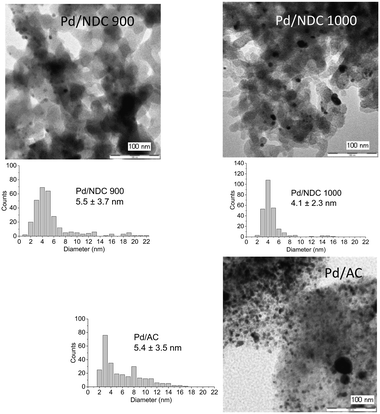
TEM images reveal a broad Pd NP size range on the AC support, with an average size of 5.4 ± 3.5 nm (Fig. 3). This broad particle size distribution presumably arises due to interactions between the AC support and the Pd NPs, which are not strong enough to prevent aggregation or sintering, and with the porous structure not providing any confinement benefits (i.e. predominantly microporous). TEM images of Pd/HTC 550 reveal the smallest NPs with a narrow particle size distribution; in agreement with XRD results (Table 2). TEM of Pd/NDC 350 and Pd/NDC 550 (Fig. 2) confirms the bimodal particle size distribution found by XRD (Fig. 1a). The impact of surface chemistry specifically of nitrogen-doped carbons (e.g. N-species) on Pd NPs size and distribution has been reported in the literature23,37,38 and will be discussed in more detail below with regard to XPS analysis.
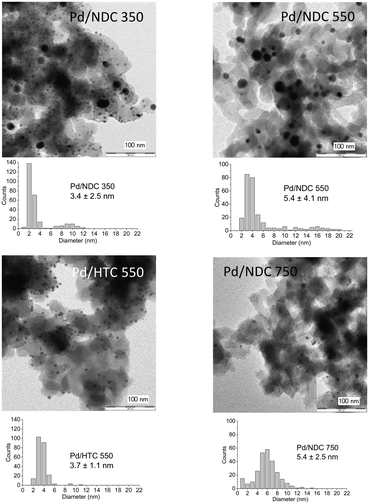 | ||
| Fig. 2 TEM images of the investigated supported Pd catalysts (5 wt% Pd loading) and their corresponding particle size distributions. | ||
In order to confirm that Pd is present in the form of nanoparticles and not as single molecular Pdδ+ sites, scanning electron microscopy in transmission mode (TE-SEM) coupled with energy dispersive X-ray spectroscopy (EDX) analysis of Pd/NDC 900 was further performed (Fig. 4). The local TE-SEM-EDX analysis revealed a homogeneous distribution of N, C and O in the system. The comparison of the EDX spectra of “Area 1” and “Area 3” with visible Pd NPs in comparison to “Area 2” with no visible Pd particles, indicates that Pd is predominantly (in line with XRD) present as NPs and the presence of single molecular sites on the NDC 900 support can largely be excluded.
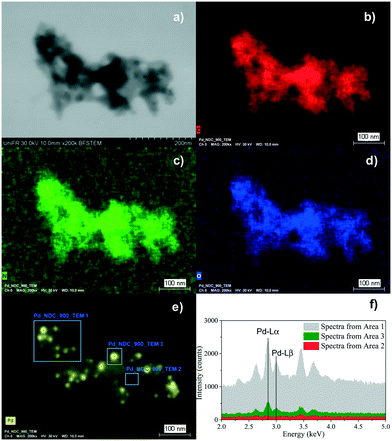 | ||
| Fig. 4 TE-SEM image of the Pd/NDC 900 catalyst (a), and the corresponding EDX elemental mapping images (b–e) and local EDX spectrum (f). | ||
H2O adsorption analysis were performed and a hydrophilicity index was calculated for all investigated samples according to the description given in ref. 39 in order to compare the hydrophilicity between the catalysts with distinct morphologies (Table 2, ESI† Fig. S5). The hydrophilicity of carbon materials can be in part influenced by the presence of oxygen as well as nitrogen functional groups on the carbon material surface.40,41 Pd catalysts supported on NDC carbonised at low Tc ≤ 550 °C show a higher hydrophilicity index than Pd/NDC catalysts carbonised at higher Tc, suggesting that Tc controls the hydrophilicity of the Pd/NDC catalysts. These results are in line with the amount of O and N functional groups in/on the carbons. Fig. S6 in ESI† shows the correlation between the Tc and the N and O surface amount on NDC. The amount of N functional groups on the Pd/NDC catalysts was determined by surface X-ray photoelectron spectroscopy (XPS) analysis, which confirms a decrease in N amount with increasing Tc. However, the determination of the O amount on the surface of the Pd catalysts is not straightforward by XPS due to the overlap between the O 1s and the Pd 3p3/2 core levels (which will be discussed in more detail below with regard to XPS analysis). The “N-free” Pd/HTC 550 catalyst shows a slightly lower hydrophilicity index than the Pd/NDC 550 catalyst, which was carbonised at the same Tc. Commercial Pd/AC catalyst obtained the highest hydrophilicity index indicating the highest degree of hydrophilicity in line with the highly oxidised surface of the activated carbon as a consequence of the activation process.42 These results indicate that Tc controls the hydrophilicity of the Pd/NDC catalysts, which may greatly improve the catalyst dispersibility in aqueous media and in turn contribute to a better catalytic performance.43–45
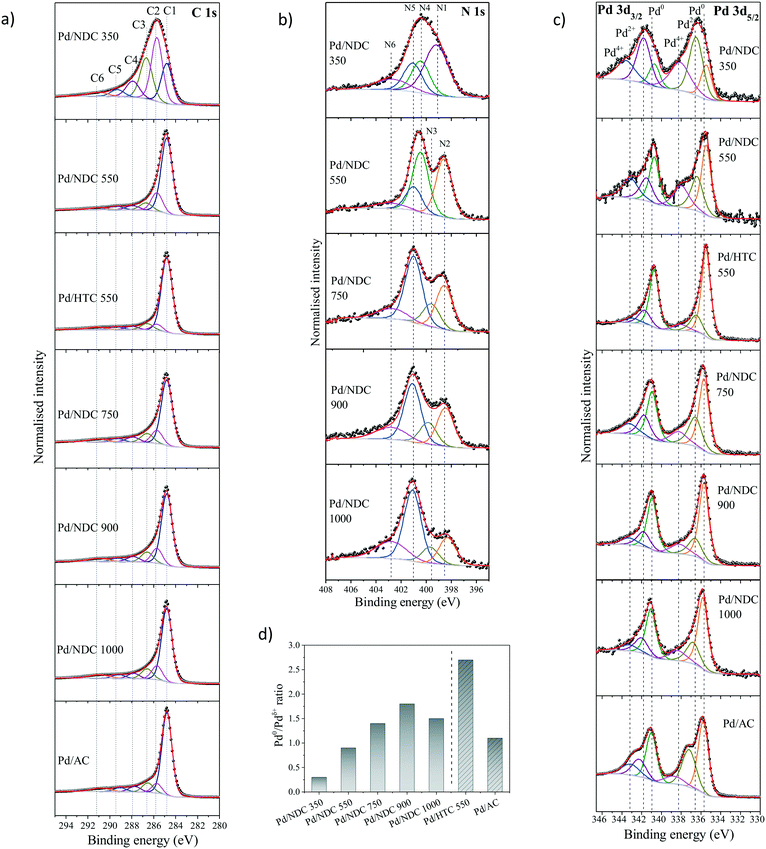
The chemical environments of C and N in the NDC supports and the oxidation state of the investigated Pd/NDC, Pd/HTC and Pd/AC catalysts were examined using X-ray photoelectron spectroscopy (XPS) (Table 2 and Fig. 5). The core level peaks were fitted after a Shirley background subtraction and core level spectra were calibrated vs. the C 1s peak (binding energy (BE) = 284.8 eV). The main problem in the XPS analysis of the oxygen/palladium system is the overlap between the O 1s and Pd 3p3/2 core level,46,47 therefore the O 1s contribution of the Pd catalysts was not analysed. The O 1s core level peak fitting of the NDC and HTC 550 support materials without Pd is presented in ESI† (Tables S3 and S4 and Fig. S3). Four main oxygen functional groups were revealed, namely carbonyls (O1), carboxylic (O2), oxygen singly bonded to carbon in aromatic rings (O3), like in phenols and ethers and occluded CO or CO2 (O4).48 It is observed that with higher Tc ≥ 550 °C the amount of oxygen singly bonded to carbon decreases. A significant difference was observed for the “N-free” HTC 550 material, which exhibited a higher amount of oxygen in a singly bonded state to carbon and a lower amount of carbonyl functional groups. This confirms large differences in the oxygenated surface chemistry of the HTC 550 material compared to the NDC material carbonised at the same temperature.
High-resolution XPS analysis of the C 1s photoelectron envelopes of the investigated catalysts was also conducted (Fig. 5a). The C 1s envelope is characterised by five main contributions (ESI,† Table S1 and S2) with BEs of 284.8 eV (C1, C![[double bond, length as m-dash]](https://www.rsc.org/images/entities/char_e001.gif) C, sp2), 285.7 eV (C2, C–C and C–Hx), 286.5–286.7 eV (C3, C–N/C–O), 287.7–287.9 eV (C4, C
C, sp2), 285.7 eV (C2, C–C and C–Hx), 286.5–286.7 eV (C3, C–N/C–O), 287.7–287.9 eV (C4, C![[double bond, length as m-dash]](https://www.rsc.org/images/entities/char_e001.gif) O/C
O/C![[double bond, length as m-dash]](https://www.rsc.org/images/entities/char_e001.gif) N) and 289.1–289.4 eV (C5, O–C
N) and 289.1–289.4 eV (C5, O–C![[double bond, length as m-dash]](https://www.rsc.org/images/entities/char_e001.gif) O) respectively.30,49,50 In addition, BEs at 290.8–291.2 eV (C6) is attributed to π–π* shake up satellites and the presence of pre-graphitic polyaromatic domains. As expected, Pd/NDC 350 (with the lowest Tc) has the largest contribution from C–C/C–Hx (34.7 at%), C–N/C–O (24.5 at%) and of C
O) respectively.30,49,50 In addition, BEs at 290.8–291.2 eV (C6) is attributed to π–π* shake up satellites and the presence of pre-graphitic polyaromatic domains. As expected, Pd/NDC 350 (with the lowest Tc) has the largest contribution from C–C/C–Hx (34.7 at%), C–N/C–O (24.5 at%) and of C![[double bond, length as m-dash]](https://www.rsc.org/images/entities/char_e001.gif) O/C
O/C![[double bond, length as m-dash]](https://www.rsc.org/images/entities/char_e001.gif) N (10.5 at%) in comparison to the other Pd/NDC catalysts.
N (10.5 at%) in comparison to the other Pd/NDC catalysts.
The reduction in N-content for the NDC materials as characterised by EA (Table 1) was also observed and further confirmed via XPS (Table 1). These results indicate a homogeneous distribution of nitrogen at the surface and in the bulk of the NDC carbon materials (e.g. decomposition proceeds uniformly as a consequence of the thin branched porous structure). As expected, increasing Tc from 350 to 1000 °C, results in a decrease in N-content in Pd/NDC catalysts at the surface, from 4.1 at% to 1.4 at%, respectively (Table 2). Regarding the corresponding high resolution N 1s photoelectron envelopes (Fig. 5b), peak fitting revealed for Pd/NDC 350 mainly thermally unstable species such as pyrrolic (N4; 400.4 eV) and amine (N1; 399.2 eV) which are present at the surface.51 For Tc ≥ 550 °C, pyridinic N (N2; 398.3–398.6 eV) and quaternary N or graphitic N (N5; 401.0–401.1 eV) become increasingly prevalent, alongside contributions from pyridinic-N-oxide (N6; 402.7–402.9 eV) attributed to chemisorption processes (e.g. during sample handling in air).52 It was observed that with increasing Tc (Tc ≥ 750 °C) a small shift of ca. 0.1–0.2 eV to higher BE is detectable for pyridinic N (N2) species in Pd/NDC 750/900/1000 catalysts in comparison to Pd free NDC supports. An additional component (N3) is required for the NDCs catalysts with Tc ≥ 750 °C; component, which is attributed to the N–Pd interaction. The N 1s core level spectra of the Pd/NDC catalysts were compared to the N 1s of the NDC support materials before Pd impregnation and a clear contribution of an N–Pd interaction peak is observed for Pd/NDC catalysts with Tc ≥ 750 °C (Fig. 6 and Table 3). The binding energy assigned to a N–Pd interaction is found to be in the same range as reported previously for metal–nitrogen interactions.53Table 3 summarises all N 1s BEs and at% of the respective N species for the Pd/NDC catalysts and corresponding Pd-free NDC supports.
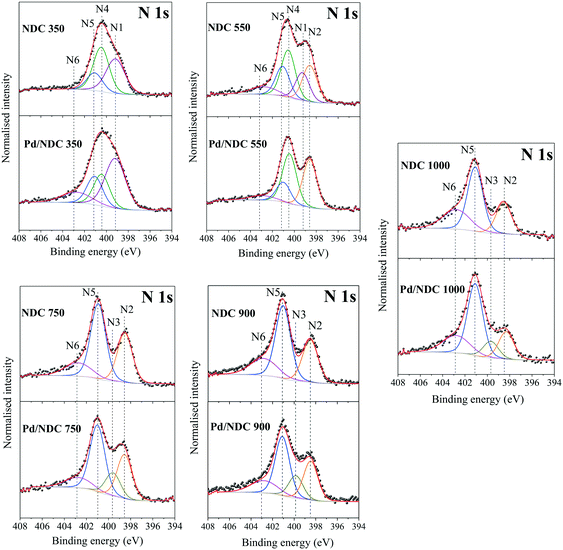 | ||
| Fig. 6 High-resolution XPS scans of N 1s region of NDC supports in comparison to the NDC supports impregnated with Pd. | ||
| Catalyst/support | N1 (amine, R-NH2) | N2 (pyridine, C6H5N) | N3 (N–Pd) | N4 (pyrrole, C4H5N) | N5 (quaternary N, [N-R4]+) | N6 (pyr-N-oxide, C5H5N+O−) | ||||||
|---|---|---|---|---|---|---|---|---|---|---|---|---|
| B.E. (eV) | at% | B.E. (eV) | at% | B.E. (eV) | at% | B.E. (eV) | at% | B.E. (eV) | at% | B.E. (eV) | at% | |
| Pd/NDC 350 | 399.2 | 44.8 | — | — | — | — | 400.4 | 21.7 | 401.1 | 19.4 | 402.8 | 14.0 |
| NDC 350 | 399.1 | 37.8 | — | — | 400.4 | 37.8 | 401.0 | 17.9 | 402.8 | 6.5 | ||
| Pd/NDC 550 | — | — | 398.6 | 38.2 | — | — | 400.4 | 39.5 | 401.0 | 15.7 | 402.9 | 6.6 |
| NDC 550 | 399.2 | 17.5 | 398.6 | 24.1 | — | — | 400.5 | 29.9 | 401.1 | 18.0 | 402.8 | 9.7 |
| Pd/NDC 750 | — | — | 398.5 | 28.9 | 399.6 | 15.2 | — | — | 401.0 | 43.6 | 402.7 | 12.2 |
| NDC 750 | — | — | 398.5 | 33.2 | — | — | — | — | 401.0 | 50.6 | 402.7 | 16.2 |
| Pd/NDC 900 | — | — | 398.4 | 27.1 | 399.8 | 15.6 | — | — | 401.1 | 41.0 | 402.8 | 16.3 |
| NDC 900 | — | — | 398.5 | 29.0 | — | — | — | — | 401.1 | 49.6 | 402.9 | 21.0 |
| Pd/NDC 1000 | — | — | 398.3 | 18.7 | 399.7 | 11.4 | — | — | 401.1 | 48.8 | 402.8 | 21.2 |
| NDC 1000 | — | — | 398.5 | 24.2 | — | — | — | — | 401.1 | 49.1 | 402.8 | 26.8 |
The fits of the Pd 3d photoelectron envelopes consist of three doublet components (Fig. 5c, Table 4 and in ESI† Table S6), in Pd 3d5/2 namely Pd0 (335.5–335.8 eV),54 Pd2+ (336.4–337.2 eV)55 and Pd4+ (338.0–338.8 eV).56Table 4 summarises all the BEs and respective at% found in the Pd 3d high resolution spectra of the Pd/NDC catalysts in comparison to the Pd/AC and the Pd/HTC 550 catalysts as determined by XPS Pd 3d core level peak fitting. BEs for Pd 3d5/2 and Pd 3d3/2 electronic states of Pd0 were observed to shift towards higher values with increasing Tc. As shown previously, the surface chemistry of the support significantly changes with increasing Tc, which might influence the electronic properties of the Pd NPs and consequently contribute to a shift to higher binding energies of the Pd 3d BE. Shifting of the Pd 3d BE to higher BE was reported in the literature as a result of charge transfer from Pd NPs to N-species (e.g. pyridinic N) on the surface of carbon supports.47,57,58
| Catalyst | Pd 3d5/2 | Pd 3d3/2 | ||||||||||||
|---|---|---|---|---|---|---|---|---|---|---|---|---|---|---|
| B.E. Pd0 | at% | B.E. Pd2+ | at% | B.E. Pd4+ | at% | Ratio Pd0/Pdδ+ | B.E. Pd0 | at% | B.E. Pd2+ | at% | B.E. Pd4+ | at% | Ratio Pd0/Pdδ+ | |
| Pd/NDC 350 | 335.5 | 12.0 | 336.5 | 26.7 | 338.1 | 19.7 | 0.3 | 340.7 | 8.0 | 341.8 | 20.8 | 343.6 | 13.0 | 0.2 |
| Pd/NDC 550 | 335.5 | 27.4 | 336.4 | 16.8 | 338.0 | 13.6 | 0.9 | 340.7 | 18.2 | 341.5 | 11.7 | 343.1 | 12.4 | 0.8 |
| Pd/HTC 550 | 335.5 | 42.7 | 336.5 | 10.9 | 338.0 | 4.9 | 2.7 | 340.7 | 28.5 | 341.7 | 8.9 | 343.0 | 4.0 | 2.2 |
| Pd/NDC 750 | 335.7 | 34.2 | 336.7 | 16.9 | 338.4 | 7.4 | 1.4 | 341.0 | 22.8 | 341.8 | 10.4 | 343.2 | 8.4 | 1.5 |
| Pd/NDC 900 | 335.7 | 38.4 | 336.6 | 12.3 | 338.2 | 8.5 | 1.8 | 341.0 | 25.6 | 341.8 | 10.0 | 343.3 | 5.7 | 1.6 |
| Pd/NDC 1000 | 335.8 | 36.2 | 336.8 | 15.4 | 338.4 | 8.4 | 1.5 | 341.1 | 24.1 | 342.0 | 10.8 | 343.3 | 5.0 | 1.5 |
| Pd/AC | 335.8 | 31.9 | 337.2 | 21.7 | 338.8 | 6.6 | 1.1 | 341.0 | 21.3 | 342.3 | 10.1 | 342.3 | 10.1 | 1.1 |
In order to investigate possible interactions between the Pd NPs and the NDC supports, the BEs of the pyridinic N in the NDC supports and in the Pd/NDC catalysts were plotted with the Pd 3d5/2 BE (Fig. 7). An increase towards higher BE (from 335.5 eV to 335.8 eV) of the Pd0 3d5/2 BE is observed for increasing Tc. With Tc ≥ 750 °C predominantly pyridinic and quaternary N are present on the surface of the carbon support. In line with the shift towards higher BE (0.1–0.3 eV) with increasing Tc of the Pd0 3d5/2 BE, the BE of the pyridinic N in the Pd/NDC catalysts decreases by ca. 0.1–0.2 eV with increasing Tc when compared to the BE of the pyridinic N in the Pd-free NDC support. The concomitant shift of BE towards lower BE of the pyridinic N groups in the Pd/NDC catalysts carbonised at Tc ≥ 750 °C with the shift of the Pd0 3d5/2 BE to higher BE indicate an electron donation from the Pd to the pyridinic N on the support. For Pd/NDC 350 and Pd/NDC 550 a lower Pd0 3d5/2 BEs of 335.5 eV was observed, indicating no charge transfer between Pd and the respective support. For the quaternary N in the NDC support, no significant differences between the BE before and after Pd impregnation were observed (ESI,† Fig. S4) suggesting no charge transfer between quaternary N and Pd.22
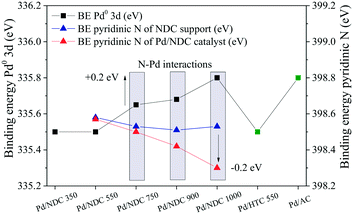 | ||
| Fig. 7 Effects of electron transfer from Pd0 3d to pyridinic N in Pd/NDC 750, Pd/NDC 900 and Pd/NDC 1000 catalyst. | ||
Regarding the “N-free” Pd/HTC 550 and Pd/AC catalysts, different interactions between the Pd and the supports are expected. The Pd0 3d5/2 BE of the Pd/AC catalyst is at higher BE (335.8 eV) when compared to the Pd0 3d5/2 BE of the Pd/HTC 550 catalysts (335.5 eV). The higher BE in the case of the Pd/AC catalyst might be attributed to the highly oxygenated surface (as indirectly proved by the H2O adsorption measurements, Table 2, hydrophilicity index). Indeed, it has been reported in the literature that electron-depleted Pd atoms may be a result of a charge transfer between Pd and oxygenated surface functionalities of the carbon support.57,59 Contrary, Pd/HTC 550 exhibits a more hydrophobic surface (and hence should expose less oxygenated groups at its surface) and consequently a lower BE of Pd0 3d5/2 is found.
The Pd 3d5/2 state analysis indicated lower Pd0/Pdδ+ ratios (where Pdδ+ is sum of Pd2+ and Pd4+ at%) for Pd/NDC 350 and Pd/NDC 550 (Fig. 5d). This suggests the presence of higher amounts of PdOx surface oxides on the Pd/NDC catalysts carbonised at Tc ≤ 550 °C. Considering the “N-free” catalysts, a significantly higher Pd0/Pdδ+ ratio was obtained for the Pd/HTC 550 catalyst when compared to the Pd/AC catalyst.
The Pd dispersion was investigated by means of pulsed H2 chemisorption. The ratio between the number of Pd atoms available for H2 adsorption at the nanoparticle surface to the total number of Pd atoms is used in this paper as a measure of palladium dispersion. A H to Pd stoichiometry of 1 was assumed to determine the Pd dispersion. The data are presented in Table 2 and reveal a higher Pd dispersion for the Pd catalysts supported on NDC supports carbonised at Tc ≥ 750 °C than for Pd/NDC 550 and Pd/NDC 350 catalysts. Higher Pd dispersions are in line with the smaller and monomodal Pd NPs size distributions obtained for the Pd/NDC catalysts carbonised at Tc ≥ 750 °C, while lower Pd dispersions for Pd/NDC 350 and Pd/NDC 550 are in line with their larger and bimodal particle size distributions. These results might be attributed to the stabilizing effect of pyridinic nitrogen species on the Pd NPs as pyridinic nitrogen groups were described in the literature as possible anchoring sites for metal NPs.60 The pyridinic N–Pd interactions described before support these findings. The N-free Pd/HTC 550 catalyst has a lower Pd dispersion than the Pd/NDC catalysts, with the exception of the Pd/NDC 350 catalyst. The highest Pd dispersion of 60% was obtained by the commercial Pd/AC catalyst amongst all investigated sample.
Combining these results, we can summarize that N-dopants present at Tc ≥ 750 °C, represented mainly by pyridinic and quaternary N and sitting on a rather hydrophobic surface, act as electron acceptor resulting in electron-deficient Pd NPs. Therefore, the Pd 3d5/2 BE of these catalysts shifts by about 0.1–0.3 eV to higher BE values. These findings are supported by the N–Pd interactions, which are observed in the N 1s spectra of the Pd/NDC 750, Pd/NDC 900 and Pd/NDC 1000 catalysts, as compared to the bare NDC support (Fig. 6). In addition, the Pd catalyst supported on NDC carbonised at Tc ≥ 750 °C showed higher Pd0/Pdδ+ ratios, higher Pd dispersion and smaller Pd NPs sizes compared to the Pd catalysts supported on NDC Tc ≤ 550 °C. It is to be expected that the modulation of the size, dispersion, surface chemistry and metal–support interactions will have an impact on the catalytic performance. Thus, the performance of the prepared Pd/NDC catalysts was investigated for phenol hydrogenation to cyclohexanone in aqueous phase and compared to “N-free” Pd/HTC 550 and Pd/AC reference catalysts.
As a demonstrative reaction and also with reference to emerging valorisation of bio-aromatics and the further elaboration of biorefinery concepts, the performance of the described catalysts was evaluated for the hydrogenation of phenol in the aqueous phase; a challenging reaction (Table 5). As discussed above, a (“one-step”) hydrogenation of phenol to cyclohexanone (an important precursor for polyamide monomers) would be a more efficient and greener process over cyclohexane oxidation and a “two-step” phenol hydrogenation.
| Catalyst | Conversion [%] | Selectivity cyclohexanone [%] | Selectivity cyclohexanol [%] | TOFa [h−1] |
|---|---|---|---|---|
| a Mole of cyclohexanone produced per mole of active Pd per hour. Active Pd calculated based on pulsed H2 chemisorption.Reaction conditions: t = 4 h, using 50 mg Pd catalyst (5 wt% Pd loading) and 3.2 mmol phenol at 100 °C and 6 bar of H2. | ||||
| Blank | 1.3 | 100 | — | — |
| Pd/NDC 350 | 5.9 | 93.3 | 6.7 | 29.2 |
| Pd/NDC 550 | 10.1 | 97.0 | 3.0 | 82.4 |
| Pd/NDC 750 | 57.7 | 96.5 | 3.5 | 143.6 |
| Pd/NDC 900 | 67.5 | 98.2 | 1.8 | 157.6 |
| Pd/NDC 1000 | 28.8 | 93.8 | 6.2 | 99.5 |
| Pd/HTC 550 | 18.9 | 97.4 | 2.6 | 79.0 |
| Pd/AC | 84.9 | 97.8 | 2.2 | 53.0 |
Among the Pd/NDC catalysts, the phenol conversion increases with increasing Tc of the NDC support, from 5.9% phenol conversion for Pd/NDC 350, 10.1% for Pd/NDC 550, 57.7% for Pd/NDC 750 to 67.5% for Pd/NDC 900 (Table 5). For Pd/NDC 1000 catalyst the trend is broken as phenol conversion decreases to 28.8%. As such, significantly higher phenol conversions were obtained for Pd/NDC catalysts carbonised at Tc ≥ 750 °C. As well the selectivity to cyclohexanone is following a quite similar trend. The highest phenol conversion of 84.9% was reached by the commercial Pd/AC catalyst, with 97.8% selectivity to cyclohexanone. Significantly lower conversion of 18.9% was obtained by the Pd/HTC 550 catalyst with 97.4% selectivity towards cyclohexanone.
It is important to note that the elucidation of a key factor driving the catalytic performance in the Pd/NDC system is very challenging with NP size, dispersion and indeed electronic structure as well as support material properties (e.g. hydrophilicity) all playing a role.
Therefore, the catalyst activity for phenol hydrogenation was also expressed in terms of turn-over frequency (TOF) (Table 5). TOF for cyclohexanone formation is defined as the moles of cyclohexanone produced per mole of active Pd (i.e. surface active Pd atoms determined by pulsed H2 chemisorption) per hour. For the Pd/NDC catalysts, the TOF follows the same trend as observed for the phenol conversion. The TOF increases with increasing Tc of NDC support from Pd/NDC 350 to Pd/NDC 900 and decreases for Pd/NDC 1000. For the N-free Pd/HTC 550 catalyst and all Pd/NDC catalysts, with the exception of Pd/NDC 350, equal or significantly higher TOF were observed compared to the Pd/AC reference catalyst, which obtained the highest phenol conversion (Table 5). These results encouraged us to try to identify the catalysts parameters governing their activity. Therefore, we investigated if a correlation between the TOF and the Pd dispersion, the Pd speciation in terms of Pd0/Pdδ+ ratio and the catalyst hydrophilicity exists.
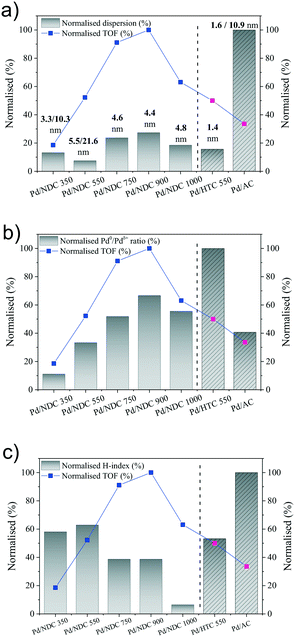
Fig. 8a shows the correlation of the Pd dispersion and Pd size with the TOF. TOF values are normalised by the highest obtained TOF value of 157.6 h−1 from Pd/NDC 900 catalyst and the dispersion is normalised by the highest calculated dispersion of 60% from Pd/AC, therefore both representing a maximum of 100%. For the Pd/NDC carbonised at Tc ≥ 550 °C, some correlation trends between the increase of Pd dispersion and the increase of TOF are observed. However there is no clear correlation between the TOF and the Pd dispersion, when one compares all Pd/NDC catalysts with each other or when one compares all catalysts including the N-free Pd/AC and Pd/HTC 550 catalysts. This clearly suggests that beside Pd dispersion some other factors affect the Pd activity of the Pd/NDC and Pd/HTC 550 catalysts. Indeed, despite the significantly lower Pd dispersion found for Pd/NDC 900 and Pd/NDC 750 in comparison to the Pd/AC catalyst, very high TOF compared to the TOF of the Pd/AC catalysts are found, indicating a higher activity of the Pd surface sites in case of the NDC system.
In a next step, the TOF was tentatively correlated with the Pd speciation in terms of Pd0/Pdδ+ ratio. Fig. 8b shows the impact of the normalised Pd0/Pdδ+ ratio on the normalised TOF values. Pd0/Pdδ+ ratio was normalised by the highest calculated Pd0/Pdδ+ ratio of 2.7 reached from the Pd/HTC 550 catalyst. As one can see from Fig. 8b normalised Pd0/Pdδ+ ratio correlates well with the normalised TOF within the Pd/NDC system, with the exception of Pd/NDC 1000. Hence for Tc < 1000 °C, a higher Pd0/Pdδ+ ratio correlates with a higher TOF, revealing Pd0 as catalytically active site for the phenol hydrogenation. Looking at the N-free catalysts, Pd/AC and Pd/HTC 550, again an increase in Pd0/Pdδ+ ratio correlates with an increase in TOF, even if it is clear from the relative increase of both factors, that other parameters than the Pd0/Pdδ+ must also influence the catalytic activity. Keeping the low Pd0/Pdδ+ ratio of the Pd/AC catalyst in mind, this might actually be the reason for the low TOF values of the Pd/AC catalyst, despite its high Pd dispersion.
While a certain correlation between the Pd0/Pdδ+ ratio and the TOF can be observed within the respective support systems (i.e. N-containing and N-free), it is clear that the correlation breaks when comparing both support systems with each other. This is again a clear indication, that beyond Pd dispersion and Pd speciation, also the type of support with its respective surface chemistry will influence the catalytic activity. Indeed, the surface chemistry of the support in terms of surface functional groups, might, as suggested already in the literature,38,58 strongly influence Pd–support interactions as well as support or catalyst hydrophilicity/wettability and hence catalyst–phenol interactions.25
Besides Pd dispersion and Pd speciation, hydrophilicity/hydrophobicity of the Pd catalysts needs to be considered, since the catalysts were applied in the aqueous phase phenol hydrogenation. Indeed, the impact of catalyst hydrophilicity on the reaction activity was evidenced by many other studies.7,44,61Fig. 8c shows the correlation of the normalised hydrophilicity index of the catalysts on the normalised TOF (both normalised by the highest value). As can be seen, there is no clear trend between the TOF and the hydrophilicity index of the catalysts. One can however say, that higher normalised TOFs (>60%) are observed for lower normalised hydrophilicity indexes (<50%). However, the lower catalytic activity of the Pd/NDC 1000 catalyst compared to the Pd/NDC 900 and Pd/NDC 750, despite its relatively high Pd dispersion and Pd0/Pdδ+ ratio, may be due to the significantly less hydrophilicity of the support (normalised hydrophilicity index <10%), which hinder the catalyst dispersion in the aqueous phase and the adsorption of hydrophilic phenol to the active sites.44 This is suggesting an optimum hydrophilicity index (hydrophilicity index = 0.24, Table 2) of Pd/NDC catalysts in order to obtain high TOF. In the case of the “N-free” catalysts, lower hydrophilicity index is correlated to the higher TOF, again suggesting an optimum hydrophilicity of N-free catalysts for high activity in aqueous phase phenol hydrogenation. Therefore, it can be concluded that an optimum degree of surface hydrophilicity for phenol hydrogenation in aqueous phase is desired; however the hydrophilicity does not directly affect the catalyst activity.
It is reasonable to conclude that the catalytic activity of the reported Pd catalysts for aqueous phase phenol hydrogenation is presumably a complex synergistic combination of different factors including Pd dispersion, Pd speciation (Pd0/Pdδ+ ratio), as well as catalyst hydrophilicity/hydrophobicity. However in case of the Pd/NDC catalysts, we can establish that the catalytic activities are a result of the high Pd0/Pdδ+ ratio in combination with a good Pd dispersion and an optimum degree of hydrophilicity of the catalyst. Interactions between pyridinic N and Pd might in addition stabilise metallic Pd NPs on the NDC support and improve their catalytic activity. This is in the case of Pd catalysts supported on the NDC carbonised at Tc ≤ 550 °C not observed due to the lack of pyridinic N–Pd interactions. Consequently lower Pd 3d5/2 BEs for Pd/NDC 350 and Pd/NDC 550 were observed and low Pd0/Pdδ+ ratio as well as decreased Pd dispersion due to the larger Pd NPs. Because of these reasons Pd/NDC 350 and Pd/NDC 550 are resulting in reduced catalytic activities compared to the Pd catalysts supported on the NDC carbonised at Tc ≥ 750 °C. In the case of “N-free” catalysts, no clear parameter was revealed as the key factor influencing the catalytic activity, suggesting that the “N-free” support with its respective surface chemistry will influence the catalytic activity differently than the NDC support.
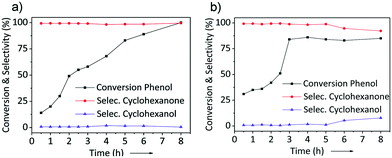
As the most active catalysts, Pd/NDC 900 and Pd/AC were tested further to investigate the conversion of phenol and selectivity to cyclohexanone/cyclohexanol as a function of reaction time (Fig. 9). Under identical reaction conditions, a maximum phenol conversion of 100% with a 99% selectivity to cyclohexanone was obtained over Pd/NDC 900 after 8 h. In contrast, the maximum phenol conversion of 84% was achieved after 3 h over the Pd/AC catalyst, with a 98% selectivity to cyclohexanone. After this point, the conversion of phenol and the selectivity to cyclohexanone does not change anymore between 3 h and 5 h for the Pd/AC catalyst. This might be explained by a preferentially adsorbed H2O on the hydrophilic Pd/AC catalyst, while inhibiting adsorption of phenol61 or by a catalyst deactivation after t > 3 h.18,19 At reaction times >5 h, the selectivity to cyclohexanone begins to decrease (from 98 to 92%), with a corresponding increase in selectivity to cyclohexanol (i.e. the undesired hydrogenation product), indicating further hydrogenation of cyclohexanone to cyclohexanol.62,63 In contrast, selectivity of Pd/NDC 900 towards cyclohexanone after longer reaction times stayed stable (Fig. 9a).
As next step, the stability and reusability of the Pd/NDC 900 and the Pd/AC catalysts were also investigated (Fig. 10). The reusability test was performed based on 11 repeated hydrogenation reaction cycles (i.e. under identical reaction conditions as shown in Table 5). Catalysts were separated from the reaction mixture via hot filtration after each run, followed by thorough washing with water and drying in a vacuum oven at 80 °C for 12 h, prior to the next run. The Pd/AC activity was found to be slightly increased after the 1st cycle but then it continuously decreased with every run (Fig. 10a). Conversely the catalytic activity of the Pd/NDC 900 catalyst remained stable throughout the repeated runs (Fig. 10b). After 11 reaction repeats, Pd/NDC 900 and Pd/AC were characterised by ICP-OES, XRD and XPS. ICP-OES analysis showed a decrease in Pd loading for the Pd/AC catalyst over 11 reaction cycles (i.e. a reduction from 4.2 to 3.6 wt%) (Table 6). In contrast, Pd/NDC 900 did not show any significant loss in Pd loading.
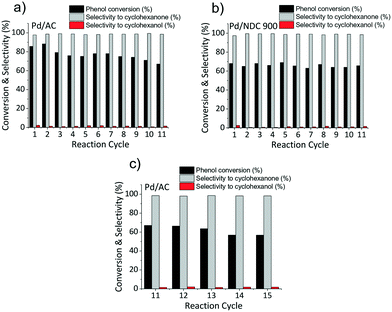 | ||
| Fig. 10 a) Pd/AC, b) Pd/NDC 900 catalyst activity after 11 repeated reaction cycles and c) Pd/AC catalyst activity after 15 repeated reaction cycles. | ||
| Catalyst | Pd [wt%]ICP fresh | Pd [wt%]ICP spent 5th cycles | Pd [wt%]ICP spent 11th cycles |
|---|---|---|---|
| Pd/AC | 4.2 | 3.8 | 3.6 |
| Pd/NDC 900 | 4.4 | 4.3 | 4.3 |
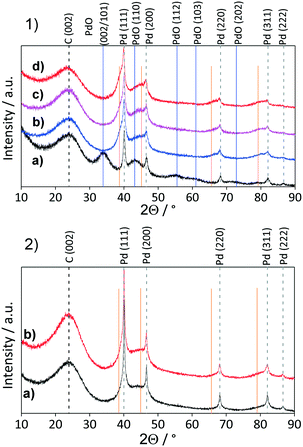
Comparison of powder XRD patterns of a fresh and reused Pd/AC catalyst revealed the presence of PdO and Pd in the fresh catalysts and the absence of PdO (002/101; reflection at 34.1°) and presence of newly formed shoulders at ca. 38.6°, 44.9°, 65.4° and 79.0° in the spend catalyst. These shoulders correspond to palladium hydride (PdHx)64 (which is stable under ambient conditions) formed in situ during the hydrogenation reaction.65 Pd interactions with hydrogen situated in octahedral sites of the fcc Pd lattice are already well known.49,66 These interactions depend on the exposed Pd surface of the catalyst,67 reaction temperature, amount of hydrogen and may influence the catalytic activity.68 The formation of the PdHx phase and the disappearance of the PdO on the Pd/AC was observed already after the 1st reaction cycle, with the PdHx phase formation increasing over repetitive reaction cycles. Pd/AC showed after the 2nd reaction cycle the highest phenol conversion (Fig. 10a), which was found to continuously decrease thereafter. ICP-OES analysis revealed decreased Pd amount after the 5th reaction cycle from 4.2 to 3.8 wt%, and after 11 cycles to 3.6 wt%, suggesting that lower Pd/AC activity is caused due to Pd leaching (Table 6).
Conversely, the XRD pattern of the spent Pd/NDC 900 catalyst (Fig. 11, 2b) showed significantly smaller shoulders attributed to the PdHx phase, indicating lower amounts of PdHx formed in the Pd/NDC 900 catalyst. In addition, TEM images of Pd/NDC 900 show minor changes in the particle size distribution (Fig. 12b).
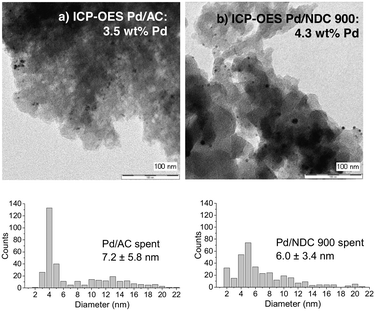 | ||
| Fig. 12 TEM images and Pd amount of spent a) Pd/AC and b) Pd/NDC 900 catalyst after 11 reaction cycles. | ||
XPS analysis of spent Pd/AC after 11 recycles revealed a significant increase in the Pd0/Pdδ+ ratio (Fig. 13a), supporting the XRD findings that indicate the absence of a separate PdO phase for this catalyst (Fig. 11). The Pd0/Pdδ+ ratio for the Pd/AC increased from 1.1 to 4.8 whereas the Pd0/Pdδ+ ratio of Pd/NDC 900 stayed unchanged (Fig. 13b and ESI† Tables S7 and S8). The Pd0 content in the Pd/AC catalyst increased due to a reduction of Pdδ+ species to Pd0 by hydrogen during the reaction. In addition, the XPS survey scan confirms a lower total Pd amount on the surface of the spent Pd/AC catalyst after 11 recycles in comparison to the fresh catalyst, which is in line with ICP-OES analysis (Table 6). XPS further confirmed PdHx formation in the spent catalysts (e.g. formed along with the reduction of Pdδ+ to Pd0 during the hydrogenation reaction).69 A positive shift in BE of 0.20 eV for Pd0 3d5/2 and Pd0 3d3/2 AC/AC catalyst and a very small shift (<0.1 eV) AC/NDC 900 after 11 recycles is observed (i.e. in comparison to their fresh counterparts). This was attributed to the formation of the PdHx phase. Previous studies have described such a chemical shift in Pd 3d core levels due to charge transfer in both directions between Pd and H.70,71
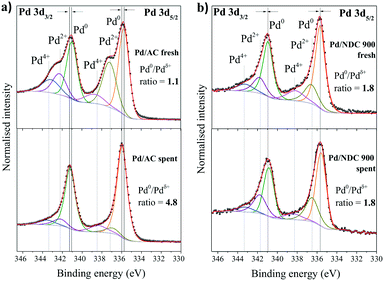 | ||
| Fig. 13 High-resolution XPS scans of Pd 3d region of fresh catalyst in comparison to the spent catalyst after 11 reaction cycles for a) Pd/AC and b) Pd/NDC 900 catalyst. | ||
Despite a decreased Pd loading in the Pd/AC catalyst, its phenol conversion after 11 reaction cycles is still slightly higher than of Pd/NDC 900, namely 67% phenol conversion for Pd/AC with 98.5% selectivity to cyclohexanone and 66% phenol conversion for Pd/NDC 900 with 98.5% selectivity to cyclohexanone. XPS analysis revealed an increased Pd0/Pdδ+ ratio for the Pd/AC after 11 cycles, which was discussed as an important factor for improving the catalytic activity of Pd catalysts for phenol hydrogenation. Therefore, it is assumed that the spent Pd/AC catalyst after 11 reaction cycles, generated slightly higher phenol conversions than the Pd/NDC 900 catalyst despite its loss in Pd loading due to the significantly increased Pd0/Pdδ+ ratio in combination with its very high Pd dispersion.
For the spent Pd/AC catalyst an additional 4 reaction cycles (i.e. after the first 11 reaction cycles) were performed to investigate the changes in catalyst composition and structure (e.g. decreased Pd amount, absence of PdO and presence of PdHx phase). It was observed that the catalytic activity between the 11th and 15th cycles continued to decrease (from 67% to 57% conversion of phenol with decreasing cyclohexanone selectivity from 98.5% to 98.2%), demonstrating further deactivation and loss in activity (e.g. due to continued Pd loss). These results suggest that, in contrast to the NDC 900 support, the AC support does not sufficiently stabilise the Pd NPs for use under the applied reaction conditions. In contrast, the Pd/NDC 900 catalyst showed a very good catalytic performance and indeed stability, attributed to synergetic effects between the Pd NPs and the NDC support, leading to strong anchoring of the metal nanoparticles.
Conclusion
In conclusion the synthesis of N-doped carbon xerogel supported hydrogenation (Pd) catalysts has been discussed in the context of directing support material chemistry for improved performance and stability. Using the demonstrative, biorefinery-related, aqueous-phase hydrogenation of phenol as an example, the effect of altering the NDC support properties (e.g. N-bonding motifs) on catalytic performance were investigated. Based on the initial hydrothermal carbonisation of biomass-derived precursors, NDC xerogels were subsequently thermally carbonised at increasing temperature (Tc) and Pd NPs were deposited via incipient wetness impregnation. Through this approach the physicochemical properties of the NDC support materials could be directed, in turn influencing the (e.g. electronic, geometric) properties of the deposited Pd NPs.NDC-supported Pd catalysts provided high catalytic performance in the aqueous phase hydrogenation of phenol with excellent selectivity to cyclohexanone (i.e. an important precursor for nylon synthesis). Improved catalytic performance and indeed stability was found and could be attributed to N-containing functional groups (e.g. pyridinic) on these xerogel supports acting as strong anchoring points for Pd NPs. At Tc ≥ 750 °C, it is proposed that N–Pd interactions become increasingly beneficial with regard to catalytic performance and stability under the applied conditions. Pd catalysts supported on NDCs where Tc ≥ 750 °C showed higher phenol conversion than Pd/NDC 350 and Pd/NDC 550 or “nitrogen-free” Pd/HTC 550.
With regard to reusability, the Pd/NDC 900 catalyst presented excellent activity and selectivity for phenol hydrogenation to cyclohexanone when compared with a commercial Pd/AC catalyst (over 11 repeated reaction cycles). The Pd/NDC 900 catalyst maintained its activity and selectivity with an unchanged NP size distribution and Pd loading. In contrast, the Pd/AC catalyst was observed to continuously lose activity (as a result of Pd leaching – confirmed by ICP-OES and XPS analysis) with increasing recycle number.
Based on the interactions between the Pd and N-containing support functionalities, heterogeneous catalysts with still higher performance may be designed and synthesized based on the controlled integration of nitrogen into these carbon support structures. The presented work and indeed the approach to catalyst synthesis will be of interest to a wide range of applications in biorefinery-related catalysis, particularly where aqueous-phase friendly materials are needed in context with good stability.
Experimental
Materials
Ovalbumin grade V, 98% purity, tetraaminepalladium(II) nitrate (Pd/(NO3)2 × 4NH3) solution 10 wt% in H2O, 99.99% purity and sodium borate (Na2B4O7), ≥99% purity were purchased from Sigma Aldrich, Germany. The commercial 5 wt% Pd/AC catalyst (dry basis) was provided by Sigma Aldrich (matrix activated carbon, wet support, Degussa type E1003 U/W). D-Glucose (C6H12O6) ≥ 99.5 purity, ethanol ≥99.8% and phenol (C6H5OH) ≥ 99.5% were purchased from Carl Roth (Germany).Material and catalyst characterisation
The prepared supports and catalyst were characterised through N2 adsorption, H2O adsorption, pulsed H2 chemisorption, SEM, TEM, XPS, ICP-OES and XRD in Bragg–Brentano and capillary geometry as described in the ESI† document in more detail. XRD patterns obtained in transmission in capillary geometry are presented in Fig. S7† as well as Rietveld refinement pattern fittings (Fig. S8†).Support synthesis
NDC materials were synthesised based on a previously reported synthesis30 with glucose, ovalbumin and de-ionised water, however using a different mass ratio of 1![[thin space (1/6-em)]](https://www.rsc.org/images/entities/char_2009.gif) :
:![[thin space (1/6-em)]](https://www.rsc.org/images/entities/char_2009.gif) 0.15
0.15![[thin space (1/6-em)]](https://www.rsc.org/images/entities/char_2009.gif) :
:![[thin space (1/6-em)]](https://www.rsc.org/images/entities/char_2009.gif) 4.5 (w/w/w). Hydrothermal carbonisation was performed at 180 °C for 5.5 h in a pre-heated laboratory oven. HTC experiments were performed in a Teflon lined laboratory autoclave, with the precursor solutions placed in a borosilicate glass insert (30 mL volume). After 5.5 h, the autoclave was removed and cooled in a water bath to room temperature. The recovered gel was washed extensively with water (3 × 100 mL) and ethanol (3 × 100 mL) until washings were clear. Drying overnight (vacuum oven at 80 °C for 12 h) yielded the NDC carbogels.
4.5 (w/w/w). Hydrothermal carbonisation was performed at 180 °C for 5.5 h in a pre-heated laboratory oven. HTC experiments were performed in a Teflon lined laboratory autoclave, with the precursor solutions placed in a borosilicate glass insert (30 mL volume). After 5.5 h, the autoclave was removed and cooled in a water bath to room temperature. The recovered gel was washed extensively with water (3 × 100 mL) and ethanol (3 × 100 mL) until washings were clear. Drying overnight (vacuum oven at 80 °C for 12 h) yielded the NDC carbogels.
The nitrogen-free HTC baseline support was prepared in a similar way as the NDC, based on HTC approach using the previously reported procedure,33 using glucose, sodium borate and de-ionised water in a mass ratio of 1![[thin space (1/6-em)]](https://www.rsc.org/images/entities/char_2009.gif) :
:![[thin space (1/6-em)]](https://www.rsc.org/images/entities/char_2009.gif) 0.015
0.015![[thin space (1/6-em)]](https://www.rsc.org/images/entities/char_2009.gif) :
:![[thin space (1/6-em)]](https://www.rsc.org/images/entities/char_2009.gif) 2.3 (w/w/w). HTC was performed at 180 °C for 8 h in a pre-heated laboratory oven. HTC experiments were performed in a Teflon lined laboratory autoclave, with the precursor solutions placed in a borosilicate glass insert (30 mL volume). After 8 h, the autoclave was removed and cooled in a water bath to room temperature. The recovered gel was washed extensively with water (3 × 100 mL) and ethanol (3 × 100 mL) (e.g. until washings were clear). Drying overnight (vacuum oven at 80 °C for 12 h) yielded the base HTC carbogels.
2.3 (w/w/w). HTC was performed at 180 °C for 8 h in a pre-heated laboratory oven. HTC experiments were performed in a Teflon lined laboratory autoclave, with the precursor solutions placed in a borosilicate glass insert (30 mL volume). After 8 h, the autoclave was removed and cooled in a water bath to room temperature. The recovered gel was washed extensively with water (3 × 100 mL) and ethanol (3 × 100 mL) (e.g. until washings were clear). Drying overnight (vacuum oven at 80 °C for 12 h) yielded the base HTC carbogels.
The secondary thermal carbonisation step of NDC and HTC carbogels was performed in a tube furnace (quartz tube; D = 5 cm/L = 90 cm) under flowing N2 (100 mL min−1, 5.0 gas purity). The heating rate was 7 K min−1 to the desired temperature (350, 550, 750, 900 or 1000 °C), followed by an isothermal period of 4 h. HTC carbogel was thermally treated only at 550 °C. Samples were carbonised in ceramic carbonisation oven boats.
Catalyst synthesis
Impregnation of the prepared NDC and HTC supports was performed using an incipient wetness impregnation approach with water as solvent. 10 wt% Pd(NH3)4(NO3)2 solution was used as the Pd NP precursor. The target loading of Pd on support material was 5 wt%. Adsorption capacity of 1.0 g support material, which was carbonised at various temperatures, was before impregnation tested with H2O. After the H2O adsorption capacity test, 1.0 g of the support was dried in a vacuum oven for 12 h at 80 °C. As next step, 1.0 g of the support material was impregnated with appropriate concentration of Pd(NH3)4(NO3)2 dissolved in an a volume of water equal to the pore volume of the support material chosen. Following impregnation, the recovered materials were dried under vacuum at 40 °C for 2 h, then 60 °C for 2 h and finally at 90 °C for the last 2 h. Prior to testing, Pd was reduced under flowing H2 (100 mL min−1) at a ramp rate of 4 K min−1 to 250 °C, followed by an isothermal period of 2 h.Catalyst testing
In a typical reaction, phenol (0.3 g, 3.2 mmol), 50 mg of catalyst (5 wt% Pd loading), and de-ionized water (10 mL) were introduced to a 50 mL high pressure autoclave. After flushing with H2 (2 bar) three times, the reactor was charged with 6 bar (H2). Reactions were performed at 100 °C for 4 h with stirring at 280 rpm. The reactor was cooled to a room temperature in cold water after completed reaction. The catalyst was recovered by filtration with recovered filtrate analysed by a gas chromatograph (Agilent 7890) equipped with an FID detector and a capillary column HP-5 (30 m × 0.20 mm × 0.25 μm).Recovery and reuse of catalyst
After each reaction recycle, Pd/NDC 900 and Pd/AC catalysts were separated from the reaction mixture by vacuum filtration followed by thorough washing with deionised water. The catalysts were then dried in a vacuum oven (80 °C for 12 h), followed by subsequent further testing in the next hydrogenation reaction.Conflicts of interest
There are no conflicts to declare.Acknowledgements
This work was supported by an “Attract” award for RJW (as financed by the Fraunhofer Society and Fraunhofer Institute for Solar Energy Systems ISE) and by the Fraunhofer Internal Programs under Grant No. 035-600564. AF thanks the BMBF for generous funding (FKZ 01FP13033F, FKZ 03X5524 (EDELKAT), and FKZ 03SF0531D (DEKADE)). The authors would like to thank A. Siegel for CHNS elemental analysis, A. Becherer for SEM support, P. Hügenell for N2 and H2O adsorption analysis, S. Fehr for pulsed H2 chemisorption analysis and J. Schmidt for XPS analysis.References
- H. Wang, F. Zhao, S.-i. Fujita and M. Arai, Catal. Commun., 2008, 9, 362 CrossRef CAS.
- M. Chatterjee, H. Kawanami, M. Sato, A. Chatterjee, T. Yokoyama and T. Suzuki, Adv. Synth. Catal., 2009, 351, 1912 CrossRef CAS.
- Yellow Book: World Nylon 6 and Nylon 66 Supply/Demand Report, PCI Research GmbH, Oberursel, Germany, 2016 Search PubMed.
- I. Dodgson, K. Griffin, G. Barberis, F. Pignataro and G. Tauszik, Chem. & Ind., 1989, 18, 830 Search PubMed.
- Y. Wang, J. Zhang, X. Wang, M. Antonietti and H. Li, Angew. Chem., Int. Ed., 2010, 49, 3356 CrossRef CAS PubMed.
- L. Lloyd, Handbook of Industrial Catalysts: Fundamental and Applied Catalysis, Springer, 2011 Search PubMed.
- J. Matos and A. Corma, Appl. Catal., A, 2011, 404, 103 CrossRef CAS.
- X. Xu, H. Li and Y. Wang, ChemCatChem, 2014, 6, 3328 CrossRef CAS.
- J.-F. Zhu, G.-H. Tao, H.-Y. Liu, L. He, Q.-H. Sun and H.-C. Liu, Green Chem., 2014, 16, 2664 RSC.
- H. Li, J. Liu, S. Xie, M. Qiao, W. Dai, Y. Lu and H. Li, Adv. Funct. Mater., 2008, 18, 3235 CrossRef CAS.
- X. Yang, S. Liao, J. Zeng and Z. Liang, Appl. Surf. Sci., 2011, 257, 4472 CrossRef CAS.
- X. Kong, Y. Gong, S. Mao and Y. Wang, ChemNanoMat, 2018, 4, 432 CrossRef CAS.
- M. L. Buil, M. A. Esteruelas, S. Niembro, M. Oliván, L. Orzechowski, C. Pelayo and A. Vallribera, Organometallics, 2010, 29, 4375 CrossRef CAS.
- Y. Xiang, L. Ma, C. Lu, Q. Zhang and X. Li, Green Chem., 2008, 10, 939 RSC.
- N. Mahata, K. V. Raghavan, V. Vishwanathan, C. Park and M. A. Keane, Phys. Chem. Chem. Phys., 2001, 3, 2712 RSC.
- K. V. R. Chary, D. Naresh, V. Vishwanathan, M. Sadakane and W. Ueda, Catal. Commun., 2007, 8, 471 CrossRef CAS.
- S. Watanabe and V. Arunajatesan, Top. Catal., 2010, 53, 1150 CrossRef CAS.
- E. Díaz, A. F. Mohedano, L. Calvo, M. A. Gilarranz, J. A. Casas and J. J. Rodríguez, Chem. Eng. J., 2007, 131, 65 CrossRef.
- P. Albers, P. Pietsch and S. F. Parker, J. Mol. Catal. A: Chem., 2001, 173, 275 CrossRef CAS.
- G. Feng, P. Chen and H. Lou, Catal. Sci. Technol., 2015, 5, 2300 RSC.
- F. Wang, J. Xu, X. Shao, X. Su, Y. Huang and T. Zhang, ChemSusChem, 2016, 9, 246 CrossRef CAS PubMed.
- R. Arrigo, M. E. Schuster, Z. Xie, Y. Yi, G. Wowsnick, L. L. Sun, K. E. Hermann, M. Friedrich, P. Kast, M. Hävecker, A. Knop-Gericke and R. Schlögl, ACS Catal., 2015, 5, 2740 CrossRef CAS.
- S. Mao, C. Wang and Y. Wang, J. Catal., 2019, 375, 456 CrossRef CAS.
- W. Shi, B. Zhang, Y. Lin, Q. Wang, Q. Zhang and D. S. Su, ACS Catal., 2016, 6, 7844 CrossRef CAS.
- X. Ning, Y. Li, B. Dong, H. Wang, H. Yu, F. Peng and Y. Yang, J. Catal., 2017, 348, 100 CrossRef CAS.
- I. C. Gerber and P. Serp, Chem. Rev., 2020, 120, 1250 CrossRef CAS PubMed.
- W. Dong, P. Chen, W. Xia, P. Weide, H. Ruland, A. Kostka, K. Köhler and M. Muhler, ChemCatChem, 2016, 8, 1269 CrossRef CAS.
- M.-M. Titirici, R. J. White, C. Falco and M. Sevilla, Energy Environ. Sci., 2012, 5, 6796 RSC.
- M.-M. Titirici, R. J. White, N. Brun, V. L. Budarin, D. S. Su, F. del Monte, J. H. Clark and M. J. MacLachlan, Chem. Soc. Rev., 2015, 44, 250 RSC.
- R. J. White, N. Yoshizawa, M. Antonietti and M.-M. Titirici, Green Chem., 2011, 13, 2428 RSC.
- N. Baccile, M. Antonietti and M.-M. Titirici, ChemSusChem, 2010, 3, 246 CrossRef CAS PubMed.
- M.-M. Titirici, R. J. White, N. Brun, V. L. Budarin, D. S. Su, F. del Monte, J. H. Clark and M. J. MacLachlan, Chem. Soc. Rev., 2015, 44, 250 RSC.
- T.-P. Fellinger, R. J. White, M.-M. Titirici and M. Antonietti, Adv. Funct. Mater., 2012, 22, 3254 CrossRef CAS.
- M. Bosilj, M. Bozoglu, J. Schmidt, P. M. Aguiar, A. Fischer and R. J. White, Catal. Sci. Technol., 2020, 10, 776 RSC.
- Z. Ferhat-Hamida, J. J. Barbier Jr. , S. Labruquere and D. Duprez, The chemical state of palladium in alkene and acetylene oxidation A study by XRD, electron microscopy and TD-DTG analysis: NIST Chemistry WebBook, NIST Standard Reference Database Number 69, ed. P. J. Linstrom and W. G. Mallard, (retrieved August 20, 2019) Search PubMed.
- A. G. Christy, Structural behavior of palladium (II) oxide and a palladium suboxide at high pressure: An energy-dispersive x-ray-diffraction study: NIST Chemistry WebBook, NIST Standard Reference Database Number 69, ed. P. J. Linstrom and W. G. Mallard, (retrieved August 20, 2019) Search PubMed.
- Y. Chen, X. Li, Z. Wei, S. Mao, J. Deng, Y. Cao and Y. Wang, Catal. Commun., 2018, 108, 55 CrossRef CAS.
- L. Perini, C. Durante, M. Favaro, V. Perazzolo, S. Agnoli, O. Schneider, G. Granozzi and A. Gennaro, ACS Appl. Mater. Interfaces, 2015, 7, 1170 CrossRef CAS PubMed.
- M. Thommes, S. Mitchell and J. Pérez-Ramírez, J. Phys. Chem. C, 2012, 116, 18816 CrossRef CAS.
- M. Thommes, J. Morell, K. A. Cychosz and M. Fröba, Langmuir, 2013, 29, 14893 CrossRef CAS PubMed.
- A. Striolo, P. K. Naicker, A. A. Chialvo, P. T. Cummings and K. E. Gubbins, Adsorption, 2005, 11, 397 CrossRef.
- P. Albers, K. Deller, A. Despeyroux, A. Schäfer and K. Seibold, J. Catal., 1992, 133, 467 CrossRef CAS.
- M. Li, F. Xu, H. Li and Y. Wang, Catal. Sci. Technol., 2016, 6, 3670 RSC.
- P. Makowski, R. Demir Cakan, M. Antonietti, F. Goettmann and M. M. Titirici, Chem. Commun., 2008, 999 RSC.
- X. Xu, Y. Li, Y. Gong, P. Zhang, H. Li and Y. Wang, J. Am. Chem. Soc., 2012, 134, 16987 CrossRef CAS.
- D. Zemlyanov, B. Aszalos-Kiss, E. Kleimenov, D. Teschner, S. Zafeiratos, M. Hävecker, A. Knop-Gericke, R. Schlögl, H. Gabasch, W. Unterberger, K. Hayek and B. Klötzer, Surf. Sci., 2006, 600, 983 CrossRef CAS.
- R. Arrigo, M. E. Schuster, S. Abate, S. Wrabetz, K. Amakawa, D. Teschner, M. Freni, G. Centi, S. Perathoner, M. Hävecker and R. Schlögl, ChemSusChem, 2014, 7, 179 CrossRef CAS PubMed.
- A. P. Terzyk, Colloids Surf., A, 2001, 177, 23 CrossRef CAS.
- D. Teschner, A. Pestryakova, E. Kleimenov, M. Hävecker, H. Bluhma, H. Sauer, A. Knop-Gericke and R. Schlögl, J. Catal., 2005, 230, 186 CrossRef CAS.
- Z. Paál, U. Wild and R. Schlögl, Phys. Chem. Chem. Phys., 2001, 3, 4644 RSC.
- R. Arrigo, M. Hävecker, S. Wrabetz, R. Blume, M. Lerch, J. McGregor, E. P. J. Parrott, J. A. Zeitler, L. F. Gladden, A. Knop-Gericke, R. Schlögl and D. S. Su, J. Am. Chem. Soc., 2010, 132, 9616 CrossRef CAS PubMed.
- J. R. Pelsa, F. Kapteijna, J. A. Moulijna, Q. Zhub and K. M. Thomas, Carbon, 1995, 33, 1641 CrossRef.
- J. Melke, B. Peter, A. Habereder, J. Ziegler, C. Fasel, A. Nefedov, H. Sezen, C. Wöll, H. Ehrenberg and C. Roth, ACS Appl. Mater. Interfaces, 2016, 8, 82 CrossRef CAS.
- C. J. Jenks, S.-L. Chang, J. W. Anderegg, P. A. Thiel and D. W. Lynch, Phys. Rev. B: Condens. Matter Mater. Phys., 1996, 54, 6301 CrossRef CAS PubMed.
- M. C. Militello and S. J. Simko, Surf. Sci. Spectra, 1998, 3, 395 CrossRef.
- A. Thøgersen, J. Mayandi, L. Vines, M. F. Sunding, A. Olsen, S. Diplas, M. Mitome and Y. Bando, J. Appl. Phys., 2011, 109, 84329 CrossRef.
- R. G. Rao, R. Blume, T. W. Hansen, E. Fuentes, K. Dreyer and S. Moldovan, Nat. Commun., 2017, 8, 340 CrossRef PubMed.
- Z. He, B. Dong, W. Wang, G. Yang, Y. Cao, H. Wang, Y. Yang, Q. Wang, F. Peng and H. Yu, ACS Catal., 2019, 9, 2893 CrossRef CAS.
- A. L. Dantas Ramos, P. D. S. Alves, D. A. G. Aranda and M. Schmal, Appl. Catal., A., 2004, 277, 71 CrossRef CAS.
- Z. Zhang, Y. Chen, L. Zhou, C. Chen, Z. Han, B. Zhang, Q. Wu, L. Yang, L. Du, Y. Bu, P. Wang, X. Wang, H. Yang and Z. Hu, Nat. Commun., 2019, 10, 1657 CrossRef PubMed.
- Y. Xiang, L. Kong, P. Xie, T. Xu, J. Wang and X. Li, Ind. Eng. Chem. Res., 2014, 53, 2197 CrossRef CAS.
- H. Zhou, B. Han, T. Liu, X. Zhong, G. Zhuang and J. Wang, Green Chem., 2017, 19, 3585 RSC.
- J. Zhong, J. Chen and L. Chen, Catal. Sci. Technol., 2014, 4, 3555 RSC.
- Y. P. Khodyrev, R. V. Baranova, R. M. Imamov and S. A. Semiletov, Electron diffraction study of β-fcc palladium hydride: NIST Chemistry WebBook, NIST Standard Reference Database Number 69, ed. P. J. Linstrom and W. G. Mallard, (retrieved August 20, 2019) Search PubMed.
- D. Narehood, S. Kishore, H. Goto, J. Adair, J. Nelson, H. Guiterrez and P. Eklund, Int. J. Hydrogen Energy, 2009, 34, 952 CrossRef CAS.
- R. J. Wolf, M. W. Lee, R. C. Davis, P. J. Fay and J. R. Ray, Phys. Rev. B: Condens. Matter Mater. Phys., 1993, 48, 12415 CrossRef CAS PubMed.
- S. F. Parker, H. C. Walker, S. K. Callear, E. Grünewald, T. Petzold, D. Wolf, K. Möbus, J. Adam, S. D. Wieland, M. Jimenez-Ruiz and P. W. Albers, Chem. Sci., 2019, 10, 480 RSC.
- W. Palczewska, Adv. Catal., 1975, 24, 245 CAS.
- C. Yue, J. Wang, L. Han, L. Chang, Y. Hu and H. Wang, Fuel Process. Technol., 2015, 135, 125 CrossRef CAS.
- C. T. Chan and S. G. Louie, Phys. Rev. B: Condens. Matter Mater. Phys., 1983, 27, 3325 CrossRef CAS.
- S. Sinha, J. Phys. F: Met. Phys., 1986, 16, 229 CrossRef.
Footnote |
| † Electronic supplementary information (ESI) available: N2 physisorption, SEM, XPS, effects on quaternary N BE, H2O adsorption and H-index calculation, Rietveld refinement. See DOI: 10.1039/d0cy00391c |
| This journal is © The Royal Society of Chemistry 2020 |

