 Open Access Article
From CO or CO2?: space-resolved insights into high-pressure CO2 hydrogenation to methanol over Cu/ZnO/Al2O3†
Rohit
Gaikwad‡
a,
Helena
Reymond‡
b,
Nat
Phongprueksathat‡
ac,
Philipp
Rudolf von Rohr
b and
Atsushi
Urakawa
 *acd
*acd
aInstitute of Chemical Research of Catalonia (ICIQ), Av. Països Catalans 16, 43007 Tarragona, Spain
bDepartment of Mechanical Engineering, Institute of Process Engineering, ETH Zurich, Sonneggstrasse 3, 8092 Zürich, Switzerland
cCatalysis Engineering, Department of Chemical Engineering, Delft University of Technology, Van der Maasweg 9, 2629 HZ Delft, Netherlands. E-mail: A.Urakawa@tudelft.nl
dJapan Science and Technology Agency (JST), Gobancho, Chiyodaku, 102-0076 Tokyo, Japan
First published on 5th March 2020
Abstract
The reaction pathway of high-pressure CO2 hydrogenation over a Cu/ZnO/Al2O3 catalyst is investigated through the gradients of reactants/products concentration and catalyst temperature within the catalytic reactor. This study reveals that methanol is formed through direct CO2 hydrogenation at low temperature, while above 260 °C methanol formation is mediated via CO which is formed by reverse water–gas shift reaction.
The increasing atmospheric CO2 concentration demands urgent actions to reduce CO2 emission by converting CO2 into useful chemicals and fuels. Among various chemicals derived from CO2, methanol has considerable potential as a liquid fuel, hydrogen carrier, and C1 feedstock.1,2 Methanol can now be synthesized on commercially relevant scales via CO2 hydrogenation over Cu/ZnO/Al2O3-based catalysts at 200–300 °C and 10–100 bar,3,4 which is by far the most mature technology for efficient CO2 conversion.1 From a mechanistic point of view, methanol synthesis from CO2 over Cu/ZnO/Al2O3 catalysts may occur through direct CO2 hydrogenation (eqn (1)) or through reverse water–gas shift (RWGS) (eqn (2)) followed by CO hydrogenation (eqn (3)).2
| CO2 + 3H2 ⇌ CH3OH + H2O ΔH298K,5MPa = −40.9 kJ mol−1 | (1) |
| CO2 + H2 ⇌ CO + H2O ΔH298K,5MPa = +49.8 kJ mol−1 | (2) |
| CO + 2H2 ⇌ CH3OH ΔH298K,5Mpa = −90.7 kJ mol−1 | (3) |
Since methanol synthesis from CO2 accompanies CO formation, the early studies concluded that CO hydrogenation is the main reaction pathway over Cu/ZnO catalysts.5–7 However, the C18O2 isotopic labeling indicated that methanol can be produced from both CO and CO2, by which CO2 hydrogenation is the primary pathway at 220 °C.8 The 14CO and 14CO2 isotopic labeling also supported that CO2 is the primary source of methanol instead of CO at 250 °C.9 The intrinsic CO2 hydrogenation rate is ∼20 times faster than CO hydrogenation, especially at low conversion,10 although the CO2 hydrogenation is suppressed at high conversion due to water formation.11 In contrast, DFT calculations showed the rate of the RWGS to form CO becomes ∼100 times higher than CO2 hydrogenation to methanol at a higher temperature (300 °C), in agreement with experiment.12 However, such CO rather accumulates as a product since CO hydrogenation is slower than CO2 hydrogenation. Another set of DFT calculations fitted to published experimental rate data under realistic conditions suggested that CO2 hydrogenation is responsible for ∼2/3 of methanol production.13 It was later confirmed by isotope tracing experiments in 13CO/12CO2/H2 that CO2 is the dominant carbon source in methanol product at 240 °C. However, the source of carbon gradually shifts from CO2 to CO as the temperature is lowered (toward 160 °C).14 It was proposed that CO hydrogenation could also be inhibited by the formation of formate intermediates at higher CO2 concentrations (230 °C).15,16 The isotopic labeling using H/D substitution suggested that methanol formation from CO2 does not occur via consecutive RWGS and CO hydrogenation (at 250 °C),17 and rather RWGS and CO2 hydrogenation occur independently (220–260 °C).17,18 Although some debates exist, methanol formation from CO2 as the carbon source is currently the most widely accepted mechanism for Cu/ZnO-based catalysts, supported by both experimental findings and theoretical calculations mentioned above.
Thermodynamically, both CO and CO2 hydrogenation reactions produce methanol, but the predominant reactions depend on the operating conditions.19 The favorable conditions for CO2 hydrogenation to methanol are high pressure and low temperature according to Le Châtelier's principle, as obvious from eqn (1),2 and the advantages of high-pressure reaction conditions above 200 bar in terms of CO2 conversion (>90%), methanol selectivity (>95%) and methanol yield have been recently demonstrated.20,21 In practice, however, there is an optimum reaction temperature where reaction kinetics are favorable, and simultaneously, endothermic RWGS does not rule the product selectivity. For example, in the previous studies (200 and 360 bar), the CO selectivity is surprisingly high at 170–200 °C, while it starts to decrease to the minimum as the temperature increases to 260 °C, indicating the CO hydrogenation towards the formation of methanol.21 Similarly, CO selectivity increases at high space velocities, implying that CO-mediated path may be active under high-pressure conditions, which is indeed in accordance with early study at high pressure (415 bar).5 Most mechanistic studies aiming at elucidation of the reaction pathway are performed at low to moderate pressure (<30 bar) and there are no convincing mechanistic clues reported to date for high-pressure methanol synthesis above such pressure.
This study aims at clarifying dominating reaction pathways and the source of carbon, CO or CO2, resulting in methanol from the concentration profiles of the reactants/products as well as that of the catalyst temperature along the axial direction of the reactor packed with a commercial Cu/ZnO/Al2O3 catalyst at 200 and 360 bar (reactant pressure of 184 and 331 bar).20,21 Changing space velocity by varying the reactant flow rate and/or catalyst amount is one way to gain the information;22 however, this approach may influence mass transfer characteristics and also temperature gradient (higher mass flow rate can results in more prominent temperature gradient due to endo-/exo-thermicity of the reactions). In this study, we developed a method to study quantitatively the concentration of reactant/product fluids based on gas chromatography (GC) and Raman spectroscopy looking at different locations of the catalyst bed. Furthermore, infrared (IR) thermography was used to monitor the catalyst temperature under operando high-pressure reaction conditions to gain support on the reaction mechanisms through exo- and endo-thermicity.
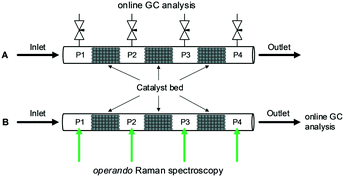
The high-pressure reactor setup and used materials are explained in detail in ESI.† Briefly, the commercial Cu/ZnO/Al2O3 catalyst20 was packed in a stainless steel (SS) or sapphire capillary reactor where three split catalyst beds were separated by empty spaces (P1–P4) for gas sampling and quantification. In the case of the SS reactor (Fig. 1A), the gas sampling for GC analysis was performed by needle valves connected to the void sections. The amount of the sampled gas was sufficiently small (confirmed by GC) so that it did not affect the overall catalytic activity. For Raman spectroscopic determination of fluid concentration, a Raman laser (532 nm) was focused onto the void sections filled with quartz wool in the sapphire reactor (Fig. 1B, S1 and S2,† holding reactant pressure up to 200 bar, 350 °C). The major advantage of the GC analysis is the accuracy in the quantification and that of the Raman analysis is the non-perturbing nature of the sampling on the flow behavior.
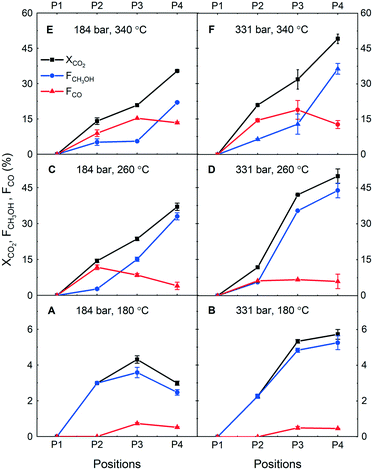
First, concentration profiling at P1–P4 was performed during CO2 hydrogenation at the stoichiometric ratio (H2/CO2 = 3) in the SS reactor at three temperatures (180, 260 and 340 °C) and two pressure conditions (184 and 331 bar). CO2 conversion and carbon-based mole fractions F (both in %), which are defined as CO2 conversion scaled by respective product selectivity (that is in 0–1 scale, leading to FCH3OH + FCO = XCO2). These quantities were used to understand in a facile fashion how much CO2 is converted and into which product.
Fig. 2A and B show the catalytic performance in terms of XCO2, FCH3OH and FCO at 180 °C at 184 bar and 331 bar, respectively. At this low reaction temperature, we observe low CO2 conversion but high methanol selectivity, thus a high fraction of methanol. What is prominent are the X and F profiles and their differences. At this low conversion, virtually the partial pressure of the reactants (CO2 and H2) is unaltered throughout the catalyst bed and generally one expects little change in the reaction rate and product selectivity due to full kinetic control at different positions of the catalyst bed. However, this is not the case and lower CO2 conversion is more prominent at the lower investigated pressure (184 bar, Fig. 2A) where CO2 conversion does not linearly increase between P2–P3, and even drops between P3–P4. When the rate of CO2 conversion is decreased, the fraction of methanol also decreases. Assuming that the intrinsic reaction selectivity at this temperature is almost 100% towards methanol (judging from the values at P2), the only explanation for the CO2 conversion drop is methanol decomposition (CH3OH → CO + 2H2),23 especially between P2–P3. However, since the water partial pressure is expected to rise along with along the catalyst bed and the CO2 conversion between P3–P4, steam reforming (CH3OH + H2O → CO2 + 3H2) is supposed to take place. Although the reports on gas-phase methanol decomposition and steam reforming at such high pressure are expectedly limited, there is evidence suggesting that such reactions occur even at 250–450 bar under supercritical water,24 and its kinetics can be enhanced as the number of collisions increases with pressure. Moreover, the slight decrease in CO fraction also indicates the forward water gas shift reaction. This explanation is also in accordance with high CO selectivity at low temperatures, as found in the previous work.21 Based on the profiles of CO2 conversion and product fractions, at 331 bar (Fig. 2B) this methanol decomposition and steam reforming to CO and CO2 (generalized as “methanol decompositions”) also takes place but to a significantly lesser extent. This is likely due to the pressure effects affecting to shift the equilibrium towards the product (methanol) side, showing one of the unique advantages of high-pressure reaction conditions.20,21
The same experiment was performed at two higher temperatures (260 and 340 °C) and the results obtained at 260 °C are summarized in Fig. 2C and D. First, the CO2 conversion values are about one order of magnitude higher than those at 180 °C. Also, at both examined pressures, relatively high CO selectivity was observed. At 184 bar (Fig. 2C), CO was the major product, but then the fraction of CO decreased towards the outlet position. This is indicative of CO conversion to methanol, although there is a possibility of water–gas shift reaction forming CO2 and H2 from CO and H2O (reverse reaction of eqn (2)). However, the methanol fraction drastically increases as CO fraction dropped towards the outlet direction. This indicates the former reaction (i.e. CO hydrogenation to methanol, eqn (3)) is likely the major active path under the studied reaction condition. At 331 bar (Fig. 2D) CO fraction remained relatively constant, whereas the methanol fraction increased drastically along with CO2 conversion between P2 and P3. At 184 bar (Fig. 2C) CO2 conversion linearly increased and did not drop as observed at 180 °C. These results indicate three important insights into high-pressure CO2 hydrogenation at 260 °C: (i) methanol formation is faster than its decompositions, (ii) CO2 is constantly converted to methanol or CO as the intermediate at 184 bar and (iii) there is another factor promoting/enhancing CO2 conversion at 331 bar. Regarding the point (ii), at 184 bar at P2, very high CO selectivity was observed and its continuous decrease and drastic increase in methanol production towards the reactor outlet implies that CO2 is converted to CO at an almost constant rate and then CO is further converted to methanol. In this case, the latter reaction rate would mainly determine the final fraction of methanol and CO in the reactor. The point (iii) indicates the important effects of reaction pressure. According to Fig. S4 (ESI†), at 260 °C, we expect phase condensation at 331 bar but not at 184 bar. This may explain the sudden surge in CO2 conversion between P2–P3; the CO2 conversion was sufficiently high to reach the dew point of the condensable products (methanol and water) at this position in the reactor, positively impacting on the reaction rate or shifting the equilibrium towards methanol.
The presence of water in the fluid phase can promote Cu crystallite growth25 and induce transformation of ZnO into ZnCO3, as shown in the XRD patterns of spent catalysts (Fig. S3 and Table S1, ESI†). However, it is still difficult to establish the relationship between mechanism and catalyst structure from the existing results, especially using the bulk sensitive techniques.
Furthermore, the results obtained at the highest examined temperature (340 °C) are presented in Fig. 2E and F. Similar to the case of 260 °C, a large amount of CO was observed with a decrease in its fraction with respect to methanol towards the reactor outlet. On the other hand, CO2 conversion increased almost linearly. These two observations indicate that RWGS is the first main step of CO2 hydrogenation and produced CO reacts further with H2 to produce methanol. It is also interesting to note the boosted methanol formation between P3–P4. A similar observation at 260 °C was interpreted to be caused by phase condensation. At this temperature, however, we do not expect such phase condensation to occur (Fig. S4, ESI†). One possibility may be a dense phase formation, like surface wetting, in the pore of the catalyst which is virtually identical to phase condensation. Besides, it is worth highlighting the maximum CO fraction observed in the reactor at 260 and 340 °C. According to the thermodynamic calculation (Fig. S5, ESI†), the equilibrium CO2 conversions for RWGS at H2/CO2 = 3 are ca. 14% and 21% at 260 and 340 °C, respectively. A careful look in Fig. 2E and F shows that the CO fraction is close to the equilibrium CO2 conversion in the middle of the reactor (since the fraction is the percentage of CO2 converted to methanol; therefore, these numbers can be directly compared). Still, the CO fraction decreases accompanying the increase in methanol fraction close to the outlet of the reactor, implying that the methanol synthesis rate is accelerated at the position. It is speculated that the dense phase formation over the catalyst accelerates CO hydrogenation to methanol. In addition, methanol decompositions may take place, but it is not possible to gain information about this point from the data obtained. Nevertheless, it is certain that the consumption rate of CO and CO2 to form methanol is much greater than the methanol decompositions rate under these high-pressure conditions.
Based on the above studies, we conclude that the pressure effects on the reaction paths are relatively minor compared to the temperature effects, although increasing pressure is indeed advantageous for methanol synthesis because of favorable kinetics (more collisions), phase separation, and chemical equilibrium.26 Interestingly, at 260 °C where we find optimum catalytic performance and liquid-phase condensation seems indeed to boost the reactivity of CO2 to methanol by a concerted kinetic and thermodynamic interplay.
Furthermore, similar concentration profiling experiments were performed using Raman spectroscopy instead of GC. The major advantage of this spectroscopic approach is that the reaction and flow-patterns are not disturbed in contrast to the case of GC analyses. Fig. S6 (ESI†) shows a typical Raman spectrum of the reaction stream obtained at 260 °C at the outlet (P4). The rotational transitions of H2 (355, 587, 812, 1033, 1246, 1447 cm−1), as well as the Fermi dyad of CO2 and satellite bands (1265, 1286, 1387, 1408 cm−1), were clearly identified. Because of the small Raman scattering cross-section of CO, its characteristic feature at 2140 cm−1 was not sufficiently strong for quantitative analysis and only its formation could be confirmed at high CO concentration. The features at 2840 and 2945 cm−1 are attributed to methanol, showing a too weak signal for quantitative analysis. For these reasons, the intense bands of H2 and CO2 at 587 and 1387 cm−1, respectively, were considered here to gain mechanistic insights.
Fig. 3 shows the evolution of the H2/CO2 ratio determined from the band areas at different void positions (Fig. 1) at 180 °C and 260 °C at 184 bar. The initial area ratio at P1 was scaled to 2.5 to represent the molar ratio of unreacted feed confirmed by GC measurements. The reaction at 180 °C showed a slight decrease in the ratio moving from P1 to P2, before increasing towards P3, and no major change was observed moving from P3 to P4.
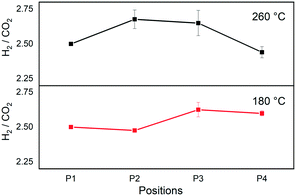 | ||
Fig. 3 H2/CO2 ratio at different positions during CO2 hydrogenation to methanol over the commercial Cu/ZnO/Al2O3 catalyst. H2/CO2 = 2.5, T = 180 and 260 °C, P = 184 bar, and GHSV = 80![[thin space (1/6-em)]](https://www.rsc.org/images/entities/char_2009.gif) 000 h−1. 000 h−1. | ||
In the case of direct methanol synthesis from CO2 (eqn (1)), 3 moles of H2 would be consumed per mole of CO2 for the production of methanol, rendering H2 the limiting reactant in our experimental condition (feed H2/CO2 = 2.5). On the other hand, if CO2 is consumed to form CO via RWGS (eqn (2)), CO2 would become a limiting reactant. Therefore, a decrease in the H2/CO2 ratio would signify an excessive H2 consumption as in the former case of direct methanol synthesis, whereas an increase in the ratio would be a sign of a gradual CO2 shortage by RWGS. In case methanol is a secondary product obtained from the subsequent hydrogenation of CO, as a net, the ratio is expected to decrease as an equivalent amount of H2 is required whichever the COx (x = 1 or 2) is the carbon source in the methanol. The initial slight decrease in the ratio at P1–P2 at 180 °C implies direct methanol synthesis reaction. Then at P2–P3, the ratio increases, which is indicative of RWGS. However, as discussed above, this is most likely due to the decompositions of methanol since such drastic selectivity change is unlikely at the low CO2 conversion level. The increase in the ratio is therefore attributed to methanol decompositions, which is fully consistent with the observation and the previous results at 180 °C (Fig. 2). In this Raman study, however, the ratio did not increase further as expected from the results in Fig. 2. This may be due to the higher space velocity of this Raman study compared to the study by GC and consequent less pronounced change in the ratio from less prominent methanol decompositions.
At 260 °C there was a clear initial increase of the ratio and then decrease towards the outlet (Fig. 3). The increasing ratio indicates the increase in the amount of CO by RWGS in the reactor and then subsequent decrease indicates the increase in the amount of methanol, no matter which reaction paths (eqn (1)vs.eqn (3)) are active. This profile is in full accordance with the results presented in Fig. 2 obtained in a comparable reaction condition where initially CO was produced and then CO was hydrogenated to methanol.
The sharp drop in the ratio at 260 °C coincided with the observation of condensation as liquid droplets at the rear end of the packed bed at P4 (Fig. S8, ESI†). As discussed above, the condensation is attributed to enhanced methanol synthesis via CO or CO2, by in situ separation of the less volatile components, namely water and methanol. Indeed, upon focusing the Raman laser spot on the condensed phase, more intense methanol peak was observed, and the H2/CO2 ratio dropped to further lower values, suggesting the higher miscibility of CO2 than H2 in the condensed phase. According to the thermodynamic expectations at CO2![[thin space (1/6-em)]](https://www.rsc.org/images/entities/char_2009.gif) :
:![[thin space (1/6-em)]](https://www.rsc.org/images/entities/char_2009.gif) H2 = 1
H2 = 1![[thin space (1/6-em)]](https://www.rsc.org/images/entities/char_2009.gif) :
:![[thin space (1/6-em)]](https://www.rsc.org/images/entities/char_2009.gif) 3 (Fig. S4, ESI†), liquid phase condensation is not expected at 184 bar, 260 °C.
3 (Fig. S4, ESI†), liquid phase condensation is not expected at 184 bar, 260 °C.
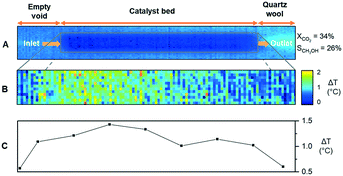
Lastly, IR thermography was used to measure the temperature of the catalyst bed under the reaction in order to validate the sequential nature of the methanol formation (RWGS and CO hydrogenation to methanol) from the endo-/exo-thermicity of the reactions (eqn (1)–(3)). The reaction was performed at the stoichiometric ratio at 184 bar in a sapphire reactor similar to the Raman study without separating the catalyst bed, as shown in Fig. 4A. At 180 °C, the IR signal, as well as CO2 conversion, were too low to detect changes in the temperature of the catalyst bed. Thus, the experiments were performed at 260 and 340 °C. To detect subtle differences in the temperature of the catalyst bed, the thermogram showing a temperature distribution is obtained by the subtraction of thermograms during reaction and calibration, as shown in Fig. S9 (ESI†).
The differential IR thermogram (Fig. 4B) displays an exothermic region of the catalyst bed during the reaction. The differential temperature profiles (Fig. 4C) are calculated from the radial temperature average along the catalyst bed. Evidently, the temperature profile at 340 °C is spatially varying. A relatively colder region located close to the front of the catalyst bed at 340 °C and subsequent temperature increase (then decrease) along the flow direction indicate endothermicity of RWGS near the fluid inlet and then methanol is formed. Such a temperature variation along the catalyst bed is barely observable at 260 °C (Fig. S10†), indicating that RWGS and CO hydrogenation likely occur in close proximity and cause overlapping of the two regions. The results at two different temperatures are in line with the methanol and CO selectivity profiles and the reaction mechanisms suggested above.
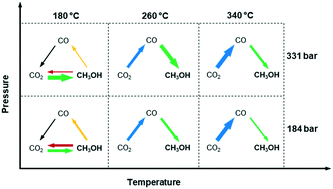
In conclusion, the effects of temperature and pressure on reaction pathways were clarified by the space-resolved methodologies under operando conditions. Temperature has a significant influence on the dominant reaction pathways of methanol synthesis, as summarized in Fig. 5. It is confirmed that methanol is produced via direct CO2 hydrogenation at 180 °C, and via RWGS and CO hydrogenation at 260–340 °C. This could be explained by the limited RWGS activity at 180 °C, and more dominant RWGS activity as temperature increases. Moreover, there is a sign that methanol could possibly decompose or be steam reformed after formation, which is effectively suppressed by increasing pressure. Although pressure seems to have no influence on the reaction pathways, it greatly enhances methanol selectivity by inducing in situ condensation. This work demonstrates how spatially resolved operando study can be performed at high-pressure conditions to gain insights into the reaction mechanisms that have practical implications of potential advantages of multicomponent catalysts (i.e. selective in CO or CO2 to methanol) in a reactor.
Conflicts of interest
There are no conflicts to declare.Acknowledgements
Financial support from the Swiss National Science Foundation (Sinergia grant no. CRSII2-154448 and CRSII5-183495) are greatly acknowledged. R. G., N. P. and A. U. acknowledge Generalitat de Catalunya for financial support through the CERCA Programme and MINECO, Spain for financial support (CTQ2016-75499-R (FEDER-UE), SEV-2013-0319). A. U. thanks JST PRESTO (grant no. JPMJPR16S3).References
- A. Goeppert, M. Czaun, J.-P. Jones, G. K. Surya Prakash and G. A. Olah, Chem. Soc. Rev., 2014, 43, 7995–8048 RSC.
- A. Álvarez, A. Bansode, A. Urakawa, A. V. Bavykina, T. A. Wezendonk, M. Makkee, J. Gascon and F. Kapteijn, Chem. Rev., 2017, 117, 9804–9838 CrossRef.
- G. A. Olah, Angew. Chem., Int. Ed., 2013, 52, 104–107 CrossRef CAS PubMed.
- G. A. Olah, A. Goeppert and G. K. S. Prakash, Beyond Oil and Gas: The Methanol Economy, Wiley, 2009, vol. 44 Search PubMed.
- V. N. Ipatieff and G. S. Monroe, J. Am. Chem. Soc., 1945, 67, 2168–2171 CrossRef CAS.
- K. Klier, Adv. Catal., 1982, 31, 243–313 CAS.
- K. Klier, V. Chatikavanij, R. G. Herman and G. W. Simmons, J. Catal., 1982, 74, 343–360 CrossRef CAS.
- G. Liu, D. Willcox, M. Garland and H. H. Kung, J. Catal., 1985, 96, 251–260 CrossRef CAS.
- G. C. Chinchen, P. J. Denny, D. G. Parker, M. S. Spencer and D. A. Whan, Appl. Catal., 1987, 30, 333–338 CrossRef CAS.
- M. Sahibzada, I. S. Metcalfe and D. Chadwick, J. Catal., 1998, 174, 111–118 CrossRef CAS.
- C. V. Ovesen, B. S. Clausen, J. Schiøtz, P. Stoltze, H. Topsøe and J. K. Nørskov, J. Catal., 1997, 168, 133–142 CrossRef CAS.
- Y. Yang, J. Evans, J. A. Rodriguez, M. G. White and P. Liu, Phys. Chem. Chem. Phys., 2010, 12, 9909 RSC.
- L. C. Grabow and M. Mavrikakis, ACS Catal., 2011, 1, 365–384 CrossRef CAS.
- Y. Yang, C. A. Mims, D. H. Mei, C. H. F. Peden and C. T. Campbell, J. Catal., 2013, 298, 10–17 CrossRef CAS.
- F. Studt, M. Behrens, E. L. Kunkes, N. Thomas, S. Zander, A. Tarasov, J. Schumann, E. Frei, J. B. Varley, F. Abild-Pedersen, J. K. Nørskov and R. Schlögl, ChemCatChem, 2015, 7, 1105–1111 CrossRef CAS.
- W. J. Van Rensburg, M. A. Petersen, M. S. Datt, J. A. Van Den Berg and P. Van Helden, Catal. Lett., 2015, 145, 559–568 CrossRef.
- E. L. Kunkes, F. Studt, F. Abild-Pedersen, R. Schlögl and M. Behrens, J. Catal., 2015, 328, 43–48 CrossRef CAS.
- A. Karelovic, G. Galdames, J. C. Medina, C. Yévenes, Y. Barra and R. Jiménez, J. Catal., 2019, 369, 415–426 CrossRef CAS.
- X.-M. Liu, G. Q. Lu, Z.-F. Yan and J. Beltramini, Ind. Eng. Chem. Res., 2003, 42, 6518–6530 CrossRef CAS.
- R. Gaikwad, A. Bansode and A. Urakawa, J. Catal., 2016, 343, 127–132 CrossRef CAS.
- A. Bansode and A. Urakawa, J. Catal., 2014, 309, 66–70 CrossRef CAS.
- S. K. Wilkinson, L. G. A. Van De Water, B. Miller, M. J. H. Simmons, E. H. Stitt and M. J. Watson, J. Catal., 2016, 337, 208–220 CrossRef CAS.
- Y. Choi and H. G. Stenger, Appl. Catal., B, 2002, 38, 259–269 CrossRef CAS.
- N. Boukis, V. Diem, W. Habicht and E. Dinjus, Ind. Eng. Chem. Res., 2003, 42, 728–735 CrossRef CAS.
- J. T. Sun, I. S. Metcalfe and M. Sahibzada, Ind. Eng. Chem. Res., 1999, 38, 3868–3872 CrossRef CAS.
- J. G. van Bennekom, R. H. Venderbosch, J. G. M. Winkelman, E. Wilbers, D. Assink, K. P. J. Lemmens and H. J. Heeres, Chem. Eng. Sci., 2013, 87, 204–208 CrossRef CAS.
Footnotes |
| † Electronic supplementary information (ESI) available. See DOI: 10.1039/d0cy00050g |
| ‡ The three first authors contributed equally to this work. |
| This journal is © The Royal Society of Chemistry 2020 |

