
Different phases of few-layer MoS2 and their silver/gold nanocomposites for efficient hydrogen evolution reaction†
Jing
Wang
,
Wenhui
Fang
,
Ye
Hu
,
Yuhua
Zhang
,
Jiaqi
Dang
,
Ying
Wu
,
Hong
Zhao
 * and
Zengxi
Li
*
* and
Zengxi
Li
*
School of Chemical Sciences, University of Chinese Academy of Sciences, 19A YuQuan Road, Beijing 100049, China. E-mail: hongzhao@ucas.ac.cn; lizengxi@ucas.ac.cn
First published on 19th November 2019
Abstract
Molybdenum disulfide (MoS2) is expansively studied as the most promising non-precious metal catalyst for the hydrogen evolution reaction (HER) because of its excellent properties. However, the properties of MoS2 are quite distinct when the contents of the trigonal (1T) phase and hexagonal (2H) phase constituting MoS2 are different. Herein, three MoS2 representatives with different contents of the 1T phase are synthesized by a simple method, denoted as 1T-MoS2, 1T/2H-MoS2 and 2H-MoS2 from high to low contents of the 1T phase. The chemical composition and crystalline phase of the three samples are systematically analyzed and characterized. To improve charge transport between adjacent nanosheets of MoS2, silver and gold nanoparticles (Ag/AuNPs) are decorated on MoS2, denoted as 1T-MoS2@Ag/AuNPs, 1T/2H-MoS2@Ag/AuNPs and 2H-MoS2@Ag/AuNPs. The HER catalytic experiments of various MoS2 samples in 0.5 M H2SO4 show that 1T-MoS2 has the best catalytic performance compared to 1T/2H-MoS2 and 2H-MoS2. Owing to the cooperative effect of the 1T phase and Ag/AuNPs, the 1T-MoS2@Ag/AuNP nanocomposite exhibits better HER electrocatalytic activity than the other MoS2 samples because it contains a higher-percentage 1T phase and a higher charge transfer rate. This study offers an abundant foundation for designing and improvement of electrocatalysts based on MoS2 and its nanocomposites.
Introduction
Because of the seriously excessive consumption of fossil fuel and related environmental pollution problems, sustainable hydrogen production through electrochemical water splitting has been proposed as an ideal solution for energy crises and global warming.1,2 Generally, electrochemical water splitting processes require a good electrochemical catalyst which should be cost effective, stable, environment-friendly, and efficient and have a lower overpotential.3,4 Currently, as the most active and chemically stable electrocatalysts for the hydrogen evolution reaction (HER), Pt group metals are the most effective catalysts for the generation of hydrogen. However, the high cost of the Pt group metal elements limits their large-scale applications.5–7 Fortunately, molybdenum disulfide (MoS2) with two-dimensional (2D)-layered crystal structures has been desired as a catalyst for the HER owing to its low cost and high electrocatalytic performance.8As we all know, MoS2 is composed of covalently bonded S–Mo–S sheets that are held together by weak van der Waals interactions in layer packing structures. Due to the different arrangements of S atoms, MoS2 has two distinct crystalline phases principally: semiconducting 2H phase and metallic 1T phase.9–12 In general, they were synthesized through a hydrothermal method by changing the reaction temperatures of ammonium molybdate and thiourea, i.e. thiourea not only acted as a sulfur source but also as a reductant to reduce Mo6+ to Mo4+, and excess ammonium ions hydrolyzed from starting materials might play a key role in the formation of intercalated structures.9 Due to the presence of NH4+ ions, MoS2 gradually undergoes an irreversible phase transition from the metallic 1T phase to the semiconductor 2H phase as the temperature increases.13 Nowadays, much attention has been devoted to 1T phase MoS2 which exhibits excellent properties in the fields of photoluminescence,14 electrocatalysts,15,16 photoelectrochemical cells,17 field effect transistors,18 photothermal cancer therapy19 and supercapacitors.20,21 In particular, 1T phase MoS2 shows superior performance for catalytic hydrogen evolution to that of the 2H phase, because the charge transfer resistance decreased noticeably in the metallic phase.22–24 Generally, 1T phase MoS2 can be obtained by chemical lithium intercalation/extraction exfoliation,25 electron-beam irradiation26 and plasmonic hot electron injection.27,28 However, these methods commonly require tough experimental conditions such as highly hazardous reagents, expensive technical equipment and so on.29–32 Therefore, it is still highly desirable to synthesize a high percentage of 1T phase MoS2 by a simple strategy. The previously reported high-content 1T phase MoS2 nanosheets have a few-layer structure, but these nanosheets are prone to restack and accumulate between layers which will hinder charge transport. Thus, it is necessary to improve the conductivity of MoS2 catalysts.
In this study, taking ammonium molybdate and thiourea as the precursors, we synthesized 1T-MoS2 (up to 80.1% 1T phase, Fig. 1a) and 1T/2H-MoS2 (57.6% 1T phase, Fig. 1b) through a facile one-step hydrothermal method at 180 °C and 200 °C, respectively. Then 2H-MoS2 was obtained by calcining the as-prepared 1T-MoS2 at 300 °C (Fig. 1c). The composition and crystal phase of the three MoS2 samples were systematically characterized and compared. In addition, to decrease the accumulation between the MoS2 nanosheets and improve the conductivity, 1T-MoS2@AgNPs or 1T-MoS2@AuNPs were obtained by ultrasonication of the mixture of AgNPs and 1T-MoS2, or through the spontaneous redox between HAuCl4 and 1T-MoS2. Results showed that the two nanocomposites showed better enhancement in the catalytic performance toward hydrogen evolution. To further increase the current density, we tried to load both gold and silver nanoparticles on MoS2 nanosheets (1T-MoS2@Ag/AuNPs) by three different methods. First, silver nanoparticles and HAuCl4 were simultaneously added into the MoS2 suspension; second, silver nanoparticles were added into the as-synthesized 1T-MoS2@AuNP suspension; third, HAuCl4 was added into the as-prepared 1T-MoS2@AgNP suspension. The electrochemical performance of three 1T-MoS2@Ag/AuNP nanocomposites toward the HER in 0.5 M H2SO4 showed that the catalytic activity and current density are improved compared to those of 1T-MoS2@AgNPs or 1T-MoS2@AuNPs, indicating that the high content of the 1T phase and the synergistic effect of MoS2, AgNPs and AuNPs played an important role. The 1T-MoS2@Ag/AuNPs obtained by the third method presents the best performance, hence it was selected for the preparation of 1T-MoS2@Ag/AuNP, 1T/2H-MoS2@Ag/AuNP and 2H-MoS2@Ag/AuNP nanocomposites. The present work may pave the way for designing more superior MoS2 based electrocatalysts and other applications.
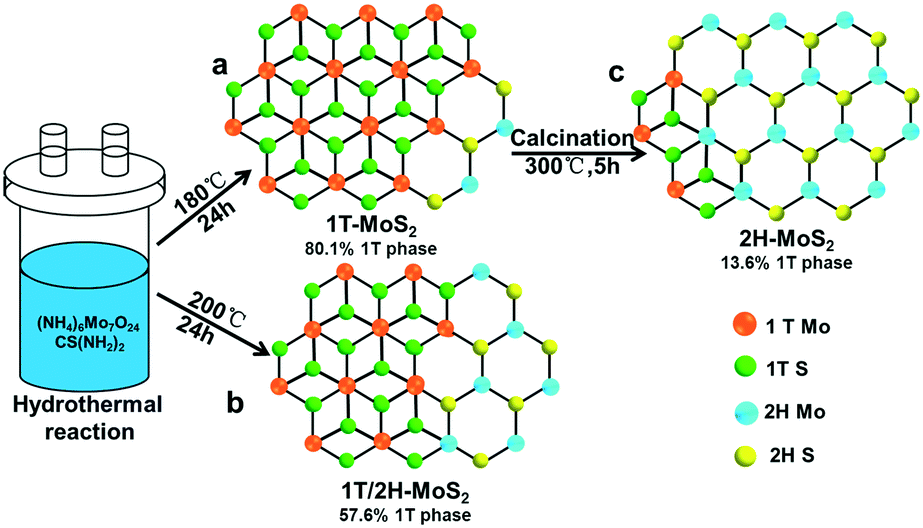 | ||
| Fig. 1 Illustration of the preparation of (a) 1T-MoS2, (b) 1T/2H-MoS2 and (c) 2H-MoS2. | ||
Experimental section
Materials and reagents
Ammonium molybdate [(NH4)6Mo7O24·4H2O], thiourea [CS(NH2)2] and hydrogen tetrachloroaurate hydrate (HAuCl4·4H2O) were bought from Sinopharm Chemical Reagent Co., Ltd. (Beijing, China). Silver nitrate (AgNO3) and sodium borohydride (NaBH4) were purchased from Beijing Chemical Company (Beijing, China). All the reagents were of analytical grade and used as received without further purification. All solutions were prepared with Milli-Q-purified water (18.2 MΩ cm).Synthesis of 1T-MoS2, 1T/2H-MoS2 and 2H-MoS2 nanosheets
Hydrothermal reaction was used to synthesize 1T-MoS2 and 1T/2H-MoS2 nanosheets in a sealed autoclave system. Briefly, 1 mmol (NH4)6Mo7O24·4H2O and 30 mmol CS(NH2)2 were dissolved in 35 mL distilled water under vigorous stirring to form a homogeneous solution. To investigate the effect of temperature on the ratio of the 1T and 2H phases, the solution was transferred into a 50 mL Teflon-lined stainless steel autoclave, maintained at 160, 170, 180, 190, 200, 210 and 220 °C for 24 h and naturally cooled down to room temperature, respectively. The final black product was washed several times with absolute ethanol and dried at 60 °C under vacuum. The XPS spectra of the Mo element of the MoS2 products obtained at different temperatures were deconvoluted (Fig. S1a–e†), and the contents of the 1T and 2H phases at each temperature were calculated from the XPS fitting curves (Table S1 and Fig. S1f†). It can be seen that when the temperature increases from 160 °C to 180 °C, the content of the 1T phase gradually increases, and reaches a maximum at 180 °C. As the temperature increases up to 220 °C, the content of the 1T phase gradually decreases and the content of the 2H phase increases, and the content of the 1T and 2H phases of the product at 200 °C is almost identical. Therefore, we chose products obtained at 180 °C and 200 °C denoted as 1T-MoS2 and 1T/2H-MoS2, respectively. To obtain 2H-MoS2, the as-prepared 1T-MoS2 at 180 °C was then annealed at 300 °C with a heating rate of 10 °C min−1 and maintained at this temperature for 5 h, then allowed to cool down to room temperature naturally. Through the contact angle experiment, it was found that all of the three products showed significant hydrophilicity, and the contact angle was less than 60° (Fig. S2†), indicating that the three products were more easily dispersed in water to form a suspension.Synthesis of 1T-MoS2@Ag/AuNP, 1T/2H-MoS2@Ag/AuNP and 2H-MoS2@Ag/AuNP nanocomposites
Firstly, AgNPs were prepared by the reduction of AgNO3 with NaBH4.33 Briefly, under vigorous magnetic stirring, 0.005 g NaBH4 was rapidly added into 50 mL aqueous solution of AgNO3 (0.1 mM), producing a light yellow colored solution. The solution was filtered with a 0.22 μm Millipore filter and then stored in the dark at 4 °C. Then, three different MoS2 products (1.0 mg) were mixed with the above AgNO3 solution (1.0 mL) and ultrasonicated for 30 min. The solution was centrifuged at 8000 rpm for 10 min and the supernatant was removed after centrifugation. Then the precipitate of MoS2@AgNPs was re-dispersed in water. The precipitation and re-dispersion process was repeated twice. Hereafter, 0.5 mL of 10 mM HAuCl4 solution was added into the MoS2@AgNP suspension. The mixture solution was ultrasonicated for 10 min and purified with a method similar to the above process. Finally, three different MoS2@Ag/AuNP nanocomposites were obtained.Characterization
The UV-vis absorbance spectra were recorded with a UV-2550 spectrophotometer at ambient temperature (20 ± 2 °C) with quartz cuvettes. X-ray diffraction (XRD) data were collected on an MSALXD2 using Cu Kα (1.5406 Å) radiation. Raman measurements were performed at room temperature using a Raman spectrometer (DXR, USA) with a 514 nm laser excitation source. Chemical compositions and valence band spectra of the samples were analyzed using X-ray photoelectron spectroscopy (XPS, Thermo Escalab 250Xi). Contact angles between water droplets and the samples were measured using a JC2000D1 (POWEREACH, China). Transmission electron microscopy (TEM) images were obtained by using a JEM 1200EX, and high-resolution TEM (HRTEM) characterization was performed on a Tecnai G2 F20 S-TWIN (200 kV). A Micromeritics ASAP2460 instrument was employed to measure the Brunauer–Emmett–Teller (BET) specific surface area by N2 adsorption at 77 K. The pore size distribution was calculated by using density functional theory (DFT) from the absorption branch. The scanning electron microscopy (SEM) images were obtained on a Hitachi SU8010 scanning electron microscope. An energy dispersive X-ray spectroscopy (EDX) instrument attached to the SEM was used to obtain elemental mapping images. Atomic force microscopy (AFM) images were obtained using an Ntegra Prima, NT-MDT. Electrochemical impedance spectroscopy (EIS) measurements were performed on a Zennium E electrochemical workstation (Zahner, German). pH measurements were made with a PB-10 precision pH meter (Sartorius, Germany) and sonication was carried out with a KuDos ultrasonic cleaner (Shanghai, China).Electrochemical measurements
Electrochemical tests were performed with a three-electrode system in a N2-saturated 0.5 M H2SO4 aqueous solution on a CHI760d electrochemical workstation (Shanghai Chenhua Instruments). 1 mg of the sample powder was suspended in water (1 mL) and sonicated for 30 min. The suspension was centrifuged to remove the supernatant to a final volume of 250 μL and again sonicated for dispersion. Then 5 μL of catalyst ink was drop-cast onto a glassy carbon electrode (GCE) as the working electrode and dried under an infrared lamp. A saturated calomel electrode (SCE) and graphite rod were used as reference and counter electrodes, respectively. All the potentials were reported against a reversible hydrogen electrode (RHE) by adding a value of (0.241 + 0.059 × pH) V. Linear sweep voltammetry (LSV) measurements were performed from 0.1 to −0.6 V (vs. RHE) with a 5 mV s−1 scan rate and the electrodes were cycled at least 50 cycles prior any measurements to refresh the catalytic surface. Tafel slopes were derived from the polarization curves by fitting the polarization curve data to the Tafel equation η = a + b log![[thin space (1/6-em)]](https://www.rsc.org/images/entities/char_2009.gif) j (where η is the overpotential, j is the current density, and b is the Tafel slope). Cyclic voltammetry (CV) measurements were recorded from 0 to 0.3 V (vs. RHE) at a series of scan rates ranging from 20 to 200 mV s−1 for evaluation of the double-layer capacities of the samples. The durability tests of the catalysts were conducted by use of time-dependent current density (i–t curve) and CV. The Nyquist plots were measured with frequencies ranging from 100 KHz to 0.01 Hz at an overpotential of 200 mV with an AC voltage of 5 mV.
j (where η is the overpotential, j is the current density, and b is the Tafel slope). Cyclic voltammetry (CV) measurements were recorded from 0 to 0.3 V (vs. RHE) at a series of scan rates ranging from 20 to 200 mV s−1 for evaluation of the double-layer capacities of the samples. The durability tests of the catalysts were conducted by use of time-dependent current density (i–t curve) and CV. The Nyquist plots were measured with frequencies ranging from 100 KHz to 0.01 Hz at an overpotential of 200 mV with an AC voltage of 5 mV.
Results and discussion
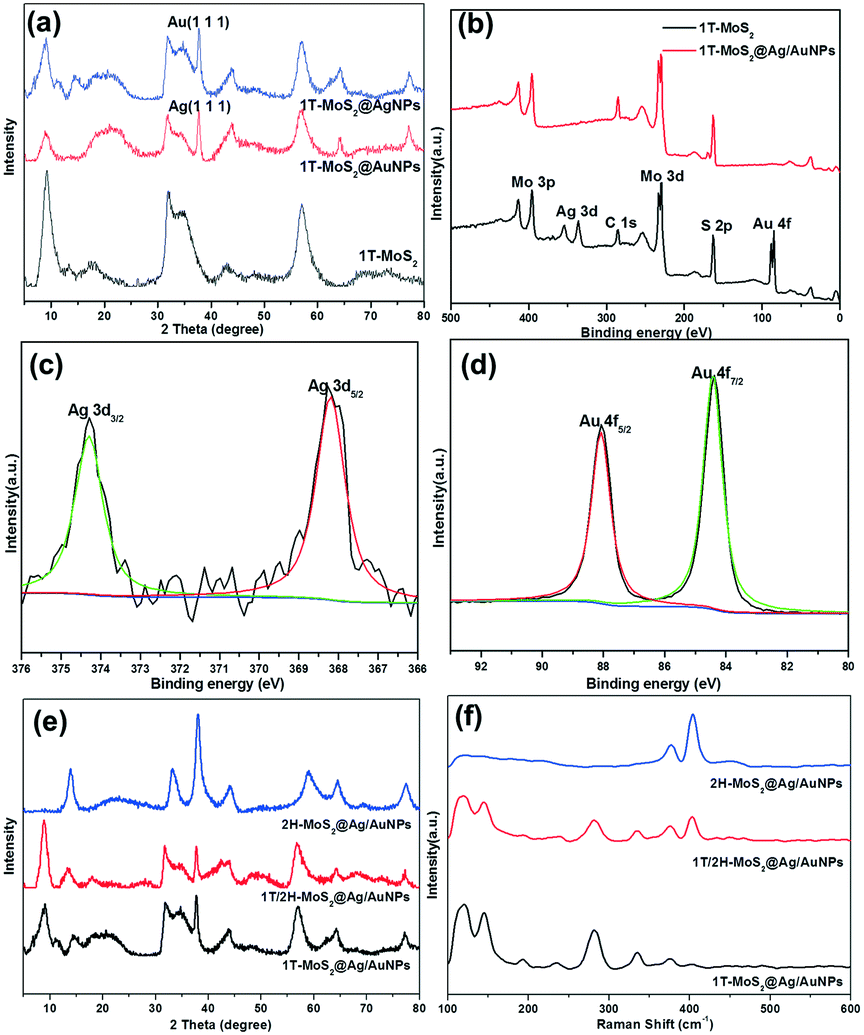
The crystalline phase of different products was investigated using XRD, Raman spectroscopy, UV-vis and XPS. Fig. 2a shows the XRD patterns of 1T-MoS2, 1T/2H-MoS2 and 2H-MoS2, respectively. For the three samples, the XRD patterns show the characteristic peaks at 2θ = 32.7°, 49° and 58°, which correspond to the (100), (105) and (110) planes of MoS2. Due to the metallic 1T structure of MoS2, the new diffraction peak at 2θ = 43° in 1T-MoS2 or 1T/2H-MoS2 appears which corresponds to the (006) planes of MoS2.34 Besides, in contrast to the 14.2° (002) peak of the 2H-MoS2 crystal phase, it is clearly observed that the (002)new peak of 1T-MoS2 and 1T/2H-MoS2 shifts to a lower degree of 9.3°, and a second-order diffraction peak with 18.5° simultaneously appears which indicates the formation of a new lamellar structure with an increasing interplanar spacing compared to that of hexagonal MoS2.9 Therefore, three diffraction peaks at 2θ = 9.3°, 14.2° and 18.5° corresponding to the (002), (002)new and (004) planes are observed simultaneously in 1T/2H-MoS2, respectively. The Raman spectra of 1T-MoS2, 1T/2H-MoS2 and 2H-MoS2 are shown in Fig. 2b. For 2H-MoS2, only two characteristic peaks are observed at 375 and 403 cm−1, corresponding to in-plane E2g and out-of-plane A1g, respectively.23,35 The distance (28 cm−1) between the E2g and A1g modes reveals a few-layer feature of MoS2 according to a recent report.36 However, in 1T-MoS2, it is worth noting that four strong peaks at 156 (J1), 226 (J2), 281 (E1g) and 333 (J3) cm−1 appear which is consistent with those of 1T-MoS2 prepared via n-butyllithium.37 In addition, all of the characteristic peaks of both 1T-MoS2 and 2H-MoS2 appear concurrently in 1T/2H-MoS2 and all the peaks are relatively strong. Further, UV-vis absorption spectroscopy was also used to characterize the difference between the three samples (Fig. 2c). After being diluted to 0.075 mg mL−1, the 1T-MoS2 sample appears as gray, whereas the 2H-MoS2 sample is yellow-green (Fig. 2c, inset). More precisely, compared to the semiconducting 2H-MoS2 sample which has two weak broad absorption peaks from 600 to 700 nm (blue line), the 1T-MoS2 dispersion efficiently absorbed light in the full spectral range from 200 to 800 nm, and the absorbance decreases monotonously with the increase of wavelength (black line), indicating the characteristics of a non-plasmonic metallic nanostructure.38–41 Additionally, 1T/2H-MoS2 (0.075 mg mL−1) with the same concentration exhibits very low absorption and the color of the solution is light gray which may be caused by the coexistence of phases 1T and 2H. Considering the results of XRD, Raman and UV-vis analysis, it is preliminarily proven that the product obtained at 180 °C was mainly the 1T phase, while the 1T and 2H phases were simultaneously exhibited in the sample synthesized at 200 °C. In addition, the product attained at 180 °C exhibited the 2H phase after calcination at 300 °C. | ||
| Fig. 2 The characterization of 1T-MoS2, 1T/2H-MoS2 and 2H-MoS2: (a) XRD spectra, (b) Raman spectra, (c) UV-vis spectra (inset shows the corresponding photographs. The concentration of the three solutions is 0.075 mg mL−1) and (d) XPS survey spectra. | ||
The crystalline compositions and valence states of the three resulting MoS2 samples were further confirmed by performing XPS analysis which is an efficient method to distinguish 2H from 1T polymorphs of MoS2. The XPS survey spectra confirm the presence of S and Mo elements (Fig. 2d). The high resolution XPS spectra of Mo 3d and S 2p of the three products are shown in Fig. 3a and b respectively. For 2H-MoS2, the Mo 3d spectra consist of peaks at around 229.5 eV and 232.7 eV corresponding to the Mo 3d5/2 and Mo 3d3/2 components, respectively. Notably, an obvious red shift for both the Mo 3d5/2 and Mo 3d3/2 peaks to the lower binding energies was observed in 1T-MoS2 and 1T/2H-MoS2.16 Similarly, with respect to the S 2p peak, an obvious shift toward lower binding energies due to the presence of the 1T phase was also observed in 1T-MoS2 and 1T/2H-MoS2 compared to 2H-MoS2.42 The parallel shift of these peaks is attributed to the formation of more content of 1T-MoS2.10,14 The Mo 3d spectrum of 1T/2H-MoS2 nanosheets was deconvoluted into four peaks. Two weak peaks located at 232.9 eV and 229.7 eV corresponding to the characteristic 3d5/2 and 3d3/2 of Mo4+ species from the 2H phase, besides a predominant doublet observed at 232.1 eV and 228.9 eV, revealed the presence of the 1T phase (Fig. 3c). Similarly, in the S 2p region of 1T/2H-MoS2, additional S2− 2p3/2 and S2− 2p1/2 peaks for the 1T phase at 161.9 eV and 163.2 eV are also found except the known doublet peaks for the 2H phase (Fig. 3d). The further deconvolution of the other two Mo spectra reveals that all of them were deconvoluted into four peaks with different intensities, indicating that there is also a small amount of another phase in the individual 1T-MoS2 or 2H-MoS2, as shown in Fig. 3e–h. The concentrations of the metallic 1T phase obtained from 1T-MoS2, 1T/2H-MoS2 and 2H-MoS2 XPS fitting curves are estimated to be ≈80.1%, 57.6% and 13.6%, respectively.
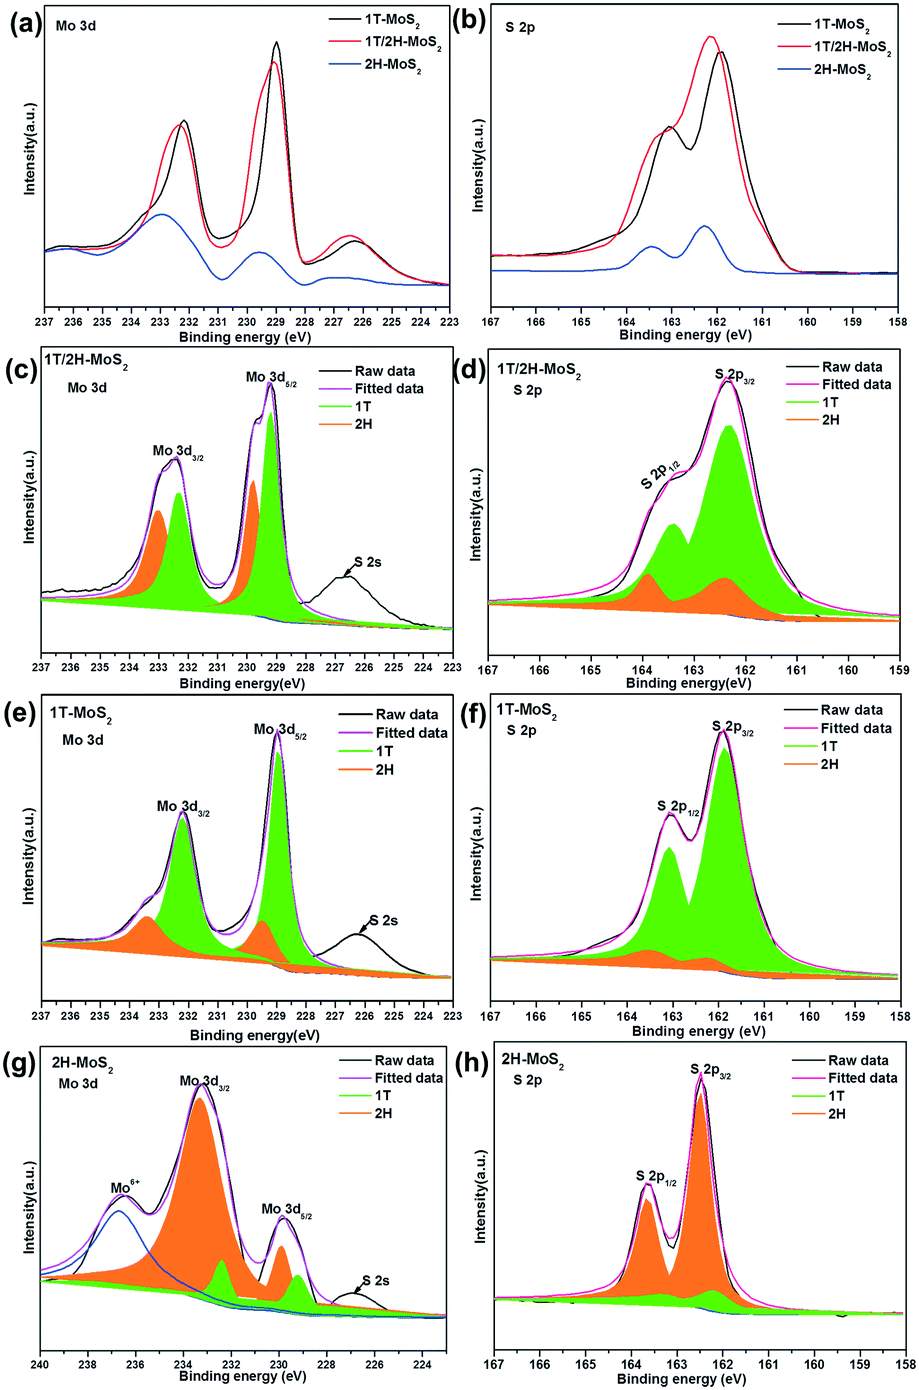 | ||
| Fig. 3 XPS spectra of (a) Mo 3d and (b) S 2p of 1T-MoS2, 1T/2H-MoS2 and 2H-MoS2. High-resolution XPS of (c, e and g) Mo 3d and (d, f and h) S 2p spectra of 1T/2H-MoS2, 1T-MoS2 and 2H-MoS2, respectively. | ||
These structural features of the three representative products were further investigated by HRTEM (Fig. 4). As shown in Fig. 4a, the interlayer distances were measured to be 0.78 nm (±0.03 nm), which is attributed to the d spacing of the (002) planes of 1T phase MoS2. Noticeably, such an interlayer distance of 0.78 nm is slightly larger than the layer-to-layer distance of 0.61 nm in bulk MoS2,43,44 which could be ascribed to the intercalation of in situ generated NH3/NH4+ species between S–Mo–S layers during hydrothermal synthesis.45 Besides, an interplanar spacing of 0.27 nm (±0.03 nm) can be observed from Fig. 4b, typically ascribed to the (101) facet of 1T-MoS2.46 However, there are two 0.27 nm (±0.03 nm) lattice fringes at 60° angles to each other, which are indexed to the (100) and (010) planes of 2H-MoS247 (Fig. 4c). In addition, the HRTEM images of 1T/2H-MoS2 (Fig. 4d) clearly show the coexistence of both 1T and 2H phases. Meanwhile, some defects and crystalline deformation are visible, as marked by red circles in Fig. 4d, which can potentially provide HER active sites.48 All of the above results entirely demonstrate the chemical composition and crystalline phase of the three products.
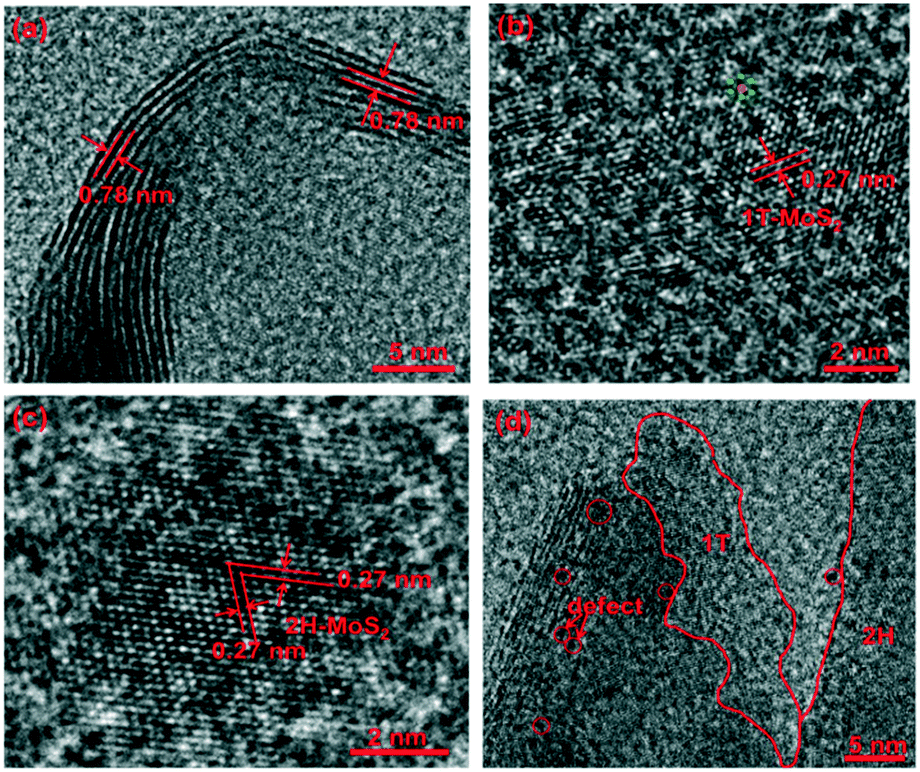 | ||
| Fig. 4 Typical HRTEM images of (a and b) 1T-MoS2, (c) 2H-MoS2 and (d) 1T/2H-MoS2. | ||
The morphology and hierarchical architecture of MoS2 with three different crystal compositions are shown in Fig. S3.† As can be seen from the TEM and SEM images, these three samples primarily were composed of curly 2D nanosheets. As for 1T-MoS2 (Fig. S3a†), most nanosheets are upright arranged and uniformly dispersed but some wrinkles are formed between the edges of layers. As for 1T/2H-MoS2 (Fig. S3c†), the nanosheets are relatively flat, so some of the nanosheets are accumulated together. For 2H-MoS2, the nanosheets are densely packed together, and the aggregation and stacking of the nanosheets can be clearly seen (Fig. S3e†). Comparing the TEM images of the three samples (Fig. S3b, d and f†), it can be seen that the degree of fragmentation of the 1T-MoS2 nanosheets is more obvious, hence there may be more edge structures to provide more active catalytic sites.30 The lateral size of the 1T-MoS2 nanosheets is smaller than those of 1T/2H-MoS2 and 2H-MoS2, but the edges of the three nanosheets have partial overlap. For the above three samples, the crowded structures would not only hinder the charge transport but also limit the transfer of protons at the catalytically active sites of MoS2. These problems can be addressed by the addition of conductive metal nanoparticles (for example Au or Ag), which could enhance the charge transport along interplanar directions and to some extent act as spacers to inhibit accumulation.49 Therefore, we adopted two different processes to modify gold or silver nanoparticles on MoS2 nanosheets to further improve their conductivity and catalytic activity.
We chose 1T-MoS2 as a representative to prepare a nanocomposite of MoS2 and gold or silver nanoparticles. When the gold precursor (HAuCl4) was added to the 1T-MoS2 dispersion without any other reductants at room temperature, the color of 1T-MoS2 dispersion obviously changed from gray to light blue after ultrasonication (Fig. 5a, inset), indicating that gold nanoparticles are formed in situ on 1T-MoS2 and the 1T-MoS2@AuNP nanocomposite was obtained. The change in the UV-vis spectrum also confirmed the formation of gold nanoparticles. As shown in Fig. 5a (curve x), after the addition of the HAuCl4 solution to the 1T-MoS2 dispersion, a new absorption peak at ∼550 nm emerged, which further confirmed the formation of gold nanoparticles.49 However, silver nanoparticles cannot be modified on MoS2 nanosheets by spontaneous redox between Ag+ and 1T-MoS2 like the preparation of 1T-MoS2@AuNPs. As shown in Fig. S4,† after the addition of the AgNO3 solution to the 1T-MoS2 dispersion, no characteristic peak of silver nanoparticles appeared at ∼400 nm, indicating that Ag+ and 1T-MoS2 could not spontaneously react to obtain silver nanoparticles. The reason is as follows: the Fermi level of MoS2 is higher than the reduction potential of AuCl4− ions,50,51 MoS2/AuCl4− can form a redox pair, allowing spontaneous electron transfer from MoS2 to Au3+ and leading to the formation of gold nanoparticles. Thus, 1T-MoS2@AuNPs were prepared by a spontaneous redox reaction between HAuCl4 and 1T-MoS2 without adding any other reducing reagents, while the 1T-MoS2@AgNP nanocomposite is achieved by mixing 1T-MoS2 suspension with silver nanoparticles obtained by reduction of NaBH4. Compared to 1T-MoS2, when the silver nanoparticles were modified on the 1T-MoS2 nanosheets, the shape of the absorption curve was not significantly changed, but the absorption intensity was slightly decreased (Fig. 5a, curve y). When HAuCl4 was added into the 1T-MoS2@AgNP suspension, a new absorption peak corresponding to the Au plasmon band at around 550 nm emerged, suggesting the formation of gold nanoparticles, and the color of the solution turned from gray to blue, which means that the redox reaction still occurs between 1T-MoS2 and HAuCl4 to obtain gold nanoparticles (Fig. 5a, curve z).
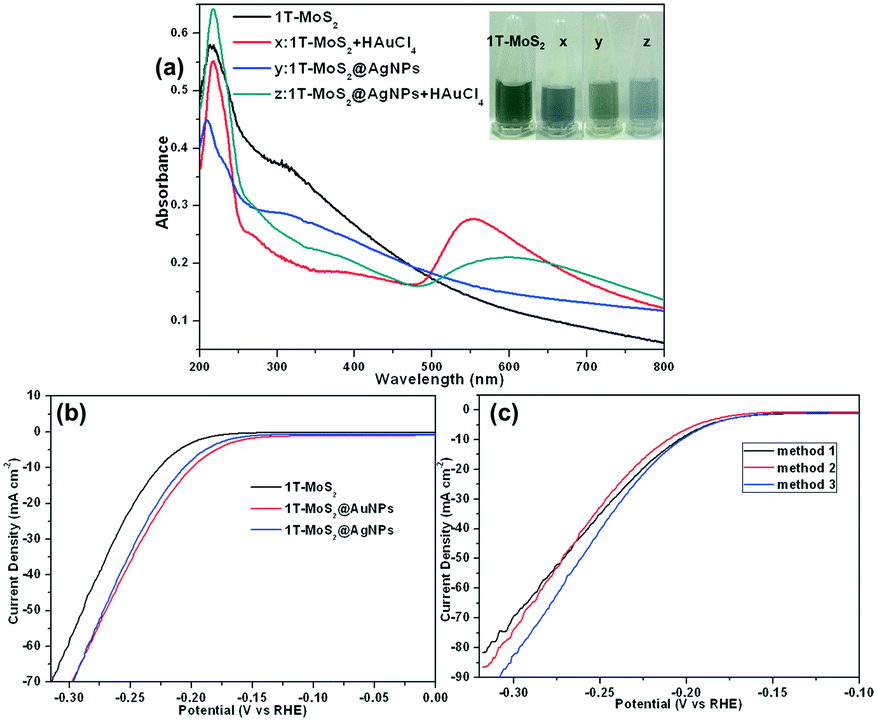 | ||
| Fig. 5 (a) UV-vis spectra of 1T-MoS2 (0.075 mg mL−1), the mixture of 1T-MoS2 (0.075 mg mL−1) and 0.5 mM HAuCl4 (curve x), 1T-MoS2@AgNPs (0.075 mg mL−1, curve y), the mixture of 1T-MoS2@AgNPs (0.075 mg mL−1) and 0.5 mM HAuCl4 (curve z); the inset shows the photographs of the four solutions; polarization curves of (b) 1T-MoS2, 1T-MoS2@AgNPs, and 1T-MoS2@AuNPs and (c) three 1T-MoS2@Ag/AuNP nanocomposites from different approaches (black, red and blue lines) toward the HER at a scan rate of 5 mV s−1 in 0.5 M H2SO4. | ||
Next, we measured the electrochemical characteristics of the 1T-MoS2@AgNP and 1T-MoS2@AuNP nanocomposites on glassy carbon electrodes toward the HER catalytic performance in 0.5 M H2SO4 and compared them with single 1T-MoS2 (Fig. 5b). As expected, the two nanocomposites showed better enhancement in catalytic performance, but the current density needed to be further improved. Fig. 5c shows the catalytic properties of the 1T-MoS2@Ag/AuNP nanocomposite obtained by three different methods. First, silver nanoparticles and HAuCl4 were simultaneously added into the MoS2 suspension to obtain a 1T-MoS2@Ag/AuNP nanocomposite (Fig. 5c, black line); second, silver nanoparticles were further added into the 1T-MoS2@AuNP nanocomposite to obtain the 1T-MoS2@Ag/AuNPs (Fig. 5c, red line); third, the 1T-MoS2@Ag/AuNP nanocomposite was formed by a spontaneous redox reaction between the 1T-MoS2@AgNPs and HAuCl4 (Fig. 5c, blue line). By comparing the LSV curves, it can be seen that the catalytic activity and current density of all the nanocomposites are improved, but the nanocomposite obtained by the third method has the highest current density. It might because AuNPs are modified on the nanosheets by in situ redox reaction between HAuCl4 and 1T-MoS2, which is easier and more preferential than silver nanoparticle modification by ultrasonication on the nanosheets. Furthermore, a relatively strong Au–S bond was formed between the gold nanoparticles with the sulfur atom on the surface of 1T-MoS2.52 Therefore, the catalytic activity of the 1T-MoS2@Ag/AuNPs obtained by the prior two methods is weaker than that of the third. Thus, we chose the third preparation process for subsequent experiments and characterized the 1T-MoS2@Ag/AuNP nanocomposite prepared by the third method.
Fig. 6a and b show the SEM images of 1T-MoS2@AgNPs and 1T-MoS2@AuNPs. After the decorating process, silver or gold nanoparticles can be evidently observed and uniformly dispersed on the edge of 1T-MoS2 nanosheets. By comparing Fig. 6a and b, it can be seen that the gold nanoparticles on the surface of the nanosheets are denser than the silver nanoparticles since the content of HAuCl4 is relatively higher. In addition, the SEM and TEM images of the 1T-MoS2@Ag/AuNP nanocomposite (Fig. 6c and d) show that a small amount of gold and silver nanoparticles are aggregated, resulting in the larger size of the nanoparticles. Fig. 6e shows the AFM image of the 1T-MoS2@Ag/AuNP nanocomposite. It can be seen that it has a similar thickness (∼2.9 nm) to the 1T-MoS2 (Fig. 6f) nanosheets, suggesting that 1T-MoS2 has a nearly uniform thickness of 3–4 layers. In addition, since the gold and silver nanoparticles are supported on the surface of the MoS2 nanosheets, the height of 1T-MoS2@Ag/AuNPs increases to ∼9.6 nm. Further, the EDS mapping results in Fig. S5† confirm the existence of Mo, S, Au and a small amount of Ag in the sample, indicating that Au and Ag are successfully introduced in the prepared 1T-MoS2@Ag/AuNPs. It can be seen from Fig. S6† that the adsorption–desorption isotherms of the respective samples have no obvious saturated adsorption platform, indicating that the pore structure is irregular, and it can be seen from the Barrett–Joyner–Halenda (BJH) pore-size distributions (Fig. S6,† inset) that there are primarily irregular mesoporous structures. The decoration of gold or silver nanoparticles makes the specific surface area of 1T-MoS2 larger (Fig. S6a–c†), but when both the gold and silver nanoparticles are simultaneously loaded on the surface of the 1T-MoS2 nanosheets, the surface area is slightly reduced (Fig. S6d†), which may be due to the accumulation of nanoparticles, as confirmed by the TEM image. The XRD patterns of the 1T-MoS2@AgNP and 1T-MoS2@AuNP nanocomposites further proved that the silver and gold nanoparticles respectively are successfully decorated on the surface of the MoS2 nanosheets (Fig. 7a). In comparison with 1T-MoS2, new obvious diffraction peaks at 38.17° and 38.24° are observed, which could be assigned to the (111) diffraction peaks of cubic Ag (JCPDS no. 87-0720) and Au (JCPDS no. 89-3697), respectively.53 The XRD results further illustrate that Ag and Au have been successfully decorated on the surface of the MoS2 nanosheets, consistent with SEM observations. Then, the XRD spectra of 1T-MoS2@Ag/AuNPs obtained by three different methods illustrated that the gold and silver nanoparticles can be simultaneously modified on the 1T-MoS2 nanosheets by the three methods (Fig. S7†). Furthermore, a comparison of the XPS spectra of 1T-MoS2 and 1T-MoS2@Ag/AuNPs also confirmed that the gold and silver nanoparticles were simultaneously modified on the nanosheets. As depicted in Fig. 7b, there is no significant deviation observed between them, except for the appearance of two new significant peaks of Ag 3d doublet and Au 4f in the 1T-MoS2@Ag/AuNP nanocomposite. In the deconvolution of the Ag 3d spectrum (Fig. 7c), the peaks appear at 368.2 eV and 374.2 eV, corresponding to Ag 3d5/2 and Ag 3d3/2, respectively, further proving the existence of Ag.53,54 Similarly, the peaks located at 87.8 eV and 84.3 eV are assigned to the binding energy of Au 4f5/2 and Au 4f7/2, respectively, of the zero valence Au (Fig. 7d).53,55 All of the above analyses indicate that the gold and silver nanoparticles together were successfully modified on the surface of the MoS2 nanosheet. Subsequently, we prepared three nanocomposites (1T-MoS2@Ag/AuNPs, 1T/2H-MoS2@Ag/AuNPs and 2H-MoS2@Ag/AuNPs) by modifying gold and silver nanoparticles on different kinds of MoS2 using the third approach. The XRD patterns of the three MoS2@Ag/AuNPs (Fig. 7e) show a new diffraction peak at 38°, which is attributed to the (111) crystal planes of Ag and Au. From the XRD patterns and Raman spectra of the three MoS2 nanocomposites (Fig. 7e and f), it can be seen that, for the three MoS2 nanocomposites, the XRD peak and Raman spectral position of MoS2 in the nanocomposites are similar to those of the original MoS2 samples, demonstrating that the crystal structure of MoS2 was not obviously affected after surface modification.
 | ||
| Fig. 6 SEM images of (a) 1T-MoS2@AgNPs, (b) 1T-MoS2@AuNPs and (c) 1T-MoS2@Ag/AuNPs; (d) TEM image of 1T-MoS2@Ag/AuNPs; AFM images of (e) 1T-MoS2 and (f) 1T-MoS2@Ag/AuNP nanosheets. | ||
 | ||
| Fig. 7 (a) XRD spectra of 1T-MoS2 and its Ag and Au nanocomposites; (b) XPS spectra of 1T-MoS2 and 1T-MoS2@Ag/AuNP composite; high-resolution XPS (c) Ag 3d and (d) Au 4f spectra of 1T-MoS2@Ag/AuNPs; XRD patterns (e) and Raman spectra (f) for the three MoS2 nanocomposite products (1T-MoS2@Ag/AuNPs, 1T/2H-MoS2@Ag/AuNPs and 2H-MoS2@Ag/AuNPs). | ||
Finally, we measured the electrochemical characteristics of various MoS2 samples toward the HER catalytic performance in 0.5 M H2SO4. As can be seen from the LSV curves (Fig. 8a), as the amount of 1T phase increases, the overpotential (η) decreases, while the current density (j) increases, indicating that the 1T phase plays a significant role in the enhancement of catalytic activity. In addition, the overpotentials of the three kinds of MoS2@Ag/AuNP nanocomposites toward the HER were obviously smaller than those of the individual MoS2. From the Tafel equation, we obtained Tafel slopes of 54, 59, 88, 53, 57 and 67 mV dec−1 for 1T-MoS2, 1T/2H-MoS2, 2H-MoS2, 1T-MoS2@Ag/AuNPs, 1T/2H-MoS2@Ag/AuNPs and 2H-MoS2@Ag/AuNPs, respectively (Fig. 8b). As far as we know, the Tafel slope is an inherent property of the catalyst that is determined by the rate-limiting step of the HER process, and is used to evaluate the type of mechanism: Volmer–Tafel or Volmer–Heyrovsky.37 There are possible reaction steps in acidic aqueous medium for the generation of hydrogen by water splitting. The first step is a discharge step (Volmer reaction) with a Tafel slope of ∼120 mV dec−1. The following step involves a Tafel recombination step (Tafel reaction) with a Tafel slope of ∼30 mV dec−1, or an electrochemical desorption step (Heyrovsky reaction) with a Tafel slope of ∼40 mV dec−1.34
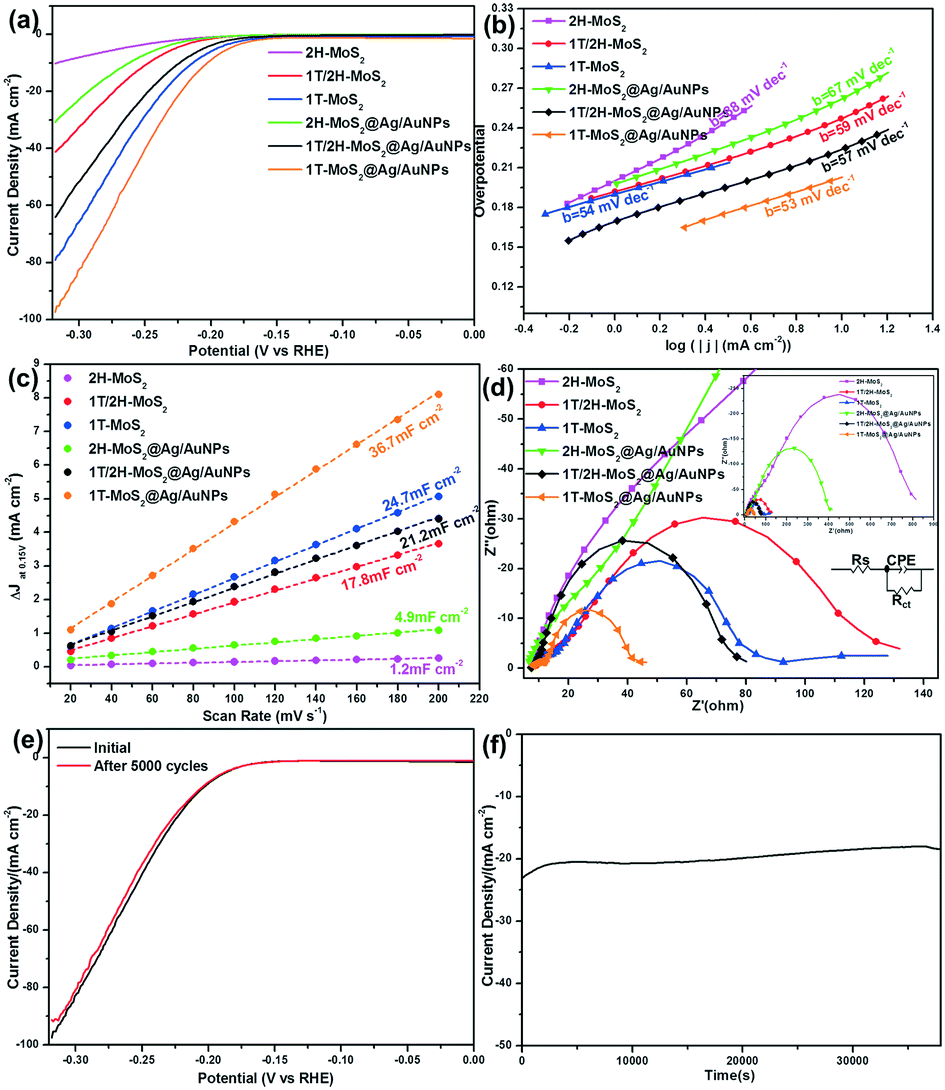 | ||
| Fig. 8 Electrochemical characterization of various MoS2 samples for HER catalysis. (a) Polarization curves show the catalytic performance of various MoS2 samples at a scan rate of 5 mV s−1 in 0.5 M H2SO4; (b) Tafel plots for the data presented in (a); (c) the current density variation (ΔJ = Ja − Jc) at an overpotential of 0.15 V plotted against a scan rate fitted to a linear regression enables the estimation of Cdl; (d) electrochemical impedance spectroscopy Nyquist plots for various MoS2 samples at an overpotential of 200 mV in 0.5 M H2SO4; (e) LSV curves of 1T-MoS2@AgNPs before and after 5000 CV cycles at a scan rate of 5 mV s−1 in 0.5 M H2SO4 and (f) i–t curve at an overpotential of 210 mV versus RHE in 0.5 M H2SO4. | ||
With a Tafel slope of about ∼60 mV dec−1, the HER process of the MoS2 catalyst is ascribed to follow the Volmer–Heyrovsky reaction mechanism with electrochemical desorption as the rate-determining step.46 To further investigate the difference in HER performance by the various MoS2 samples, we measured the double-layer capacitance (Cdl) derived from the results of the cyclic voltammetry measurement at different scan rates (Fig. S8†), which is proportional to the effective electrochemically active surface area (ECSA).30 The ECSA is calculated from the equation ECSA = Cdl/Cs, where Cs is 0.035 mF cm−2.56 The calculated Cdl values were 24.7, 17.8, 1.2, 36.7, 21.2 and 4.9 mF cm−2 for 1T-MoS2, 1T/2H-MoS2, 2H-MoS2, 1T-MoS2@Ag/AuNPs, 1T/2H-MoS2@Ag/AuNPs and 2H-MoS2@Ag/AuNPs, respectively (Fig. 8c). All of the above results indicate that 1T phase MoS2 displays higher exposure of catalytically active sites, and the HER properties of the MoS2 nanosheets are closely related to the quantity of the 1T phase. The introduction of gold and silver nanoparticles leads to an increase in current density and a decrease in overpotential at a 10 mA cm−2 current density.
We also applied EIS to provide further insight into the electrode kinetics during the HER. The Nyquist plots were fitted using an equivalent circuit as shown in the inset in Fig. 8d, which revealed that the charge transfer resistance (Rct) values of 1T-MoS2, 1T/2H-MoS2, 2H-MoS2, 1T-MoS2@Ag/AuNPs, 1T/2H-MoS2@Ag/AuNPs and 2H-MoS2@Ag/AuNPs are approximately 75, 123, 807, 36, 71 and 398 Ω, respectively. The Rct of all the 1T-MoS2 samples is at least one order of magnitude smaller than that of 2H-MoS2, which suggests a faster electron transfer process due to the presence of 1T phase MoS2, and the existence of gold and silver nanoparticles further enhances conductivity and catalytic activity. Furthermore, the electrochemical stability of the 1T-MoS2@Ag/AuNPs was evaluated by conducting LSV scanning before and after repeating cyclic voltammetry tests in the working voltage range. As depicted in Fig. 8e, the curve of 1T-MoS2@Ag/AuNPs after 5000 cycles is nearly coincident with the initial one. The i–t curve (Fig. 8f) indicates that even after a long period of 10 h, the current density of the modified electrode displays only slight degradation. These results suggest that the 1T-MoS2@Ag/AuNP electrode has excellent long-term stability for the HER.
The comprehensive comparison of the electrochemical performances from these representative MoS2 samples above reveals several important points, such as overpotentials (η10) at a current density of 10 mA cm−2, Tafel slope, Cdl, Rct and ECSA. From Table 1, it can be seen that with the increase of the 1T phase content and the introduction of gold and silver nanoparticles, the overpotential (η10), Tafel slope and Rct of MoS2 and their gold/silver nanocomposites decrease, indicating that 1T-MoS2 or 1T-MoS2@Ag/AuNPs are more efficient in the kinetics of H2 evolution and faster faradaic processes lead to superior HER performance.57 This phenomenon is consistent with previous reports.30,49 In addition, the increase of Cdl and ECSA caused by the increase of 1T phase content far exceeds the increase caused by the combination of the same type of MoS2 with gold/silver nanoparticles, which means that MoS2 with a high 1T phase content has more catalytic active sites. The contribution of the 1T phase content toward the HER activity process is greater than that of the gold and silver nanoparticles. Therefore, the significantly enhanced electrochemical HER activity can be ascribed to the following reasons: first, the hydrophilic properties of MoS2 are favorable for the easy access of electrolytes to catalytic active sites. Second, they are attributed mostly to the high-percentage (≈80%) of 1T phase MoS2 which exhibited more active sites and promoted electronic conductivity. Third, the introduction of gold and silver nanoparticles further decreases the charge transfer resistance and facilitates the fast electron transfer for the HER. Hence, the 1T-MoS2@Ag/AuNP nanocomposite exhibits good electrocatalytic activity for the HER.
| Samples | η 10 (mV vs. RHE) | Tafel slope (mV dec−1) | C dl (mF cm−2) | R ct (Ω) | ECSA (cm2) |
|---|---|---|---|---|---|
| 1T-MoS2 | 214 | 54 | 24.7 | 75 | 705.8 |
| 1T/2H-MoS2 | 247 | 59 | 17.8 | 123 | 508.6 |
| 2H-MoS2 | 317 | 88 | 1.2 | 807 | 34.3 |
| 1T-MoS2@Ag/AuNPs | 201 | 53 | 36.7 | 36 | 1048.6 |
| 1T/2H-MoS2@Ag/AuNPs | 225 | 57 | 21.2 | 71 | 605.8 |
| 2H-MoS2@Ag/AuNPs | 263 | 67 | 4.9 | 398 | 140.0 |
Conclusions
In conclusion, we successfully synthesized three representative MoS2 products with different percentages of the 1T phase through a simple process, including 1T-MoS2 (80.1% 1T phase), 1T/2H-MoS2 (57.6% 1T phase), and 2H-MoS2 (13.6% 1T phase) nanosheets. We systematically analyzed and compared the difference of the three samples using UV-vis, Raman, XRD and XPS. Then, three kinds of nanocomposites were obtained by modifying gold and silver nanoparticles on MoS2 nanosheets through different ways. Simultaneously, we investigated the catalytic hydrogen evolution activity for these different MoS2 samples. The results showed that the crystal phase served as the key role in determining the HER catalytic activity, that is to say, 1T-MoS2 exhibited higher electrocatalytic hydrogen activity than 2H-MoS2 and the higher the 1T phase content of the sample, the better the catalytic performance. In addition, with the same 1T phase content, the enhancement of the electrocatalytic activity of the MoS2@Ag/AuNP nanocomposite compared to that of MoS2 is due to the greatly improved charge transfer, as indicated by the smaller charge-transfer impedance. This study performed comprehensive systematic characterization and comparison of the three representative MoS2 samples, and analyzed the reasons for affecting the catalytic activity of MoS2, which provides a new idea for the design and improvement of electrocatalysts based on MoS2 and its nanocomposites with further enhanced catalytic performance.Conflicts of interest
There are no conflicts to declare.Acknowledgements
This work was supported by a grant from the National Natural Science Foundation of China (Grant no. 21838010, 21890762 and 21676270), the National Natural Science Foundation of China-Key Projects of Shanxi Coal Based Low Carbon Joint Foundation (Grant no. U1610222) and the National Key Research and Development Plan of China (Grant no. 2016YFF0203700).Notes and references
- H. Xu, J. J. Wei, K. Zhang, M. Zhang, C. F. Liu, J. Guo and Y. K. Du, J. Mater. Chem. A, 2018, 6, 22697–22704 RSC.
- H. Lu, C. C. Zhou, X. Zhou, H. Sun, H. T. Bai, Y. X. Wang, F. T. Lv, L. B. Liu, Y. G. Ma and S. Wang, Adv. Electron. Mater., 2017, 3, 1700161 CrossRef.
- W. X. Yang, X. J. Liu, L. L. Chen, L. Liang and J. B. Jia, Chem. Commun., 2017, 53, 4034–4037 RSC.
- Q. Y. Hao, S. Y. Li, H. Liu, J. Mao, Y. Li, C. Liu, J. Zhang and C. C. Tang, Catal. Sci. Technol., 2019, 9, 3099–3108 RSC.
- M. H. Suliman, A. Adam, M. N. Siddiqui, Z. H. Yamani and M. Qamar, Catal. Sci. Technol., 2019, 9, 1497–1503 RSC.
- W. X. Yang, L. L. Chen, X. J. Liu, X. Y. Yue, C. Y. Liu and J. B. Jia, J. Mater. Chem. A, 2016, 4, 5834–5838 RSC.
- X. Yue, S. L. Huang, Y. S. Jin and P. K. Shen, Catal. Sci. Technol., 2017, 7, 2228–2235 RSC.
- L. L. Chen, W. X. Yang, X. J. Liu and J. B. Jia, Int. J. Hydrogen Energy, 2017, 42, 12246–12253 CrossRef CAS.
- Q. Liu, X. L. Li, Q. He, A. Khalil, D. B. Liu, T. Xiang, X. J. Wu and L. Song, Small, 2015, 11, 5556–5564 CrossRef CAS PubMed.
- G. Eda, H. Yamaguchi, D. Voiry, T. Fujita, M. W. Chen and M. Chhowalla, Nano Lett., 2011, 11, 5111–5116 CrossRef CAS PubMed.
- F. Wypych, K. Sollmann and R. Schollhorn, Mater. Res. Bull., 1992, 27, 545–553 CrossRef CAS.
- S. X. Min and G. X. Lu, J. Phys. Chem. C, 2012, 116, 25415–25424 CrossRef CAS.
- F. Wypych and R. Schollhorn, J. Chem. Soc., Chem. Commun., 1992, 1386–1388 RSC.
- Q. Liu, Q. C. Shang, A. Khalil, Q. Fang, S. M. Chen, Q. He, T. Xiang, D. B. Liu, Q. Zhang, Y. Luo and L. Song, ChemCatChem, 2016, 8, 2614–2619 CrossRef CAS.
- K. Chang, X. Hai, H. Pang, H. B. Zhang, L. Shi, G. G. Liu, H. M. Liu, G. X. Zhao, M. Li and J. H. Ye, Adv. Mater., 2016, 28, 10033–10041 CrossRef CAS.
- D. Voiry, M. Salehi, R. Silva, T. Fujita, M. W. Chen, T. Asefa, V. B. Shenoy, G. Eda and M. Chhowalla, Nano Lett., 2013, 13, 6222–6227 CrossRef CAS.
- Q. Ding, F. Meng, C. R. English, M. Caban-Acevedo, M. J. Shearer, D. Liang, A. S. Daniel, R. J. Hamers and S. Jin, J. Am. Chem. Soc., 2014, 136, 8504–8507 CrossRef CAS PubMed.
- R. Kappera, D. Voiry, S. E. Yalcin, W. Jen, M. Acerce, S. Torrel, B. Branch, S. D. Lei, W. B. Chen, S. Najmaei, J. Lou, P. M. Ajayan, G. Gupta, A. D. Mohite and M. Chhowalla, APL Mater., 2014, 2, 092516 CrossRef.
- W. Y. Yin, L. Yan, J. Yu, G. Tian, L. J. Zhou, X. P. Zheng, X. Zhang, Y. Yong, J. Li, Z. J. Gu and Y. L. Zhao, ACS Nano, 2014, 8, 6922–6933 CrossRef CAS.
- N. Joseph, P. M. Shafi and A. C. Bose, New J. Chem., 2018, 42, 12082–12090 RSC.
- M. Acerce, D. Voiry and M. Chhowalla, Nat. Nanotechnol., 2015, 10, 313–318 CrossRef CAS.
- M. A. Lukowski, A. S. Daniel, F. Meng, A. Forticaux, L. S. Li and S. Jin, J. Am. Chem. Soc., 2013, 135, 10274–10277 CrossRef CAS.
- Y. F. Yu, G. H. Nam, Q. Y. He, X. J. Wu, K. Zhang, Z. Z. Yang, J. Z. Chen, Q. L. Ma, M. T. Zhao, Z. Q. Liu, F. R. Ran, X. Z. Wang, H. Li, X. Huang, B. Li, Q. H. Xiong, Q. Zhang, Z. Liu, L. Gu, Y. H. Du, W. Huang and H. Zhang, Nat. Chem., 2018, 10, 638–643 CrossRef CAS PubMed.
- C. L. Tan, Z. M. Luo, A. Chaturvedi, Y. Q. Cai, Y. H. Du, Y. Gong, Y. Huang, Z. C. Lai, X. Zhang, L. R. Zheng, X. Y. Qi, M. H. Goh, J. Wang, S. K. Han, X. J. Wu, L. Gu, C. Kloc and H. Zhang, Adv. Mater., 2018, 30, 1705509 CrossRef.
- M. A. Py and R. R. Haering, Can. J. Phys., 1983, 61, 76–84 CrossRef CAS.
- B. Radisavljevic and A. Kis, Nat. Mater., 2013, 12, 815–820 CrossRef CAS.
- T. Hong, B. Chamlagain, S. R. Hu, S. M. Weiss, Z. X. Zhou and Y. Q. Xu, ACS Nano, 2015, 9, 5357–5363 CrossRef CAS.
- Y. M. Kang, Y. J. Gong, Z. J. Hu, Z. W. Li, Z. W. Qiu, X. Zhu, P. M. Ajayan and Z. Y. Fang, Nanoscale, 2015, 7, 4482–4488 RSC.
- H. Tan, W. Hu, C. Wang, C. Ma, H. L. Duan, W. S. Yan, L. Cai, P. Guo, Z. H. Sun, Q. H. Liu, X. S. Zheng, F. C. Hu and S. Q. Wei, Small, 2017, 13, 1701389 CrossRef.
- Y. Yin, J. C. Han, Y. M. Zhang, X. H. Zhang, P. Xu, Q. Yuan, L. Samad, X. J. Wang, Y. Wang, Z. H. Zhang, P. Zhang, X. Z. Cao, B. Song and S. Jin, J. Am. Chem. Soc., 2016, 138, 7965–7972 CrossRef CAS.
- V. Kochat, A. Apte, J. A. Hachtel, H. Kumazoe, A. Krishnamoorthy, S. Susarla, J. C. Idrobo, F. Shimojo, P. Vashishta, R. Kalia, A. Nakano, C. S. Tiwary and P. M. Ajayan, Adv. Mater., 2017, 29, 1703754 CrossRef PubMed.
- X. B. Fan, P. T. Xu, D. K. Zhou, Y. F. Sun, Y. G. C. Li, M. A. T. Nguyen, M. Terrones and T. E. Mallouk, Nano Lett., 2015, 15, 5956–5960 CrossRef CAS.
- Y. Zhou, H. Zhao, Y. J. He, N. Ding and Q. Cao, Colloids Surf., A, 2011, 391, 179–183 CrossRef CAS.
- S. Bai, L. M. Wang, X. Y. Chen, J. T. Du and Y. J. Xiong, Nano Res., 2015, 8, 175–183 CrossRef CAS.
- H. Li, Q. Zhang, C. C. R. Yap, B. K. Tay, T. H. T. Edwin, A. Olivier and D. Baillargeat, Adv. Funct. Mater., 2012, 22, 1385–1390 CrossRef.
- A. Ambrosi, Z. Sofer and M. Pumera, Chem. Commun., 2015, 51, 8450–8453 RSC.
- J. Yang, K. Wang, J. X. Zhu, C. Zhang and T. X. Liu, ACS Appl. Mater. Interfaces, 2016, 8, 31702–31708 CrossRef CAS.
- L. H. Yuwen, F. Xu, B. Xue, Z. M. Luo, Q. Zhang, B. Q. Bao, S. Su, L. X. Weng, W. Huang and L. H. Wang, Nanoscale, 2014, 6, 5762–5769 RSC.
- K. G. Zhou, N. N. Mao, H. X. Wang, Y. Peng and H. L. Zhang, Angew. Chem., Int. Ed., 2011, 50, 10839–10842 CrossRef CAS.
- N. N. Meng, J. Cheng, Y. F. Zhou, W. Y. Nie and P. P. Chen, Appl. Surf. Sci., 2017, 396, 310–318 CrossRef CAS.
- (a) L. Guardia, J. I. Paredes, J. M. Munuera, S. Villar-Rodil, M. Ayan-Varela, A. Martinez-Alonso and J. M. D. Tascon, ACS Appl. Mater. Interfaces, 2014, 6, 21702–21710 CrossRef CAS.
- H. W. Wang, P. Skeldon and G. E. Thompson, Surf. Coat. Technol., 1997, 91, 200–207 CrossRef CAS.
- D. A. Reddy, J. Choi, S. Lee, Y. Kim, S. Hong, D. P. Kumar and T. K. Kim, Catal. Sci. Technol., 2016, 6, 6197–6206 RSC.
- X. H. Zhang, N. Li, J. J. Wu, Y. Z. Zheng and X. Tao, Appl. Catal., B, 2018, 229, 227–236 CrossRef CAS.
- M. A. R. Anjum, H. Y. Jeong, M. H. Lee, H. S. Shin and J. S. Lee, Adv. Mater., 2018, 30, 1707105 CrossRef.
- S. Wang, D. Zhang, B. Li, C. Zhang, Z. G. Du, H. M. Yin, X. F. Bi and S. B. Yang, Adv. Energy Mater., 2018, 8, 1801345 CrossRef.
- Z. P. Liu, Z. C. Gao, Y. H. Liu, M. S. Xia, R. W. Wang and N. Li, ACS Appl. Mater. Interfaces, 2017, 9, 25291–25297 CrossRef CAS.
- Y. F. Huang, R. J. Nielsen, W. A. Goddard and M. P. Soriaga, J. Am. Chem. Soc., 2015, 137, 6692–6698 CrossRef CAS PubMed.
- J. Kim, S. Byun, A. J. Smith, J. Yu and J. X. Huang, J. Phys. Chem. Lett., 2013, 4, 1227–1232 CrossRef CAS PubMed.
- T. S. Sreeprasad, P. Nguyen, N. Kim and V. Berry, Nano Lett., 2013, 13, 4434–4441 CrossRef CAS PubMed.
- H. L. Zou, B. L. Li, H. Q. Luo and N. B. Li, Sens. Actuators, B, 2017, 253, 352–360 CrossRef CAS.
- S. Su, C. Zhang, L. H. Yuwen, J. Chao, X. L. Zuo, X. F. Liu, C. Y. Song, C. H. Fan and L. H. Wang, ACS Appl. Mater. Interfaces, 2014, 6, 18735–18741 CrossRef CAS PubMed.
- X. Q. Qiao, Z. W. Zhang, F. Y. Tian, D. F. Hou, Z. F. Tian, D. S. Li and Q. C. Zhang, Cryst. Growth Des., 2017, 17, 3538–3547 CrossRef CAS.
- A. J. Cheah, W. S. Chiu, P. S. Khiew, H. Nakajima, T. Saisopa, P. Songsiriritthigul, S. Radiman and M. A. A. Hamid, Catal. Sci. Technol., 2015, 5, 4133–4143 RSC.
- S. Su, M. Zou, H. Zhao, C. F. Yuan, Y. A. Xu, C. Zhang, L. H. Wang, C. H. Fan and L. H. Wang, Nanoscale, 2015, 7, 19129–19135 RSC.
- C. C. L. McCrory, S. Jung, I. M. Ferrer, S. M. Chatman, J. C. Peters and T. F. Jaramillo, J. Am. Chem. Soc., 2015, 137, 4347–4357 CrossRef CAS.
- Y. Z. Xu, L. L. Wang, X. Liu, S. Q. Zhang, C. B. Liu, D. F. Yan, Y. X. Zeng, Y. Pei, Y. T. Liu and S. L. Luo, J. Mater. Chem. A, 2016, 4, 16524–16530 RSC.
Footnote |
| † Electronic supplementary information (ESI) available. See DOI: 10.1039/c9cy02158b |
| This journal is © The Royal Society of Chemistry 2020 |