 Open Access Article
Creative Commons Attribution 3.0 Unported Licence
Pd nanoparticles confined in mesoporous N-doped carbon silica supports: a synergistic effect between catalyst and support†
Rafael L.
Oliveira
 *ab,
Julius
Kerstien
b,
Reinhard
Schomäcker
b and
Arne
Thomas
 *a
*a
aTechnische Universität Berlin, Fakultät II, Institut für Chemie: Funktionsmaterialien, Sekretariat BA2, Hardenbergstraße 40, 10623 Berlin, Germany. E-mail: r.delimaoliveira@campus.tu-berlin.de; arne.thomas@tu-berlin.de
bTechnische Universität Berlin, Fakultät II, Institut für Chemie, Sekretariat TC 8, Straße des 17. Juni 124, 10623 Berlin, Germany
First published on 21st January 2020
Abstract
Palladium nanoparticles of similar size were deposited on different supports, layers of carbon materials (with and without nitrogen doping) on the surface of a MCF (mesocellular foam) silica. For the generation of the N-doped carbon coatings, three different N sources were used to also investigate a possible influence of the N-doped carbon precursor and thus the structure of the N-doped carbons on their performance as catalyst support. These catalysts were tested for the Suzuki coupling and hydrogenation reactions. For the Suzuki reaction, the carbon coatings showed to increase dramatically the stability of the MCF material. Furthermore, when N-doped carbon coatings were applied, strong improvement of the stability of the catalysts was observed due to an enhanced interaction between metal nanoparticles and the support, preventing metal particle growth. In hydrogenation reactions, the presence of the N-doped carbon coating on the silica support increases the adsorption of aromatic compounds causing an enhancement of the catalytic activity of Pd NPs when compared to the non-doped supports.
Introduction
Ordered mesoporous silicas (OMS) have been extensively explored as catalyst support over the last three decades.1–11 However, these materials face some limitations e.g. their low mechanical and hydrothermal stability. In this respect, ordered mesoporous carbons (OMC) have an advantage as catalyst support due to their higher hydrothermal stability and their resistance over a broad pH range. However, the synthesis of OMCs is rather tedious, mostly encompassing the replication of an OMS template, which has to be removed after carbonization, thus resulting in many synthetic steps.12–18Recently, hybrid materials, which combine some of the beneficial features of OMSs and OMCs, were reported. Pham et al. described an approach that involves the formation of a layer of carbon on the surface of SBA-15 and showed that this carbon film improved considerably the hydrothermal and mechanical stability of the mesoporous silica. However, N2 physisorption measurements of the modified SBA-15 showed changes of the hysteresis shapes, suggesting partial pore blockage or constriction formation inside the SBA-15 mesopores.19,20
While the increased hydrothermal stability of porous silica after coating with carbons can be beneficial for catalytic applications, the newly formed carbon surface shows a weak interaction with noble metal particles, resulting in catalysts that are quickly deactivated due to metal particles mobility and growth. The physicochemical properties of carbon materials can be changed by functionalization or by doping them with heteroatoms such as nitrogen, sulfur, boron and phosphorous.21–24 In the last decade, nitrogen-doped carbon and nitrogen-functionalized materials have become an exciting topic in catalysis due to the possibility of explored new metal-free catalytic processes and new catalyst supports.25–39
As example, it has been reported that nitrogen atoms in a carbon matrix can increase the interaction between metal nanoparticles and the support, change the electronic properties of the support and finally modifying the adsorption energies of the reactants and products.40–47 However, it is important to note that the influence of nitrogen-doping on carbon supports is not generally beneficial for catalysis. For example, Schlögl et al. reported that nitrogen-doping in carbon nanotubes decreased the activity of Pd nanoparticles for the hydrogenation of phenyl acetylene.38 Dupont et al. also observed a lower catalytic activity of nitrogen-doped carbon materials when compared to carbon black for the hydrogenation of cyclohexene.39 On the other hand, Xia et al. reported a drastically increased catalytic activity of Pd NPs in the hydrogenation of aromatic carboxylic acids,27 which they attributed to favourable interaction between the N-dopants and benzoic acid moieties. Other groups also reported examples of a positive synergetic effect between N-doped carbon materials and metal nanoparticles.28–31,43,44,48
Pd immobilized on different supports have been used as catalysts in many processes such as hydrogenation, oxidation, and cross-coupling reactions among others.49–53 In the case of C–C coupling reactions, the Suzuki reaction is one of the most explored, but Pd nanoparticles immobilized on inorganic supports often suffer from metal leaching and particle growth resulting in a limited recyclability in most cases.54–57 Chemoselective hydrogenations over heterogeneous catalysts have also been widely studied due to economic reasons (production of chemicals and reduction in the number of purification steps). For example, α,β-unsaturated alcohols are extensively used as intermediate for pharmaceutical, agrochemicals and fragrances products.58 N-Doped carbon materials were explored as catalyst support on selective hydrogenation of α,β-unsaturated aldehyde and α,β-unsaturated ketones. In many of these studies, Pd nanoparticles with different size were synthesized but the role of nature and amount of nitrogen dopants on metal particles stability was rarely addressed.34,48,59–61
In this study, layers of carbon materials (with and without nitrogen-doping) where synthesized on the surface of a MCF (mesocellular foam) silica. For the generation of the N-doped carbon coatings three different N sources (cyanamide, 1-ethyl-3-methylimidazolium dicyanamide and N-acetylglycine) were used to also investigate a possible influence of the N-doped carbon precursor and thus the structure of the N-doped carbons on their performance as catalyst support. The carbon coated silicas were used as supports for Pd nanoparticles, and applied as catalyst for Suzuki couplings and hydrogenation reactions. As the Pd NPs deposited on the different supports initially have almost the same particle size distribution, the influence of nitrogen doping of the supports on the catalytic performance could be investigated.
Experimental
Materials and methods
All reagents used in this work were of analytical grade and were obtained from a commercial source. Triblock copolymer poly(ethylene oxide)–poly(propylene oxide)–poly(ethylene oxide) (P123), tetraethyl orthosilicate (98%), cyanamide (99%), 1-ethyl-3-methylimidazolium dicyanamide (98%), mesitylene (99%), ammonium fluoride (98%), 4-bromoacetophenone (98%), phenylboronic acid (97%), palladium acetate (98%) were purchased from Sigma-Aldrich. Furfuryl alcohol (99%) and allylbenzene (98%) were purchased from ABCR, cinnamaldehyde (98%) was purchased from TCI (Tokyo Chemical Industry) and chloride acid (37%) was purchased from Carl Roth Chemicals.Thermogravimetric analysis (TGA) experiments were performed on a Netzsch TG209-F1 apparatus at a heating rate of 5 K min−1 under air atmosphere. XRD analysis was performed on a Bruker D8 Advance instrument using Cu Kα radiation (k = 1.54 Å). Scanning electron microscope (SEM) images were obtained from a Hitachi S-2700 microscope. Transmission electron microscopy (TEM) images were obtained from a FEI Tecnai G2 20 STWIN microscope at an operating voltage of 200 kV. The histograms of particle size distribution were done from the measurement of approximately 400 particles found using representative images. Nitrogen sorption measurements were carried out on a Quantachrome Quadrasorb SI porosimeter, silica samples were degassed at 200 °C for 12 h before measurement and the samples with carbon layer and Pd were degassed at 120 °C for 12 h. The surface area was calculated by using Brunauer–Emmett–Teller (BET) calculations, and the pore-sized distribution plot was obtained from the adsorption branch of the isotherms based on the NLDFT method. X-ray photoelectron spectroscopy (XPS) was performed on a Thermo Fisher Scientific ESCALAB 250Xi. The size of the X-ray spot on the sample is 400 μm, 20 scans for survey, and 50 scans for regions. For each sample, a survey and high resolution C 1s, O 1s, N 1s and Pd 3d regions were measured. The avantage software with pseudo-Voight Gaussian–Lorentzian product functions and smart background was used for peak deconvolution. The binding energies were assigned based in previous reported.21,38 Elemental analysis (EA) was measured on a Thermo Flash EA 1112 organic elemental analyzer as a dynamic flash combustion analysis. Gas chromatography was performed by using an Agilent GC system 7890A equipped with a 30 m capillary column containing (5% phenyl)-methylpolysiloxane as stationary phase using the following parameters: initial temperature 50 °C, temperature ramp 30 °C min−1, final temperature 300 °C and injection volume 1 μL. Pd contents in the liquid from the catalytic test were determined by an ICP-ES Varian 720. CO pulse chemisorption was measured on BelCAT II. Hydrogen reduction was done at 100 °C for 1 h. The samples were cooled at 50° and pulse Co chemisorption were carried out.
MCF synthesis
MCF was synthesized by following a modified procedure previously reported.62 Typically, 4 g of copolymer Pluronic P123 was dissolved in an aqueous acidic solution (10 mL of HCl and 65 mL of water) in a 250 mL polypropylene bottle at room temperature overnight. Then, 3 grams of mesitylene (TMB) was added to the reaction mixture at 35 °C dropwise and stirred vigorously during 2 h. After this period, 8.5 grams of TEOS was slowly added to the mixture (1.5 mL min−1) and stirred vigorously during 5 minutes. The solution was aged at 40 °C for 20 hours under static condition. 46 mg of NH4F was dissolved in 5 mL of water and added to the solution. Then, the mixture was kept under a static condition for 24 hours at 80 °C. The solid product was collected by filtration, washed with distilled water, dried at 60 °C during 24 h and calcined at 550 °C in static air during 6 hours.Carbon and N-doped carbon layer formation
The carbon coating of MCF was formed using furfuryl alcohol as a precursor. 115 mg of furfuryl alcohol was dispersed in 1 mL in methanol and subsequently added to 500 mg of MCF, after methanol was slowly evaporated under vacuum.For the N-doped carbon materials, 70 mg of furfuryl alcohol and 75 mg of an ionic liquid (1-ethyl-3-methylimidazolium dicyanamide) or 105 mg of furfuryl alcohol and 45 mg of cyanamide or 50 mg of furfuryl alcohol and 150 mg of N-acetylglycine were dissolved in 1 mL of methanol. The prepared solution was added to different vials containing 500 mg of MCF each. Methanol was slowly evaporated under vacuum. After this procedure, the obtained solids were placed in an oven and pyrolyzed at 400 °C under argon during 2 hours with a heat ramp of 3.1 °C min−1. The obtained materials were called MCF-C when only furfuryl alcohol was used, MCF-N-IL, MCF-N-Ac or MCF-N-Cy when ionic liquid, N-acetylglycine or cyanamide was used, respectively.
For comparison, a N-doped carbon was synthesized without using MCF as a template (CN-IL). In summary, furfuryl alcohol (700 mg) was added to a round flash containing 750 mg of ionic liquid (1-ethyl-3-methylimidazolium dicyanamide). These two chemicals were mixed vigorous during 15 min. This liquid was transferred to a porcelain crucible, then, placed into an oven and pyrolyzed at 400 °C under argon during 2 hours with a heat ramp of 3.1 °C min−1.
MCF-N-ILs with different N-content were also synthesized. The supports with a higher content of nitrogen were produced using 70 mg of furfuryl alcohol and 150 mg of ionic liquid (1-ethyl-3-methylimidazolium dicyanamide) or pure ionic liquid (230 mg). These precursors were mixed in 1 mL of methanol. The solution was then added to different vials containing 500 mg of MCF each. MCF-N-IL having lower N-content was synthesized mixing 100 mg of furfuryl alcohol and 50 mg of ionic liquid, followed by the same procedure described before.
Pd impregnation
500 mg of a selected support was loaded by incipient wetness impregnation with 0.1 M solution of palladium acetate in dichloromethane, resulting in a solid with 2 wt% of Pd. The materials were dried under vacuum, then, the solid was transferred to a tubular oven and heated at 200 °C at a heating rate of 10 °C min−1, during this period the solid was exposed to an air flow for 30 minutes.Suzuki reaction
In a typical reaction, a mixed solution of 4-bromoacetophenone (0.5 mmol), phenylboronic acid (0.7 mmol), base (0.5 mmol,) and ethanol (4 mL) was added to a Schlenk tube, followed by addition of 20 mg of catalyst (0.75 mol% of palladium relative to 4-bromoacetophenone). Then, the mixture was reacted at the desired temperature and time. For a recycle experiment, the catalyst was recovered by centrifugation and the solid was washed with ethanol/water (1/1, 2 × 40 mL), ethanol (30 mL) and dried at 60 °C overnight. Then, a new solution mixture as described above was added to the solid and allows reacting during the same period. As just one product was observed, the conversions were obtained by external calibration.PVPy poisoning test
The catalyst poison was added to the reactor before the addition of the reaction solution. PVPy was used at 100 equiv. of pyridine sites total of Pd.Hydrogenation reactions
In a typical hydrogenation reaction, 35 mg of catalyst, 1 gram of allylbenzene and 99 ml of methanol were added to a reactor and stirred at 200 rpm under nitrogen at 35 °C. The N2 was replaced by H2 (p = 1.2 atm) without stirring and the reaction was started by turning the stirrer to 1250 rpm. The cumulative hydrogen consumption and the pressure during the reaction were recorded using a Bronkhorst flow meter and pressure controller (Bronkhorst Mättig GmbH, Kamen, Germany), respectively. The sensitivity of measured hydrogen consumption was ±0.4 mL.After the reaction, the solution was analyzed by GC-MS to confirm the conversion and selectivity. For recycling experiments, the catalyst was centrifuged, washed with ethanol, dried and reused in several runs by adding new substrate and solvent.
The same procedure was used to run the hydrogenation of cinnamaldehyde, however, only 0.63 grams of the substrate was added into the reactor and the reaction was run at 60 °C. In this case, GC and GC-MS were used to obtain the conversion values and product determination.
Results and discussion
Synthesis of catalysts
To prepare carbon or N-doped carbon coatings, the pores of the mesocellular foam (MCF) silica were infiltrated with dilute solutions of either pure furfuryl alcohol (MCF-C) or a mixture of furfuryl alcohol with nitrogen-rich molecules, namely 1-ethyl-3-methylimidazolium dicyanamide (MCF-N-IL) or cyanamide (MCF-N-Cy) or N-acetylglycine (MCF-N-Ac). After evaporation of the solvent, the materials were carbonized at 400 °C under argon. N2 physisorption isotherms of pristine MCF and modified MCF were measured and compared (Fig. 1). The isotherms are type IV following the IUPAC classification since they show one-step capillary condensation in the adsorption branch, corresponding to the filling of uniform mesopores by N2 molecules. No change in the hysteresis loops (H1 type) is seen when carbon layers were formed in MCF, just a slight decrease in surface area, pore volume and pore size can be observed as expected (Table 1 and ESI† Fig. S1).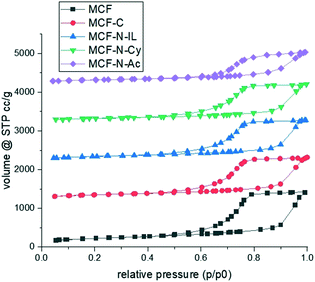 | ||
| Fig. 1 N2 physisorption of synthesized materials. The isotherms were offset by 1200 (MFC-C), 2200 (MCF-N-IL), 3200 (MCF-N-Cy) and 4200 (MCF-N-Ac). | ||
| Material | BET surface area (m2 g−1) | Pore volume (cm3 g−1) | Pore sizea (nm) | Carbon contentb (wt%) | Nitrogen contentb (wt%) |
|---|---|---|---|---|---|
| a Determined by NLDFT. b Determined by CNH analysis. | |||||
| MCF | 786 | 2.1 | 36 | — | — |
| MCF-C | 538.8 | 1.6 | 34 | 9.0 | — |
| MCF-N-IL | 510.4 | 1.6 | 34 | 8.8 | 3.1 |
| MCF-N-Cy | 503.4 | 1.5 | 34 | 9.1 | 3.3 |
| MCF-N-Ac | 470.5 | 1.35 | 33 | 11.5 | 2.9 |
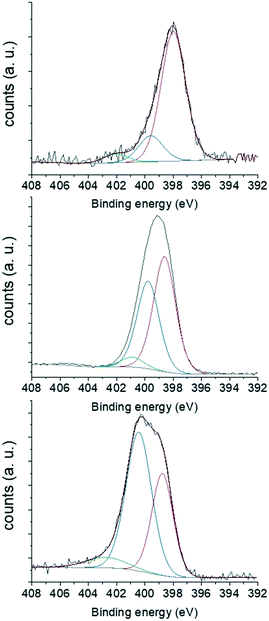
Elemental analyses showed that MCF-N-IL, MCF-N-Cy and MCF-N-Ac have almost the same nitrogen content of 3.1 wt%, 3.3 wt% and 2.9 wt% respectively. However, the N 1s XPS spectra (Fig. 3) showed that the chemical nature of the nitrogen atoms differ, depending on the used N-doped carbon precursor. The N 1s areas of the respected spectra were deconvoluted into three components related to different nitrogen types. In the case of MCF-N-IL, the use of the ionic liquid precursor yield a high percentage of pyridinic nitrogens (79%). When cyanamide was used, the amount of pyridinic nitrogens decreased to 48.9%, while the amount of pyrrolic nitrogen increased to 42.4% (ESI,† Table S2). On the other hand, N-acetylglycine favoured the formation of pyrrolic nitrogen-type (57%).
SEM analysis of MCF, MCF-C, MCF-N-IL and MCF-N-Cy are shown in the ESI† Fig. S2. After carbon layer formation, the materials retained the same morphology as pristine MCF (spherical shape). The distribution of carbon, silicon and oxygen on MCF-C was examined by energy-dispersive X-ray spectroscopy combined with secondary electron images; the maps show a homogenous distribution of carbon throughout MCF-C (Fig. 2). Energy-filtered transmission (EFTEM) image also shows the presence of carbon around the porous structure (carbon K edge). The distribution of N and C on MCF-N-IL and on MCF-N-Cy surfaces were further evaluated by energy-dispersive X-ray spectroscopy (SEM-EDS) and the obtained maps showed uniform distribution of carbon and nitrogen throughout the samples (Fig. S3†).
In addition, thermogravimetric (TGA) analyses were applied to address the thermal stability of the carbon layer synthesized on the silica surface. The carbon layers showed to be stable until 350 °C under air atmosphere. At temperatures higher than 350 °C, a considerable mass loss was observed (ESI,† Fig. S4). The weight loss observed from TGA fits well to the amount of carbon layers determined by CHN elemental analysis, namely MCF-C (9.5% from TGA and 9% from CHN), MCF-N-Cy (13.5% TGA and 12.4% CHN), MCF-N-IL (13.18% TGA and 11.9% CNH) and MCF-N-Ac (15.5% TGA and 14.4% CNH). Comparing the weight loss below 150 °C, which can be attributed to the removal of adsorbed water, for pure and carbon-coated MCFs it is also observed that after introduction of the carbon layers the materials loose considerably their affinity to water (Fig. S4†).
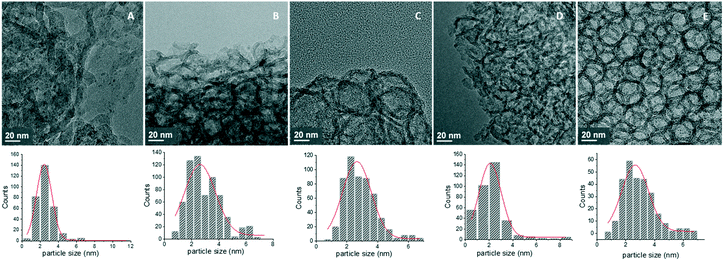
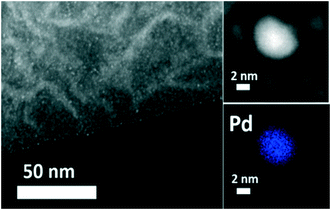
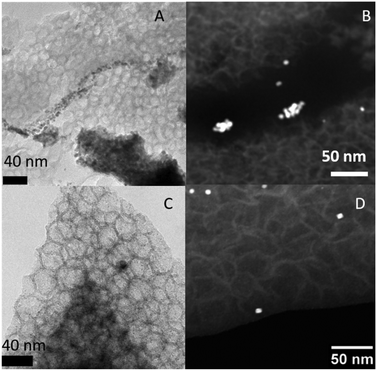
TEM images and histograms of Pd particle size distribution are presented in Fig. 4, showing mainly the porous structure of the MCFs, while also the formation of very small Pd nanoparticles inside the pores can be spotted. STEM-HAADF combined with EDX chemical mapping was used to image more clearly these small Pd nanoparticles, confirming the formation of small Pd nanoparticles with diameters around 0.5–11 nm (Fig. 5). In all cases, small metal particles with a narrow size distribution were observed. MCF-Pd, MCF-C-Pd, MCF-N-Cy-Pd, MCF-N-IL-Pd and MCF-N-Ac have an average metal particle size of 2.4, 2.6, 2.6, 2.2 and 2.6 nm, respectively. This is also seen by XRD measurements of the fresh catalysts (Fig. S6†), showing no diffraction peaks related to Pd species confirming that no larger Pd particles were formed. CO chemisorption was also used to study the metal particle size and the dispersion of Pd nanoparticles (ESI,† Table S11), the results show particle sizes slightly larger than the ones determined by TEM measurement (Fig. 4).
N-Doped carbon was synthesized without the MCF support (CN-IL), however, this procedure resulted in a material with a low surface area (1 m2 g−1) (Fig. S9 and Table S1†). On this support, small Pd nanoparticles could not be stabilized. XRD analysis (ESI,† Fig. S10) showed sharp peaks related to palladium oxide metal particles, revealing that the MCF is essential for building stable and active catalysts.
To elucidate if the support affect the electronic properties of the Pd NPs, XPS analyses of the Pd 3d core peak of the fresh catalysts were explored (Fig. 6). In all cases, a doublet which corresponds to 3d3/2 and 3d5/2 was observed. The Pd 3d areas were deconvoluted into two components related to different Pd types (Pd oxide at 337.5 eV and metallic Pd at 335.3 eV), showing that the electronic states of Pd NPs were considerably influenced by the nature of the support surface. Thus, a higher percentage of divalent Pd (69.8%) was observed for MCF-N-IL where almost 79% of the N atoms were assigned as Npyridinic. In the case of MCF-N-Cy, which present a lower quantity of Npyridinic and higher amount of Npyrrolic, a much lower degree of divalent Pd (58.2%) was seen, yielding a much higher amount of metallic Pd (41.8%). MCF-N-Ac which presents the highest percentage of Npyrrolic showed a further increased amount of Pd metallic (66.13%) (ESI,† Table S3). For the supports MCF-C and pristine MCF, the percentage of metallic Pd was 50.4% and 69.9%, respectively.
Another notable fact is the significant decrease of free Npyridinic species in the N-doped supports when Pd NPs are deposited (Fig. S11, Table S4†), suggesting that Pd are preferably positioned at Npyridinic sites. Schlögl et al. described that pyridinic nitrogen species in N-doped carbons interact strongly with Pd by charge transfer, yielding partial positive charges on the metal, resulting in a Pd 3d core level of divalent Pd. This observation is in line with our XPS results, showing an increase of divalent Pd species with increasing amount of Npyridinic.38
Catalytic test
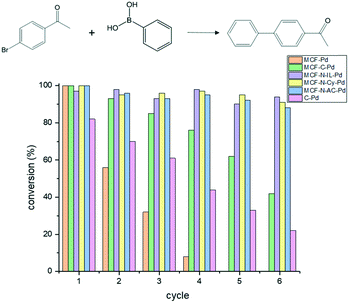
All catalysts were applied under these optimum conditions and recyclability test were carried out to examine their stability. All fresh catalysts showed almost the same conversion values after 1 hour, however, the performance of the catalysts change considerably after the first reaction cycle. Thus, Pd-MCF suffered a strong deactivation already after the first run, while MCF-C showed an enhanced stability, but also a severe deactivation after several runs. In contrast, the N-doped supports (MCF-Cy, MCF-IL and MCF-Ac) showed no sign of deactivation even after six consecutive catalytic reactions (Fig. 7). 4-Bromobenzonitrile was also used as substrate to extend the study, showing the same behaviour as observed to 4-bromoacetophenone (Fig. S23†).
SEM analyses and N2 physisorption of the spent catalyst were used to investigate the cause of the extensive deactivation of MCF-Pd (ESI,† Fig. S12 and S14). The N2 physisorption analysis of spent catalyst suggested that the pore structure of MCF collapse during the Suzuki reaction, as the type IV isotherm observed for the fresh material was not seen for spent catalyst, indicating no presence of mesopores. Moreover, a considerable decrease in surface area and pore volume was observed after Suzuki reaction (Table S7†). SEM analysis also confirms that the conditions applied for the Suzuki reaction resulted in a change of the morphology of MCF-Pd. Beside the collapse of the silica structure caused by alkaline conditions applied for Suzuki reaction, many Pd centers might be inaccessible. Moreover, severe Pd leaching for this material was observed (ESI,† Table S6). MCF-C-Pd did as well show a loss in surface area and pore volume compared to the fresh catalyst, even though pore collapse seem to be much less significant as for MCF-Pd. Moreover, the N-doped materials also show higher stability than MCF-Pd (ESI,† Fig. S15). Also the morphology of the MCF-C-Pd particles has not changed after four reaction cycles (ESI,† Fig. S13).
ICP-OES showed a very low but still detectable amount of Pd leaching for Pd-MCF-C (ESI,† Table S6), while this is not the case for the N-doped samples. To further elucidate the reason for deactivation of MCF-C-Pd, TEM and XRD analyses were carried out to investigate possible metal nanoparticles growth during the Suzuki reaction. Fig. 8A and B shows TEM and HAADF-STEM images of the spent catalysts MCF-C-Pd after 4 cycles. While the cage pore structure of MCF is still present, the Pd nanoparticle distribution changed drastically at the MCF-C surface. Moreover, XRD analysis of spend MCF-C-Pd shows a new peak arising, which can be assigned to Pd oxide (PdO) confirming the formation of larger crystallites (ESI,† Fig. S16). The particle size distributions and complementary TEM images are shown in ESI† Fig. S18–S20, the average Pd particle size of spent catalyst changes to 17.8 nm. CO chemisorption also showed a considerable increase in Pd average particle size to 25 nm (Table S11†). In contrast, formation of such large crystallites is not observed for MCF-N-IL-Pd in XRD measurements. Indeed, TEM and HAADF-STEM images (Fig. 8C and D and S17†) showed that the majority of particles remain small (2–4 nm), but also some larger particles around 10 nm were formed. The particle size distribution (ESI,† Fig. S20) showed a bimodal distribution of Pd nanoparticles size.
Previous reports have indicated that during the Suzuki reaction, leached Pd species formed during catalysis are of considerable importance for the conversion of reactants to products, thus, the actual catalytic species are in solution.57,63–67 However, this is a controversial subject because other authors have reported that C–C coupling reactions take place preferentially on the metal particle surface, thus in a heterogeneous fashion.56,68–70 We used the PVP test to investigate the leaching process.71 Insoluble PVPy (2% cross-linked) can be used as a trap to confirm the presence of leached Pd. In the current work, we applied insoluble PVPy to complement the elemental analysis of the solution and address the formation of active species in solution. For all cases studied, the catalytic activity was suppressed by the addition of PVPy (100 equivalents of pyridine sites to total Pd). This indicates that Pd was liberated from the surface of the support and that these leached species were responsible for most of the catalytic performance.
In the cases where leached species are formed, Pd species in solution can redeposit on the supporting surface at the end of the catalytic process, forming particles larger than the ones present in the fresh catalyst as observed for MCF-C-Pd. In the case of MCF-N-IL-Pd, Pd nanoparticles just grew slightly and this metal particles growth took place inside the pore mostly, suggesting the lower mobility of Pd species compared to MCF-C-Pd. Thus, the importance of nitrogen on carbon matrices relates to the control of leaching and recapturing of Pd, thus affecting the stability or mobility of Oswald ripening species, extending the lifetime of the catalysts.
Based on the fact that Pd species strongly interact with pyridinic nitrogen, this stronger interaction might cause enhancement of the activation barrier for the metal displacement across the support. In the case of MCF-C, the oxygenated functional groups from furan rings (confirmed by infra-red spectroscopy, ESI† Fig. S24) on the surface have a lower affinity to palladium than the nitrogen species. This might result in a weaker interaction between the metal particles and the support causing higher mobility and diffusion of the Pd species with their consequent growth.
The influence of the amount of nitrogen on the support on the Suzuki reaction was also studied. MCF-N-IL supports with different N-content were synthesized adjusting the amount of furfuryl alcohol and ionic liquid. Beside MCF-N-IL with a nitrogen content of 3.1 wt%, solids with 1.8 wt%, 6.4 wt% and 10.1 wt% of nitrogen were produced (determined by elemental analysis). These solids were named MCF-N-IL-2, MCF-N-IL-6 and MCF-N-IL-10 respectively. TGA, XRD and N2 physisorption analyses of these MCF-ILs are shown in the ESI† (Fig. S5, S7 and S8, respectively).
Applying the same conditions shown in Fig. 7, similar conversion values were observed for MCF-N-IL-2-Pd and MCF-N-IL-Pd. However, the catalysts with higher nitrogen content showed lower catalytic activity. In the case of MCF-N-IL-6-Pd, the conversion dropped slightly (80%) while for MCF-N-IL-10-Pd a considerable decrease in the activity was observed (51%) (Fig. S21†).
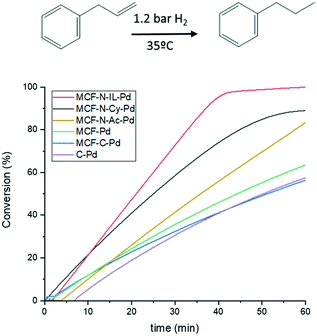
Fig. 9 displays the conversion of allylbenzene versus time for the here described catalysts and a commercial catalyst (Pd on carbon). Despite having the same metal particle size, MCF-N-IL-Pd shows a far better activity compared to MCF-Pd and MCF-C-Pd and also a slightly higher activity as MCF-N-Cy. Turnover numbers (TON) of MCF-N-IL-Pd, MCF-N-Cy-Pd, MCF-N-Ac-Pd, MCF-C-Pd and MCF-Pd were 1286, 990, 921, 689, 604 respectively, suggesting the strong influence of the electronic properties or N-species of Pd NPs on the activity of the catalysts for the studied reaction. N-Doped carbon synthesized without MCF (CN-IL-Pd) was also tested, however, this catalyst presented a much lower activity as shown in Fig. S22.†
To further investigate the influence of the initial electronic properties of metal nanoparticles before the hydrogenation reaction, MCF-C-Pd was reduced using NaBH4. After the reduction, a higher percentage of metallic Pd was observed, i.e. 73% of the total Pd is in the metallic state (ESI† Fig. S30 and Table S10). However, the reduction treatment of the catalyst has almost no influence on catalytic activity (ESI,† Fig. S31). The highest conversion observed for MCF-N-IL-Pd might be related to the presence of Npyridinic. Studying the hydrogenation of 1,5-cyclooctadiene, Tang et al. suggested that the rings containing Npyridinic on the support surface were contributing to increase the adsorption of 1,5-cyclooctadiene considerably through π–π bond interactions, based on DFT calculations and experimental data.77 Indeed the activity of MCF-N-IL-Pd drops considerably when toluene was used as solvent probably caused by competitive adsorption (ESI,† Fig. S25).
The recyclability of the catalysts (ESI,† Fig. S26) showed that all catalysts could be recycled 8 times without any considerable loss in their activity. XRD analyses of the spent catalysts after 8 cycles showed no sign of significant growth of Pd particles, at least no peaks attributed to Pd or PdO can be observed (ESI,† Fig. S28). However, TEM measurements on the spent catalysts revealed a slight growth of metal particles (ESI,† Fig. S27 and S29), that is from 2.4 to 3.1 nm for MCF-Pd and 2.2 to 2.9 nm for MCF-N-IL-Pd. This is also supported by CO chemisorption measurements, showing a slight increase of Pd metal particle size (Table S11†).
All synthesized materials show to be stable under hydrogenation of allylbenzene conditions, i.e. no pore collapse was observed. However, when studying the hydrogenation of furfural under fixed-bed continuous flow at 130 °C, Huo et al. observed the collapse of a SBA-15 covered by carbon, most probably due to the much harsher reaction conditions applied in this study.20 Moreover, the authors also observed a much extensive metal particles growth under applied conditions compared to the results herein reported.
Finally, to study the influence of nitrogen doping on carbon in selective hydrogenation a α,β-unsaturated-aldehyde (cinnamaldehyde) was investigated. The catalytic activity of MCF-N-IL-Pd was compared to other catalysts reported for this reaction previously (ESI,† Table S9).
Fig. 10 shows that the catalysts with nitrogen in their structure present a higher activity than MCF-C-Pd and MCF-Pd as expected. However, no strong influence in the selectivity was observed. Controversially, some authors reported a difference in the selectivity for hydrogenation of cinnamaldehyde when N-doped materials were used.61,78 However, in these studies, catalysts with metal particles of different sizes were applied, which are known to influence strongly the selectivity of this specific reaction due to the creation of new edges and corners with the increase of metal particles size.79 Similar results were also observed for another substrate, chalcone, as shown in Fig. S32.† MCF-N-IL-Pd showed a higher activity than MCF-Pd and MCF-C-Pd, however, the selectivity were almost the same for all catalysts.
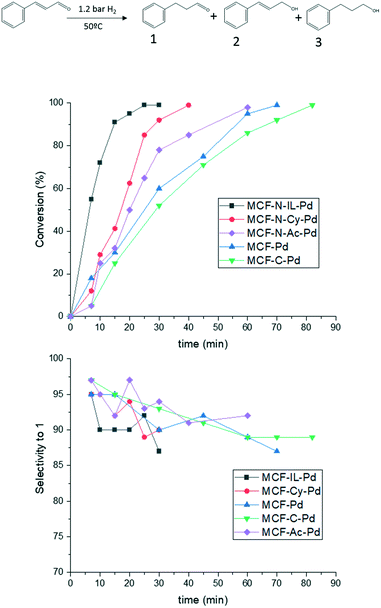 | ||
| Fig. 10 Hydrogenation of cinnamaldehyde by the synthesized catalysts 4.8 mmol of cinnamaldehyde, 99 mL of EtOH, 35 mg of catalysts (0.14% of Pd), 1.2 atm of H2 and 60 °C. | ||
The influence of the amount of nitrogen on the catalyst support (MCF-N-IL) was also explored for the conversion and selectivity of cinnamaldehyde hydrogenation. An increase of N-loading negatively influenced the catalytic activity of Pd nanoparticles on these supports. MCF-N-IL10, which contains 10 wt% of nitrogen, showed a considerable decrease in the catalytic activity (ESI† Fig. S33), however, the selectively stayed constant. This observation is in line with results reported by Dupont et al. who observed a considerable lower catalytic activity of platinum nanoparticles supported on N-doped carbons which a high content of nitrogen (above 10 wt%) compared to platinum supported on activated carbon.39
Conclusions
The deposition of carbon or N-doped carbon layers on MCF surface was successfully developed. These carbon coatings dramatically increase the stability of MCF material. For the Suzuki reaction, Pd NPs on the pure mesoporous silica produced an inefficient catalyst due fast collapse of the silica. In contrast, MCFs with carbon coating were much more stable catalyst support, however also this catalyst deactivated due to metal particle growth probably caused by the weak interaction between Pd NPs and the carbon layer. However, when N-doped carbon coatings were applied, a further improvement of the stability of the catalysts was observed due to an enhanced interaction between metal nanoparticles and support. In hydrogenation reactions, the presence of the N-doped carbon coating on the silica support increases the adsorption of aromatic compounds causing an enhancement of the catalytic activity of Pd NPs deposited on MCF-N-IL, MCF-N-Cy and MCF-N-Ac when compared to the non-doped supports.Conflicts of interest
There are no conflicts to declare.Acknowledgements
The authors would like to thank FAPESP for a grant 2015/07773-0. CAPES, Humboldt foundation for the fellowship and Deutsche Forschungsgemeinschaft (DFG, German Research Foundation) under Germany's Excellence Strategy – EXC 2008/1 – 390540038. We also thank LNNano (Brazil) and Fritz-Haber Institute (Germany) for microscopy analyses.Notes and references
- M. C. G. Albuquerque, I. Jiménez-Urbistondo, J. Santamaría-González, J. M. Mérida-Robles, R. Moreno-Tost, E. Rodríguez-Castellón, A. Jiménez-López, D. C. S. Azevedo, C. L. Cavalcante Jr. and P. Maireles-Torres, Appl. Catal., A, 2008, 334, 35–43 CrossRef CAS.
- A. Taguchi and F. Schüth, Microporous Mesoporous Mater., 2005, 77, 1–45 CrossRef CAS.
- M. Yildiz, Y. Aksu, U. Simon, K. Kailasam, O. Goerke, F. Rosowski, R. Schomäcker, A. Thomas and S. Arndt, Chem. Commun., 2014, 50, 14440–14442 RSC.
- R. L. Oliveira, M. Shakeri, J. D. Meeldijk, K. P. de Jong and P. E. de Jongh, Microporous Mesoporous Mater., 2015, 201, 234–239 CrossRef CAS.
- C. Li, H. Zhang, D. Jiang and Q. Yang, Chem. Commun., 2007, 547–558 RSC.
- H. Yang, L. Zhang, P. Wang, Q. Yang and C. Li, Green Chem., 2009, 11, 257–264 RSC.
- M. Shakeri, C. Tai, E. Göthelid, S. Oscarsson and J.-E. Bäckvall, Chemistry, 2011, 17, 13269–13273 CrossRef CAS PubMed.
- S. H. Gage, J. Engelhardt, M. J. Menart, C. Ngo, G. J. Leong, Y. Ji, B. G. Trewyn, S. Pylypenko and R. M. Richards, ACS Omega, 2018, 3, 7681–7691 CrossRef CAS PubMed.
- C. H. Liu, C. Y. Lin, J. L. Chen, K. T. Lu, J. F. Lee and J. M. Chen, J. Catal., 2017, 350, 21–29 CrossRef CAS.
- G. Mohammadi Ziarani, S. Rohani, A. Ziarati and A. Badiei, RSC Adv., 2018, 8, 41048–41100 RSC.
- H. V. Le, S. Parishan, A. Sagaltchik, H. Ahi, A. Trunschke, R. Schomäcker and A. Thomas, Chem. – Eur. J., 2018, 24, 12592–12599 CrossRef CAS PubMed.
- R. Ryoo, S. H. Joo and S. Jun, J. Phys. Chem. B, 1999, 103, 7743–7746 CrossRef CAS.
- J. Zhang, F. Guo and X. Wang, Adv. Funct. Mater., 2013, 23, 3008–3014 CrossRef CAS.
- C. M. Yang, C. Weidenthaler, B. Spliethoff, M. Mayanna and F. Schüth, Chem. Mater., 2005, 17, 355–358 CrossRef CAS.
- J. E. Hampsey, Q. Hu, Z. Wu, L. Rice, J. Pang and Y. Lu, Carbon, 2005, 43, 2977–2982 CrossRef CAS.
- J. Lee, K. Sohn and T. Hyeon, Chem. Commun., 2002, 2674–2675 RSC.
- P. F. Fulvio, M. Jaroniec, C. Liang and S. Dai, J. Phys. Chem. C, 2008, 112, 13126–13133 CrossRef CAS.
- E. Ramasamy and J. Lee, Chem. Commun., 2010, 46, 2136–2138 RSC.
- H. N. Pham, A. E. Anderson, R. L. Johnson, K. Schmidt-Rohr and A. K. Datye, Angew. Chem., Int. Ed., 2012, 51, 13163–13167 CrossRef CAS PubMed.
- J. Huo, R. L. Johnson, P. Duan, H. N. Pham, D. Mendivelso-Perez, E. A. Smith, A. K. Datye, K. Schmidt-Rohr and B. H. Shanks, Catal. Sci. Technol., 2018, 8, 1151–1160 RSC.
- R. L. Oliveira, C. S. Oliveira, R. Landers and C. R. D. Correia, ChemistrySelect, 2018, 3, 535–543 CrossRef CAS.
- L. Zhang, X. Liu, X. Zhou, S. Gao, N. Shang, C. Feng and C. Wang, ACS Omega, 2018, 3, 10843–10850 CrossRef CAS PubMed.
- V. Campisciano, M. Gruttadauria and F. Giacalone, ChemCatChem, 2019, 11, 90–133 CrossRef CAS.
- Y. Sun, J. Wu, J. Tian, C. Jin and R. Yang, Electrochim. Acta, 2015, 178, 806–812 CrossRef CAS.
- W. Xiong, L. Wang, G. Cai, Y. Yang, F. Hao, P. Liu and H. Luo, ChemistrySelect, 2017, 2, 11244–11249 CrossRef CAS.
- Y. Z. Chen, G. Cai, Y. Wang, Q. Xu, S. H. Yu and H. L. Jiang, Green Chem., 2016, 18, 1212–1217 RSC.
- H. Jiang, X. Yu, R. Nie, X. Lu, D. Zhou and Q. Xia, Appl. Catal., A, 2016, 520, 73–81 CrossRef CAS.
- P. Zhang, Y. Gong, H. Li, Z. Chen and Y. Wang, Nat. Commun., 2013, 4, 1511–1593 CrossRef PubMed.
- W. Gong, C. Chen, H. Zhang, G. Wang and H. Zhao, Catal. Sci. Technol., 2018, 8, 5506–5514 RSC.
- J. L. Fiorio, R. V. Gonçalves, E. Teixeira-Neto, M. A. Ortuño, N. López and L. M. Rossi, ACS Catal., 2018, 8, 3516–3524 CrossRef CAS.
- J. Long, K. Shen and Y. Li, ACS Catal., 2017, 7, 275–284 CrossRef CAS.
- G. Hahn, J. K. Ewert, C. Denner, D. Tilgner and R. Kempe, ChemCatChem, 2016, 8, 2461–2465 CrossRef CAS.
- Z. Li, J. Liu, C. Xia and F. Li, ACS Catal., 2013, 3, 2440–2448 CrossRef CAS.
- R. Nie, M. Miao, W. Du, J. Shi, Y. Liu and Z. Hou, Appl. Catal., B, 2016, 180, 607–613 CrossRef CAS.
- C. E. Chan-Thaw, A. Villa, G. M. Veith, K. Kailasam, L. A. Adamczyk, R. R. Unocic, L. Prati and A. Thomas, Chem. - Asian J., 2012, 7, 387–393 CrossRef CAS PubMed.
- X. Tuaev, J. P. Paraknowitsch, R. Illgen, A. Thomas and P. Strasser, Phys. Chem. Chem. Phys., 2012, 14, 6444 RSC.
- N. Ranjbar Sahraie, J. P. Paraknowitsch, C. Göbel, A. Thomas and P. Strasser, J. Am. Chem. Soc., 2014, 136, 14486–14497 CrossRef CAS PubMed.
- R. Arrigo, M. E. Schuster, Z. Xie, Y. Yi, G. Wowsnick, L. L. Sun, K. E. Hermann, M. Friedrich, P. Kast, M. Hävecker, A. Knop-Gericke and R. Schlögl, ACS Catal., 2015, 5, 2740–2753 CrossRef CAS.
- G. R. Bolzan, G. Abarca, W. D. G. Gonçalves, C. F. Matos, M. J. L. Santos and J. Dupont, Chem. – Eur. J., 2018, 24, 1365–1372 CrossRef CAS PubMed.
- R. L. Oliveira, P. K. Kiyohara and L. M. Rossi, Green Chem., 2009, 11, 1366 RSC.
- R. L. Oliveira, D. Zanchet, P. K. Kiyohara and L. M. Rossi, Chemistry, 2011, 17, 4626–4631 CrossRef CAS PubMed.
- R. Nie, H. Jiang, X. Lu, D. Zhou and Q. Xia, Catal. Sci. Technol., 2016, 6, 1913–1920 RSC.
- S. Li, C. Cheng, X. Zhao, J. Schmidt and A. Thomas, Angew. Chem., Int. Ed., 2018, 57, 1856–1862 CrossRef CAS PubMed.
- M. Oschatz, J. P. Hofmann, T. W. van Deelen, W. S. Lamme, N. A. Krans, E. J. M. Hensen and K. P. de Jong, ChemCatChem, 2017, 9, 620–628 CrossRef CAS PubMed.
- J. P. Paraknowitsch and A. Thomas, Energy Environ. Sci., 2013, 6, 2839–2855 RSC.
- P. Xiao, Y. Zhao, T. Wang, Y. Zhan, H. Wang, J. Li, A. Thomas and J. Zhu, Chem. – Eur. J., 2014, 20, 2872–2878 CrossRef CAS PubMed.
- T. Yuan, H. Gong, K. Kailasam, Y. Zhao, A. Thomas and J. Zhu, J. Catal., 2015, 326, 38–42 CrossRef CAS.
- X. Xu, Y. Li, Y. Gong, P. Zhang, H. Li and Y. Wang, J. Am. Chem. Soc., 2012, 134, 16987–16990 CrossRef CAS PubMed.
- C. H. Liu, C. Y. Lin, J. L. Chen, K. T. Lu, J. F. Lee and J. M. Chen, J. Catal., 2017, 350, 21–29 CrossRef CAS.
- Y. Monguchi, T. Marumoto, T. Ichikawa, Y. Miyake, Y. Nagae, M. Yoshida, Y. Oumi, Y. Sawama and H. Sajiki, ChemCatChem, 2015, 7, 2155–2160 CrossRef CAS.
- P. Paramita Das, V. C. Prabhakaran, S. Nanda, D. Sen and B. Chowdhury, ChemistrySelect, 2019, 4, 3823–3832 CrossRef CAS.
- F. P. Da Silva, J. L. Fiorio and L. M. Rossi, ACS Omega, 2017, 2, 6014–6022 CrossRef CAS PubMed.
- D. Elhamifar, A. Eram and R. Moshkelgosha, Microporous Mesoporous Mater., 2017, 252, 173–178 CrossRef CAS.
- S. Macquarrie, B. Nohair, J. H. Horton, S. Kaliaguine and C. M. Crudden, J. Phys. Chem. C, 2010, 114, 57–64 CrossRef CAS.
- B. Nohair, S. Macquarrie, C. M. Crudden and S. Kaliaguine, J. Phys. Chem. C, 2008, 112, 6065–6072 CrossRef CAS.
- Y. Yang, C. E. Castano, B. F. Gupton, A. C. Reber and S. N. Khanna, Nanoscale, 2016, 8, 19564–19572 RSC.
- K. Köhler, R. G. Heidenreich, J. G. E. Krauter and J. Pietsch, Chemistry, 2002, 8, 622–631 CrossRef.
- Y. Zhu, G. K. Chuah and S. Jaenicke, J. Catal., 2006, 241, 25–33 CrossRef CAS.
- Z. Wei, Y. Gong, T. Xiong, P. Zhang, H. Li and Y. Wang, Catal. Sci. Technol., 2015, 5, 397–404 RSC.
- A. Nagendiran, V. Pascanu, A. Bermejo Gómez, G. González Miera, C. W. Tai, O. Verho, B. Martín-Matute and J. E. Bäckvall, Chem. – Eur. J., 2016, 22, 7184–7189 CrossRef CAS PubMed.
- A. S. Nagpure, L. Gurrala, P. Gogoi and S. V. Chilukuri, RSC Adv., 2016, 6, 44333–44340 RSC.
- Y. Han, S. S. Lee and J. Y. Ying, Chem. Mater., 2006, 18, 643–649 CrossRef CAS.
- R. L. Oliveira, J. B. F. Hooijmans, P. E. de Jongh, R. J. M. Klein Gebbink and K. P. de Jong, ChemCatChem, 2014, 6, 3223–3230 CrossRef CAS.
- R. L. Oliveira, W. He, R. J. M. Klein Gebbink and K. P. de Jong, Catal. Sci. Technol., 2015, 5, 1919–1928 RSC.
- S. P. Andrews, A. F. Stepan, H. Tanaka, S. V. Ley and M. D. Smith, Adv. Synth. Catal., 2005, 347, 647–654 CrossRef CAS.
- Y. Ji, S. Jain and R. J. Davis, J. Phys. Chem. B, 2005, 109, 17232–17238 CrossRef CAS PubMed.
- S. Reimann, J. St, R. Frahm, W. Kleist, J. Grunwaldt and A. Baiker, J. Am. Chem. Soc., 2011, 133, 3921–3930 CrossRef CAS PubMed.
- N. J. S. Costa, P. K. Kiyohara, A. L. Monteiro, Y. Coppel, K. Philippot and L. M. Rossi, J. Catal., 2010, 276, 382–389 CrossRef CAS.
- C. M. Crudden, M. Sateesh, R. Lewis and C. Kl, J. Am. Chem. Soc., 2005, 127, 10045–10050 CrossRef CAS PubMed.
- H. Tsunoyama, H. Ito, M. Komori, R. Kobayashi, M. Shibuta, T. Eguchi and A. Nakajima, Catal. Sci. Technol., 2018, 8, 5827–5834 RSC.
- J. Richardson and C. Jones, J. Catal., 2007, 251, 80–93 CrossRef CAS.
- Y.-S. Kim, X.-F. Guo and G.-J. Kim, Chem. Commun., 2009, 4296–4298 RSC.
- T. Maschmeyer, F. Rey, G. Sankar and J. M. Thomas, Nature, 1995, 378, 159–162 CrossRef CAS.
- S.-Y. Chen, T. Yokoi, C.-Y. Tang, L.-Y. Jang, T. Tatsumi, J. C. C. Chan and S. Cheng, Green Chem., 2011, 13, 2920–2930 RSC.
- L. Liu, Q. Zhao, R. Liu and L. Zhu, Appl. Catal., B, 2019, 252, 198–204 CrossRef CAS.
- R. Nie, H. Jiang, X. Lu, D. Zhou and Q. Xia, Catal. Sci. Technol., 2016, 6, 1913–1920 RSC.
- D. Tang, X. Sun, D. Zhao, J. Zhu, W. Zhang, X. Xu and Z. Zhao, ChemCatChem, 2018, 10, 1291–1299 CrossRef CAS.
- K. Chizari, I. Janowska, M. Houllé, I. Florea, O. Ersen, T. Romero, P. Bernhardt, M. J. Ledoux and C. Pham-Huu, Appl. Catal., A, 2010, 380, 72–80 CrossRef CAS.
- A. Giroir-Fendler, D. Richard and P. Gallezot, Catal. Lett., 1990, 5, 175–181 CrossRef CAS.
Footnote |
| † Electronic supplementary information (ESI) available. See DOI: 10.1039/c9cy01920k |
| This journal is © The Royal Society of Chemistry 2020 |


