
 Open Access Article
 This Open Access Article is licensed under a Creative Commons Attribution-Non Commercial 3.0 Unported Licence
Nanomechanical mapping of soft materials with the atomic force microscope: methods, theory and applications
Ricardo
Garcia

Instituto de Ciencia de Materiales de Madrid, CSIC, c/Sor Juana Inés de la Cruz 3, 28049 Madrid, Spain. E-mail: r.garcia@csic.es
First published on 14th July 2020
Abstract
Fast, high-resolution, non-destructive and quantitative characterization methods are needed to develop materials with tailored properties at the nanoscale or to understand the relationship between mechanical properties and cell physiology. This review introduces the state-of-the-art force microscope-based methods to map at high-spatial resolution the elastic and viscoelastic properties of soft materials. The experimental methods are explained in terms of the theories that enable the transformation of observables into material properties. Several applications in materials science, molecular biology and mechanobiology illustrate the scope, impact and potential of nanomechanical mapping methods.
 Ricardo Garcia | Ricardo Garcia is a Professor of nanoscience and nanotechnology at the Instituto de Ciencia de Materials de Madrid (CSIC). His scientific activity is focused on the development of force microscopy methods for studying soft materials and solid–liquid interfaces. In the late 90s, he contributed to the development of tapping mode AFM. More recently, his research is focused on three problems: development of multifrequency methods, in particular, bimodal AFM for high-resolution mapping of soft matter; designing 3D-AFMs for providing atomic-resolution images of solid–liquid interfaces and advancing AFM for mechanical property mapping of living cells. Some of his inventions were commercialized. |
1 Introduction
The atomic force microscope (AFM)1 has greatly contributed to our current understanding of soft materials and their physical, chemical and biomolecular interactions.2–11 Mapping at high-spatial resolution the mechanical properties of heterogeneous interfaces is one of the key achievements of AFM. In this review nanomechanical mapping and nanomechanical force spectroscopy have the same meaning. Those terms are used interchangeably to define the field of AFM-based methods that generate maps of mechanical properties with nanoscale spatial resolution.Several factors drive the evolution of this field. In materials science, the engineering of heterogeneous materials demands techniques to map with high-spatial resolution and quantitative accuracy the mechanical properties of the resulting interfaces.7 In mechanobiology,12 time-resolved maps of mechanical interactions are necessary to fully understand cell differentiation and growth. Finally, the capabilities of AFM to generate atomic-scale resolution images of a variety of solid–liquid interfaces13 demand fast and accurate methods to map tip–surface forces.
Nanomechanical force spectroscopy involves a variety of scientific backgrounds from applied physics to physical chemistry; from molecular biology to mechanical engineering. It involves also a diversity of goals ranging from those of academia to those of industry. Those factors have produced a wealth of experimental methods and applications. At the same time, those factors have contributed to establish a loosely connected field.
The AFM is a mechanical microscope that transforms the interaction force acting between a sharp tip and a sample surface into the displacement of a cantilever-tip transducer (Fig. 1). The capability of the AFM to generate mechanical properties maps of soft materials was recognized more than 25 years ago by Hansma and co-workers14,15 In fact, one of the early achievements of AFM was the nanoscale characterization of polymer interfaces in their native state.16,17 Since then, a large variety of methods have been proposed, improved and applied to characterize soft materials.18–26 Some of the earlier methods such as force–volume4,14,18,19 and AFM phase-imaging16,17 are still evolving while the applications of other methods have declined.26
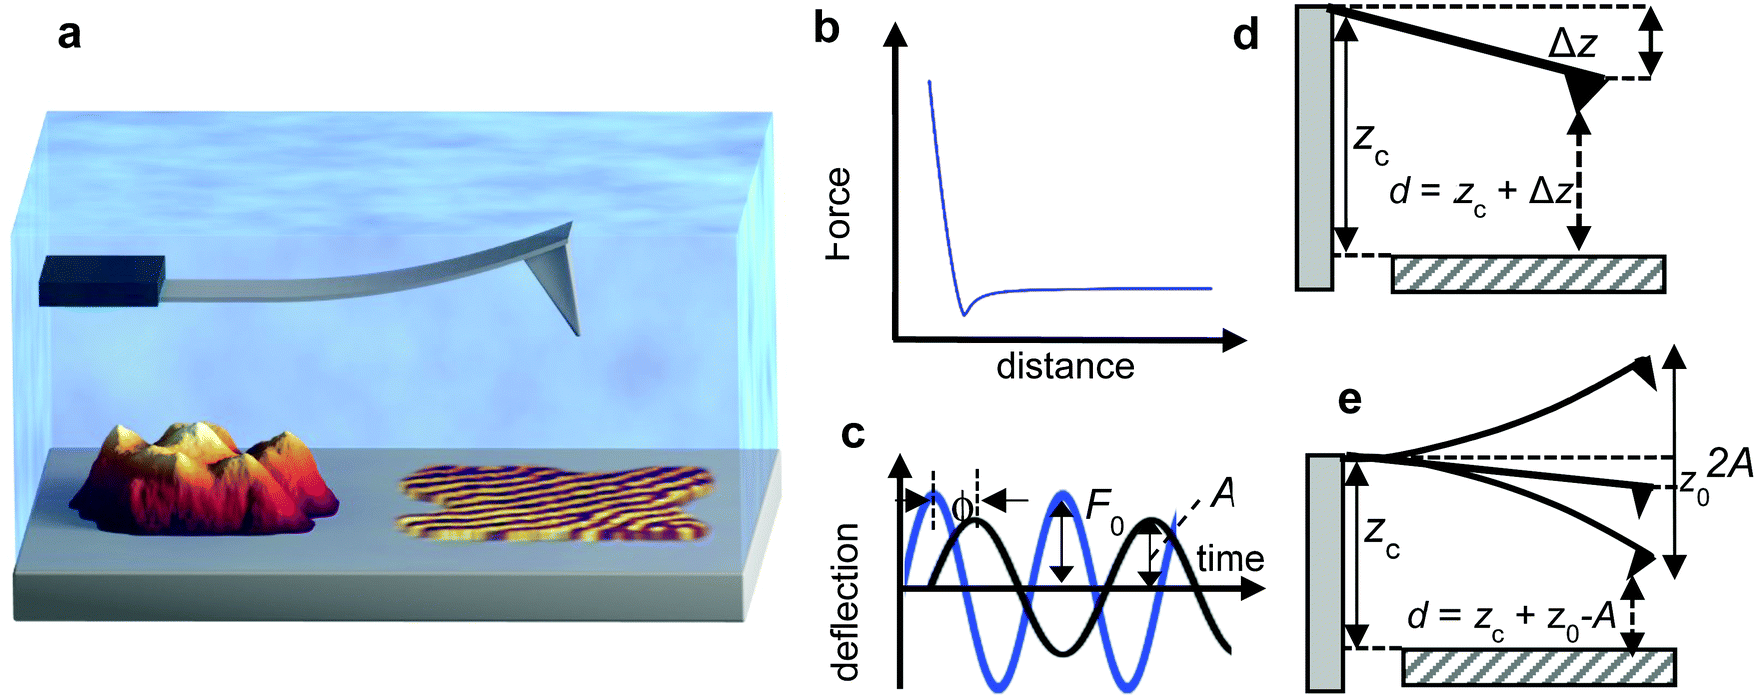 | ||
| Fig. 1 AFM, force–distance curves and observables. (a) Scheme of an heterogenous interface made of regions of different composition and morphology. (b) Force–distance curve. (c) Driving force (blue) and tip's oscillation in the presence of a force (black). Definition of phase shift. (d) Scheme of the distances and deflections in an off-resonance AFM measurement. (e) Scheme of the distances and deflections in an on-resonance AFM measurement. | ||
The main goal of this review is to introduce the experimental approaches, the theoretical background and the capabilities of the most advanced AFM-based methods to map at very high (<10 nm) or high-spatial resolution (10–100 nm) the mechanical properties of soft materials. Soft materials are loosely defined as materials with an elastic modulus within the 100 Pa to 10 GPa range. Cells, proteins, polymers, biopolymers or liposomes are some examples of soft materials.
An advanced nanomechanical mapping method should have the following features: (i) high-spatial resolution; (ii) quantitative accuracy; (iii) independent of the tip's properties; (iv) data acquisition in the high-speed range (≥1 frame per s) and (v) suppression of cross-talk between topography and material properties.
The review is divided in four sections. The first section introduces the scientific context. It provides a classification of nanomechanical force spectroscopy methods in two main categories, force–distance curve and parametric methods. The second section presents the theoretical concepts needed to understand the relationship between the AFM observables and the mechanical properties of a material. Elastic, inelastic and viscoelastic properties are considered. The relevance of finite element method and molecular dynamics simulations to interpret nanomechanical maps are also discussed. A special sub-section is devoted to introduce the challenges posed by the characterization of the mechanical properties of living cells.
The third section describes the most widely used nanomechanical mapping methods, among them force–volume, bimodal AFM, AFM phase-imaging and contact resonance. This section is illustrated by several applications in materials science, surface science or cell biology. The last section provides an analysis of some fundamental and open issues. It examines some of the technological challenges that are likely to shape the evolution of the field.
2 Classification of nanomechanical mapping methods
The AFM measures the mechanical properties of a surface either by recording the interaction force with respect to the tip–surface distance (Fig. 1b) or by measuring the effect of the interaction force on some parameters of the tip's oscillation (Fig. 1c).A plethora of AFM-based methods has been proposed to generate spatially-resolved maps of mechanical properties. Initially, the methods were classified according to the AFM mode used to generate a topographic image, quasi-static (off-resonance) or dynamic (on-resonance). This classification scheme is useful but incomplete because it does not inform on how mechanical properties are obtained.
A summary of the nanomechanical mapping methods is presented in Fig. 2a. The methods might be classified according to different features such as the quantitative character, the type of observable or the ratio between the resonant frequency and the modulation frequency. The most distinctive classification comes from how values of mechanical properties are obtained. Force–distance curves methods record a force–distance curve on each point of the surface (Fig. 2b). In parametric methods, some observables such as the amplitude, the phase or the frequency shifts are recorded on each point of the surface (Fig. 2c). An analytical theory transforms those observables in terms of parameters of the interaction force.
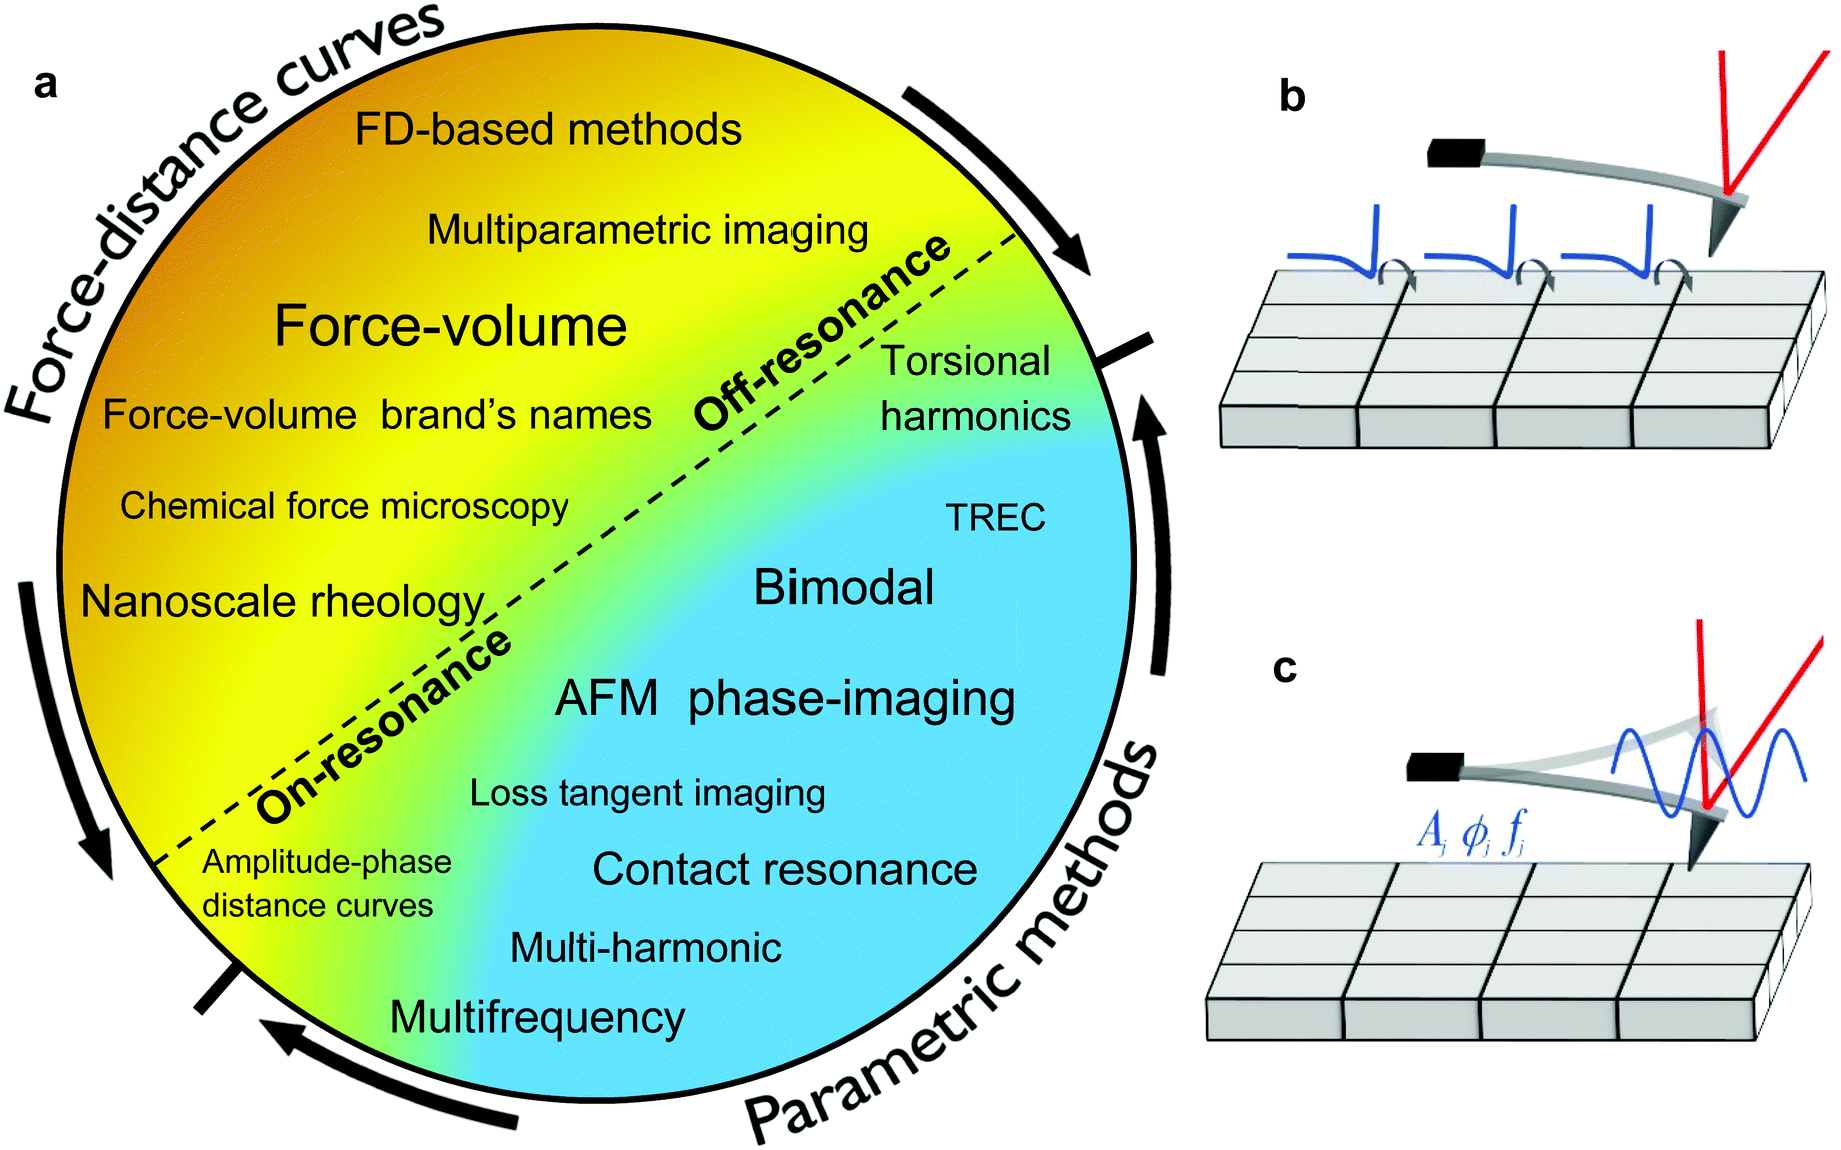 | ||
| Fig. 2 Classification of nanomechanical mapping methods. (a) The scheme is based on how mechanical properties are obtained. (b) Scheme of a force–distance curve method. Off-resonance methods lie to the left of the dashed line. On-resonance methods lie to the right of the dashed line. (c) Scheme of nanomechanical mapping by using a parametric method. A, ϕ and f are, respectively, the amplitude, phase shift and resonant frequency of the tip. Those parameters depend on the sample properties. | ||
2.1 Force–distance curve methods
A force–distance curve (FDC) provides the dependence of the force with respect to the tip–surface distance on each point of the surface. Force–distance curves are determined either by driving the cantilever at a frequency well below its fundamental resonance (off-resonance) or at a frequency that coincides or is very close to its fundamental resonance (on-resonance). Fig. 3 shows some theoretical force–distance curves. The force might also be represented with respect to time by knowing the waveform of the tip–surface distance.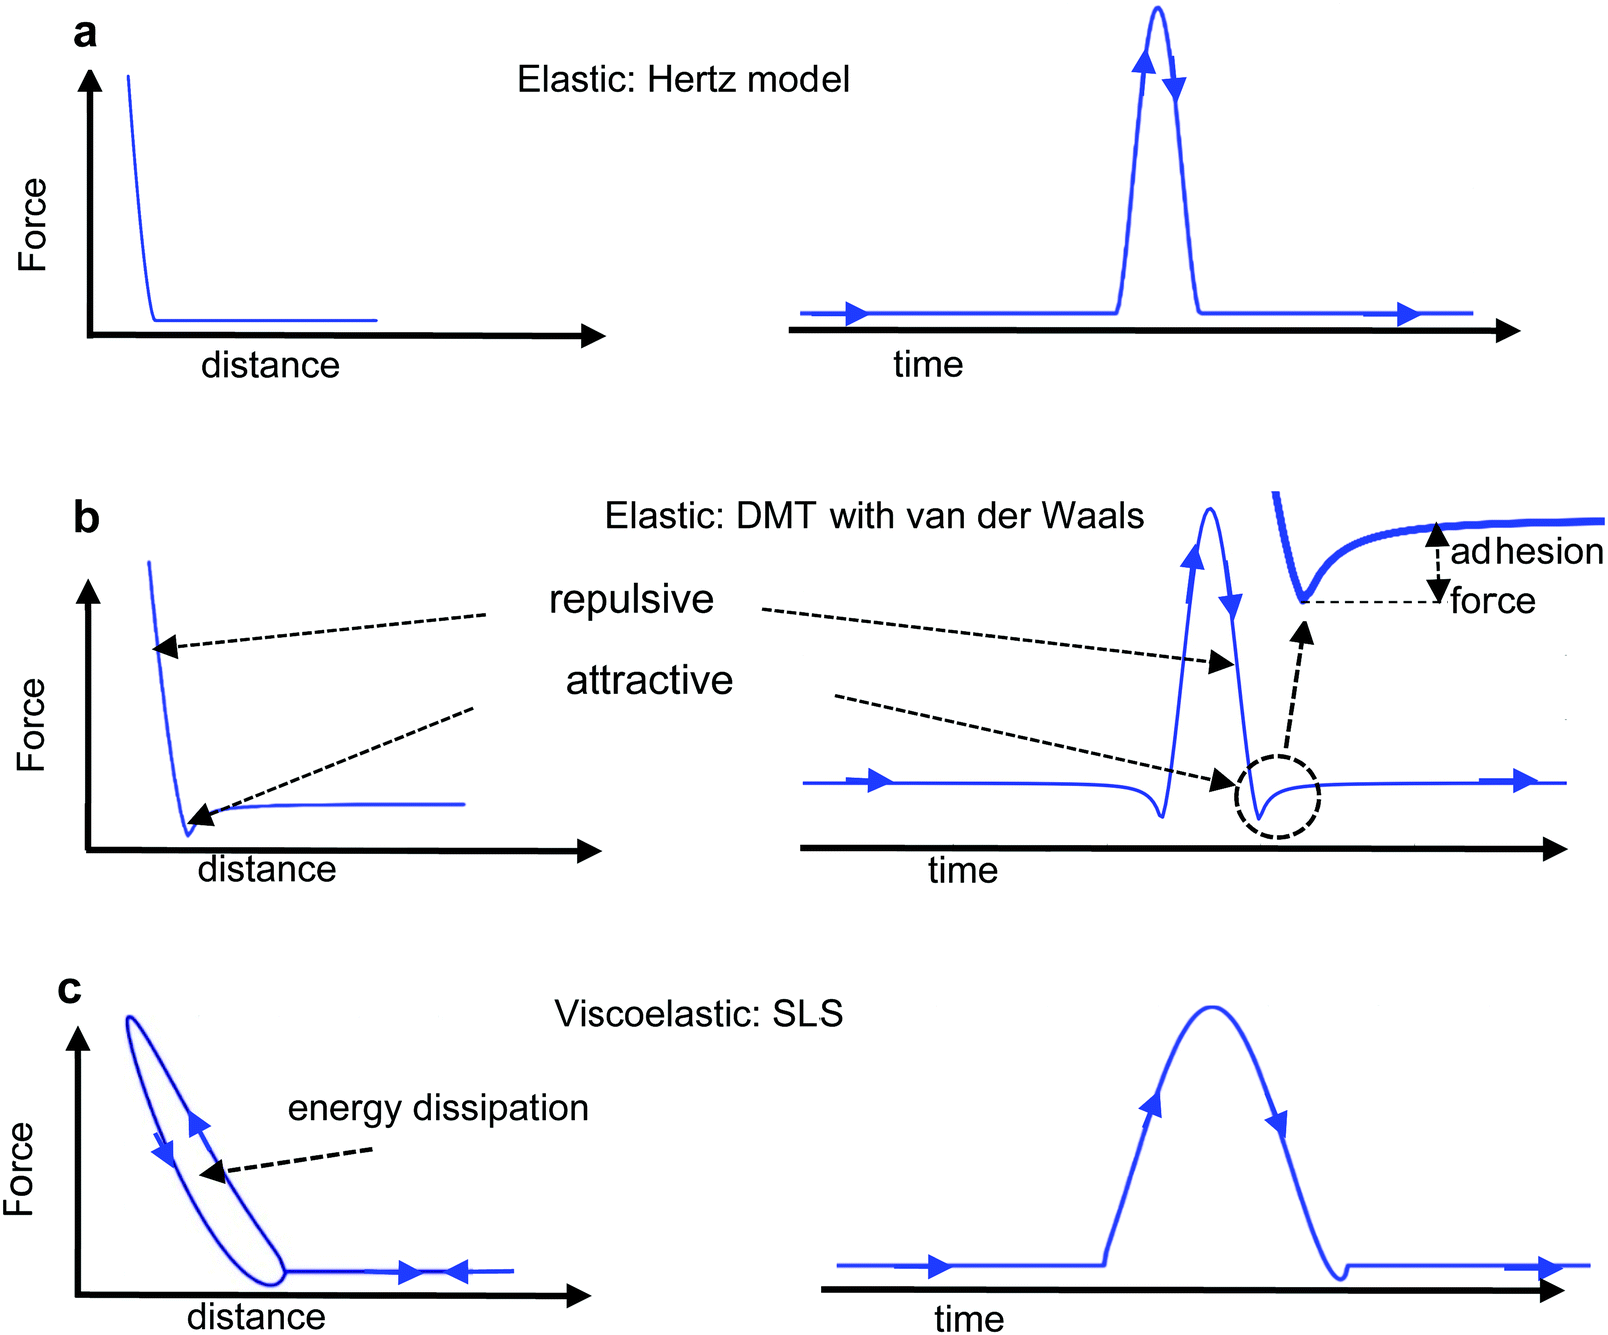 | ||
| Fig. 3 tip–surface interaction forces. (a) Hertz model. The interaction is elastic and the force is repulsive upon contact. (b) DMT model. The interaction is elastic. Upon contact, the long-range van der Waals attractive force gives rise to the adhesion force. (c) SLS viscoelastic model. The interaction force depends on the direction of tip's motion. The interaction forces are shown as function of the distance and time. | ||
In an off-resonance method the deflection is recorded while the tip–surface distance is modulated at a frequency much smaller than the fundamental resonance. The postulate of force spectroscopy27 is applied to transform deflections into forces. The resulting FDC is fitted to a contact mechanics model (see below). Force–volume (FV)4,14,15,18,19 is by far the most common AFM-based force–distance curve method. Force–volume is implemented in most commercial AFMs under different names.28 In the early days, the modulation frequencies were of a few Hz which led to identification of quasi-static and off-resonance methods.
On-resonance methods can also be used to generate force–distance curves.29–31 In this case, the cantilever is excited at its fundamental resonance. A FDC might be determined by measuring and processing the Fourier components of the force while imaging29,30 or by recording amplitude and phase-shift distance curves.31
2.2 Parametric methods
In a parametric method an analytic model relates the observables to some mechanical properties. Parametric methods are associated with the excitation and/or detection of the cantilever deflection at one or several of its resonances and/or a multiple of the fundamental resonance (higher harmonic). Resonances are properties of the mechanical system while an harmonic is an integer multiple of the drive frequency.20 Bimodal AFM20,32 or contact resonance AFM33 are examples of parametric methods.3 Theory of nanomechanical force spectroscopy. Equation of motion
The aim is to introduce the theory or theories that enable the transformation of observables into mechanical properties of a sample. A theory for AFM-based mechanical measurements involves three main steps, the equation of motion, the model for the interaction force and the solution of the equation of motion for a given model. Fig. 4 schematizes some tip–sample interfaces.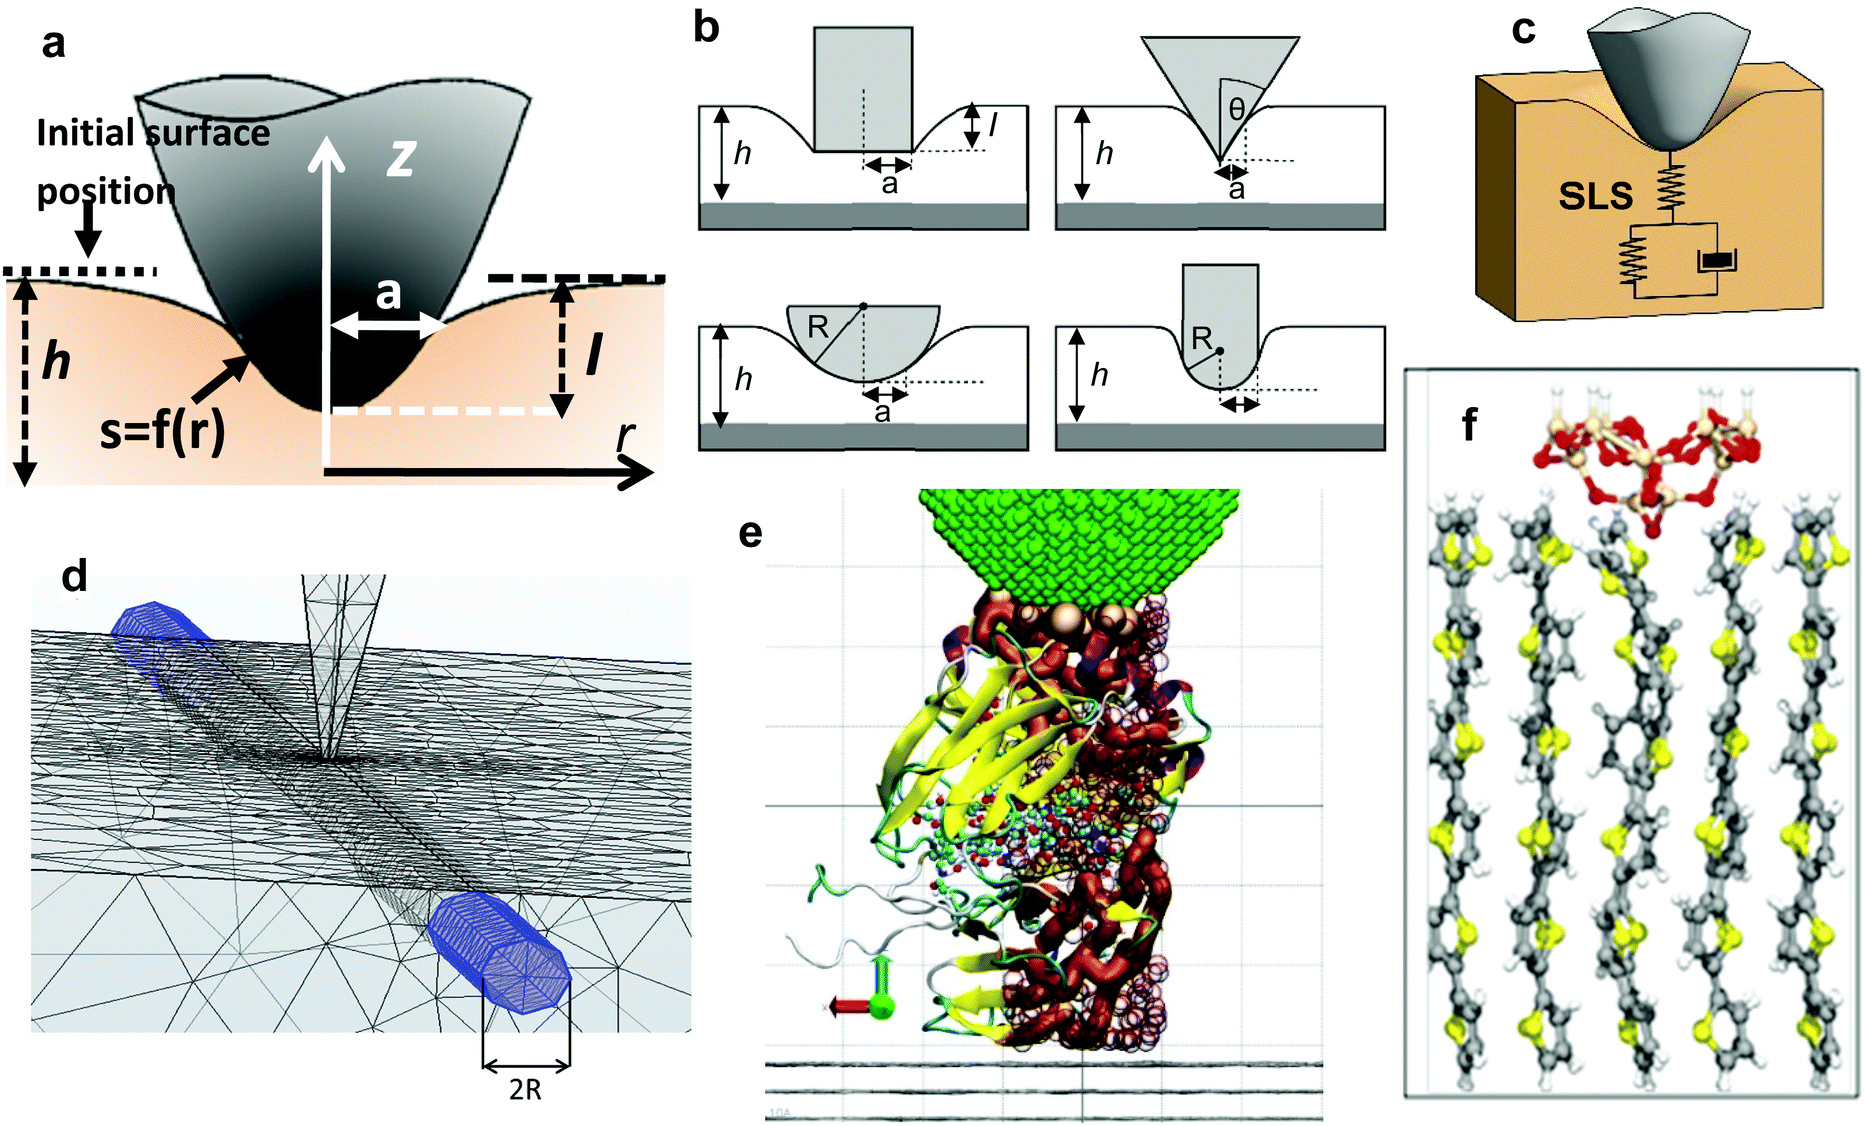 | ||
| Fig. 4 Models and simulations of tip-soft material interfaces. (a) Definition of the main interfacial parameters; a is the radius of the projected contact area; h is the sample thickness; r is the radial coordinate; f(r) is the shape of the contact. (b) Axisymmetric tip geometries. From left to right and top to bottom, cylinder, cone, sphere and nanowire. (c) Scheme of a tip-linear viscoelastic material (SLS) interface. (d) FEM simulation of the deformation of a fiber embedded in a soft matrix. Adapted with permission from ref. 67. Copyright 2019 American Chemical Society. (e) MD simulation of the deformation of an IgG antibody domain by a carbon nanotube tip. Image provided by R. Perez and J. G. Vilhena. (f) Ab initio MD simulations of the deformation induced on a sexithiophene chain by a silica tip. The force produces the bending of the head molecular groups and its transmission through the whole chain. Color code for atoms: oxygen (red), sulphur (yellow), carbon (grey), hydrogen (white) and silicon (light brown). Reprinted with permission from ref. 78. Copyright 2009 Institute of Physics. | ||
3.1 Equation of motion
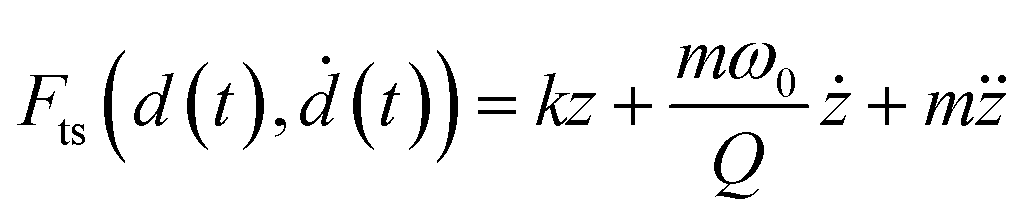
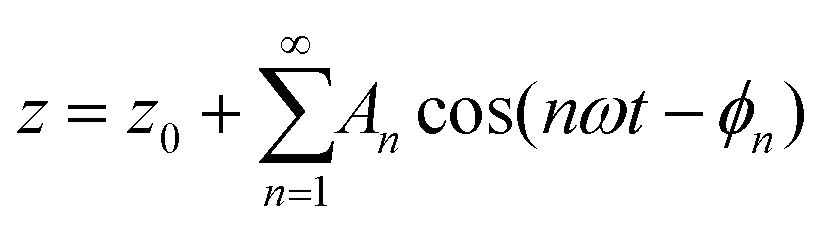
A nanomechanical force spectroscopy measurement involves the relative displacement of the tip with respect to the sample surface. The motion of a cantilever-tip system is based on the Euler–Bernoulli equation for a continuous and three-dimensional beam.31,34–36 If the tip is attached at the free end of the cantilever and the interaction force acts on the tip, the Euler–Bernoulli equation can be approximated by the Newton equation for a point-mass system.35 Unless otherwise stated, the tip's displacement, oscillation or deflection refers to the one of the cantilever-tip system.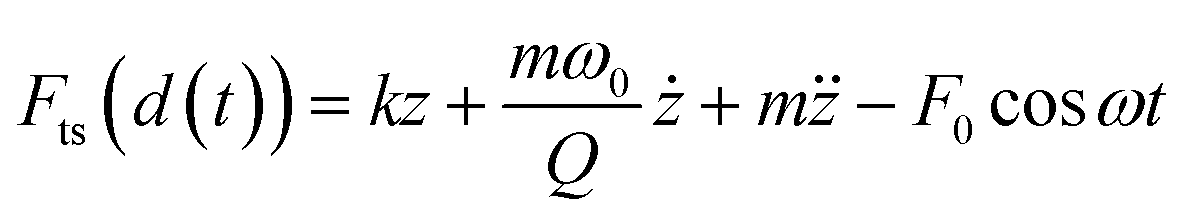 | (1) |
z = z0 + A![[thin space (1/6-em)]](https://www.rsc.org/images/entities/char_2009.gif) cos(ωt − ϕ) cos(ωt − ϕ) | (2) |
 | (3) |
| d(t) = zc + z(t) + Amg(ωmt) | (4) |
4. Theory of nanomechanical force spectroscopy: contact mechanics models
The mechanical properties measured by an AFM are usually explained in terms of continuum mechanics models (Fig. 4a and b). In general, the interaction force has conservative or elastic Fcon and non-conservative or inelastic Fdis contributions.39 The total work involved in the deformation of a material can be separated into the energy stored elastically in the deformation of the material and the energy dissipated as heat through viscous losses or surface adhesion hysteresis. Then, as a first approximation the force can be decomposed into39,40| Fts = Fcon + Fdis | (5) |
4.1 Elastic tip–sample deformations
To determine the deformation produced by an elastic tip on an elastic sample the first is to establish the constitutive equation between the stress and the strain. For a linear, homogenous and isotropic elastic material, the stress–strain equation is given by41–43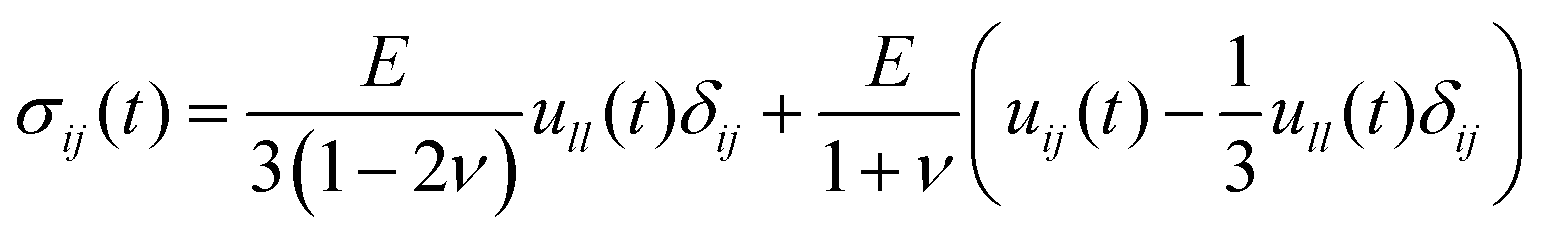 | (6) |
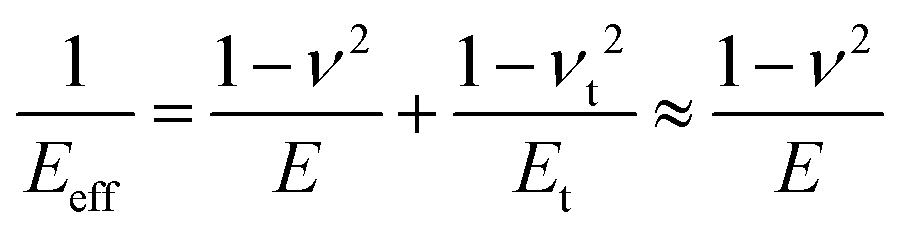
For a tip–sample interface is common to introduce the effective elastic modulus (also called reduced elastic modulus) Eeff.
 | (7) |
To apply eqn (6) to AFM data requires to introduce a set of boundary conditions about the geometry of the interface and the spatial components of the stress. For example, the contact region between the tip and the sample must coincide with the shape of the tip (Fig. 4a). However, it is beyond the scope of this review to introduce the relevant boundary conditions and their mathematical implications. That information can be found elsewhere.44 The boundary conditions enable to transform the stress–strain constitutive equation into a force–indentation integral that only involves the vertical component of the stress. Some analytical solutions of this integral were developed by Hertz and Boussinesq in the late XIX century,43,45 this is, well before the AFM was invented. The formalism developed by Sneddon46 is valid for any axisymmetric tip acting on a semi-infinite elastic material, in particular, for a flat cylinder, a cone and a paraboloid of revolution. The latter solution converges to Hertz model for a half-sphere.43,46
Sneddon's results can be formulated into a compact expression of the force as a function of the indentation I for any axisymmetric tip
| Fts(I) = αEIβ | (8) |
Sneddon theory implies several assumptions. Namely, (1) the deformation in is the elastic regime; (2) the deformation is small with respect to the radius of the projected contact area; (3) the force is applied perpendicular to the surface, this is, there are not shear forces. and (4) the sample is semi-infinite.
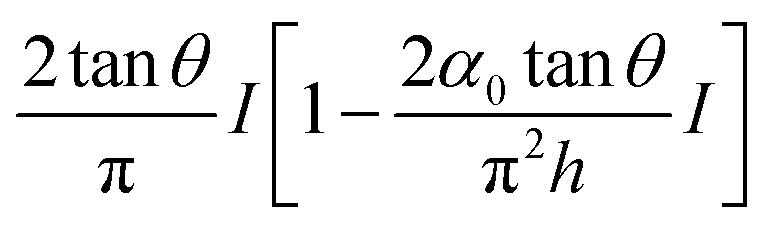
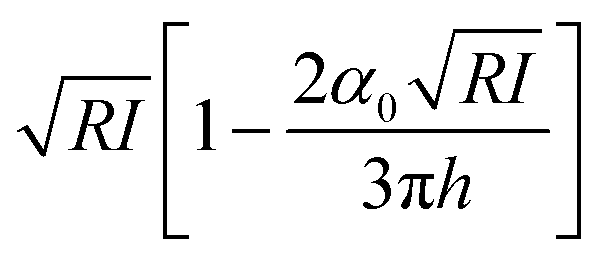
Tables 1 and 2 show, respectively, the coefficients needed to calculate the force as a function of the indentation and the contact radius for the tip–sample geometries shown in Fig. 4b. The contact radius is calculated for semi-infinite and a layer of thickness h (see Section 5). In Table 2 the coefficient α0 = −1.7795 is obtained for a layer which is fixed to a rigid support. Table 3 shows the definitions of the most common quantities in nanomechanical mapping.
| Tip's geometry | α | β |
|---|---|---|
| Cylinder |
|
1 |
| Cone |
|
2 |
| Half-sphere |
|
1.5 |
| Tip's geometry | Contact radius (semi-infinite system) | Contact radius (layer of thickness h) |
|---|---|---|
| Cylinder of radius R | R | R |
| Cone (half-angle θ) |
|
|
| Half-sphere of radius R |
|
 . . |
| Material property | Symbol | Definition |
|---|---|---|
| Young's or elastic or stretch modulus | E | Elastic quantity. Proportional factor between the stress (force per unit of area) and the strain (change of length per unit of length) in an uniaxial deformation. |
| Shear or torsional modulus | G | Elastic quantity. Proportional factor between the shear stress and shear strain. |
| Poisson's ratio | ν | Elastic quantity. Ratio between lateral and longitudinal deformations. |
| Relationship between elastic quantities | E = 2G (1 + ν) | |
| Interfacial stiffness | Elastic quantity. Slope of a force–distance curve. It is a pseudo material property because it depends on the geometry. | |
| Complex modulus | E* = E′ + iE′′ | Viscolastic quantity. |
| Storage modulus | E′ | Viscoelastic quantity. Real component of the complex modulus. It is proportional to the average energy stored per unit of volume of the material during a cycle of deformation. |
| Loss modulus | E′′ | Viscoelastic quantity. Imaginary component of the complex modulus. It is proportional to the energy dissipated per unit of volume of the material during a cycle of deformation. |
| Loss tangent | tanϕ |
Ratio between the loss and storage moduli. |
| Viscosity coefficient | η | Proportional factor between the shear stress and the velocity of shear. |
4.2 Inelastic tip–surface deformations
An inelastic deformation is associated with a non-conservative interaction. In AFM, a non-conservative force implies with some loss of the tip's energy.39 Non-conservative interactions are generated by a variety of processes that might depend on the material properties, the tip and/or the environment. For example, non-conservative interactions are involved in force-induced atomic or molecular reorientations, rupture of ligand-receptor bonds, interdigitation, the formation of a liquid more generally, in any exchange of atoms and molecules between the tip and the sample surface.Four processes either acting individually or simultaneously dominate the non-conservative interactions measured in a tip-soft material interface: velocity dependent processes and viscoelasticity, rupture of molecular bonds, surface adhesion hysteresis and mass exchange between tip and sample.
Some of the tip's energy is also lost by displacement of the surrounding fluid (air, gas or liquid) during the tip's motion. This gives rise an extended hydrodynamic damping process which is proportional to the velocity and scales with the inverse of the quality factor. Each mode has a distinctive spatial shape; therefore, the hydrodynamic damping depends on the mode.20 This process is unrelated to the sample's mechanical properties. Nonetheless, it must be taken into account to balance the total energy in an oscillation cycle.31
The development of a viscoelastic description of the response of a material based on AFM data can be divided in two main steps. First, it requires a viscoelastic model. This can be achieved either by using mechanical-equivalents or analogues based on a combination of spring and dashpots elements (Fig. 4c) or by using continuum mechanics theories. The second step requires the determination of the interaction force from the observables.
The viscoelastic correspondence principle48 simplifies the theoretical effort of expressing the tensorial stress–strain equation of a viscoelastic material into an equation of the force as a function of the indentation. This principle transforms the elastic parameters into relaxation functions. It can be shown that for an incompressible material (ν = 0.5) the force is49
 | (9) |
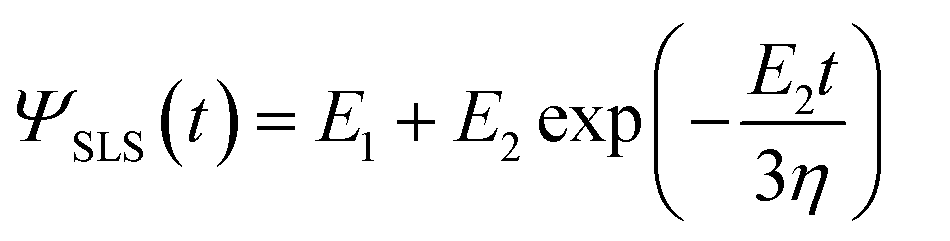
| ΨKV(t) = E + 3ηδ(t) | (10) |
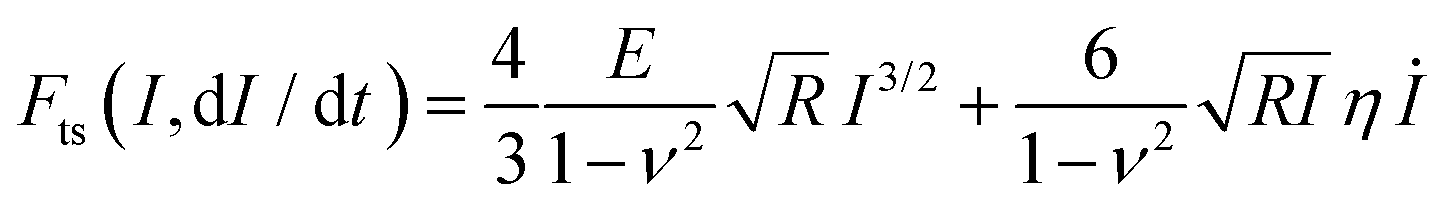
The application of the KV model to AFM requires introducing the geometry of the tip and an estimation of the contact area. This has been accomplished by using Hertz contact mechanics. This is the basis of the 3D-KV model, which is obtained by solving en 9 with the relaxation function (eqn (10)), then49
| F(I,t) = αI(t)β−1[EI(t) + 3βηİ(t)] | (11) |
 | (12) |
 | (13) |
 | (14) |
For a conical tip of half-angle θ and a tip's displacement modulated by a waveform, it is deduced52
 | (15) |
 | (16) |
4.3 Relationship between deflection, distance and indentation
The above analytical equations express the force as a function of the indentation (deformation) produced by the tip. However, the main AFM observable is the tip's deflection. Therefore, some additional eqns are needed to transform the deflection into instantaneous tip–sample distances and indentations. The indentation is defined as| I = −d(t) for d ≤ 0 | (17) |
| d(t) = zc + z(t) + Acos(ωt − ϕ) | (18) |
4.4 Simulations
Analytical solutions of the integral equation eqn (9) are available for a few combinations of viscoelastic models, distance modulation waveforms and tip geometries. This limitation has motivated the introduction of the computational methods to describe in a self-consistent manner the tip–sample viscoelastic interactions and the associated deformations.55,56Computational solutions enable to explore the dynamic behaviour of complex models. This task is helped by the existence of two numerical codes dForce57 and VEDA58 that enable to simulate the response of a dynamic AFM for a variety of sample models. Numerical simulations have been applied to determine the force based on a SLS response and to compare it with experiments performed with an amplitude modulation AFM on elastomers and polycarbonate samples.56
In a FEM simulation, the tip–sample interface is discretized in mesh units (Fig. 4d). The accuracy of the simulations depends on the number of mesh units. Ideally, for a high-spatial resolution mechanical measurement small mesh units of 1–2 nm in length should be used. In addition, the tip radius must be several times larger than the maximum indentation to avoid convergence problems. FEM simulations were used to understand AFM experiments performed on cells60–67 and to describe the elastic response of a virus.68,69
In the context of nanomechanical force spectroscopy, MD simulations are helpful to address three relevant aspects. First, to explain the mechanical response of a biomolecule under the deformation exerted by the tip (Fig. 4e and f).76,77 Second, to understand the intramolecular mechanisms of energy dissipation.78 Finally, to assess the capability of AFM to distinguish between the mechanical response of the different domains or subunits of a protein.
It should be noted that the time-scales of MD simulations (0.1–10 ns) and AFM experiments (0.1–100 ms) are still separated by a few orders of magnitude. This gap might set some limitations in the comparisons between measurements and MD simulations.
5 Theory of nanomechanical force spectroscopy: living cells
Living cells, in particular, eukaryotic cells pose some challenges to the imaging and mapping capabilities of a force microscope. Currently, the best images of eukaryotic cells obtained by AFM have a spatial resolution in the 100 nm range.11,67,79–81 Those values are modest if they are compared with the spatial resolution achieved on other biological systems such proteins (∼1 nm)24 or protein fibers.82 Mapping with accuracy the elastic modulus of a cell is also challenging because several factors contribute to the error in the measurement.44,83 To address and eventually overcome those issues requires understanding the role of the main factors that control the imaging and mapping of the cell's mechanical properties.5.1 Softness, viscoelasticity, finite-thickness and incompressibility
Living eukaryotic cells are among the softest materials on earth. Some mammalian cells show an elastic modulus value below 1 kPa range.84,85 In general, an eukaryotic cell is about 4 orders the magnitude softer than a single protein (∼50 MPa),24 six orders of magnitude softer than polystyrene (∼2 GPa)86 and about eight orders magnitude softer than silicon (∼150 GPa).87 Under the same applied force (say 300 pN), the best AFM image of a eukaryotic cell has a spatial resolution of about 100 nm, this is, about 3 orders of magnitude worse than the one obtained on a rigid crystalline surface (∼0.1 nm).An eukaryotic cell might be considered as a solid system made by plasma membrane that encloses a variety of solid elements such as single proteins, molecular motors, protein filaments, DNA, organelles and a nucleus immersed in an aqueous solution. A moving solid element in a liquid involves viscoelastic interactions. Viscoelasticity is an intrinsic feature of the mechanical response of a cell,51,84,88,89 therefore AFM-based measurements should always be described in terms of viscoelastic models.49,52,90–97
A single cell is a heterogeneous, anisotropic and finite-thickness material (Fig. 5a and b). Currently, there is not a well-accepted contact mechanics model that captures the structural complexity of an eukaryotic cell.84 In addition, the theory to explain how the cell's mechanical properties influence the cantilever's deflection and the tip's indentation is just emerging.52,93,96
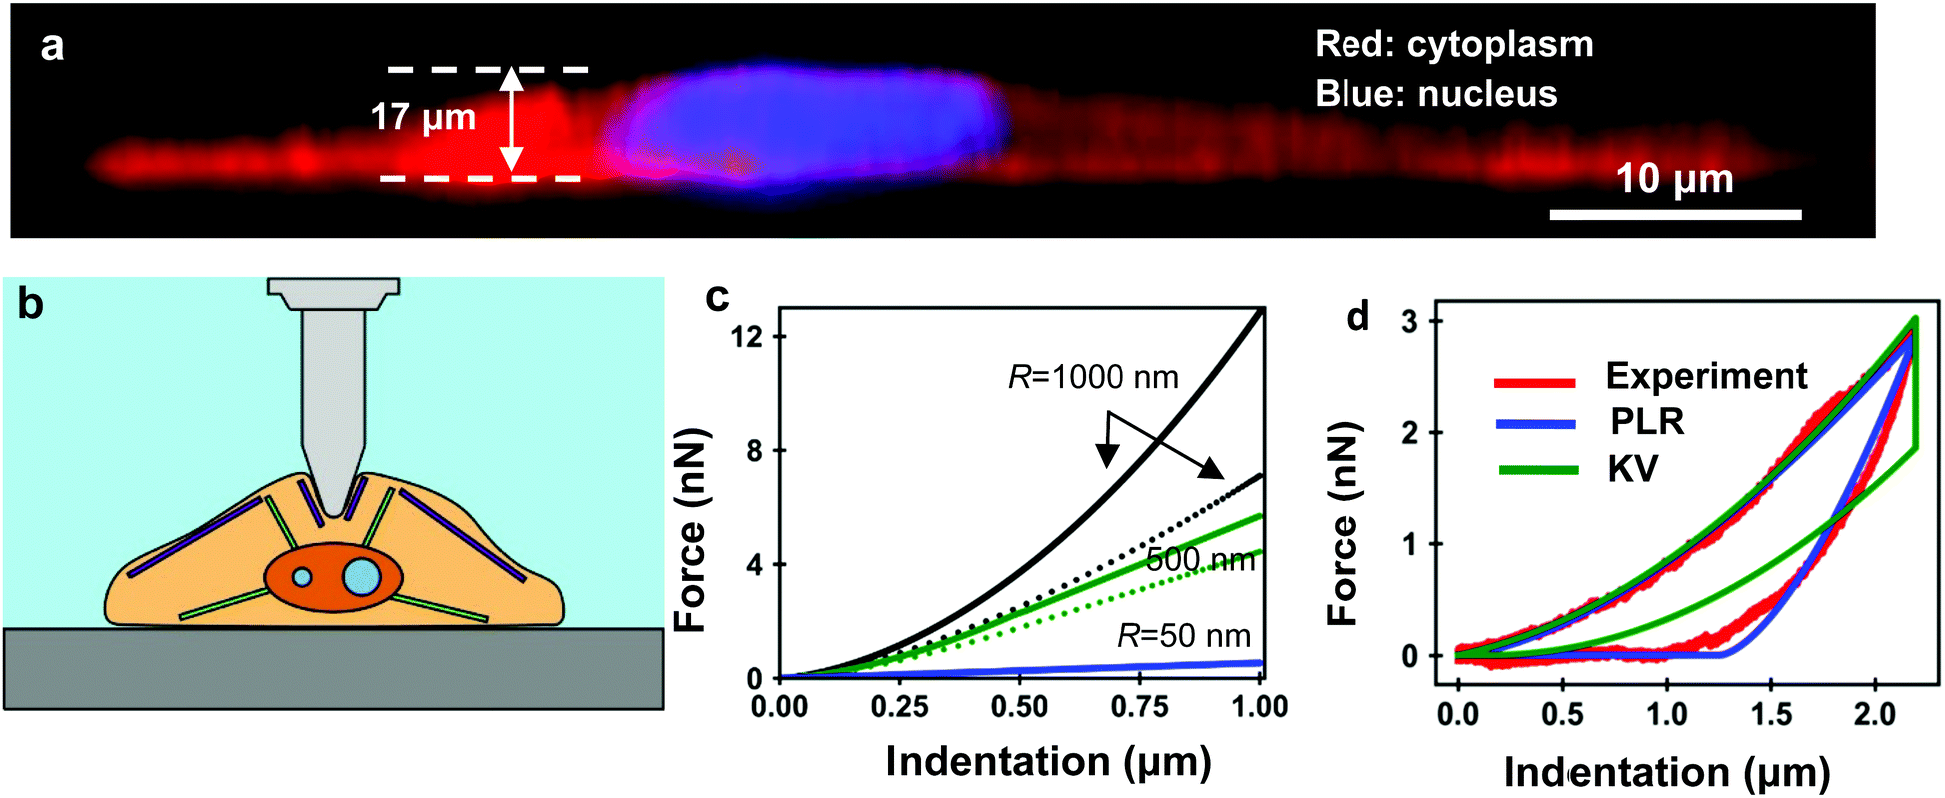 | ||
| Fig. 5 (a) Optical microscope side-view of a cardiomyocyte cultured on a Petri dish. The red signal comes from the fluorophores attached to actin fibers while the blue signal comes from the fluorophores inside the nucleus. Image provided by C. Marquez-Lopez and J. A. Bernal. (b) Scheme of a living cell-tip interface in a liquid environment. The cell thickness depends on the lateral position. (c) Force–indentation curve for nanowires of different R. The discontinuous lines show the force curves produced by the same probe on a semi-infinite sample. For R = 50 nm, the force curves given by the semi-infinite model and the bottom effect elastic theory are nearly identical. Layer, E = 4 kPa, h = 2.5 μm; semi-infinite material E = 4 kPa. Adapted with permission from 44. Copyright 2018 Elsevier. (d) Experimental (red) and theoretical force–distance curves (blue and green) obtained on a living NIH 3T3 fibroblasts. Reprinted with permission from ref. 52. Copyright 2020 Royal Society of Chemistry. | ||
Modeling the mechanical response of a cell is greatly simplified by considering that cells are incompressible (ν = 0.5) and are locally isotropic. The first assumption is supported by the mass densities of HeLa cells and fibroblasts which are, respectively, 1.08 and 1.14 g cm−3. Those values are close to the water mass density (1 g cm−3). The mass of the above cells was obtained from micromechanical resonator experiments.98 The second assumption implies that the cell membrane and cytoskeleton deform axisymmetrically when indented by axisymmetric tips. To what extent this assumption captures the local properties measured by AFM experiments is currently under debate.11,66 The heterogeneity of a cell is captured by considering it as a layered system (membrane, cortex, cytoplasm and nucleus). This approximation simplifies and facilitates FEM simulations.60,66,67
5.2 Bottom-effect correction for an elastic and fine-thickness layer
The softness, finite thickness and incompressibility of an adherent cell imply that the force exerted by the tip on the cell is influenced by the stiffness of the solid support. This effect is unavoidable. It implies that any compressive force measurement on an adherent cell bears the influence of the solid support (Fig. 5c). This observation makes semi-infinite contact mechanics models such as Sneddon or Hertz unsuitable to describe quantitatively the forces, deformations and mechanical properties of a cell.Bottom-effect correction theories aim to determine the true Young's modulus of a very soft material deposited on a rigid support from a force–distance curve.44,65,99 Those theories for elastic and finite-thickness materials are firmly established. They have been validated by finite element model simulations.44,65 In addition, FEM simulations show the need of using bottom-effect corrections. Some simulations showed that the elastic modulus value deduced by fitting a FDC curve to a semi-infinite model could be off by a factor 2 to 10 from the expected value.44
Chadwick and co-workers proposed the first bottom-effect correction expression for the force exerted by a spherical probe on a finite-thickness elastic layer.99 A more general theory that is valid for any axisymmetric tip was developed by Garcia and Garcia.44 Ros and co-workers have extended the bottom-effect correction for the case of cells deposited on a soft matrix.65
The force exerted by an axisymmetric probe on an elastic and finite-thickness layer deposited on rigid support can be expressed as a sum of the force exerted on a semi-infinite system with the same elastic parameters than the layer and a correction term that accounts for the finite-thickness the is given by44
| F = Fsemi-infinite + Fcorrection | (19) |
 | (20) |
Fig. 5c shows the competition between the bottom effect, the indentation and the contact area for the force exerted by a nanowire tip on a soft elastic layer (E = 4 kPa; h = 2.5 μm) deposited on a rigid support.44 To visualize the bottom effect contribution we have calculated the force exerted by the same probe on a semi-infinite sample (discontinuous curves). The bottom effect plays a major factor in the determination of the force whenever the contact radius and sample thickness are within the same order of magnitude. The implication for cell nanomechanics is that the use of sharp and high-aspect ratio probes significantly reduces the influence of the solid support in the determination of the force. This result might be counter-intuitive. It challenges some earlier recommendations to perform elastic modulus measurements on cells.64,83 An earlier bottom-effect correction for the force exerted by a conical tip on an elastic material100 does neither agree with eqn (20) nor with FEM simulations.44,65
It has been proposed that the surface tension of cells could explain the apparent increase of the elastic modulus of an adherent cell.101 This hypothesis is not supported by experimental data. It is also in conflict with the bottom-effect theory introduced above and FEM simulations.44,65
5.3 Bottom-effect correction for a viscoelastic and fine-thickness layer
An eukaryotic cells is a finite-thickness viscoelastic material. Therefore, bottom-effect elastic corrections introduced in the previous section sever as the starting expressions to develop their viscoelastic counterparts. A viscoelastic response introduces a dependence on the deformation history. In other words, the contact area for the same deformation will depend on whether the tip is approaching or withdrawing from the sample surface.Analytical bottom-effect viscoelastic corrections have been deduced for some viscoelastic models.52 The theoretical approach combines bottom-effect elastic corrections,44 the correspondence principle between elastic and viscoelastic deformations,48 and Ting's method to determine the force as a function of the deformation history.102
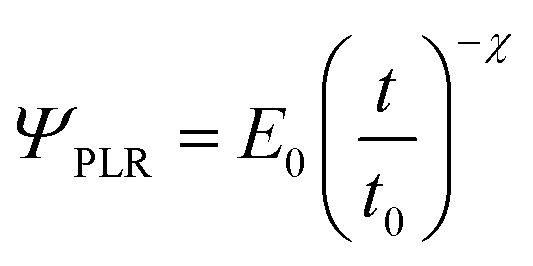
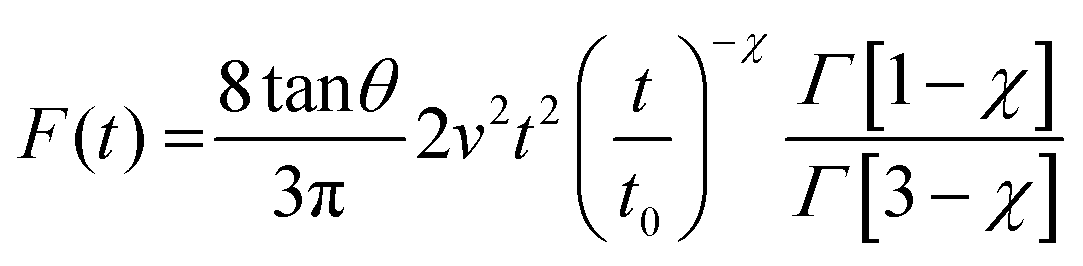
In particular, for a power-law rheology model,52 the force for the tip approaching towards the cell is given by (Fig. 5c),
 | (21) |
6. Force–volume
Force–volume (FV) is widely used to measure mechanical properties at the nanoscale. It is a feature included in the applications modules of many commercial AFMs.28 A force–volume map combines a topographic image of the surface with the acquisition of one (or several) force–distance curves on each point (pixel) of the surface (Fig. 6a). FV has experienced significant changes in the last few years, however, some of the features enunciated by Hasnma and co-workers14,15 about 25 years ago and later conceptualized by the schemes provided by Heinz and Hoh4 remain unchanged.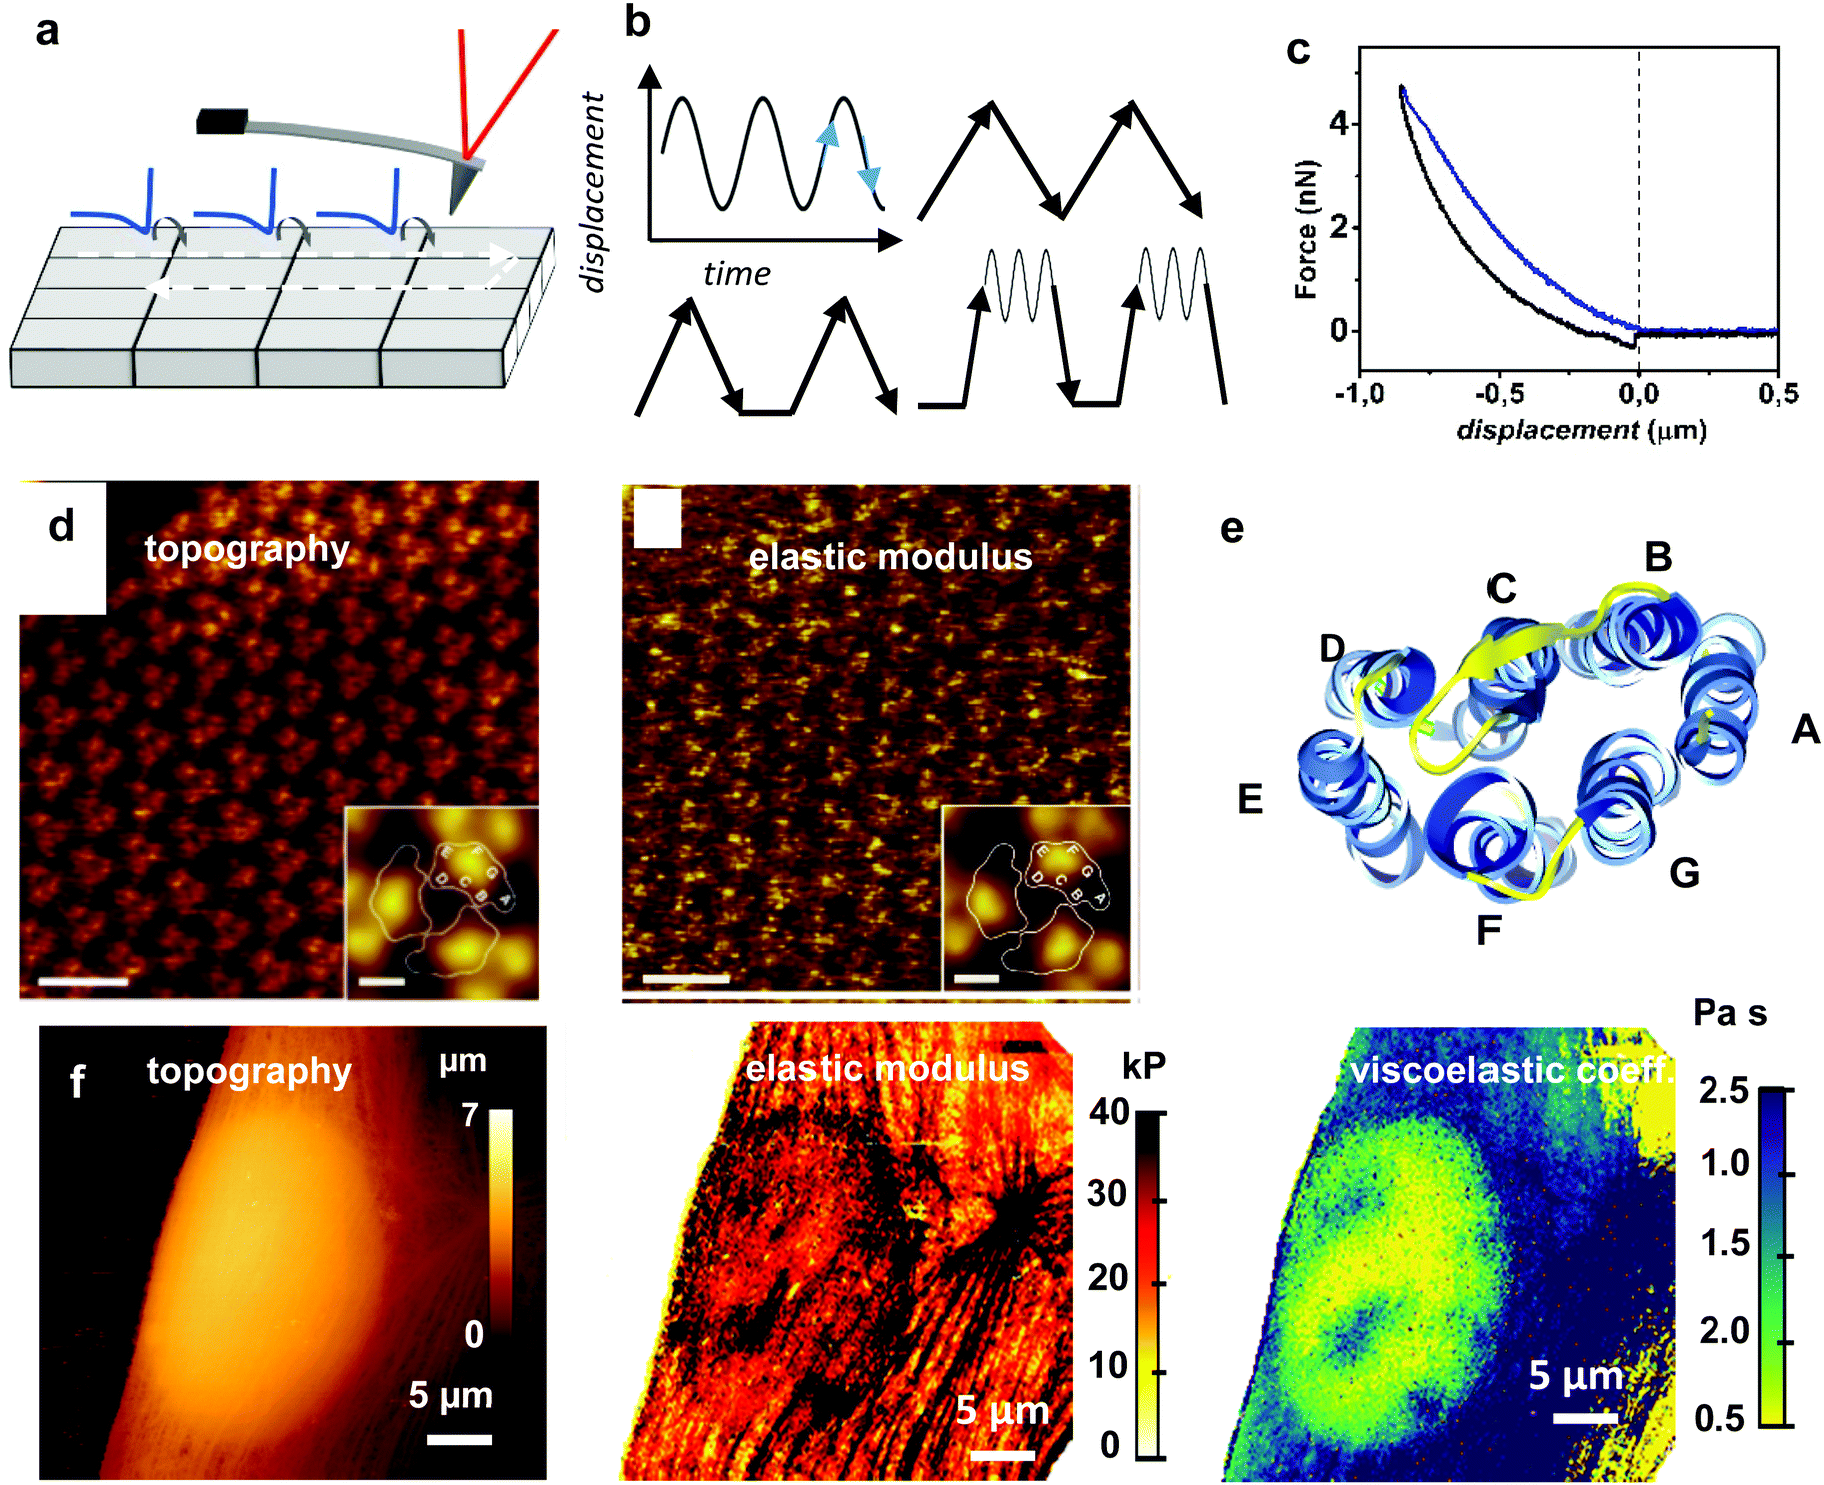 | ||
| Fig. 6 Force–volume. (a) Scheme of FV mapping. (b) Different waveforms might be used to modulate the tip–sample displacement. The most common are the sinusoidal and the triangular. Some waveforms might include dwell times or pre-loading steps. (c) FDC obtained on a fibroblast cell. (d) From left to right, topography and elastic modulus of the cytoplasmic purple membrane side obtained by using a peak force of 75 pN. Insets show three-fold symmetrized averages of the bacteriodophsin (BR) trimer. Scale bar 10 nm. Inset, scale bar 2 nm. Reprinted with permission from ref. 111. Copyright 2011 John Wiley and Sons. (e) BR protein. The seven transmembrane α-helices A–G are indicated. Protein data bank code 2at9. (f) Topography, elastic and viscosity coefficient maps of a fibroblast cell. The Young's modulus map provide high-spatial resolution details of the outer cell structures such as the actin cross-linked networks (cortex) and the stress fibers. The viscosity coefficient map detects the presence of intracellular and subsurface structures (nucleoli). Reprinted with permission from ref. 67. Copyright 2011 American Chemical Society. | ||
The first implementations of force–volume used a triangular waveform to modulate the tip–surface distance.14 Triangular waveforms are still very common because they offer a straightforward relation between distance and time (d = vt). However, they might introduce some side-effects. First, a triangular waveform contains a large number of higher harmonics. Higher harmonics could be coupled to some of the mechanical resonances of the AFM. This coupling might complicate the interpretation of the data. Second, the velocity has a discontinuity at the turning point which might introduce some artefacts at moderate or high frequencies. Those issues motivated the introduction of sinusoidal waveforms.103–106
Two recent developments enhanced the application capabilities of force–volume. First, the determination of rheological properties by processing spatially-resolved FDCs67,107,108 is poised to have a significant impact in the determination of viscoelastic properties at the nanoscale. Second, the use of biofunctionalized tips has opened new applications in mechanobiology and sensing.109,110
6.1 Force–volume methodology
Force–volume is an off-resonance AFM method. It provides arrays of spatially-resolved FDCs (Fig. 6a). A force–distance curve is acquired by recording the cantilever deflection as a function of the relative tip–surface distance. Initially, the tip and the sample surface are far apart which implies that the interaction force is negligible. Then, the tip (surface) is continuously displaced towards the surface (tip) until the force reaches a pre-fixed value.A force–distance curve includes two sections, approach and retraction (Fig. 6b). Each section includes regions dominated by long-range attractive and regions dominated by short-range repulsive forces (Fig. 3b). The approach and retraction sections of the FDC might not coincide (force hysteresis). In fact, the presence of hysteresis in a FDCs is very common. Force–distance curve hysteresis implies energy dissipation. In a region where tip and sample are in contact, and in the absence of mass exchange between tip and surface, viscoelastic processes in the sample dominate the observed hysteresis in FDCs. Out of a contact region, the hysteresis is dominated by changes in the adhesion force, approaching versus retraction. Those changes might be associated with the presence of either specific (ligand-receptor bonds) or unspecific interactions.
Different types of waveforms can be used to modulate the tip–surface separation (sinusoidal, triangular or a combination of both) (Fig. 6c). To improve the signal-to-noise ratio, the FDC associated with a pixel might be the result of averaging several FDCs taken on the same point of the surface.
The transformation of cantilever deflections into interaction force values is performed by applying the postulate of force spectroscopy. This postulate establishes that the interaction force coincides with the cantilever deflection z(t) times the cantilever static force constant k
| Fts(t) = kz(t) | (22) |
6.2 The force–volume family
Force–volume is implemented in the hardware and software of many commercial AFMs. Improvements in signal processing, closed-loops, software, data analysis and the addition of new parameters have led to a variety of denominations.28 The first commercial FV configuration that incorporated a sinusoidal waveform became very popular.106 It presented some advantages in the realization and/or interpretation of some experiments. However, neither eqn (3) nor the scheme shown in Fig. 6a was modified by using a sinusoidal waveform.In emerging fields or applications, it is not uncommon to develop near simultaneously the same experimental method by different groups. This process might generate a variety of names for the same method. For example, nanorheological AFM107 or dynamic scanning indentation108 describe similar FV configurations (see below). The use of chemically or biofunctionalized tips112,113 has led to several denominations, the oldest is chemical force microscopy114,115 and the newest are FD-based AFM or multiparametric AFM imaging.116
The combination of FV and single-molecule force spectroscopy2,117 might lead to a new nanomechanical force spectroscopy method. Initial experimental results were promising118,119 but they involved a very small region of the sample mapped by FV. It is not straightforward to envision how the requirements of single-molecule force spectroscopy, namely, the acquisition of multiple FDCs at different loading rates120 on the same position of the sample might be compatible with a fast acquisition of FV maps.
6.3 The postulate of force spectroscopy
Force–volume and AFM-based single-molecule force spectroscopy measurements are based on Hooke's law. Hooke's law establishes that the interaction force coincides with the cantilever deflection times its force constant (eqn (22)). Strictly speaking, Hooke's law is only valid for a static deflection, nonetheless, it was readily accepted by the AFM community4,18 without subjecting it to a rigorous demonstration.The postulate of force spectroscopy was based on an empirical observation. In the 90's, force–distance curves were recorded at different modulation frequencies from high to low values. A FDC was considered acceptable if it did not depend on the frequency. This condition is easily met at low frequencies (see below). High-speed AFM6,122–124 has provided technologies to speed up FV measurements. However, performing a FV experiment at high-speeds (say 1 frame per s) requires a rigorous analysis of the transformation of a deflection into a force value.27,125
The equation of motion that describes force–volume (eqn (3)) shows the tip–surface Fts expressed in terms of the cantilever restoring force, an inertial term and a hydrodynamic force associated with the interaction of the cantilever with the fluid. To illustrate explicitly the dependence of the force on the modulation frequency, let's introduce a normalized time variable τ = ωt
 | (23) |
The identification of the tip–surface force with the cantilever restoring force requires to neglect the inertial and the hydrodynamic terms. This approximation is valid for ϖ ≫ 1, this is, when the cantilever's fundamental frequency is much higher than the modulation frequency. In practice, to determine the Young's modulus with a relative error below 10% requires to use a frequency ratio above 50.27 Therefore, to perform force–volume measurements at high-speed rates in liquid (1 frame per s for 104 pixels) might require the use of a cantilever with a fundamental frequency (in liquid) of about 1 MHz.
6.4 Nanoscale rheology
Nanoscale rheology describes the scientific activity and the FV configurations devoted to determine viscoelastic properties from FDCs. The goal is to assign one or several viscoelastic parameters to each pixel of the image. The deduction of viscoelastic parameters from a FDC demands significant theoretical and modelization efforts.49,93–96,126–135 Typical viscoelastic parameters measured in nanoscale rheology are loss and storage moduli, viscosity coefficient or loss tangent. In addition, a nanoscale rheology experiment might involve some changes in the experimental FV set-up.The theory that relates FDCs observables to viscoelastic parameters depends on the type of waveform used to generate the tip–sample displacement (triangular versus sinusoidal). It might also depend on the existence of adhesion forces. For those reasons nanoscale rheology methods are divided in three sub-groups.
An experiment performed by applying an oscillatory force might be decomposed in two steps.140 First, there is a pre-load step. The tip is indented on the cell until a pre-set force is reached. In a second step, a sinusoidal force is applied to the tip. The amplitude of the oscillation is smaller than the indentation depth reached in the first step, so the whole oscillation is performed with the tip indented on the material. Those experiments enabled to determine the storage and loss moduli of a cell as a function of the amplitudes of the force and the indentation.90 The use of large spherical tips prevented high-spatial resolution mapping.
Nanorheology experiments combine the above methods to measure FDCs with the use of sharp tips. In particular, the experiments performed without breaking the tip–sample contact during a FDC cycle are described by the linear viscoelastic theory developed for conventional nanoindentation experiments by Herbert, Pharr and Oliver141
For an axisymmetric tip, the effective storage and loss modulus are obtained by141,142
 | (24) |
 | (25) |
Other approaches. Schäeffer and co-workers performed nanoscale rheology experiments by using triangular waveforms with the addition of some loading and dwell steps.130,143 A FDC was obtained by approaching the tip towards the sample surface at a constant velocity. Upon an initial contact between the tip and the sample surface, the loading force increased until a pre-defined clamp-force was reached. This pre-defined force was kept constant during a dwell time before retracting the tip from the sample.
6.5 Force–volume applications
Force–volume is widely applied to characterize soft materials. Some recent results (2014–2020) are introduced to illustrate the capabilities, achievements and potential of the different FV configurations.7 Nanomechanical maps obtained from force–distance curves: on-resonance methods
Force–distance curves are not directly measured in amplitude modulation AFM because the observables are averages over a period. Therefore, the observables (static deflection, amplitude and phase shift) are determined as a function of an average distance instead of the instantaneous tip–sample distance. To overcome this limitation several theoretical and experimental methods have been proposed.29–31,172–182 Those methods are classified in two groups, time-resolved29,30,172–176 and force reconstruction methods.177–182To understand how a dynamic AFM method transforms the time dependencies of the observables into force–distance curves is pertinent to distinguish between flexural and torsional harmonics.20,30,31,183 An harmonic oscillation vibrates at a frequency that is a multiple of the excitation frequency. In most AFM experiments, the deflection is measured in the plane perpendicular to the sample surface that contains the main axis of the cantilever. This is the flexural deflection (Fig. 7a). The harmonics of this motion are called flexural components. However, if the driving force has both vertical and lateral components, the deflection might have torsional components.
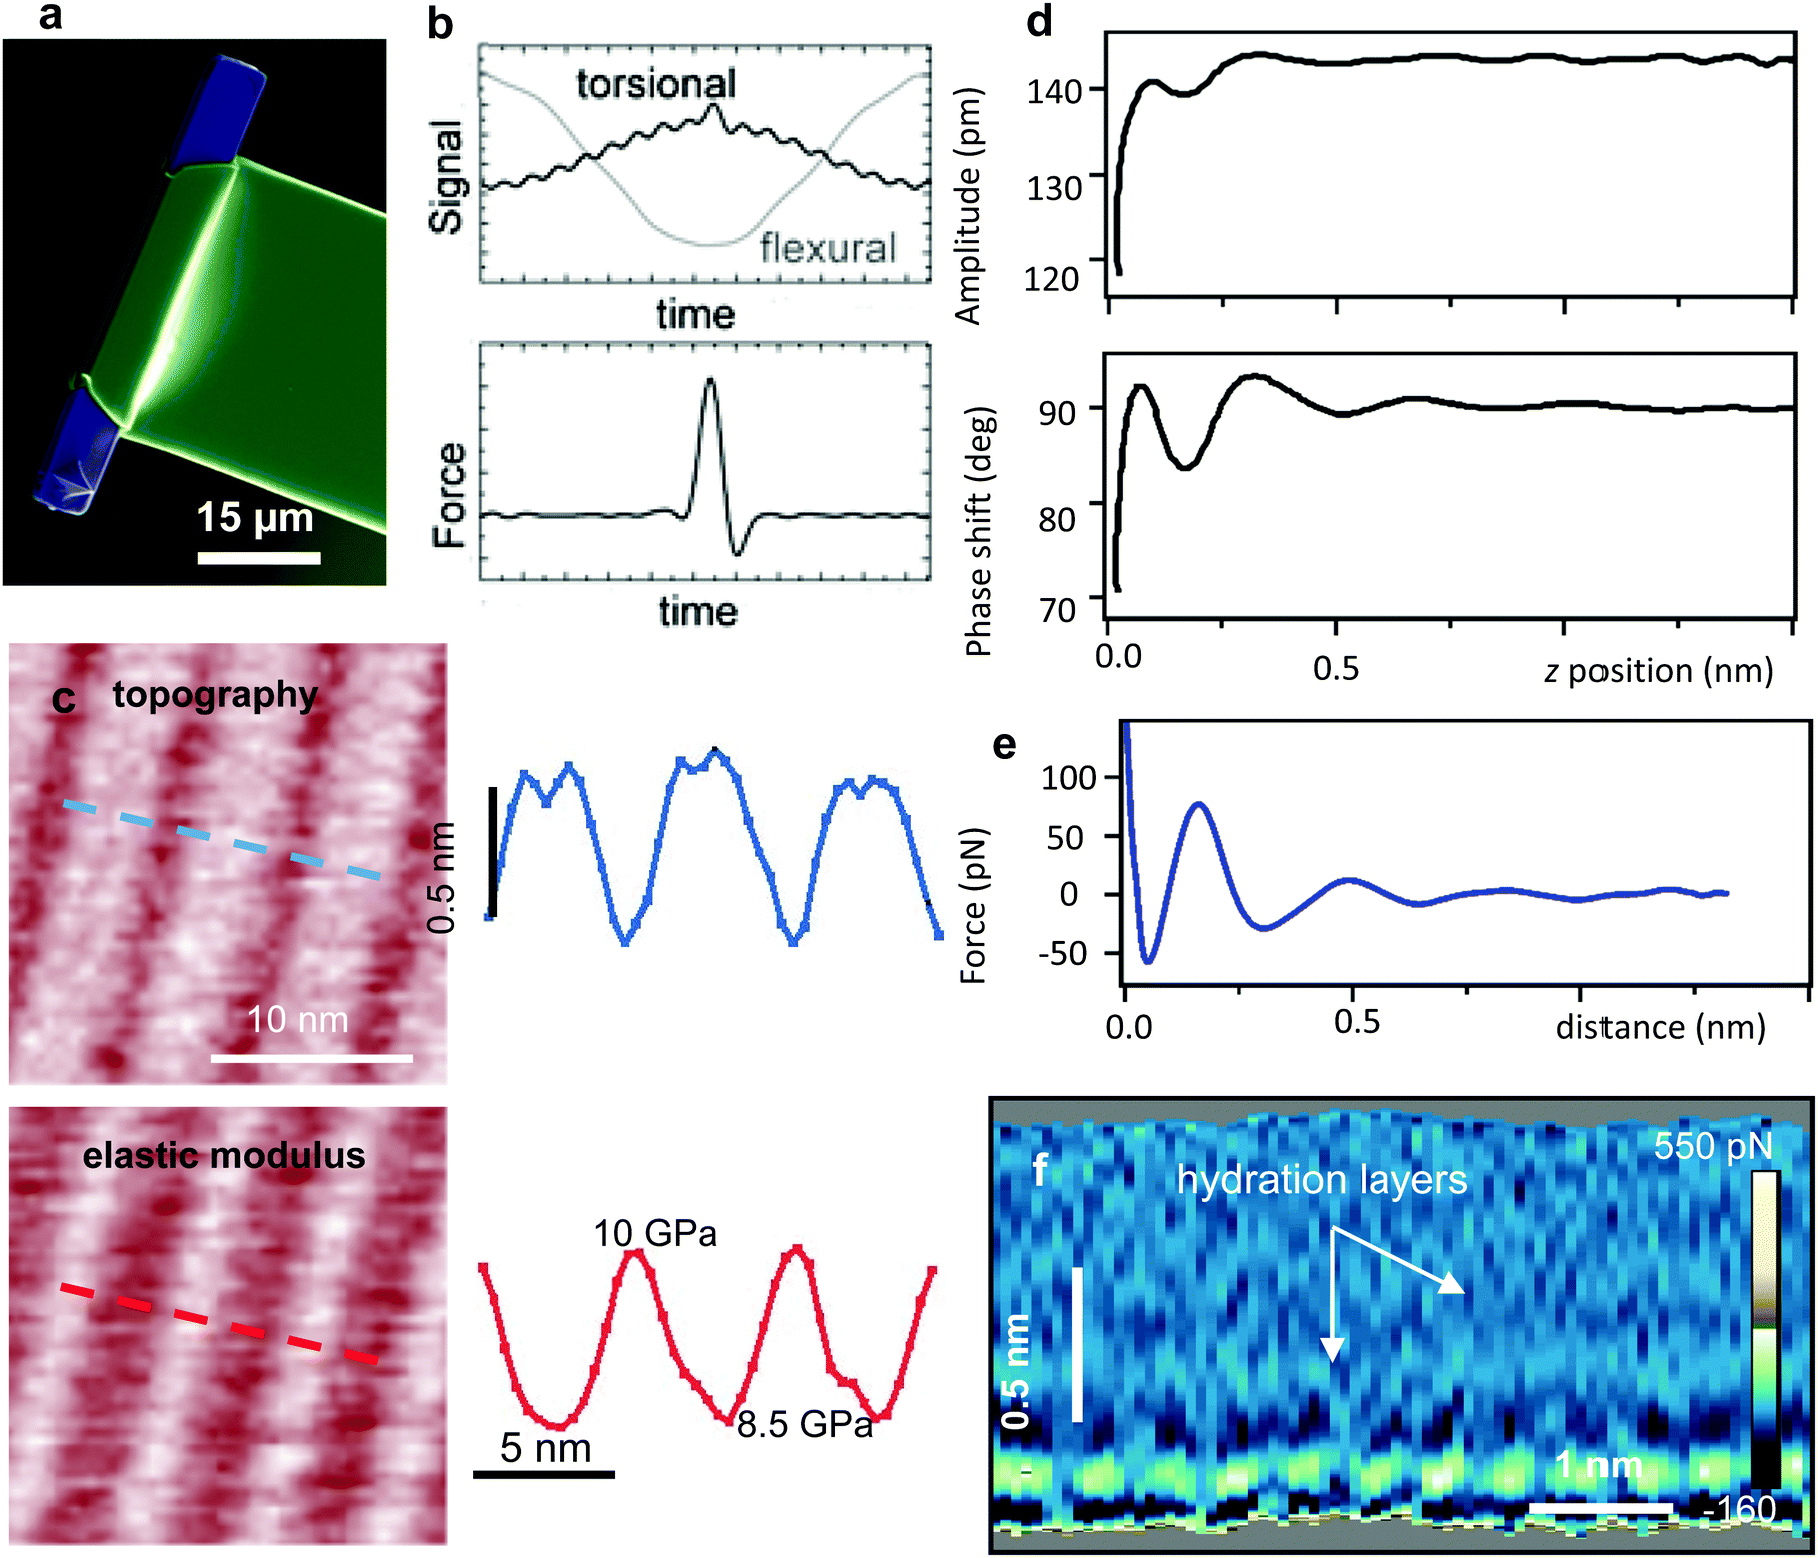 | ||
| Fig. 7 (a) Torsional harmonic cantilever (scanning electron microscope image). Reprinted with permission from ref. 199. Copyright 2011 Springer Nature. (b) Flexural and torsional deflection signals. The force is obtained by integrating the torsional harmonic components. Reprinted with permission from ref. 30. Copyright 2007 Springer Nature. (c) Torsional harmonics nanomechanical map of amyloid nanostripped structures (Aβ33–42). The height and elastic modulus map along the dashed lines are shown. Reprinted with permission from ref. 198. Copyright 2016 John Wiley and Sons. (d) Amplitude and phase shift–distance curves obtained by 3D-AFM on a mica-water interface. (e) Force–distance curve obtained from d. (f) 2D force panel generated by recording FDCs along the x-axis. The 2D force map shows the formation of hydration layers on a mica-water interface.205 | ||
7.1 Time-resolved force curves
These methods provide the force in the time domain, that is, a force–time curve. A force–distance curve is directly obtained from the time-resolved force and the instantaneous tip's position. Three different approaches were developed to determine the instantaneous tip–sample force. One relies on the use of high-bandwidth active cantilevers,172–174 another on measuring the tip's acceleration176 and the other on detecting and processing the torsional harmonics.30,184High-bandwidth interdigitated cantilevers172–175 provide the instantaneous value of the force (force–time curve) on a point of the surface while generating a topographic image. These cantilevers have been applied to map several mechanical properties of living cells.185 Fabrication costs represents a major bottleneck for a widespread use of active cantilevers for nanomechanical mapping.
Scanning probe acceleration microscopy (SPAM)176 determines the force from the tip's acceleration. The acceleration of the cantilever is obtained by taking the second derivative of the cantilever deflection signal during an AM-AFM experiment in liquid. Once the acceleration is obtained, the second derivative of the cantilever trajectory is taken and multiplied by the effective mass of the cantilever to obtain the time-resolved force. This method has been applied to study lipid layers and lipid raft domains.186 The accuracy of SPAM relies heavily on the quality of the deflection signal. The noise in the deflection is significantly amplified by taking the second derivative.
Cantilevers were designed to enhance the generation of higher harmonics in the flexural deflection by removing the mass on certain sections of the microcantilever193,194 or by modifying the cantilever shape.195 However, those cantilevers have yet to be used in combination with the Stark et al. force reconstruction method.29
7.2 Torsional harmonics
Sahin and colleagues overcame the above limitations by introducing torsional harmonic microcantilevers.30 In a torsional harmonic cantilever the tip is offset from the cantilever axis (T-shaped) (Fig. 7a). In these cantilevers the tip–sample forces generate a torque around its main axis. This torque enhances the presence of the large number of higher harmonics needed for an accurate calculation of the force–distance curve. In addition, the optical sensitivity of the torsional deflection is higher than the corresponding for a flexural mode.Torsional harmonics combines an amplitude modulation AFM feedback in the flexural deflection to generate a topographic image and the measurement the time-varying force during the tip's oscillation from the torsional harmonics.21,30,184 The force–distance curves are readily obtained from a force–time curve and the oscillation of the microcantilever.
The flexural and torsional deflections are processed independently. The torsional deflection is decomposed in the harmonic components of the frequency of driving force. The driving force is tuned to the first flexural resonance. The relationship between Fts and z is given by30,196
| Fts(ω) = T−1(ω)z(ω) | (26) |
 | (27) |
Fig. 7b shows the deflection of the torsional and flexural signals during a period of the flexural mode. High-spatial resolution topography and Young's modulus maps of amyloid peptide fibers are shown in Fig. 7c.
Torsional harmonics has also been called dynamical nanomechanical mapping.21 The method was commercialized under the name HarmoniX.™ Cantilever fabrication costs and the complexity of the calibration process of the torsional force constant have prevented a wider spread use of this method.
7.3 Force–distance curves from amplitude modulation AFM
In amplitude modulation AFM the observables cannot be expressed in terms of the instantaneous tip–sample distance because they are averaged over one oscillation cycle. This fact prevents the direct determination of the tip–sample force while imaging the topography. Several methods were developed to overcome this limitation by recording and processing amplitude and phase shift of the tip's oscillation as a function of the average tip–sample distance.177–182Fig. 7d shows some experimental amplitude and phase-shift distance curves. The amplitude and phase shift–distance curves can be generated either by using the standard AM-AFM configuration182 or by implementing other modulation methods.180,181 The integration enables to reconstruct the force from amplitude and phase shift–distance curves. In general, these methods are less efficient than FV because they involve more processing steps so very few applications have been reported.182,203 However, this method has have found an application niche in the characterization of solid–liquid interfaces (Fig. 7e) where the robustness and sensitivity of AM-AFM is especially suited for 3D-AFM imaging.204,2057.4 Other dynamic AFM methods
Topography and recognition imaging (TREC)206,207 provides molecular recognition contrast maps. TREC is a qualitative nanomechanical contrast method. It is based on the operation of an AM-AFM in liquid with biofunctionalized tips. This method combines the tip's functionalization to detect specific interactions with the high-spatial resolution and speed of AM-AFM. This method relies on an asymmetry of the tip's oscillation in liquid. The repulsive tip–surface forces modify more strongly the shape of the lower part of the oscillation than its top part. The opposite happens when a tip-tethered ligand binds to a molecule on the sample surface. The molecules and the tether are stretched during the upward movement of the tip which decreases the top value of the oscillation. The stretching involves the transfer of mechanical energy from the cantilever to the molecule. This loss in the mechanical energy of the cantilever produces a decrease in the top peak of the oscillation. This method provides high-spatial resolution images of specific interaction events208–210 but it is not a quantitative method. It does not give values of the parameters that characterize a molecular recognition event.Strain–stress curves are usually measured to determine the mechanical response of macroscopic materials.87 The stress–strain curve of a single antibody pentamer was measured by combining amplitude and frequency modulation AFM methods.191 For very small compressive forces (5–75 pN), the protein's central region showed that the strain and stress are proportional (elastic regime). This region had an average Young's modulus of 2.5 MPa.
8 Parametric methods
Parametric methods are defined by the following features (Fig. 8a): (1) the interaction force is parameterized in terms of mechanical properties; (2) the tip's equation of motion is solved with the interaction force; (iii) analytic expressions are deduced to relate the observables and the mechanical parameters of the tip–sample interaction.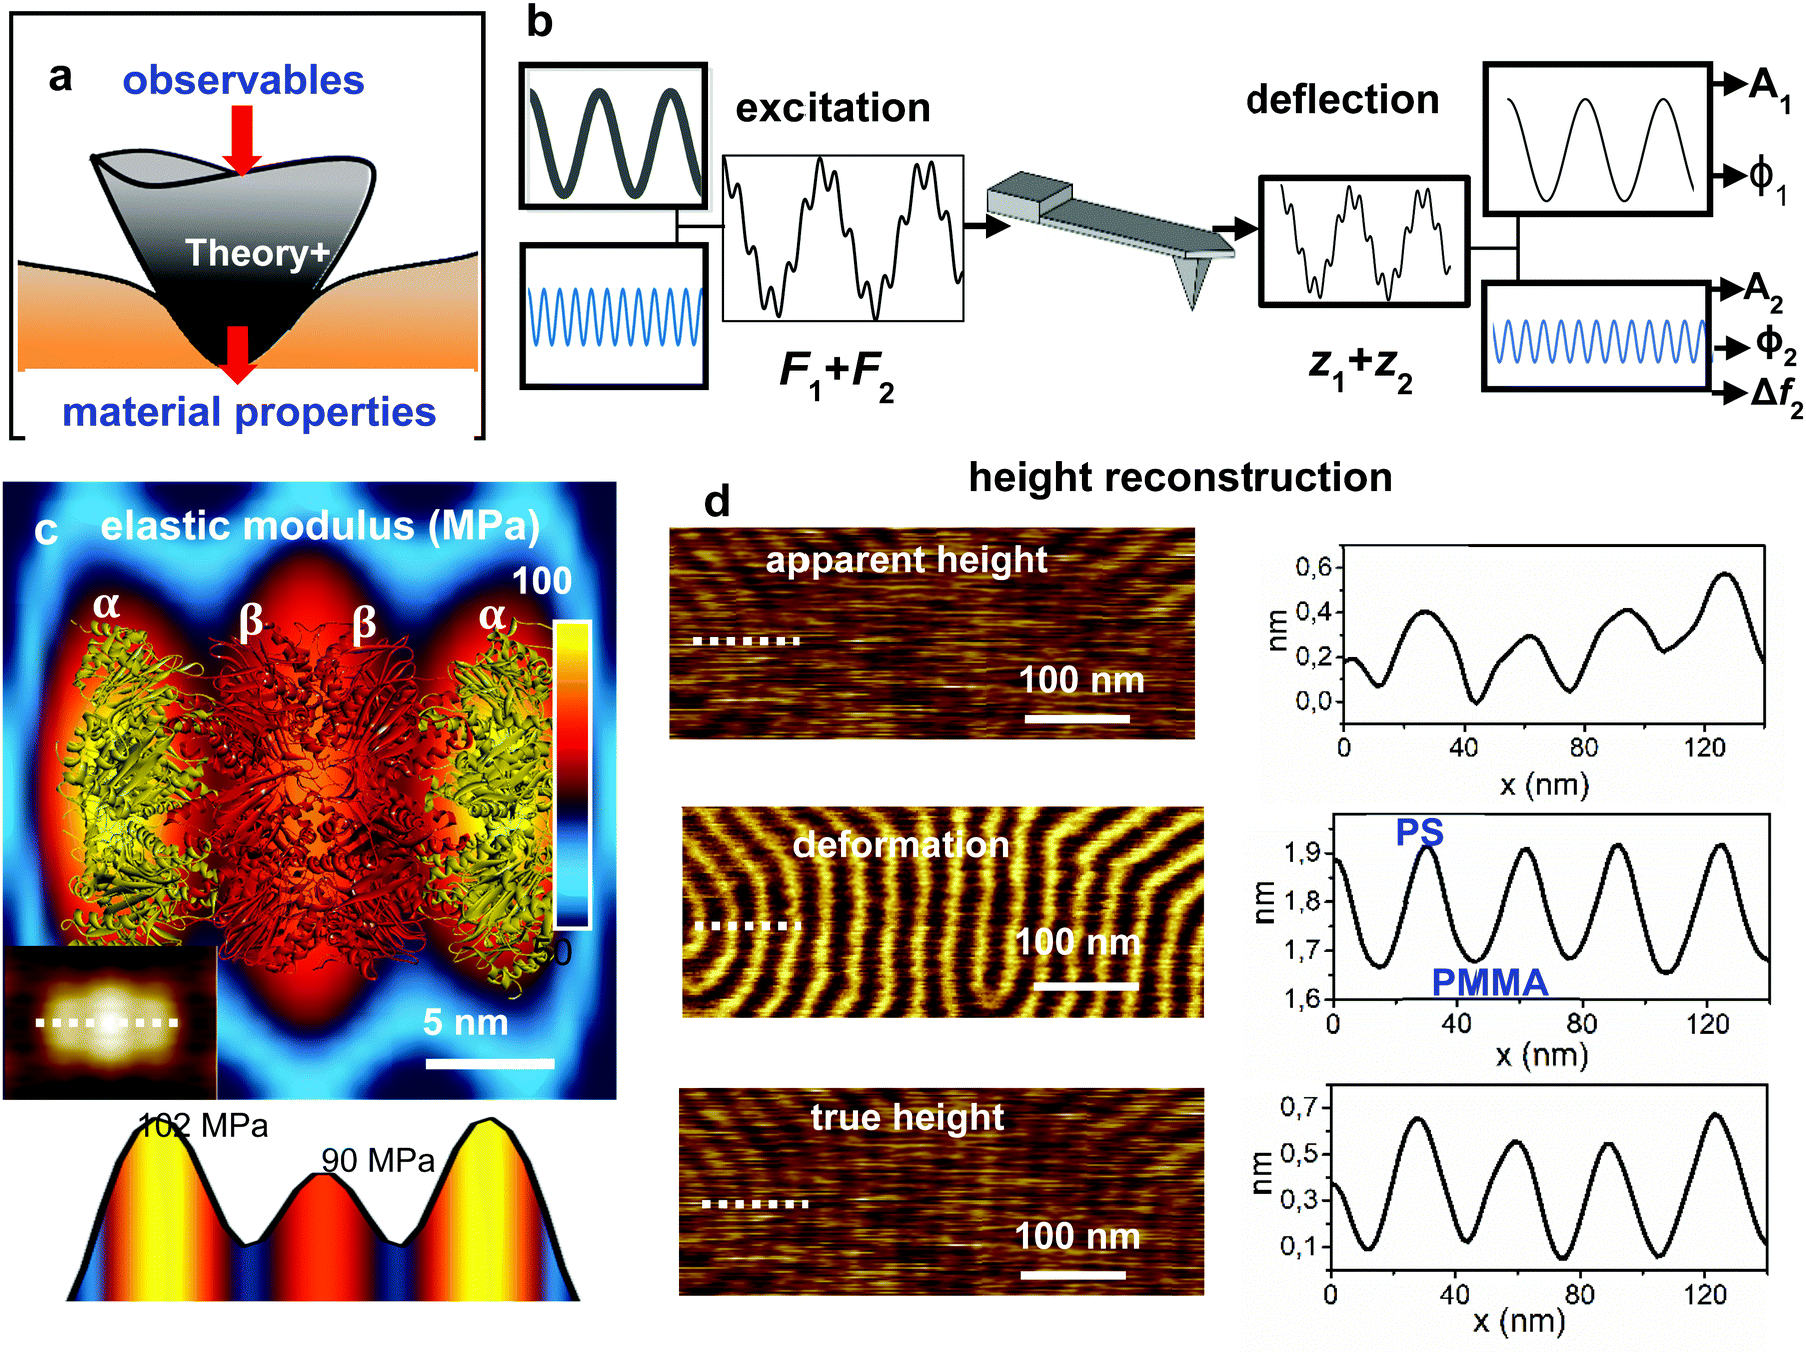 | ||
| Fig. 8 Bimodal AFM. (a) General bimodal AFM scheme to transform observables into material properties. (b) Excitation and detection scheme. The cantilever is excited at its first two eigenmodes. Upon interaction with the sample, the components of the tip's response are processed. This step generates several observables. In bimodal AM-FM, the topography is obtained by keeping A1 = constant while two feedback loops act on the parameters of the 2nd mode (see ref. 24). (c) Nanomechanical map of a single protein (20S proteasome). The map shows a correlation between the elastic modulus and the gate α and catalytic β subunits. The protein structure is overlaid. The panel at the bottom shows the elastic modulus cross-section along the dashed line marked on the topographic image (inset). Inset adapted with permission from ref. 24. Copyright 2018 SpringerNature. (d) Height reconstruction from the apparent height and deformation data. True height reconstruction. From top to bottom, apparent topography, deformation and true height of a PS-b-PMMA film.216 The PS domains have larger deformations (bright) than the stiffer PMMA domains (dark). The nanomechanical maps and images were generated simultaneously during imaging. | ||
8.1 Bimodal AFM
Bimodal AFM involves the simultaneous excitation and detection of two modes of the cantilever.20,32,211 The use of two modes allows the determinations of several material properties such as topography, deformation, dissipation, elastic modulus, viscosity coefficients or long-range interaction parameters in a single imaging step.86,211–216 Most bimodal experiments are performed by using the first two flexural modes20 of the cantilever, however, other eigenmodes either flexural217 or a combination of flexural and torsional modes have been used.218–220In bimodal AFM, the tip's motion is decomposed in terms of the components oscillating at the frequencies of the excited modes214,221 (Fig. 8b). Each mode might contribute with up to three observables, the amplitude Ai, phase shift ϕi and resonant frequency shift Δfi. The values and roles of the excited modes are not symmetrical. The amplitude of the first mode A1 is about 10 times larger than A2. Therefore, the observables of the 1st and 2nd mode explore different ranges of the interaction force.222,223
The type and number of observables used to run the feedback loops have generated several configurations.211 The first bimodal AFM configuration had a single feedback loop acting on the amplitude of the first mode.224,225 The latest configuration involves a feedback loop on A1 for topography and a feedback on the frequency shift of the 2nd mode for sensitivity.214,215 The existence of several bimodal AFM configurations have motivated a significant activity in theory, simulations and instrumentation.226–238
In bimodal AFM the number of unknowns about the interaction force matches the number of equations. The availability of analytical expressions enables the simultaneous mapping of topography and mechanical property mapping. Numerical simulations have validated the accuracy of the bimodal AFM theory.214
The theory of bimodal AFM approximates the tip's deflection by24,214
| z(t) ≈ z0 + z1(t) + z2(t) = z0 + A1cos(2πf1t − ϕ1) + A2cos(2πf2t − π/2) | (28) |
To illustrate how bimodal AM-FM generates a nanomechanical map (Fig. 8c), let's focus on the expression of the effective elastic modulus for a material described by Hertz model24
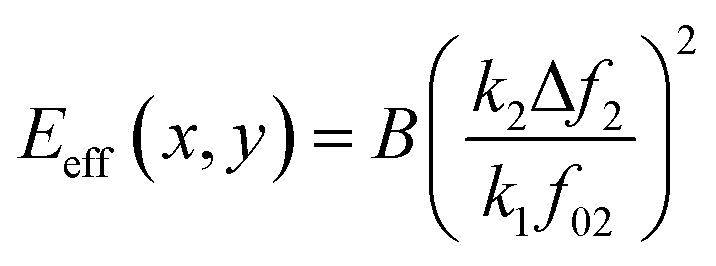 | (29) |
 | (30) |
Bimodal AFM solves the above issue because the deformation induced by the force applied by the tip is directly determined from the observables.24 Then, the true topography can be obtained by applying the following equations,
| htrue = ha(x,y) + Imax(x,y) | (31) |
 | (32) |
Fig. 8d shows the apparent height, the deformation and true height images of a poly(styrene-block-methyl methacrylate) (PS-b-PMMA) film. The diblock copolymer arranges in an ordered lamellar structure alternating PS and PMMA domains with a pitch of 30 nm. By measuring the elastic modulus, bimodal AFM enables to associate the low elastic modulus (2.1 GPa) to the PS domains and the high elastic modulus (2.6 GPa) to the PMMA domains.216 Under the application of a peak force of 12.5 nN, the softer PS regions show a total deformation of 1.9 nm while the deformation of the PMMA domains is of 1.65 nm.216 Those values show that the deformation exerted by the tip on a soft material are significant.
Materials science. Nanomechanical maps have characterized the performance of organic electrochemical transistors. Those maps showed that an increase of the stiffness of an organic electronic material decreases ion uptake which, in turns, decreases the performance the transistor.242 Local spin transitions in thin molecular films have been determined by following the temperature dependence of the Young's modulus from the low to the high spin states.243 In another application, it was reported that the surface elasticity of binary self-assembled monolayers increased with ligand ordering.244
The local elastic and inelastic properties of polymer films, polymer-based materials214,245 and flexible crystals246 have been extensively studied by bimodal AFM. In particular, the structure and elastic properties of semi crystalline polymers has been obtained on a molecular-scale level.215 The elastic properties247 and wettability transparency248 of two-dimensional materials were also studied.
Molecular and cell biology. Bimodal AFM showed that the physical properties of lipid bilayers are modulated by the concentration of cholesterol. Regions with a low concentration of cholesterol molecules are predominantly elastic while regions with a high concentration have viscoelastic properties.249 High-spatial resolution nanomechanical maps characterized the adsorption of single alkali cations on lipid bilayers.250 It was reported that the formation of an ionic network reduces the elastic modulus of the lipid bilayer. Elastic property maps characterized the distribution of magnetic nanoparticles adsorbed and inside in liposomes.251
High-spatial resolution maps of the elastic properties of membrane proteins,214 single proteins,24 protein fibrils252,253 and DNA215,254 were generated with a lateral resolution in 1 to 5 nm range. Nanomechanical maps of other biological systems such as bone elements,255 virus-like particles256 and cells have been reported.257,258
Instrumentation. Bimodal AFM has inspired several detection schemes for probe microscopy methods.259–261 It has also motivated the design of novel cantilevers.262–265
8.2 Contact resonance and multi-harmonic methods
Other experimental and signal processing parametric schemes were developed to map mechanical properties.266–268 Contact resonance AFM tracks the changes of the cantilever's resonant frequency induced by the changes of the mechanical properties of the tip–sample contact.266 Multi-harmonic AFM assumes a tip's oscillation dominated by just three harmonic components and analytical expressions to relate those components to local mechanical properties.267The theory of CR-AFM establishes that the stiffness and damping parameters of a contact described by the Kelvin–Voigt model are related to the loss and storage modulus by271
 | (33) |
The application of eqn (33) involves several steps. One of them requires fitting the experimental frequency response with a theoretical model. Accurate determination of the contact radius rc might be problematic which led to use of reference samples with well-known mechanical properties.23,271
The spatial resolution of a nanomechanical map obtained by CR-AFM is rather modest if compared to the spatial resolutions achieved in either FV or bimodal AFM. In general, a contact resonance AFM experiment involves the application of relatively large forces, say of a few hundreds of nN.274 Large forces might damage the surface and worsen the spatial resolution. For those reasons, the application of CR-AFM to soft materials have been limited to a few polymers with relatively high elastic modulus (∼1 GPa).23,273
Contact resonance AFM drew some attention for imaging in a non-invasive way subsurface features in polymer blends, plant cells or bacteria.275–278 However, the combination of a modest spatial resolution and the complexity of the models needed to interpret the data279–281 has slowed down progress.
Multi-harmonic AFM was applied to map of viscoelastic parameters of cells.28,284,285 The softness of a cell implies that the resonance curve of the cantilever is weakly distorted by the interaction with the cell. This observation is consistent with assuming an oscillation with just three harmonic components. The method has been extended to measure the mechanical properties of stiffer samples such as viruses.286
9 AFM phase-imaging
AFM phase-imaging has significantly contributed to the establishment of force microscopy as a key nanoscale characterization method in materials science.5 In the mid-90s, amplitude modulation AFM phase contrast images provided the first high-spatial resolution maps of polymer surfaces in their native conditions and state16,17,287–291 Some of the images of block-copolymer interfaces could be considered iconic.292,293 Nowadays, AFM phase-imaging is routinely used in the characterization of heterogeneous soft materials at the nanoscale.AFM phase-imaging is an element of amplitude modulation (tapping mode) AFM.31,37 An AFM phase contrast image is obtained by recording the phase shift on each point of the surface ϕ(x,y) while imaging the surface topography (Fig. 9a). Thus, topography and phase contrast images are acquired simultaneously (Fig. 9b and c).
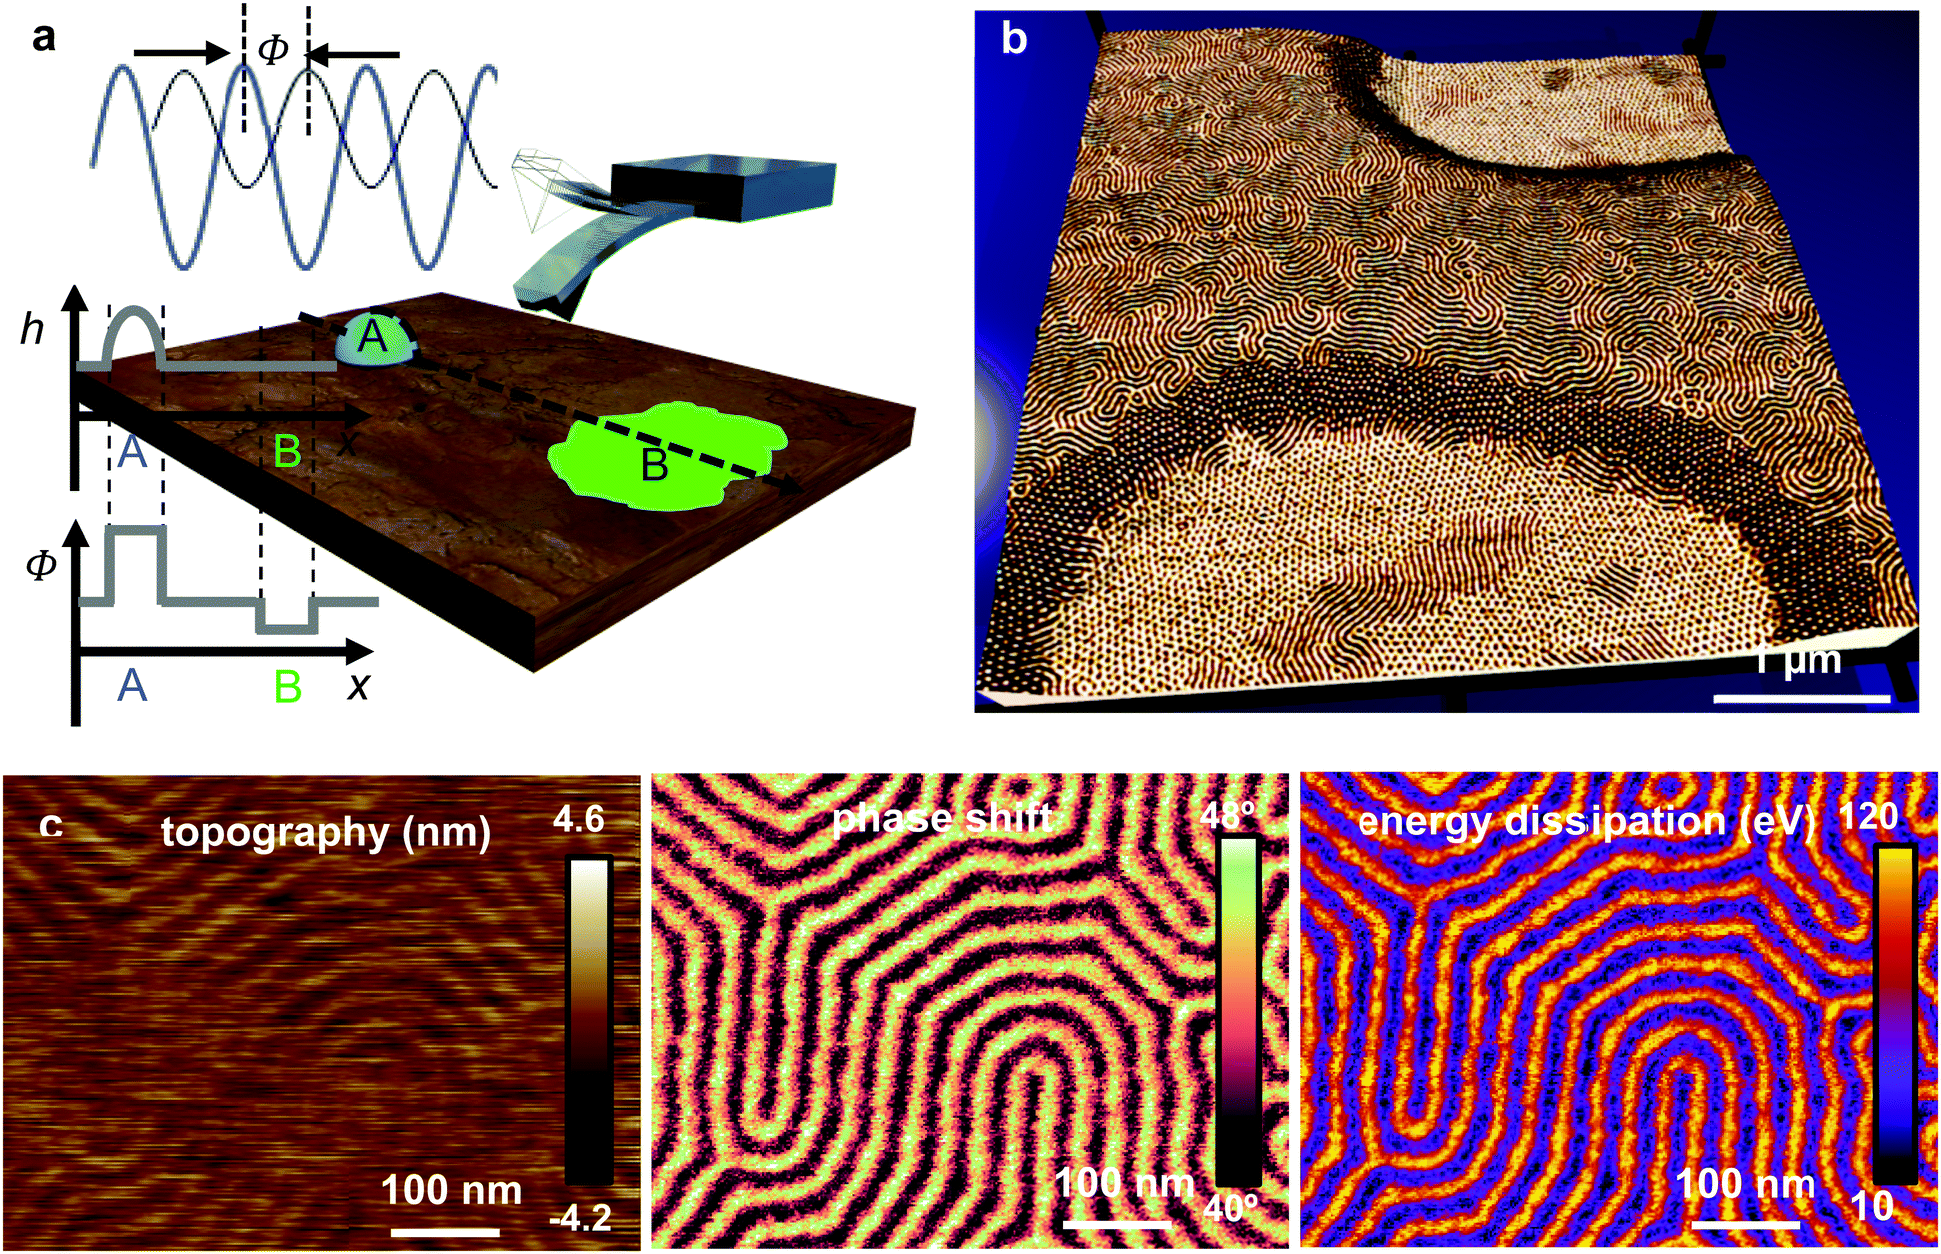 | ||
| Fig. 9 AFM phase-imaging. (a) Scheme of phase shift contrast. The lag of tip's response with respect to the driving force is the phase shift ϕ. Phase shift contrast might happen in heterogenous but otherwise flat samples (b) Reconstructed image of a polystyrene-block-polybutadiene-block-polystyrene (SBS) film. The image was formed by combining topographic and phase shift images. The image shows the formation of terraces. The structure of the domains change with the film thickness. In the lower terrace (film thickness of 32 nm) the cylinders are oriented perpendicular to the support. In the higher terrace (57 nm) the domains are parallel to the underlying support. Reprinted with permission from ref. 293. Copyright 2004 AIP Publishing. (c) Topography, phase shift and energy dissipation images of PS-b-PMMA film.216 | ||
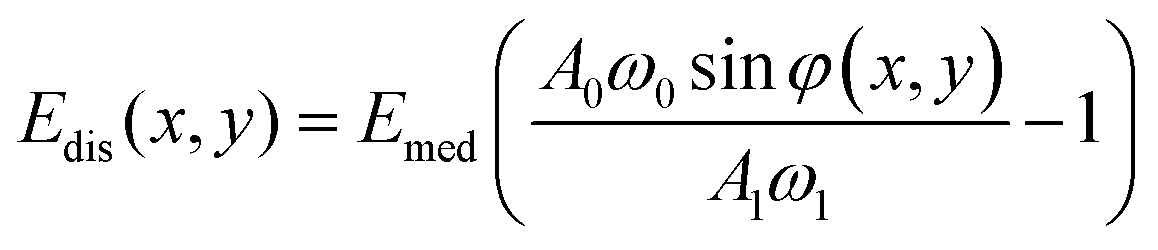
The amplitude of the tip's oscillation is controlled by the convolution of the interaction force and the tip's position and by the amount of energy that the tip dissipates on the sample in one oscillation.294 On the other hand, the sine of the phase shift is directly proportional to energy dissipated by the tip on the sample.295–297 Thus, in AM-AFM the amplitude and the phase shift are controlled by different physical factors. This property enables AFM phase-imaging to resolve features that might be hidden in the topographic signal. The key role of energy dissipation in explaining the contrast in AFM phase-imaging might be counter-intuitive. It created some conflicting interpretations that lasted from the early days298–305 to the development of theory for imaging in liquid.306–308
9.1 Theory of AFM phase-imaging
Let's consider a cantilever-tip system that is driven by a sinusoidal force near a surface. In general, the phase shift between the tip's oscillation and excitation force depends on both the elastic and the inelastic components of the interaction force.294,308 This is a general property of oscillating systems. However, in AM-AFM the feedback control imposes the condition of keeping A = constant while imaging. This condition implies that, for moderate to high quality factor cantilevers (Q ≥ 10), the phase shift contrast depends exclusively on energy-dissipative processes.295–297,309,310 Moderate to high Q-factors are commonly found in experiments performed in air or vacuum.The general solution of eqn (1) gives the deflection in terms of the components of harmonics (nω) of the frequency of the driving force F0cosωt
 | (34) |
Energy balance applied to a complete period of the tip's oscillation imply that the work performed by the driving force must coincide with the sum of the total energy dissipated by the tip–surface forces Edis and the energy dissipated in the medium (air or liquid) Emed. Then, it was deduced306,308
 | (35) |
 | (36) |
| ϕ(x,y) = sin−1[c1 + c2Edis(x,y)] | (37) |
 | (38) |
Fig. 9c shows the apparent height, phase shift and energy dissipation maps of a PS-b-PMMA film. Both the phase shift and the energy dissipation maps show contrast between the PS and the PMMA domains. However, the images by themselves do not allow to associate a given region with either a PS or a PMMA domain. This is a consequence of the semi-quantitative character of AFM phase-imaging (see Section 10.1).
9.2 The paradox of AFM phase-imaging
Does the phase contrast measured between two points Δϕ = ϕ(x1,y1) − ϕ(x2,y2) involve necessarily local changes in the non-conservative component of the force Fdis (x,y,z)? In general, the answer is no. Once there is a dissipative interaction, local changes in the elastic parameters of the sample could give rise to local phase shift changes.The application of the virial theorem294 to the tip's motion enabled to determine a expression for cos ϕ(x,y). That expression together with eqn (37) enabled to calculate the dissipated and stored energy of the tip as a function, respectively, of sin ϕ(x,y) and cos ϕ(x,y). Proksch combined those expressions to map loss tangent variations in polymeric films.316,317
9.3 Applications of AFM phase-imaging
AFM phase contrast images have contributed to solve many problems in materials science. Let's introduce some examples from the 2014–2020 period. The phase shift signal was used to generate subsurface images of polymeric materials.318,319 The hydration of biopolymers under different conditions was followed by recording phase shift–distance curves.320,321 Several viscoelastic processes on polymer blends and polymer nanocomposites have been studied by AFM phase contrast images.322,323 The sensitivity of the phase shift signal has enabled to detect interfacial fluctuations on PS-b-PMMA,324 to perform in situ studies of crystallization of polymers as a function of the temperature325 or to image in realtime self-assembly processes.326 The compatibility of AFM phase-imaging and high-speed AFM was demonstrated by imaging membrane vesicles isolated from different bacterial strains at 2 s per frame (200 × 200 pixels).32710 Open issues and future developments
Does a nanomechanical map has less spatial resolution than topography imaging? To what extent continuous mechanics models are valid to describe the measurements? Those are examples of some fundamental questions in nanomechanical mapping. Other issues are more technical in nature. Recent technology and scientific advances such as high-speed operation, big data analysis and machine learning are about to influence the field. Let's examine in detail some of the issues that are likely to shape the future of nanomechanical force spectroscopy.10.1 Quantitative versus compositional contrast methods
The main goal of the field is to develop fast and high-spatial resolution methods that provide values of a mechanical property that either has a well-defined macroscopic counter-parts or measures an intrinsic nanoscale property. Examples of the former are the storage and loss modulus. An example of the latter might be the determination of the energy of an intermolecular bond.Force–volume, bimodal AFM, contact resonance or torsional harmonics provide maps of mechanical properties. Those methods are quantitative. Topography and recognition imaging and chemical force microscopy rely on the detection and/or measurement of adhesion forces. Adhesion forces might not have a direct relationship with a mechanical property of the material because they depend on the contact area. Those methods are qualitative. Qualitative methods might be useful to generate high-resolution compositional contrast images or to detect the position of a receptor molecule. AFM phase-imaging is a singular case. It measures the energy dissipated by the tip on the sample. This is not a mechanical property; however, phase shift maps might be transformed into spatially-resolved measurements of loss tangent values.
10.2 Spatial resolution
Does nanomechanical mapping of soft materials imply less spatial resolution? This question might not have a simple answer. First, the spatial resolution will depend on the type of mechanical property. Second, the methods discussed in this review are not equivalent in terms of spatial resolution and sensitivity.An estimation of the spatial resolution lr for a tip of radius R when long-range attractive forces are negligible with respect to the value of the repulsive force is given by31
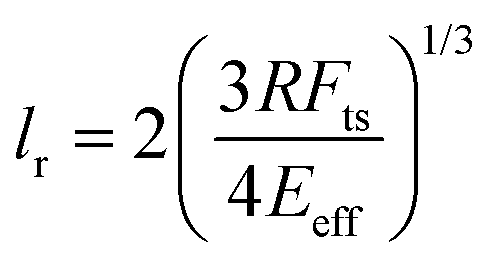 | (39) |
The topography of native purple membranes was studied by Muller and co-workers.328 This surface might be considered a calibration standard for very high-resolution imaging of biomolecules in aqueous solutions. Fig. 10a shows a scheme of the membrane structure. The purple membrane consists of 75% bacteriorhodopsin (BR) and 25% lipids (w/w). BR forms a 2D trigonal crystal (a = b = 6.2 ± 0.2 nm). The position of the transmembrane α-helices are marked.
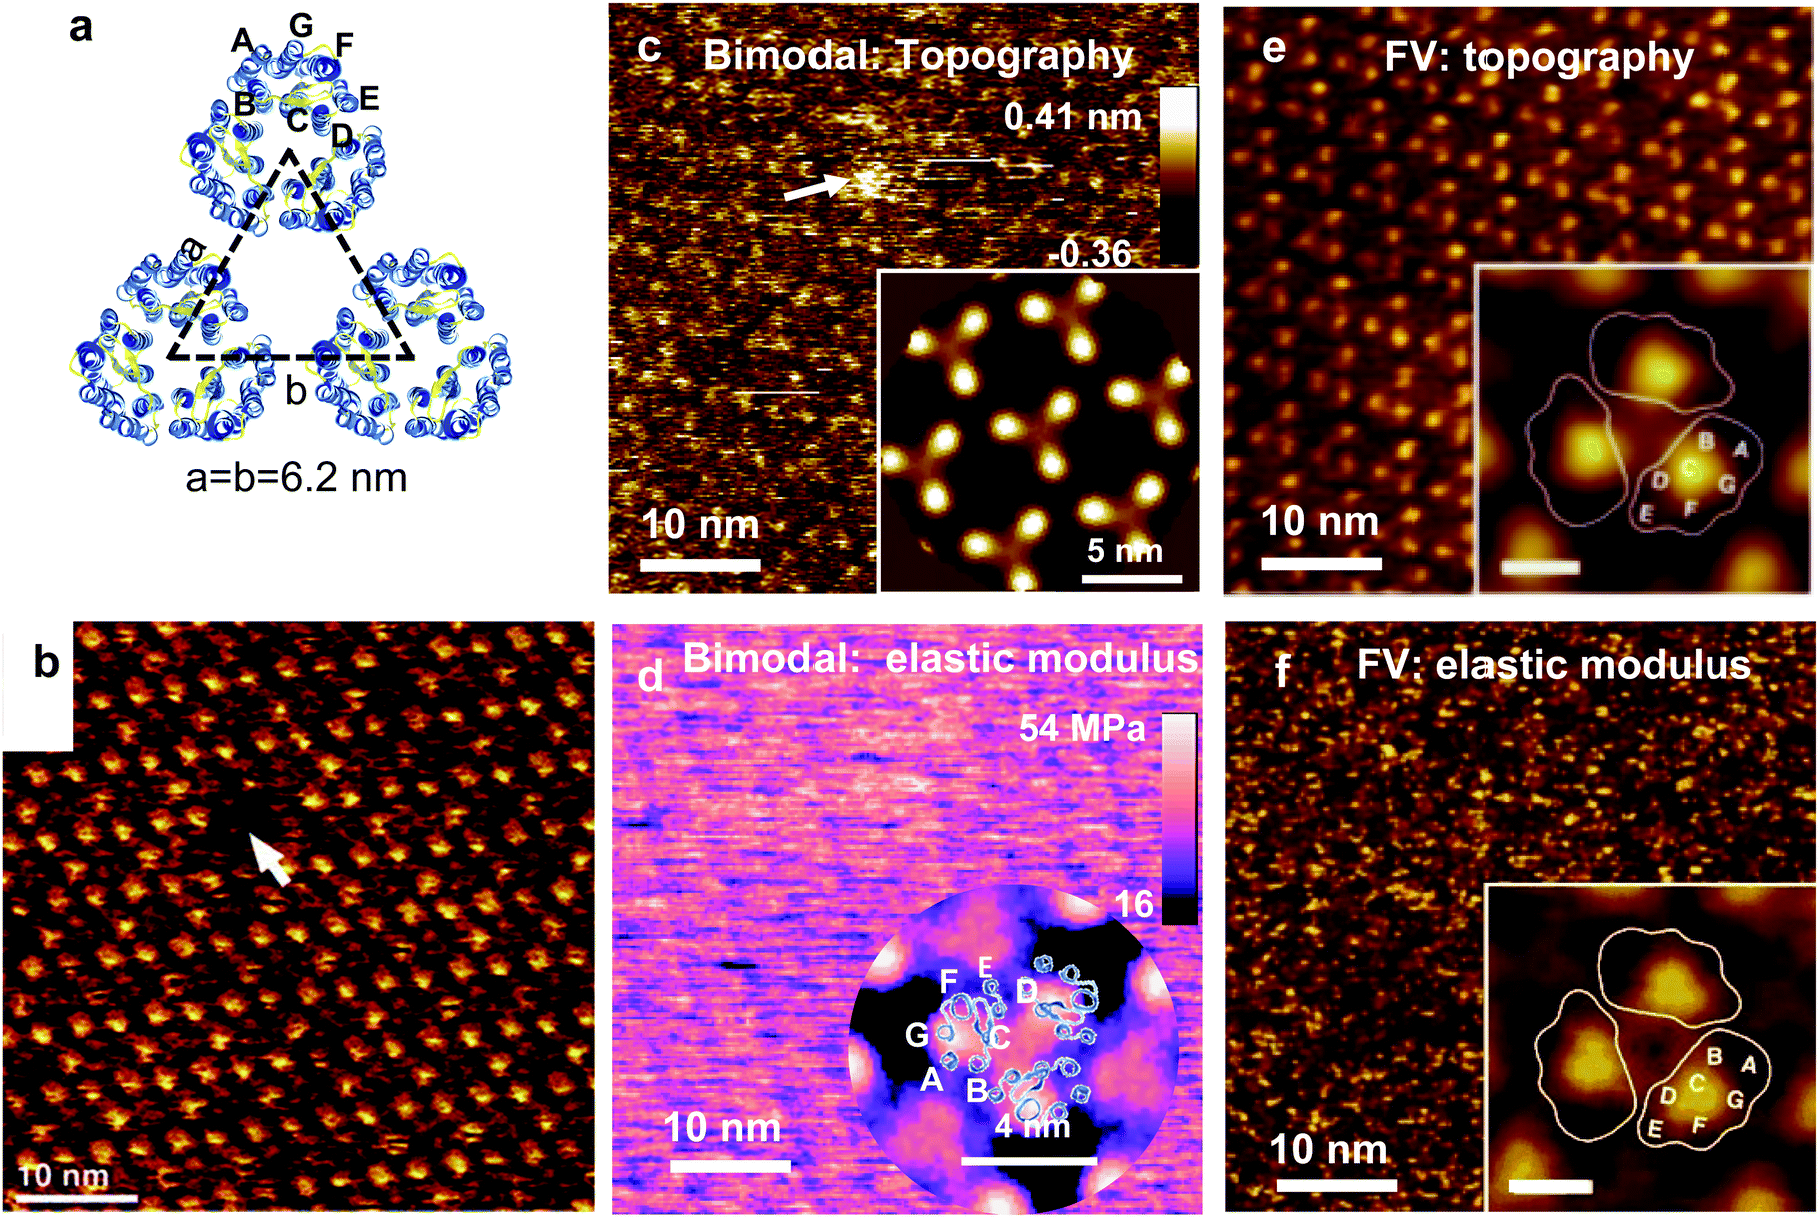 | ||
| Fig. 10 Topography and elastic modulus map of native purple membrane. (a) Trigonal structure of the extracellular (EC) purple membrane. Each trimer is formed by 3 BR proteins. Protein data bank code 2at9. (b) Topographic image of the EC side. Image obtained in contact mode by applying a force of 100 pN. Reprinted with permission from ref. 328. Copyright 2000 Elsevier. (c) Bimodal topography of the EC side. (d) Bimodal elastic modulus map. Bimodal images obtained by applying a peak force of 170 pN. Reprinted with permission from ref. 214. Copyright 2017 American Chemical Society. (e) FV topography of the EC side. (f) FV elastic modulus map. FV images obtained by applying a peak force of 100 pN. FV images reprinted with permission from ref. 111. Copyright 2011 John Wiley and Sons. The insets in (c–f) and show the 3-fold symmetrized averages. | ||
Fig. 10b shows a state-of-the-art image of the extracellular BR surface obtained by AFM (contact mode).328 A single defect of the size of a BR trimer is marked. Fig. 10c and d show bimodal AFM maps of the EC.214 The bimodal image (topography) shows the BR trimers in an hexagonal arrangement. The image reveals the trimer's lattice and single defects (marked). The contrast might not be as good as in Fig. 10b but there is no loss in spatial resolution. The elastic modulus map (raw data) shows a regular pattern with a 6.2 nm periodicity but the hexagonal structure is not readily visible (Fig. 10d). Cross-correlation and averaging methods were applied to reveal the trigonal structure (inset). The Young's modulus across the BR trimers changes between 30 to 40 MPa. Fig. 10e and f shows some FV topographic and elastic modulus maps of the EC side of PM.111 The topographic image shows the hexagonal arrangement of the BR trimer (Fig. 10e). The elastic modulus map is very noisy without providing any hint on the BR structure (Fig. 10f). Extensive averaging methods were applied to reveal the periodicity (inset).
This example shows that the spatial resolution in the topography is not affected by nanomechanical mapping (Fig. 10b, c and e) while the spatial resolution of the elastic modulus maps (raw data) is diminished (Fig. 10d and f). Nonetheless, the above conclusion is not general. The spatial resolutions topographic and elastic modulus maps of some proteins24 and block-copolymers216 were for all purposes identical.
10.3 Quantitative accuracy
The accuracy of a nanomechanical measurement is controlled by three independent factors: the model or theory that describes the mechanical properties of the sample, the theory that transform observables into properties and the calibration of the instrument.The second factor was rigorously addressed by the theories of bimodal AFM214 and force–volume27 configurations. Let's assume that for a given material there is a contact mechanics model that describes its mechanical properties. What is the relative error incurred, for example, in the determination of the Young's modulus? A numerical simulator designed to describe bimodal AM-FM operation214 showed that the Young's modulus can be determined with a relative error below 5% over a 5 orders of magnitude range (1 MPa to 100 GPa). Similar results were obtained for the determination of the viscosity coefficient and the retardation times of the 3D Kelvin–Voigt model.216
Numerical simulations of the equation of motion27 and FEM44,65,95 simulations were used to establish the operating conditions in FV to map elastic and viscoelastic properties with accuracy. Theoretical expressions and numerical simulations defined the frequency ratios required to determine the elastic modulus of a material with an error below 5% by FV.27 The validity of the bottom-effect correction expressions were tested by comparing the force–distance curves deduced from the bottom effect theory with the force–distance curves obtained from finite element method (FEM) simulations.44,65 Those comparisons showed the conditions to determine elastic and viscoelastic parameters with a relative error below 10%. The accuracy of AFM phase-imaging to determine the energy dissipation and loss tangent values was discussed in Section 9.1.
Similarly, several methods335,336 have been proposed to determine the tip's radius. However, the resulting protocols do not offer a quick and non-destructive determination of the radius. An alternative approach to estimate the radius might be obtained from the spatial resolution of the images. This method is empirical and its accuracy relies on the identification of an intrinsic structure of the sample.86,216
Ideally the size of the tip should be smaller than the lateral extension of the key sample features. For single cells, the relevant features might lie in the sub-100 nm range. Therefore, nanomechanical mapping will require the use of tips with radii in the sub-20 nm range.67,337 The use colloidal tips with radii ranging from 1–50 μm is recommended for generating maps of the mechanical properties of tissues or decellularized extracellular matrices.85,338–340 In those samples the regions of interest might be several micrometers wide.
Accurate nanomechanical measurements require to process the data with the expression of the force that better describes the geometry of the tip (Table 1). For an isotropic material, the accuracy of the measurement is independent of the tip's size. The situation is more subtle on heterogeneous samples. Colloidal tips provide an average of the mechanical properties of the different structures or regions involved the contact area. Thus, experiments performed on different regions of the sample might yield similar values. On the other hand, a sharp tip will measure the mechanical properties of smaller regions. Repeating the measurements on other regions of the sample might yield significantly different values. The observed differences might reflect the variations of the local structure and properties of the sample and not errors associated with the sharpness of the tip.
10.4 Comparisons with other methods
The values of some nanomechanical maps were compared to the measurements obtained either by standard macroscopic techniques such as dynamic mechanical analysis (DMA)341,342 or by nanoindentation methods.142,343 In addition, there are also several comparative studies of AFM-based nanomechanical methods.344,345 To reach meaningful conclusions, comparative studies among macro, micro and nanoscale methods should always be accompanied by a discussion about modulation frequencies, calibration protocols, surface effects and micro and nanostructure of the sample.The stress applied on AFM-based measurements is between one and two orders of magnitude higher than the one applied on bulk measurements. It has been noted that, for certain materials, the stress applied on AFM could be in a nonlinear stress–strain regime, in particular when using sharp tips.348 This effect together with the use of continuous models to describe nanoscale properties might cause some discrepancies between nanoscale and bulk measurements. Paradoxically, the repeatability of AFM measurements and the overall agreement obtained between the data and the description provided by contact mechanics models and FEM simulations indicates that many AFM experiments are performed in a linear or near-linear elastic regime.
It should be noted that the value of a mechanical property at the nanoscale should not necessarily coincide with the value of the same property at the macroscale. Macroscale measurements provide average values over a large volume of the material. On the other hand, AFM measurements provide local values averaged over very small volumes of the material. Mechanical properties of heterogeneous surfaces might have intrinsic size effects, for example, the existence of stress gradients at the domain boundaries.350
There is a strong activity in measuring the viscoelastic properties of soft matter by AFM-methods.52,88–97,351–353 This activity has generated several viscoelastic parameters which makes hard to perform direct comparisons among results from different groups even when the experiments were performed on similar materials. A convergence towards the same viscoelastic parameters should be expected for the next years.
10.5 High-speed operation
In the 90's, AFM images were typically acquired at a scanning rate in the fast direction of 1 Hz (0.01 frame per s, 100 × 100 pixels). In the 2010's the typical scanning rate was increased to 10 Hz. Nowadays, high-speed AFM operation implies scanning rates above 100 Hz (≥1 frame per s, 100 × 100 pixels).The next generation of nanomechanical force spectroscopy methods will provide nanomechanical maps at high-speed rates. The compatibilities of AFM phase-imaging327 and bimodal AFM354 with high-speed operation has already been demonstrated.
10.6 Correlative microscopy
Optical microscopy remains the method of choice for the functional and compositional characterisation of biological specimens in situ. Optical microscopy images provide large fields of view, access to organelles deep inside the cell and molecular labelling. Nanomechanical mapping would benefit by its combination with different optical microscopy methods. At the tissue level, immunofluorescence could be applied to guide the AFM tip to specific regions of the sample.338,355 This combination provides a link between mechanical property characterization and biochemical composition. At the single cell level, the integration of super-resolution microscopy356 and nanomechanical mapping would offer unique features for understanding cell dynamics and function.10.7 Big data and Machine learning
The potential of big data analysis and machine learning algorithms in AFM and force spectroscopy remains largely unexplored.357–360 High-speed nanomechanical mapping will generate large data files that will require the use of optimized processing tools. At the same time, many technological and biomedical applications will demand the automatization of AFM imaging. Robotics, machine learning and new computational tools are expected to have a significant impact in the field.11 Conclusions
This review presented the experimental approaches, the theoretical background and the capabilities of the most advanced nanomechanical mapping methods to measure at very high (<10 nm) or high-spatial resolution (10–100 nm) the mechanical properties of soft materials.About 25 years ago the emergence of nanotechnology motivated the development of the first nanomechanical mapping methods. Nowadays, a variety of fields such as mechanobiology, the development of smart materials, energy storage, nanomedicine or clinical diagnosis provide the driving forces to expand the capabilities of nanomechanical force spectroscopy.
In the near future, the field will experience the incorporation of improved theoretical models and advanced data analysis tools. At the same time, new hardware components and architectures will make high-speed nanomechanical mapping routine. In the long-term, I envision a new generation of instruments that will integrate automatization, quantitative accuracy, nanoscale spatial resolution, correlative microscopy and large-scale characterization of soft materials in their native state and environment.
Conflicts of interest
There are no conflicts to declare.Acknowledgements
The author benefitted from multiple and insightful discussions with Simone Benaglia, Mingdong Dong, Victor G. Gisbert and Manuel R. Uhlig during the writing of this report. Careful reading of the manuscript by S.B., V. G. G. and M. R. Uhlig is also acknowledged. Financial support from the European Research Council ERC-AdG-340177 and the Ministerio de Ciencia e Innovación (MAT2016-76507-R, PID2019-106801GB-I00) are acknowledged.References
- G. Binnig, C. F. Quate and C. Gerber, Atomic force microscope, Phys. Rev. Lett., 1986, 56, 930 CrossRef PubMed.
- E. L. Florin, V. T. Moy and H. E. Gaub, Adhesion forces between individual ligand-receptor pairs, Science, 1994, 264, 415 CrossRef CAS PubMed.
- F. Oesterhelt, D. Oesterhelt, M. Pfeiffer, A. Engel, H. E. Gaub and D. J. Muller, Unfolding pathways of individual bacteriorhodopsins, Science, 2000, 288, 143–146 CrossRef CAS PubMed.
- W. F. Heinz and J. H. Hoh, Spatially resolved force spectroscopy of biological surfaces using the atomic force microscope, Trends Biotechnol., 1999, 17, 143–150 CrossRef CAS PubMed.
- R. Garcia, R. Magerle and R. Perez, Nanoscale compositional mapping with gentle forces, Nat. Mater., 2007, 6, 405–411 CrossRef CAS PubMed.
- T. Ando, High-Speed Atomic Force Microscopy Coming of Age, Nanotechnology, 2012, 23, 062001 CrossRef PubMed.
- D. Wang and T. P. Russell, Advances in Atomic Force Microscopy for Probing Polymer Structure and Properties, Macromolecules, 2018, 51, 3–24 CrossRef CAS.
- Y. F. Dufrêne, T. Ando, R. Garcia, D. Alsteens, D. Martinez-Martin, A. Engel, C. Gerber and D. J. Müller, Imaging Modes of Atomic Force Microscopy for Application in Molecular and Cell Biology, Nat. Nanotechnol., 2017, 12, 295–307 CrossRef PubMed.
- D. Sluysmans, S. Hubert, C. J. Bruns, Z. Zhu, J. F. Stoddart and A. S. Duwez, Synthetic oligorotaxanes exert high forces when folding under mechanical load, Nat. Nanotechnol., 2017, 13, 209–213 CrossRef PubMed.
- A. Stylianou, S. V. Kontomaris, C. Grant and E. Alexandratou, Atomic force microscopy on biological materials related to pathological conditions, Scanning, 2019, 2019, 8452851 CrossRef PubMed.
- N. Mandriota, C. Friedsam, J. A. Jones-Molina, K. Tatem, D. E. Ingber and O. Sahin, Cellular Nanoscale Stiffness Patterns Governed by Intracellular Forces, Nat. Mater., 2019, 18, 1071–1077 CrossRef CAS PubMed.
- D. E. Ingber, Mechanobiology and diseases of mechanotransduction, Ann. Med., 2003, 35, 564–577 CrossRef PubMed.
- T. Fukuma and R. Garcia, Atomic- and Molecular-Resolution Mapping of Solid–Liquid Interfaces by 3D Atomic Force Microscopy, ACS Nano, 2018, 12, 11785–11797 CrossRef CAS PubMed.
- M. Radmacher, J. P. Cleveland, M. Fritz, H. G. Hansma and P. K. Hansma, Mapping interaction forces with the atomic force microscope, Biophys. J., 1994, 66, 2159–2165 CrossRef CAS PubMed.
- M. Radmacher, M. Fritz, C. M. Kacher, J. P. Cleveland and P. K. Hansma, Measuring the viscoelastic properties of human platelets with the atomic force microscope, Biophys. J., 1996, 70, 556–567 CrossRef CAS PubMed.
- S. N. Magonov and D. H. Reneker, Characterization of polymer surfaces with atomic force microscopy, Annu. Rev. Mater. Sci., 1997, 27, 175 CrossRef CAS.
- J. Tamayo and R. Garcia, Deformation, contact time and phase contrast in tapping mode scanning force microscopy, Langmuir, 1996, 12, 4430 CrossRef CAS.
- H. J. Butt, B. Cappella and M. Kappl, Force Measurements with the Atomic Force Microscope: Technique, Interpretation and Applications, Surf. Sci. Rep., 2005, 59, 1–152 CrossRef CAS.
- Y. F. Dufrene, D. Martinez-Martin, I. Medalsy, D. Alsteens and D. J. Muller, Multiparametric imaging of biological systems by force–distance curve-based AFM, Nat. Methods, 2013, 10, 847–854 CrossRef CAS PubMed.
- R. Garcia and E. T. Herruzo, The Emergence of Multifrequency Force Microscopy, Nat. Nanotechnol., 2012, 7, 217–226 CrossRef CAS PubMed.
- S. Zhang, H. Aslan, F. Besenbacher and M. Dong, Quantitative biomolecular imaging by dynamic nanomechanical mapping, Chem. Soc. Rev., 2014, 43, 7412–7429 RSC.
- M. Chyasnavichyus, S. L. Young and V. V. Tsukruk, Recent Advances in Micromechanical Characterization of Polymer, Biomaterial, and Cell Surfaces with Atomic Force Microscopy, Jpn. J. Appl. Phys., 2015, 54, 08LA02 CrossRef.
- J. P. Killgore and F. W. del Rio, Contact resonance force microscopy for viscoelastic property measurements: from fundamentals to state-of-the-art applications, Macromolecules, 2018, 51, 6977–6996 CrossRef CAS.
- S. Benaglia, V. G. Gisbert, A. P. Perrino, C. A. Amo and R. Garcia, Fast and High-Resolution Mapping of Elastic Properties of Biomolecules and Polymers with Bimodal AFM, Nat. Protoc., 2018, 13, 2890–2907 CrossRef CAS PubMed.
- A. Dazzi and C. Prater, AFM-IR: Technology and Applications in Nanoscale Infrared Spectroscopy and Chemical Imaging, Chem. Rev., 2017, 117, 5146–5173 CrossRef CAS PubMed.
- R. M. Overney, E. Meyer, J. Frommer, D. Brodbeck, R. Lüthi, L. Howald, H. J. Guntherodt, M. Fujihira, H. Takano and Y. Gotoh, Friction measurements on phase-separated thin films with a modified atomic force microscope, Nature, 1992, 359, 133–135 CrossRef CAS.
- C. A. Amo and R. Garcia, Fundamental High-Speed Limits in Single-Molecule, Single-Cell and Nanoscale Force Spectroscopies, ACS Nano, 2016, 10, 7117 CrossRef CAS PubMed.
- There are a variety of commercial names for force–volume software applications, among them, PeakForce QNM, FastForceMapping, PinPoint Nanomechanical mode or Quantitative Imaging QI.
- M. Stark, R. W. Stark, W. M. Heckl and R. Guckenberger, Inverting dynamic force microscopy: From signals to time-resolved interaction forces, Proc. Natl. Acad. Sci. U. S. A., 2002, 99, 8473–8478 CrossRef CAS PubMed.
- O. Sahin, S. Magonov, C. Su, C. F. Quate and O. Solgaard, An Atomic Force Microscope Tip Designed to Measure Time– Varying Nanomechanical Forces, Nat. Nanotechnol., 2007, 2, 507–514 CrossRef PubMed.
- R. Garcia, Amplitude Modulation AFM, Wiley-VCH, Weinheim, Germany, 2010 Search PubMed.
- T. R. Rodriguez and R. Garcia, Compositional mapping of surfaces in atomic force microscopy by excitation of the second normal mode of the microcantilever, Appl. Phys. Lett., 2004, 84, 449–451 CrossRef CAS.
- U. Rabe and W. Arnold, Acoustic microscopy by atomic force microscopy, Appl. Phys. Lett., 1994, 64, 1493 CrossRef.
- U. Rabe, K. Janser and W. Arnold, Vibrations of free and surface-coupled atomic force microscope cantilevers: Theory and experiment, Rev. Sci. Instrum., 1996, 67, 3281 CrossRef CAS.
- J. R. Lozano and R. Garcia, Theory of Phase Spectroscopy in Bimodal Atomic Force Microscopy, Phys. Rev. B: Condens. Matter Mater. Phys., 2009, 79, 1–9 CrossRef.
- H. Li, Y. Chen and L. Dai, Concentrated-mass cantilever enhances multiple harmonics in tapping-mode atomic force microscopy, Appl. Phys. Lett., 2008, 92, 151903 CrossRef.
- R. Garcia and A. San Paulo, Attractive and repulsive interaction regimes in tapping-mode atomic force microscopy, Phys. Rev. B: Condens. Matter Mater. Phys., 1999, 60, 4961 CrossRef CAS.
- R. Garcia and R. Perez, Dynamic AFM methods, Surf. Sci. Rep., 2002, 47, 197–302 CrossRef CAS.
- R. Garcia, C. J. Gomez, N. F. Martinez, S. Patile, C. Dietz and R. Magerle, Identification of Nanoscale Dissipation Processes by Dynamic Atomic Force Microscopy, Phys. Rev. Lett., 2006, 97, 016103 CrossRef CAS PubMed.
- J. E. Sader, T. Uchihashi, M. J. Higgins, A. Farrell, Y. Nakayama and S. P. Jarvis, Quantitative force measurements using frequency modulation atomic force microscopy-theoretical foundations, Nanotechnology, 2005, 16, S94 CrossRef CAS.
- L. D. Landau, E. M. Lifshitz, A. M. Kosevich and L. P. Pitaevskii, Theory of Elasticity, Butterworth-Heinemann, Oxford, 3rd edn, 1986 Search PubMed.
- N. W. Tschoegl, The Phenomenological Theory of Linear Viscoelastic Behavior: An Introduction, Springer Berlin Heidelberg, Berlin, Heidelberg, 1989 Search PubMed.
- K. L. Johnson, Contact Mechanics, Cambridge University Press, Cambridge, 1985 Search PubMed.
- P. D. Garcia and R. Garcia, Determination of the Elastic Moduli of a Single Cell Cultured on a Rigid Support by Force Microscopy, Biophys. J., 2018, 114, 2923–2932 CrossRef CAS PubMed.
- J. Israelachvili, Intermolecular and Surface Forces, Elsevier Academic Press, London, 2005 Search PubMed.
- I. N. Sneddon, The relation between load and penetration in the axisymmetric Boussinesq problem for a punch of arbitrary profile, Int. J. Eng. Sci., 1965, 3, 47–57 CrossRef.
- G. M. Pharr, W. C. Oliver and F. R. Brotzen, On the generality of the relationship among contact stiffness, contact area, and elastic modulus during indentation, J. Mater. Res., 1992, 7, 613–617 CrossRef CAS.
- E. H. Lee and J. R. M. Radok, The Contact Problem for Viscoelastic Bodies, J. Appl. Mech., 1960, 27, 438–444 CrossRef.
- P. D. Garcia, C. R. Guerrero and R. Garcia, Time-Resolved Nanomechanics of a Single Cell under the Depolymerization of the Cytoskeleton, Nanoscale, 2017, 9, 12051–12059 RSC.
- C. Zener, Elasticity and anelasticity of Metals, University of Chicago Press, Chicago, 1948 Search PubMed.
- P. Kollmannsberger and B. Fabry, Linear and Nonlinear Rheology of Living Cells, Annu. Rev. Mater. Res., 2011, 41, 75–97 CrossRef CAS.
- P. D. Garcia, C. R. Guerrero and R. Garcia, Nanorheology of living cells measured by AFM-based force–distance curves, Nanoscale, 2020, 12, 9133 RSC.
- B. V. Derjaguin, V. M. Muller and Y. P. Toporov, Effect of contact deformations on adhesion of particles, J. Colloid Interface Sci., 1975, 53, 314–326 CrossRef CAS.
- N. Gavara, Combined strategies for optimal detection of the contact point in AFM force–indentation curves obtained on thin samples and adherent cells, Sci. Rep., 2016, 6, 21267 CrossRef CAS PubMed.
- P. Attard, Measurement and interpretation of elastic and viscoelastic properties with the atomic force microscope, J. Phys.: Condens. Matter, 2007, 19, 473201 CrossRef.
- B. Rajabifar, J. M. Jadhav, D. Kiracofe, G. F. Meyers and A. Raman, Dynamic AFM on Viscoelastic Polymer Samples with Surface Forces, Macromolecules, 2018, 51, 9649–9661 CrossRef CAS.
- H. V. Guzman, P. D. Garcia and R. Garcia, Dynamic Force Microscopy Simulator (dForce): A Tool for Planning and Understanding Tapping and Bimodal AFM Experiments, Beilstein J. Nanotechnol., 2015, 6, 369–379 CrossRef CAS PubMed.
- J. Melcher, S. Hu and A. Raman, VEDA: A Web-Based Virtual Environment for Dynamic Atomic Force Microscopy, Rev. Sci. Instrum., 2008, 79, 061301 CrossRef PubMed.
- T. J. R. Hughes, The finite element method: linear static and dynamic finite element analysis, Dover Publications Inc., New York, 2000 Search PubMed.
- R. Vargas-Pinto, H. Gong, A. Vahabikashi and M. Johnson, The Effect of the Endothelial Cell Cortex on Atomic Force Microscopy Measurements, Biophys. J., 2013, 105, 300–309 CrossRef CAS PubMed.
- S. Vichare, S. Sen and M. M. Inamdar, Cellular mechanoadaptation to substrate mechanical properties: contributions of substrate stiffness and thickness to cell stiffness measurements using AFM, Soft Matter, 2014, 10, 1174–1181 RSC.
- C. Valero, B. Navarro, D. Navajas and J. M. García-Aznar, Finite element simulation for the mechanical characterization of soft biological materials by atomic force microscopy, J. Mech. Behav. Biomed. Mater., 2016, 62, 222–235 CrossRef CAS PubMed.
- J. R. Staunton, B. Doss, S. M. Lindsay and R. Ros, Correlating confocal microscopy and atomic force indentation reveals metastatic cancer cells stiffen during invasion into collagen I matrices, Sci. Rep., 2016, 6, 19686 CrossRef CAS PubMed.
- M. Galluzzi, G. Tang, C. S. Biswas, J. Zhao, S. Chen and F. J. Stadler, AFM methodology and AFMech suite software for nanomechanics on heterogenous soft materials, Nat. Commun., 2018, 9, 358464 Search PubMed.
- B. L. Doss, K. Rahmani Eliato, K. Lin and R. Ros, Quantitative Mechanical Analysis of Indentations on Layered, Soft Elastic Materials, Soft Matter, 2019, 15, 1776–1784 RSC.
- Y. M. Efremov, M. Velay-Lizancos, C. J. Weaver, A. I. Athamneh, P. D. Zavattieri, D. M. Suter and A. Raman, Anisotropy vs Isotropy in Living Cell Indentation with AFM, Sci. Rep., 2019, 9, 1–12 CrossRef CAS PubMed.
- P. D. Garcia, C. R. Guerrero and R. Garcia, Subsurface Imaging of Cell Organelles by Force Microscopy, ACS Nano, 2019, 13, 9629–9637 CrossRef PubMed.
- W. H. Roos, R. Bruinsma and G. J. L. Wuite, Physical virology, Nat. Phys., 2010, 6, 733 Search PubMed.
- C. Carrasco, A. Luque, M. Hernando-Pérez, R. Miranda, J. L. Carrascosa, P. A. Serena, M. de Ridder, A. Raman, J. Gómez-Herrero, I. A. T. Schaap, D. Reguera and P. J. de Pablo, Built-In Mechanical Stress in Viral Shell, Biophys. J., 2011, 100, 1100–1108 CrossRef CAS PubMed.
- C. Barth, A. S. Foster, C. R. Henry and A. L. Shluger, Recent Trends in Surface Characterization and Chemistry with High-Resolution Scanning Force Methods, Adv. Mater., 2011, 23, 477–501 CrossRef CAS PubMed.
- B. Reischl, M. Watkins and A. S. Foster, Free Energy Approaches for Modeling Atomic Force Microscopy in Liquids, J. Chem. Theory Comput., 2013, 9, 600–608 CrossRef CAS PubMed.
- Y. Sugimoto, A. Yurtsever, M. Abe, S. Morita, M. Ondracek, P. Pou and R. Pérez, Role of tip chemical reactivity on atom manipulation process in dynamic force microscopy, ACS Nano, 2013, 7, 7370–7376 CrossRef CAS PubMed.
- X. Hu, W. Nanney, K. Umeda, T. Ye and A. Martini, Combined Experimental and Simulation Study of Amplitude Modulation Atomic Force Microscopy Measurements of Self-Assembled Monolayers in Water, Langmuir, 2018, 34, 9627–9633 CrossRef CAS PubMed.
- B. Luan and M. O. Robbins, Contact of single asperities with varying adhesion: comparing continuum mechanics to atomistic simulations, Phys. Rev. E: Stat., Nonlinear, Soft Matter Phys., 2006, 74, 02611 Search PubMed.
- J. G. Vilhena, et al., Albumin (BSA) Adsorption over Graphene in Aqueous Environment: Influence of Orientation, Adsorption Protocol, and Solvent Treatment, Langmuir, 2016, 32, 1742–1755 CrossRef CAS PubMed.
- J. G. Vilhena, A. C. Dumitru, E. T. Herruzo, J. I. Mendieta-Moreno, R. Garcia, P. A. Serena and R. Perez, Adsorption orientations and immunological recognition of antibodies on graphene, Nanoscale, 2016, 8, 13463–13475 RSC.
- M. Martínez, C. D. Cooper, A. B. Poma and H. V. Guzman, Free energies of the disassembly of viral capsids from a multiscale molecular simulation approach, J. Chem. Inf. Model., 2019, 60, 974–981 CrossRef PubMed.
- N. F. Martinez, W. Kaminski, C. J. Gomez, C. Albonetti, F. Biscarini, R. Perez and R. Garcia, Molecular scale energy dissipation in oligothiophene monolayers measured by dynamic force microscopy, Nanotechnology, 2009, 20, 434021 CrossRef PubMed.
- F. Eghiaian, A. Rigato and S. Scheuring, Structural, Mechanical, and Dynamical Variability of the Actin Cortex in Living Cells, Biophys. J., 2015, 108, 1330–1340 CrossRef CAS PubMed.
- C. Kronlage, M. Schäfer-Herte, D. Böning, H. Oberleithner and J. Fels, Feeling for Filaments: Quantification of the Cortical Actin Web in Live Vascular Endothelium, Biophys. J., 2015, 109, 687–698 CrossRef CAS PubMed.
- M. Shibata, T. Uchibashi, T. Ando and R. Yasuda, Long-tip high-speed force microscopy for nanometer-scale imaging of live cells, Sci. Rep., 2015, 5, 8724 CrossRef CAS PubMed.
- E. Usukura, A. Narita, A. Yagi, S. Ito and J. Usukura, An unroofing method to observe the cytoskeleton directly at molecular resolution using atomic force microscopy, Sci. Rep., 2016, 6, 27472 CrossRef CAS PubMed.
- H. Schillers, et al., Standardized Nanomechanical Atomic Force Microscopy Procedure (SNAP) for Measuring Soft and Biological Samples, Sci. Rep., 2017, 7, 1–9 CrossRef CAS PubMed.
- C. T. Lim, E. H. Zhou and S. T. Quek, Mechanical models for living cells—a review, J. Biomech., 2006, 39, 195–216 CrossRef CAS PubMed.
- A. Dominguez-Bajo, A. González-Mayorga, C. R. Guerrero, F. J. Palomares, R. Garcia, E. Lopez-Dolado and M. C. Serrano, Myelinated axons and functional blood vessels populate mechanically compliant rGO foams in chronic cervical hemisected rats, Biomaterials, 2019, 192, 461–474 CrossRef CAS PubMed.
- E. T. Herruzo, A. P. Perrino and R. Garcia, Fast Nanomechanical Spectroscopy of Soft Matter, Nat. Commun., 2014, 5, 3126–3204 CrossRef PubMed.
- H. F. Boyer, Atlas of stress-strain curves, ASM International, 2002 Search PubMed.
- P. H. Wu, D. R. B. Aroush, A. Asnacios, W. C. Chen, M. E. Dokukin, B. L. Doss, P. Durand-Smet, A. Ekpenyong, J. Guck, N. V. Guz, P. A. Janmey, J. S. H. Lee, N. M. Moore, A. Ott, Y. Poh, R. Ros, M. Sander, I. Sokolov, J. R. Staunton and N. Wang, et al., A Comparison of Methods to Assess Cell Mechanical Properties, Nat. Methods, 2018, 15, 491–498 CrossRef CAS PubMed.
- E. Moeendarbary, L. Valon, M. Fritzsche, A. R. Harris, D. A. Moulding, A. J. Thrasher, E. Stride, L. Mahadevan and G. T. Charras, The Cytoplasm of Living Cells Behaves as a Poroelastic Material, Nat. Mater., 2013, 12, 253–261 CrossRef CAS PubMed.
- J. Alcaraz, L. Buscemi, M. Grabulosa, X. Trepat, B. Fabry, R. Farré and D. Navajas, Microrheology of Human Lung Epithelial Cells Measured by Atomic Force Microscopy, Biophys. J., 2003, 84, 2071–2079 CrossRef CAS PubMed.
- F. M. Hecht, J. Rheinlaender, N. Schierbaum, W. H. Goldmann, B. Fabry and T. E. Schaffer, Imaging viscoelastic properties of live cells by AFM: power-law rheology on the nanoscale, Soft Matter, 2015, 11, 4584–4591 RSC.
- 92 A. Rigato, A. Miyagi, S. Scheuring and F. Rico, High-Frequency Microrheology Reveals Cytoskeleton Dynamics in Living Cells, Nat. Phys., 2017, 13, 771–775 Search PubMed.
- B. R. Bruckner, H. Nöding and A. Janshoff, Viscoelastic Properties of Confluent MDCK II Cells Obtained from Force Cycle Experiments, Biophys. J., 2017, 112, 724–735 CrossRef PubMed.
- J. S. De Sousa, J. A. C. Santos, E. B. Barros, L. M. R. Alencar, W. T. Cruz, M. V. Ramos and J. Mendes-Filho, Analytical Model of Atomic-Force-Microscopy Force Curves in Viscoelastic Materials Exhibiting Power Law Relaxation, J. Appl. Phys., 2017, 121, 034901 CrossRef.
- P. D. Garcia and R. Garcia, Determination of the Viscoelastic Properties of a Single Cell Cultured on a Rigid Support by Force Microscopy, Nanoscale, 2018, 10, 19799–19809 RSC.
- Y. M. Efremov, T. Okajima and A. Raman, Measuring viscoelasticity of soft biological samples using atomic force microscopy, Soft Matter, 2019, 16, 64–81 RSC.
- J. S. de Sousa, R. S. Freire, F. D. Sousa, M. Radmacher, A. F. B. Silva, M. V. Ramos, A. C. O. Monteiro-Moreira, F. P. Mesquita, M. E. A. Moraes, R. C. Montenegro and C. L. N. Oliveira, Double power-law viscoelastic relaxation of living cells encodes motility trends, Sci. Rep., 2020, 10, 4749 CrossRef CAS PubMed.
- D. Martínez-Martín, G. Fläschner, B. Gaub, S. Martin, R. Newton, C. Beerli and D. J. Muller, Inertial picobalance reveals fast mass fluctuations in mammalian cells, Nature, 2017, 550, 500–505 CrossRef.
- E. K. Dimitriadis, F. Horkay, J. Maresca, B. Kachar and R. S. Chadwick, Determination of Elastic Moduli of Thin Layers of Soft Material Using the Atomic Force Microscope, Biophys. J., 2002, 82, 2798–2810 CrossRef CAS.
- N. Gavara and R. S. Chadwick, Determination of the elastic moduli of thin samples and adherent cells using conical AFM tips, Nat. Nanotechnol., 2012, 7, 733–736 CrossRef CAS PubMed.
- Y. Ding, J. Wang, G. K. Xu and G. F. Wang, Are elastic moduli of biological cells depth dependent or not? Another explanation using contact mechanics model with surface tension, Soft Matter, 2018, 14, 7434–7541 RSC.
- T. C. T. Ting, The Contact Stresses Between a Rigid Indenter and a Viscoelastic Half-Space, J. Appl. Mech., 1966, 33, 845–854 CrossRef.
- A. Rosa-Zeiser, E. Weilandt, S. Hild and O. Marti, The Simultaneous Measurement of Elastic, Electrostatic and Adhesive Properties by Scanning Force Microscopy: Pulsed – Force Mode Operation, Meas. Sci. Technol., 1997, 8, 1333–1338 CrossRef CAS.
- S. Krüger, D. Krüger and A. Janshoff, Scanning Force Microscopy Based Rapid Force Curve Acquisition on Supported Lipid Bilayers: Experiments and Simulations Using Pulsed Force Mode, ChemPhysChem, 2004, 5, 989–997 CrossRef PubMed.
- J. Shi, Y. Hu, S. Hu, J. Ma and C. Su, Method and Apparatus of Using Peak Force Tapping Mode to Measure Physical Properties of a Sample, US Pat., 8650660B2, 2014 Search PubMed.
- B. Pettinger, N. Erina and C. Su, Quantitative mechanical property mapping at the nanoscale with PeakForce QNM, Bruker Application note, 2012, 128.
- T. Igarashi, S. Fujinami, T. Nishi, N. Asao and K. Nakajima, Nanorheological Mapping of Rubbers by Atomic Force Microscopy, Macromolecules, 2013, 46, 1916–1922 CrossRef CAS.
- P. V. Kolluru, M. D. Eaton, D. W. Collinson, X. Cheng, D. E. Delgado, K. R. Shull and L. C. Brinson, AFM-based Dynamic Scanning Indentation (DSI) Method for Fast, High-resolution Spatial Mapping of Local Viscoelastic Properties in Soft Materials, Macromolecules, 2018, 51, 8964–8978 CrossRef CAS.
- D. Alsteens, V. Dupres, S. Yunus, J. P. Latgé, J. J. Heinisch and Y. F. Dufrêne, High-Resolution Imaging of Chemical and Biological Sites on Living Cells Using Peak Force Tapping Atomic Force Microscopy, Langmuir, 2012, 28, 16738–16744 CrossRef CAS PubMed.
- D. Alsteens, et al., Nanomechanical mapping of first binding steps of virus to animal cells, Nat. Nanotechnol., 2017, 12, 177 CrossRef CAS.
- I. Medalsy, U. Hensen and D. J. Muller, Imaging and Quantifying Chemical and Physical Properties of Native Proteins at Molecular Resolution by Force–Volume AFM, Angew. Chem., Int. Ed., 2011, 50, 12103–12108 CrossRef CAS PubMed.
- L. Wildling, B. Unterauer, R. Zhu, A. Rupprecht, T. Haselgrübler, C. Rank, A. Ebner, D. Vater, P. Pollheimer, E. Pohl, P. Hinterdorfer and H. J. Gruber, Linking of sensor molecules with amino groups to amino-functionalized AFM tips, Bioconjugate Chem., 2011, 22, 1239–1248 CrossRef CAS PubMed.
- P. Hinterdorfer, W. Baumgartner, H. J. Gruber and K. Schilcher, Detection and Localization of Individual Antibody – Antigen Recognition Events by Atomic Force Microscopy, Proc. Natl. Acad. Sci. U. S. A., 1996, 93, 3477–3481 CrossRef CAS PubMed.
- C. D. Frisbie, L. F. Rozsnyai, A. Noy, M. S. Wrighton and C. M. Lieber, Functional group imaging by chemical force microscopy, Science, 1994, 265, 2071–2074 CrossRef CAS PubMed.
- A. Noy, D. V. Vezenov and C. M. Lieber, Chemical force microscopy, Annu. Rev. Mater. Sci., 1997, 27, 381–421 CrossRef CAS.
- D. Alsteens, D. J. Müller and Y. F. Dufrene, Multiparametric Atomic Force Microscopy Imaging of Biomolecular and Cellular Systems, Acc. Chem. Res., 2017, 50, 924–931 CrossRef CAS PubMed.
- A. Noy and R. W. Friddle, Practical Single Molecule Force Spectroscoopy: How to Determine Fundamental Thermodynamic Parameters of Intermolecular Bonds with an Atomic Force Microscope, Methods, 2013, 60, 142–150 CrossRef CAS.
- D. Alsteens, M. Pfreundschuh, C. Zhang, P. M. Spoerri, S. R. Coughlin, B. K. Kobilka and D. J. Muller, Imaging G protein–coupled receptors while quantifying their ligand-binding free-energy landscape, Nat. Methods, 2015, 12, 845–851 CrossRef CAS PubMed.
- M. Pfreundschuh, D. Harder, Z. Ucurum, D. Fotiadis and D. J. Müller, Detecting Ligand-Binding Events and Free Energy Landscape while Imaging Membrane Receptors at Subnanometer Resolution, Nano Lett., 2017, 17, 3261–3269 CrossRef CAS PubMed.
- E. Evans and K. Ritchie, Dynamic Strength of Molecular Adhesion Bonds, Biophys. J., 1997, 72, 1541–1555 CrossRef CAS PubMed.
- M. E. Dokukin and I. Sokolov, Nanoscale compositional mapping of cells, tissues, and polymers with ringing mode of atomic force microscopy, Sci. Rep., 2017, 7, 11828 CrossRef CAS PubMed.
- N. Kodera, D. Yamamoto, R. Ishikawa and T. Ando, Video Imaging of Walking Myosin V by High-Speed Atomic Force Microscopy, Nature, 2010, 468, 72–76 CrossRef CAS PubMed.
- F. Rico, L. Gonzalez, I. Casuso, M. Puig-Vidal and S. Scheuring, High-speed force spectroscopy unfolds titin at the velocity of molecular dynamics simulations, Science, 2013, 342, 741–743 CrossRef CAS PubMed.
- A. P. Nievergelt, N. Banterle, S. H. Andany, P. Gonczy and G. E. Fantner, High-speed photothermal off-resonance atomic force microscopy reveals assembly routes of centriolar scaffold protein SAS-6, Nat. Nanotechnol., 2018, 13, 696 CrossRef CAS PubMed.
- M. R. Uhlig, C. A. Amo and R. Garcia, Dynamics of breaking intermolecular bonds in high-speed force spectroscopy, Nanoscale, 2018, 10, 17112 RSC.
- L. M. Rebêlo, J. S. de Sousa, J. Mendes Filho, J. Schäpe, H. Doschke and M. Radmacher, Microrheology of cells with magnetic force modulation atomic force microscopy, Soft Matter, 2014, 10, 2141–2149 RSC.
- M. Chyasnavichyus, S. L. Young and V. V. Tsukruk, Probing of Polymer Surfaces in the Viscoelastic Regime, Langmuir, 2014, 30, 10566 CrossRef CAS.
- Y. H. Chim, L. M. Mason, N. Rath, M. F. Olson, M. Tassieri and H. Yin, A one-step procedure to probe the viscoelastic properties of cells by Atomic Force Microscopy, Sci. Rep., 2018, 8, 14462 CrossRef PubMed.
- P. C. Nalam, N. N. Gosvami, M. A. Caporizzo, R. J. Composto and R. W. Carpick, Nanorheology of hydrogels using direct drive force modulation atomic force microscopy, Soft Matter, 2015, 11, 8165 RSC.
- F. M. Hecht, J. Rheinlaender, N. Schierbaum, W. H. Goldmann, B. Fabry and T. E. Schäffer, Imaging viscoelastic properties of live cells by AFM: power-law rheology on the nanoscale, Soft Matter, 2015, 11, 4584 RSC.
- S. D. Solares, Nanoscale Effects in the Characterization of Viscoelastic Materials with Atomic Force Microscopy: Coupling of a Quasi-Three-Dimensional Standard Linear Solid Model with in-Plane Surface Interactions, Beilstein J. Nanotechnol., 2016, 7, 554–571 CrossRef CAS PubMed.
- E. A. López-Guerra, B. Eslami and S. D. Solares, Calculation of standard viscoelastic responses with multiple retardation times through analysis of static force spectroscopy AFM data, J. Polym. Sci., Part B: Polym. Phys., 2017, 55, 804–813 CrossRef.
- C. H. Parvini, M. A. S. R. Saadi and S. D. Solares, Extracting Viscoelastic Material Parameters using an Atomic Force Microscope and Static Force Spectroscopy, Beilstein J. Nanotechnol., 2020, 11, 922–937 CrossRef CAS PubMed.
- Y. M. Efremov, W. H. Wang, S. D. Hardy, R. L. Geahlen and A. Raman, Measuring Nanoscale Viscoelastic Parameters of Cells Directly from AFM Force-Displacement Curves, Sci. Rep., 2017, 7, 1–14 CrossRef CAS PubMed.
- Y. M. Efremov, A. I. Shpichka, S. L. Kotova and P. S. Timashev, Viscoelastic mapping of cells based on fast force volume and PeakForce Tapping, Soft Matter, 2019, 15, 5455–5463 RSC.
- R. E. Mahaffy, C. K. Shih, F. C. MacKintosh and J. Käs, Scanning probe-based frequency-dependent microrheology of polymer gels and biological cells, Phys. Rev. Lett., 2000, 85, 880–883 CrossRef CAS PubMed.
- V. Vadillo-Rodriguez, T. J. Beveridge and J. R. Dutcher, Surface viscoelasticity of individual Gram-negative bacterial cells measured using atomic force microscopy, J. Bacteriol., 2008, 190, 4225–4232 CrossRef CAS PubMed.
- E. M. Darling, M. Topel, S. Zauscher, T. P. Vail and F. Guilak, Viscoelastic properties of human mesenchymally-derived stem cells and primary osteoblasts, chondrocytes, and adipocytes, J. Biomech., 2008, 41, 454–464 CrossRef PubMed.
- S. Moreno-Flores, R. Benitez, M. D. M. Vivanco and J. L. Toca-Herrera, Stress Relaxation and Creep on Living Cells with the Atomic Force Microscope: A Means to Calculate Elastic Moduli and Viscosities of Cell Components, Nanotechnology, 2010, 21, 445101 CrossRef PubMed.
- E. Ueda, X. Liang, M. Ito and K. Nakajima, Dynamic moduli mapping of silica-filled styrene-butadiene rubber vulanizate by nanorheological AFM, Macromolecules, 2019, 52, 311–319 CrossRef CAS.
- E. G. Herbet, W. C. Oliver and G. M. Pharr, Nanoindentation and dynamic characterization of viscoelastic solids, J. Phys. D: Appl. Phys., 2008, 41, 074021 CrossRef.
- S. R. Cohen and E. Kalfon–Cohen, E. Dynamic Nanoindentation by Instrumented Nanoindentation and Force Microscopy: a Comparative Review, Beilstein J. Nanotechnol., 2013, 4, 815–833 CrossRef CAS PubMed.
- N. Schierbaum, J. Rheinlaender and T. E. Schäffer, Viscoelastic properties of normal and cancerous human breast cells are affected differently by contact to adjacent cells, Acta Biomater., 2017, 55, 239–248 CrossRef CAS PubMed.
- A. Voss, R. W. Stark and C. Dietz, Surface versus Volume Properties on the Nanoscale: Elastomeric Polypropylene, Macromolecules, 2014, 47, 5236–5245 CrossRef CAS.
- X. Meng, H. Zhang, J. Song, X. Fan and L. Sun, Broad modulus range nanomechanical mapping by magnetic-drive soft probes, Nat. Commun., 2017, 8, 1944 CrossRef PubMed.
- A. Bahrami, C. Bailly and B. Nysten, Spatial resolution and property contrast in local mechanical mapping of polymer blends using AFM dynamic force spectroscopy, Polymer, 2019, 165, 180–190 CrossRef CAS.
- M. Lorenzoni, L. Evangelio, S. Verhaeghe, N. C. Nicolet, C. Navarro and F. Pérez-Murano, Assessing the Local Nanomechanical Properties of Self – Assembled Block Copolymer Thin Films by Peak Force Tapping, Langmuir, 2015, 31, 11630–11638 CrossRef CAS PubMed.
- D. W. Collinson, M. D. Eaton, K. R. Shull and L. C. Brinson, Deconvolution of Stress Interaction Effects from Atomic Force Spectroscopy Data across Polymer-Particle Interfaces, Macromolecules, 2019, 52, 8940–8955 CrossRef CAS.
- P. M. Claesson, I. Dobryden, G. Li, Y. He, H. Huang, P. A. Thoren and D. B. Haviland, From force curves to surface nanomechanical properties, Phys. Chem. Chem. Phys., 2017, 19, 23642 RSC.
- E. Limousin, D. E. Martinez-Tong, N. Ballard and J. M. Asua, Cure-Dependent Morphology of Acrylic/Alkyd Hybrid Latex Films via Nanomechanical Mapping, ACS Appl. Polym. Mater., 2019, 1, 2213–2223 CrossRef CAS.
- K. Hu, T. Wei, H. Li, C. He, H. Yang, T. P. Russell and D. Wang, Interfacial Broadening Kinetics between a Network and a Linear Polymer and Their Composites Prepared by Melt Blending, Macromolecules, 2019, 52, 9759–9765 CrossRef CAS.
- C. He, S. Sui, X. Wu, T. P. Russell and D. Wang, Atomic Force Microscopy Nanomechanical Mapping Visualizes Interfacial Broadening between Networks Due to Chemical Exchange Reactions, J. Am. Chem. Soc., 2018, 140, 6793–6796 CrossRef CAS PubMed.
- A. C. Dumitru, F. M. Espinosa, R. Garcia, G. Foschi, S. Tortorella, F. Valle, M. Dalavalle, F. Zerbetto and F. Biscarini, In situ nanomechanical characterization of the early stages of swelling and degradation of a biodegradable polymer, Nanoscale, 2018, 7, 5403–5410 RSC.
- L. Wang, H. Wang, M. Wagner, Y. Yan, D. S. Jakob and X. G. Xu, Nanoscale simultaneous chemical and mechanical imaging via peak force infrared microscopy, Sci. Adv., 2017, e1700255 CrossRef PubMed.
- L. Li, P. Zhang, J. Li, Y. Wang, Y. Wei, J. Hu, X. Zhou, B. Xu and B. Li, Measurement of nanomechanical properties of DNA molecules by PeakForce atomic force microscopy based on DNA origami, Nanoscale, 2019, 11, 4707–4711 RSC.
- A. Bestembayeva, A. Kramer, A. A. Labokha, D. Osmanović, I. Liashkovich, E. V. Orlova, I. J. Ford, G. Charras, A. Fassati and B. W. Hoogenboom, Nanoscale stiffness topography reveals structure and mechanics of the transport barrier in intact nuclear pore complexes, Nat. Nanotechnol., 2015, 10, 60–64 CrossRef CAS PubMed.
- G. Lamour, A. Allard, J. Pelta, S. Labdi, M. Lenz and C. Campillo, Mapping and modeling the nanomechanics of bare and protein-coated lipid nanotubes, Phys. Rev. X, 2020, 10, 011031 CAS.
- B. Gumí-Audenis, S. Illa-Tuset, N. Grimaldi, L. Pasquina-Lemonche, L. Ferrer-Tasies, F. Sanz, J. Veciana, I. Ratera, J. Faraudo, N. Ventosa and M. I. Giannotti, Insights into the structure and nanomechanics of a quatsome membrane by force spectroscopy measurements and molecular simulations, Nanoscale, 2018, 10, 23001–23011 RSC.
- M. Marchetti, G. J. L. Wuite and W. H. Roos, Atomic force microscopy observation and characterization of single virions and virus-like particles by nano-indentation, Curr. Opin. Virol., 2016, 18, 82–88 CrossRef CAS PubMed.
- P. J. de Pablo and I. A. T. Schaap, Atomic force microscopy of viruses, Atomic Force Microscopy of Viruses, in Physical Virology, ed. U. Greber, Advances in Experimental Medicine and Biology, Springer, 2019, vol. 1215, pp. 159–179 Search PubMed.
- C. Braunsmann, J. Seifert, J. Rheinlaender and T. Schaffer, High-speed force mapping on living cells with a small cantilever atomic force microscope, Rev. Sci. Instrum., 2014, 85, 073703 CrossRef.
- A. Rigato, F. Rico, F. Eghiaian, M. Piel and S. Scheuring, Atomic Force Microscopy Mechanical Mapping of Micropatterned Cells Shows Adhesion Geometry-Dependent Mechanical Response on Local and Global Scales, ACS Nano, 2015, 9, 5846–5856 CrossRef CAS PubMed.
- K. Beicker, E. T. O’Brien, M. R. Falvo and R. Superfine, Vertical Light Sheet Enhanced Side-View Imaging for AFM Cell Mechanics Studies, Sci. Rep., 2018, 8, 1504 CrossRef PubMed.
- A. Calzado-Martín, M. Encinar, J. Tamayo, M. Calleja and A. San Paulo, Effect of Actin Organization on the Stiffness of Living Breast Cancer Cells Revealed by Peak-Force Modulation Atomic Force Microscopy, ACS Nano, 2016, 10, 3365–3374 CrossRef PubMed.
- S. Karsch, D. Kong, J. Großhans and A. Janshoff, Single-Cell Defects Cause a Long-Range Mechanical Response in a Confluent Epithelial Cell Layer, Biophys. J., 2017, 113, 2601–2608 CrossRef CAS PubMed.
- A. C. Dumitru, M. A. Poncin, L. Conrard and Y. F. Dufrêne, Nanoscale membrane architecture of healthy and pathological red blood cells, Nanoscale Horiz., 2018, 3, 293–304 RSC.
- S. J. Baldwin, L. Kreplak and J. M. Lee, Characterization via atomic force microscopy of discrete plasticity in collagen fibrils from mechanically overloaded tendons: Nano-scale structural changes mimic rope failure, J. Mech. Behav. Biomed. Mater., 2016, 60, 356–366 CrossRef CAS PubMed.
- C. Formosa-Daguea, P. Spezialeb, T. J. Fosterc, J. A. Geogheganc and Y. F. Dufrêne, Zinc-dependent mechanical properties of Staphylococcus aureus biofilm-forming surface protein SasG, Proc. Natl. Acad. Sci. U. S. A., 2016, 113, 410–415 CrossRef PubMed.
- H. Marshall, S. Aguayo, M. Kilian, F. Petersen, L. Bozec and J. Brown, In-Vivo Relationship between the Nano-Biomechanical Properties of Streptococcal Polysaccharide Capsules and Virulence Phenotype, ACS Nano, 2020, 14, 1070–1083 CrossRef CAS PubMed.
- L. Stühn, A. Fritschen, J. Choy, M. Dehnert and C. Dietz, Nanomechanical sub-surface mapping of living biological cells by force microscopy, Nanoscale, 2019, 11, 13089–13097 RSC.
- N. Barois, E. Werkmeister, S. Divoux, F. Perez and F. Lafont, Stiffness tomography of eukaryotic intracellular compartments by atomic force microscopy, Nanoscale, 2019, 11, 10320–10328 RSC.
- A. G. Onaran, M. Balantekin, W. Lee, W. L. Hughes, B. A. Buchine, R. O. Guldiken, Z. Parlak, C. F. Quate and F. L. Degertekin, A new atomic force microscope probe with force sensing integrated readout and active tip, Rev. Sci. Instrum., 2006, 77, 023501 CrossRef.
- M. Balantekin, A. G. Onaran and F. L. Degertekin, Quantitative mechanical characterization of materials at the nanoscale through direct measurement of time-resolved tip–sample interaction forces, Nanotechnology, 2008, 19, 085704 CrossRef CAS PubMed.
- A. F. Sarioglu and O. Solgaard, Cantilevers with integrated sensor for time-resolved force measurements in tapping-mode atomic force microscopy, Appl. Phys. Lett., 2008, 93, 023114 CrossRef.
- A. F. Sarioglu, S. Magonov and O. Solgaard, Tapping-mode force spectroscopy using cantilevers with interferometric high-bandwidth force sensors, Appl. Phys. Lett., 2012, 100, 053109 CrossRef.
- J. Legleiter, M. Park, B. Cusick and T. Kowalewski, Scanning Probe Acceleration Microscopy (SPAM) in Fluids: Mapping Mechanical Properties of Surfaces at the Nanoscale, Proc. Natl. Acad. Sci. U. S. A., 2006, 103, 4813–4818 CrossRef CAS PubMed.
- M. H. Lee and W. H. Jhe, General Theory of Amplitude-Modulation Atomic Force Microscopy, Phys. Rev. Lett., 2006, 97, 036104 CrossRef PubMed.
- H. Holscher, Quantitative Measurement of Tip–Sample Interactions in Amplitude Modulation Atomic Force Microscopy, Appl. Phys. Lett., 2006, 89, 123109 CrossRef.
- A. J. Katan, M. H. van Es and T. H. Oosterkamp, Quantitative Force Versus Distance Measurements in Amplitude Modulation AFM: a Novel Force Inversion Technique, Nanotechnology, 2009, 20, 165703 CrossRef PubMed.
- D. Platz, D. Forchheimer, E. A. Tholén and D. B. Haviland, Interaction imaging with amplitude-dependence force spectroscopy, Nat. Commun., 2013, 4, 1360 CrossRef PubMed.
- G. Saraswat, P. Agarwal, G. Haugstad and M. V. Salapaka, Real-time probe based quantitative determination of material properties at the nanoscale, Nanotechnology, 2013, 24, 265706 CrossRef CAS PubMed.
- A. F. Payam, D. Martin-Jimenez and R. Garcia, Force reconstruction from tapping mode force microscopy experiments, Nanotechnology, 2015, 26, 1–12 CrossRef CAS PubMed.
- E. Meyer, H. J. Hug and R. Bennewitz, Scanning Probe Microscopy, Lab on a tip, Springer-Verlag, Berlin, 2004 Search PubMed.
- O. Sahin and N. Erina, High-resolution and large dynamic range nanomechanical mapping in tapping-mode atomic force microscopy, Nanotechnology, 2008, 19, 445717 CrossRef PubMed.
- A. Wang, K. Vijayraghavan, O. Solgaard and M. J. Butte, Fast Stiffness Mapping of Cells Using High-Bandwidth Atomic Force Microscopy, ACS Nano, 2016, 10, 257–264 CrossRef CAS PubMed.
- N. Shamitko-Klingensmith, K. M. Molchanoff, K. A. Burke, G. J. Magnone and J. Legleiter, Mapping the mechanical properties of cholesterol-containing supported lipid bilayers with nanoscale spatial resolution, Langmuir, 2012, 28, 13411–13422 CrossRef CAS PubMed.
- T. R. Rodriguez and R. Garcia, Tip motion in amplitude modulation (tapping-mode) atomic-force microscopy: Comparison between continuous and point-mass models, Appl. Phys. Lett., 2002, 80, 1646 CrossRef CAS.
- R. W. Stark, Spectroscopy of higher harmonics in dynamic atomic force microscopy, Nanotechnology, 2004, 15, 347 CrossRef CAS.
- V. Vahdat and R. W. Carpick, Practical Method to Limit Tip–Sample Contact Stress and Prevent Wear in Amplitude Modulation Atomic Force Microscopy, ACS Nano, 2013, 7, 9836–9850 CrossRef CAS PubMed.
- A. San Paulo and R. Garcia, High-resolution imaging of antibodies by tapping-mode atomic force microscopy: Attractive and repulsive tip–sample interaction regimes, Biophys. J., 2000, 78, 1599 CrossRef CAS PubMed.
- A. P. Perrino and R. Garcia, How Soft Is a Single Protein? The Stress–strain Curve of Antibody Pentamers with 5 pN and 50 pm Resolutions, Nanoscale, 2016, 8, 9151–9158 RSC.
- M. Penedo and H. J. Hug, Off-resonance intermittent contact mode multi-harmonic scanning force microscopy, Appl. Phys. Lett., 2018, 113, 023103 CrossRef.
- O. Sahin, G. Yaralioglu, R. Grow, S. F. Zappe, A. Atalar, C. Quate and O. Solgaard, High-resolution imaging of elastic properties using harmonic cantilevers, Sens. Actuators, A, 2004, 114, 183 CrossRef CAS.
- Y. Hou, C. Ma, W. Wang and Y. Chen, Binary coded cantilevers for enhancing multi-harmonic atomic force microscopy, Sens. Actuators, A, 2019, 300, 111668 CrossRef CAS.
- A. Keyvani, H. Sadeghian, M. S. Tamer, J. F. Loodewijk-Goosen and F. van Keulen, Minimizing tip–sample forces and enhancing sensitivity in atomic force microscopy with dynamically compliant cantilevers, J. Appl. Phys., 2017, 121, 244505 CrossRef.
- O. Sahin, Time-varying tip–sample force measurements and steady-state dynamics in tapping-mode atomic force microscopy, Phys. Rev. B: Condens. Matter Mater. Phys., 2008, 77, 115405 CrossRef.
- M. Dong, S. Husale and O. Sahin, Determination of Protein Structural Flexibility by Microsecond Force Spectroscopy, Nat. Nanotechnol., 2009, 4, 514–517 CrossRef CAS PubMed.
- L. Liu, Q. Li, S. Zhang, X. Wang, S. Hoffmann, J. Li, Z. Liu, F. Besenbacher and M. D. Dong, Identification of a Novel Parallel β-Strand Conformation within Molecular Monolayer of Amyloid Peptide, Adv. Sci., 2016, 3, 1500369 CrossRef PubMed.
- M. Dong and O. Sahin, A nanomechanical interface to rapid single-molecule interactions, Nat. Commun., 2011, 2, 247 CrossRef PubMed.
- Z. Jiang, S. Zhang, L. H. Klausen, J. Song, Q. Li, Z. Wang, B. T. Stokke, Y. Huang, F. Besenbacher, L. P. Nielsen and M. Dong, In vitro single-cell dissection revealing the interior structure of cable bacteria, Proc. Natl. Acad. Sci. U. S. A., 2018, 115, 8517–8522 CrossRef CAS PubMed.
- R. Garcia, Intracellular forces from stiffness, Nat. Mater., 2019, 18, 1037–1038 CrossRef CAS PubMed.
- S. Husale, H. J. Persson and O. Sahin, DNA nanomechanics allows direct digital detection of complementary DNA and microRNA targets, Nature, 2009, 462, 1075–1078 CrossRef CAS PubMed.
- H. Huang, I. Dobryden and P. A. Thoren, et al., Local surface mechanical properties of PDMS-silica nanocomposite probed with Intermodulation AFM, Compos. Sci. Technol., 2017, 150, 111–119 CrossRef CAS.
- D. Martin-Jimenez, E. Chacon, P. Tarazona and R. Garcia, Atomically resolved three-dimensional structures of electrolyte aqueous solutions near a solid surface, Nat. Commun., 2016, 7, 12164 CrossRef CAS PubMed.
- M. R. Uhlig, D. Martin-Jimenez and R. Garcia, Atomic-scale mapping of hydrophobic layers on graphene and few-layer MoS2 and WSe2 in water, Nat. Commun., 2019, 10, 2606 CrossRef PubMed.
- C. M. Stroh, H. Wang, R. Bash, B. Ashcroft, J. Nelson, H. Gruber, D. Lohr, S. M. Lindsay and P. Hinterdorfer, Single-molecule recognition imaging microscopy, Proc. Natl. Acad. Sci. U. S. A., 2004, 101, 12503 CrossRef CAS PubMed.
- J. Preiner, A. Ebner, L. Chtcheglova, R. Zhu and P. Hinterdorfer, Simultaneous topography and recognition imaging: physical aspects and optimal imaging conditions, Nanotechnology, 2009, 20, 215103 CrossRef PubMed.
- J. Preiner, N. S. Losilla, A. Ebner, P. Annibale, F. Biscarini, R. Garcia and P. Hinterdorfer, Imaging and detection of single molecule recognition events on organic semiconductor surfaces, Nano Lett., 2009, 9, 571 CrossRef CAS PubMed.
- Y. J. Oh, M. Koehler, Y. Lee, S. Mishra, J. W. Park and P. Hinterdorfer, Ultra-Sensitive and Label-Free Probing of Binding Affinity Using Recognition Imaging, Nano Lett., 2019, 19, 612–617 CrossRef CAS PubMed.
- M. Koehler, A. Fis, H. J. Gruber and P. Hinterdorfer, AFM-Based Force Spectroscopy Guided by Recognition Imaging: A New Mode for Mapping and Studying Interaction Sites at Low Lateral Density, Methods Protoc., 2019, 2, 6 CrossRef CAS PubMed.
- R. Garcia and R. Proksch, Nanomechanical Mapping of Soft Matter by Bimodal Force Microscopy, Eur. Polym. J., 2013, 49, 1897–1906 CrossRef CAS.
- C. Dietz, E. T. Herruzo, J. R. Lozano and R. Garcia, Nanomechanical coupling enables detection and imaging of 5 nm superparamagnetic particles in liquid, Nanotechnology, 2011, 22, 125708 CrossRef PubMed.
- C. Y. Lai, S. Santos and M. Chiesa, Systematic Multidimensional Quantification of Nanoscale Systems from Bimodal Atomic Force Microscopy Data, ACS Nano, 2016, 10, 6265–6272 CrossRef CAS PubMed.
- C. A. Amo, A. P. Perrino, A. F. Payam and R. Garcia, Mapping Elastic Properties of Heterogeneous Materials in Liquid with Angstrom-Scale Resolution, ACS Nano, 2017, 11, 8650 CrossRef CAS PubMed.
- M. Kocun, A. Labuda, W. Meinhold, I. Revenko and R. Proksch, Fast, High Resolution, and Wide Modulus Range Nanomechanical Mapping with Bimodal Tapping Mode, ACS Nano, 2017, 11, 10097–10105 CrossRef CAS PubMed.
- S. Benaglia, C. A. Amo and R. Garcia, Fast, quantitative and high resolution mapping of viscoelastic properties with bimodal AFM, Nanoscale, 2019, 11, 15289–15297 RSC.
- S. D. Solares and G. Chawla, Triple-frequency intermittent contact atomic force microscopy characterization: Simultaneous topographical, phase, and frequency shift contrast in ambient air, J. Appl. Phys., 2010, 108, 054901 CrossRef.
- S. Kawai, T. Glatzel, S. Koch, B. Such, A. Baratoff and E. Meyer, Ultrasensitive Detection of Lateral Atomic-Scale Interactions on Graphite (0001) via Bimodal Dynamic Force Measurements, Phys. Rev. B: Condens. Matter Mater. Phys., 2010, 81, 085420 CrossRef.
- C. Dietz, Sensing In-Plane Nanomechanical Surface and Sub-Surface Properties of Polymers: Local Shear Stress as Function of the Indentation Depth, Nanoscale, 2018, 10, 460–468 RSC.
- Y. Naitoh, R. Turanský, J. Brndiar, Y. J. Li, I. Štich and Y. Sugawara, Subatomic-Scale Force Vector Mapping above a Ge(001) Dimer Using Bimodal Atomic Force Microscopy, Nat. Phys., 2017, 13, 663–667 Search PubMed.
- J. R. Lozano and R. Garcia, Theory of Multifrequency Atomic Force Microscopy, Phys. Rev. Lett., 2008, 100, 8–11 CrossRef PubMed.
- S. Kawai, T. Glatzel, S. Koch, B. Such, A. Baratoff and E. Meyer, Systematic Achievement of Improved Atomic-Scale Contrast via Bimodal Dynamic Force Microscopy, Phys. Rev. Lett., 2009, 103, 220801 CrossRef PubMed.
- A. Labuda, M. Kocun, W. Meinhold, D. Walters and R. Proksch, Generalized Hertz Model for Bimodal Nanomechanical Mapping, Beilstein J. Nanotechnol., 2016, 7, 970–982 CrossRef CAS PubMed.
- R. Proksch, Multifrequency, repulsive-mode amplitude-modulated atomic force microscopy, Appl. Phys. Lett., 2006, 89, 1–4 CrossRef.
- N. F. Martinez, S. Patil, J. R. Lozano and R. Garcia, Enhanced Compositional Sensitivity in Atomic Force Microscopy by the Excitation of the First Two Flexural Modes, Appl. Phys. Lett., 2006, 89, 153115 CrossRef.
- D. Ebeling, B. Eslami and S. D. Solares, Visualizing the subsurface of soft matter: Simultaneous topographical imaging, depth modulation, and compositional mapping with triple frequency atomic force microscopy, ACS Nano, 2013, 7, 10387–10396 CrossRef CAS PubMed.
- S. D. Solares, Challenges and complexities of multifrequency atomic force microscopy in liquid environments, Beilstein J. Nanotechnol., 2014, 5, 298–307 CrossRef CAS PubMed.
- S. M. Ang, S. D. Solares, S. Santos and D. Ebeling, Energy transfer between eigenmodes in multimodal atomic force microscopy, Nanotechnology, 2014, 25, 47501 Search PubMed.
- B. Eslami and M. Damircheli, Biharmonic versus bimodal AFM: Numerical and experimental study on soft matter, J. Appl. Phys., 2019, 126, 09530 CrossRef.
- M. Damircheli and B. Eslami, Enhancing phase contrast for bimodal AFM imaging in low quality factor environments, Ultramicroscopy, 2019, 204, 18–26 CrossRef CAS PubMed.
- C. Dietz, M. Schulze, A. Voss, C. Riesch and R. W. Stark, Bimodal frequency-modulated atomic force microscopy with small cantilevers, Nanoscale, 2015, 7, 1849–1856 RSC.
- D. Forchheimer, R. Forchheimer and D. B. Haviland, Improving image contrast and material discrimination with nonlinear response in bimodal atomic force microscopy, Nat. Commun., 2015, 6, 6270 CrossRef CAS PubMed.
- C. Y. Lai, V. Barcons, S. Santos and M. Chiesa, Periodicity in bimodal atomic force microscopy, J. Appl. Phys., 2015, 118, 044905 CrossRef.
- M. G. Ruppert and S. O. R. Moheimani, High-bandwidth multimode self-sensing in bimodal atomic force microscopy, Beilstein J. Nanotechnol., 2016, 7, 284–295 CrossRef CAS PubMed.
- D. S. Wastl, A. J. Weymouth, T. Arai and F. J. Giessibl, Amplitude dependence of image quality in atomically-resolved bimodal atomic force microscopy, Appl. Phys. Lett., 2016, 109, 141603 CrossRef.
- S. Shi, D. Guo and J. Luo, Enhanced phase and amplitude image contrasts of polymers in bimodal atomic force microscopy, RSC Adv., 2017, 7, 11768–11776 RSC.
- A. Bubendorf, S. Walheim, T. Schimmel and E. Meyer, A robust AFM-based method for locally measuring the elasticity of samples, Beilstein J. Nanotechnol., 2018, 9, 1–10 CrossRef CAS PubMed.
- R. Garcia, V. G. Gisbert and C. A. Amo, Bimodal method and system for quantifying long-range interactions and properties in atomic force microscopy, PCT/ES2020/070154.
- A. Knoll, R. Magerle and G. Krausch, Tapping Mode Atomic Force Microscopy on Polymers: Where Is the True Sample Surface?, Macromolecules, 2001, 34, 4159–4165 CrossRef CAS.
- D. J. Muller and A. Engel, The height of biomolecules measured with the atomic force microscope depends on electrostatic interactions, Biophys. J., 1997, 73, 1633–1644 CrossRef CAS.
- S. Santos, V. Barcons, H. K. Cristenson, J. Font and N. H. Thomson, The Intrinsic Resolution Limit in the Atomic Force Microscope: Implications for Heights of Nano-Scale Features, PLoS One, 2011, 6, e23821 CrossRef CAS PubMed.
- R. Giridharagopal, L.-Q. Flagg, J. S. Harrison, M. E. Ziffer, J. Onorato, C. K. Luscombe and D. S. Ginger, Electrochemical Strain Microscopy Probes Morphology-Induced Variations in Ion Uptake and Performance in Organic Electrochemical Transistors, Nat. Mater., 2017, 16, 1–6 CrossRef PubMed.
- V. Shalabaeva, A. C. Bas, M. Piedrahita-Bello, K. Ridier, L. Salmon, C. Thibault, W. Nicolazzi, G. Molnár and A. Bousseksou, Direct Visualization of Local Spin Transition Behaviors in Thin Molecular Films by Bimodal AFM, Small, 2019, 15, 1903892 CrossRef CAS PubMed.
- E. N. Athanasopoulou, N. Nianias, Q. K. Ong and F. Stellacci, Bimodal Atomic Force Microscopy for the Characterization of Thiolated Self-Assembled Monolayers, Nanoscale, 2018, 10, 23027–23036 RSC.
- H. K. Nguyen, M. Ito and K. Nakajima, Elastic and Viscoelastic Characterization of Inhomogeneous Polymers by Bimodal Atomic Force Microscopy, Jpn. J. Appl. Phys., 2016, 55, 08NB06 CrossRef.
- M. F. Dupont, A. Elbourne and E. Mayes, Measuring the mechanical properties of flexible crystals using bi-modal atomic force microscopy, Phys. Chem. Chem. Phys., 2019, 21, 20219–20224 RSC.
- Y. Li, C. Yu, Y. Gan, P. Jiang, J. Yu, Y. Ou, D. F. Zou, C. Huang, J. Wang, T. Jia, Q. Luo, X. F. Yu, H. Zhao, C. F. Gao and J. Li, Mapping the Elastic Properties of Two-Dimensional MoS2 via Bimodal Atomic Force Microscopy and Finite Element Simulation, npj Comput. Mater., 2018, 4, 49 CrossRef.
- J. Y. Lu, T. Olukan and S. R. Tamalampudi, Insights into graphene wettability transparency by locally probing its surface free energy, Nanoscale, 2019, 11, 7944–7951 RSC.
- Z. Al-Rekabi and S. Contera, Multifrequency AFM Reveals Lipid Membrane Mechanical Properties and the Effect of Cholesterol in Modulating Viscoelasticity, Proc. Natl. Acad. Sci. U. S. A., 2018, 115, 2658–2663 CrossRef CAS PubMed.
- W. Trewby, J. Faraudo and K. Voïtchovsky, Long-Lived Ionic Nano-Domains Can Modulate the Stiffness of Soft Interfaces, Nanoscale, 2019, 11, 4376–4384 RSC.
- M. E. F. Brollo, A. Dominguez-Bajo, A. Tabero, V. Domínguez-Arca, V. G. Gisbert, G. Prieto, C. Johansson, R. Garcia, A. Villanueva, M. C. Serrano and M. P. Morales, Combined Magnetoliposome Formation and Drug Loading in One Step for Efficient AC-Magnetic Field Remote Controlled Drug Release, ACS Appl. Mater. Interfaces, 2020, 12, 4295–4307 CrossRef PubMed.
- G. Lamour, C. K. Yip, H. Li and J. Gsponer, High Intrinsic Mechanical Flexibility of Mouse Prion Nanofibrils Revealed by Measurements of Axial and Radial Young's Moduli, ACS Nano, 2014, 8, 3851–3861 CrossRef CAS PubMed.
- J. Gilbert, M. Charnley, C. Cheng and N. P. Reynolds, Quantifying Young's moduli of protein fibrils and particles with bimodal force spectroscopy, Biointerphases, 2017, 12, 041001 CrossRef PubMed.
- K. Bose, C. J. Lech, B. Heddi and A. T. Phan, High-resolution AFM structure of DNA G-wires in aqueous solution, Nat. Commun., 2018, 9, 1959 CrossRef PubMed.
- Y. Sun, L. H. Vu, N. Chew, Z. Puthucheary, M. E. Cove and K. A. Zeng, Study of Perturbations in Structure and Elastic Modulus of Bone Microconstituents Using Bimodal Amplitude Modulated-Frequency Modulated Atomic Force Microscopy, ACS Biomater. Sci. Eng., 2019, 5, 478–486 CrossRef CAS.
- I. González-Domínguez, S. Gutiérrez-Granados, L. Cervera, F. Gòdia and N. Domingo, Identification of HIV-1–Based Virus-like Particles by Multifrequency Atomic Force Microscopy, Biophys. J., 2016, 111, 1173–1179 CrossRef PubMed.
- A. X. Cartagena-Rivera, W. H. Wang, R. L. Geahlen and A. Raman, Fast, Multi-Frequency, and Quantitative Nanomechanical Mapping of Live Cells Using the Atomic Force Microscope, Sci. Rep., 2015, 5, 1–11 Search PubMed.
- D. Guan, E. Charlaix, R. Z. Qi and P. Tong, Noncontact Viscoelastic Imaging of Living Cells Using a Long-Needle Atomic Force Microscope with Dual-Frequency Modulation, Phys. Rev. Appl., 2017, 8, 1–6 Search PubMed.
- B. J. Rodriguez, C. Callahan, S. V. Kalinin and R. Proksch, Dual-frequency resonance-tracking atomic force microscopy, Nanotechnology, 2007, 18, 475504 CrossRef.
- D. Nowak, W. Morrison1, H. K. Wickramasinghe, J. Jahng, E. Potma, L. Wan, R. Ruiz, T. R. Albrecht, K. Schmidt, J. Frommer, D. P. Sanders and S. Park, Nanoscale chemical imaging by photoinduced force microscopy, Sci. Adv., 2016, 2, e1501571 CrossRef PubMed.
- A. Ambrosio, R. C. Devlin, F. Capasso and W. L. Wilson, Observation of Nanoscale Refractive Index Contrast via Photoinduced Force Microscopy, ACS Photonics, 2017, 4, 846–851 CrossRef CAS.
- M. Penedo, S. Hormeño, P. Prieto, R. Alvaro, J. Anguita, F. Briones and M. Luna, Selective enhancement of individual cantilever high resonance modes, Nanotechnology, 2015, 26, 485706 CrossRef PubMed.
- A. B. Arı, M. Ç. Karakan, C. Yanık, İ. İ. Kaya and M. S. Hanay, Intermodal coupling as a probe for detecting nanomechanical modes, Phys. Rev. Appl., 2018, 9, 034024 CrossRef.
- R. Potekin, S. Dharmasen, H. Keuma, X. Jiang, J. Lee, S. Kim, L. A. Bergman, A. F. Vakakis and H. Cho, Multi-frequency Atomic Force Microscopy based on enhanced internal resonance of an inner-paddled cantilever, Sens. Actuators, A, 2018, 273, 206–220 CrossRef CAS.
- D. M. Harcombe, M. G. Ruppert, M. R. P. Ragazzon, S. O. Reza Moheimani and A. J. Flemming, A review of demodulation techniques for multifrequency atomic force microscopy, Beilstein J. Nanotechnol., 2020, 11, 76–91 CrossRef CAS.
- U. Rabe, S. Amelio, M. Kopycinska, S. Hirsekorn, M. Kempf, M. Göken and W. Arnold, Imaging and measurement of local mechanical material properties by atomic force acoustic microscopy, Surf. Interface Anal., 2002, 33, 65–70 CrossRef CAS.
- A. Raman, S. Trigueros, A. Cartagena, A. P. Z. Stevenson, M. Susilo, E. Nauman and S. A. Contera, Mapping Nanomechanical Properties of Live Cells Using Multi-Harmonic Atomic Force Microscopy, Nat. Nanotechnol., 2011, 6, 809–814 CrossRef CAS PubMed.
- M. R. P. Ragazzon, J. T. Gravdahl and K. Y. Pettersen, Model-Based Identification of Nanomechanical Properties in Atomic Force Microscopy, IEEE Trans. Control Syst. Technol., 2019, 27, 2045–2047 Search PubMed.
- A. Briggs, G. A. D. Briggs and O. V. Kolosov, Acoustic microscopy, Oxford University Press, 2010 Search PubMed.
- G. Stan and S. D. Solares, Frequency, amplitude, and phase measurements in contact resonance atomic force microscopies, Beilstein J. Nanotechnol., 2014, 5, 278–288 CrossRef CAS PubMed.
- P. A. Yuya, D. C. Hurley and J. A. Turner, Contact-resonance atomic force microscopy for viscoelasticity, J. Appl. Phys., 2008, 104, 074916 CrossRef.
- J. P. Killgore, D. G. Yablon, A. H. Tsou, A. Gannepalli, P. A. Yuya, J. A. Turner, R. Proksch and D. C. Hurley, Viscoelastic Property Mapping with Contact Resonance Force Microscopy, Langmuir, 2011, 27, 13983–13987 CrossRef CAS PubMed.
- G. Stan, S. D. Solares, B. Pittenger, N. Erina and C. Su, Nanoscale mechanics by tomographic contact resonance atomic force microscopy, Nanoscale, 2014, 6, 962–969 RSC.
- D. Passeri, A. Bettucci, M. Germano, M. Rossi, A. Alippi, S. Orlanducci, M. L. Terranova and M. Ciavarella, Effect of tip geometry on local indentation modulus measurement via atomic force acoustic microscopy technique, Rev. Sci. Instrum., 2005, 76, 093904 CrossRef.
- G. S. Shekhawat and V. P. Dravid, Nanoscale imaging of buried structures via scanning near-filed ultrasound holography, Science, 2005, 310, 89 CrossRef CAS PubMed.
- L. Tetard, A. Passian and T. Thundat, New Modes for Subsurface Atomic Force Microscopy through Nanomechanical Coupling, Nat. Nanotechnol., 2010, 5, 105–109 CrossRef CAS PubMed.
- P. Vitry, R. Rebois, E. Bourillot, A. Deniset-Besseau, M. J. Virolle, E. Lesniewska and A. Dazzi, Combining infrared and mode synthesizing atomic force microscopy: Application to the study of lipid vesicles inside Streptomyces bacteria, Nano Res., 2016, 9, 1674–1681 CrossRef CAS.
- M. Soliman, J. Ding and L. Tetard, Nanoscale subsurface imaging, J. Phys.: Condens. Matter, 2017, 29, 173001 CrossRef CAS PubMed.
- R. Garcia, Probe microscopy: Images from below the surface, Nat. Nanotechnol., 2010, 5, 101–102 CrossRef CAS PubMed.
- G. J. Verbiest and M. J. Rost, Beating beats mixing in heterodyne detection schemes, Nat. Commun., 2015, 6, 6444 CrossRef CAS PubMed.
- G. J. Verbiest, J. N. Simon, T. H. Oosterkamp and M. J. Rost, Subsurface atomic force microscopy: towards a quantitative understanding, Nanotechnology, 2012, 23, 145704 CrossRef CAS PubMed.
- Y. M. Efremov, A. X. Cartagena-Rivera, A. I. M. Athamneh, D. M. Suterr and A. Raman, Mapping heterogeneity of cellular mechanics by multi-harmonic atomic force microscopy, Nat. Protoc., 2018, 13, 2200–2216 CrossRef CAS PubMed.
- N. H. Shaik, R. G. Reifenberger and A. Raman, Nanomechancial mapping in air or vacuum using mult-harmonic signals in tapping mode AFM, Nanotechnology, 2020 DOI:10.1088/1361-6528/ab9390.
- A. X. Cartagena-Rivera, W. H. Wang, R. L. Geahlen and A. Raman, Fast, Multi-Frequency, and Quantitative Nanomechanical Mapping of Live Cells Using the Atomic Force Microscope, Sci. Rep., 2015, 5, 1–11 Search PubMed.
- M. O. Krisenko, A. Cartagena, A. Raman and R. L. Geahlen, Nanomechanical property maps of breast cancer cells as determined by multiharmonic atomic force microscopy reveal Syk-dependent changes in microtubule stability mediated by MAP1B, Biochemistry, 2015, 54, 60–68 CrossRef CAS PubMed.
- A. Cartagena, M. Hernando-Pérez, J. L. Carrascosa, P. J. de Pablo and A. Raman, Mapping in vitro local material properties of intact and disrupted virions at high resolution using multi-harmonic atomic force microscopy, Nanoscale, 2013, 5, 4729–4736 RSC.
- D. A. Chernoff, High resolution chemical mapping using tapping mode AFM with phase contrast, Proceedings of Microscopy and Microanalysis, Jones and Begell, New York, 1995, pp. 888–889 Search PubMed.
- G. Bar, Y. Thomann and M. H. Whangbo, Characterization of the morphologies and nanostructures of blends of polystyrene-block-poly(ethane-co-but-1-ene)-blocl-polystyrene with isotactic and atactic polypropylenes by tapping-mode AFM, Langmuir, 1998, 14, 1219 CrossRef CAS.
- P. Leclère, A. Calderone, D. Marsitzky, V. Francke, Y. Geerts, K. Müllen, J. L. Brédas and R. Lazzaroni, Highly Regular Organization of Conjugated Polymer Chains via Block Copolymer Self-Assembly, Adv. Mater., 2000, 12, 1042–1046 CrossRef.
- G. Reiter, G. Castelein, J. U. Sommer, A. Röttele and T. Thurn-Albrecht, Direct visualization of random crystallization and melting in arrays of nanometer-size polymer crystals, Phys. Rev. Lett., 2001, 87, 226101 CrossRef CAS PubMed.
- G. Krausch and R. Magerle, Nanostructured thin films via self-assembly of block copolymers, Adv. Mater., 2002, 14, 1579 CrossRef CAS.
- D. Sundrani, S. B. Darling and S. J. Sibener, Guiding to perfection: Macroscopi alignment of nanoscale domains, Nano Lett., 2004, 4, 273–276 CrossRef CAS.
- A. Knoll, R. Magerle and G. Krausch, Phase behavior in thin films of cylinder-forming block copolymers: experiments, J. Chem. Phys., 2004, 120, 1105–1116 CrossRef CAS PubMed.
- A. San Paulo and R. Garcia, Tip–Surface Forces, Amplitude, and Energy Dissipation in Amplitude-Modulation (Tapping Mode) Force Microscopy, Phys. Rev. B: Condens. Matter Mater. Phys., 2001, 64, 193411 CrossRef.
- J. Tamayo and R. Garcia, Effects of elastic and inelastic interactions on phase contrast images in tapping-mode scanning force microscopy, Appl. Phys. Lett., 1997, 71, 2394 CrossRef CAS.
- J. Tamayo and R. Garcia, Relationship between phase shift and energy dissipation in tapping-mode scanning force microscopy, Appl. Phys. Lett., 1998, 73, 2926 CrossRef CAS.
- J. P. Cleveland, B. Anczykowski, A. E. Schmid and V. B. Elings, Energy dissipation in tapping-mode atomic force microscopy, Appl. Phys. Lett., 1998, 72, 2613 CrossRef CAS.
- S. N. Magonov, V. Elings and M. H. Whangbo, Phase imaging and stiffness in tapping-mode atomic force microscopy, Surf. Sci., 1997, 375, L385 CrossRef CAS.
- R. Brandsch, G. Bar and M. H. Whangbo, On the factors affecting the contrast of height and phase images in tapping mode atomic force microscopy, Langmuir, 1997, 13, 6349 CrossRef CAS.
- R. Garcia, J. Tamayo, M. Calleja and F. Garcia, Phase contrast in tapping-mode scanning force microscopy, Appl. Phys. A: Mater. Sci. Process., 1998, 66, S312 Search PubMed.
- O. P. Behrend, L. Odoni, J. L. Loubet and N. A. Burnham, Phase imaging: deep or superficial?, Appl. Phys. Lett., 1999, 75, 2551 CrossRef CAS.
- M. Stark, C. Moller, D. J. Muller and R. Guckenberger, From images to interactions: High-resolution phase imaging in tapping-mode atomic force microscopy, Biophys. J., 2001, 80, 3009 CrossRef CAS PubMed.
- P. J. James, M. Atognozzi, J. Tamayo, T. J. McMaster, J. M. Newton and M. J. Miles, Interpretation of contrast in tapping mode AFM and shear force microscopy, A study of Nafion, Langmuir, 2001, 17, 349 CrossRef CAS.
- K. Schröter, A. Petzold, T. Henze and T. Thurn-Albrecht, Quantitative analysis of scanning force microscopy data using harmonic models, Macromolecules, 2009, 42, 1114 CrossRef.
- Y. Zhao, Q. Cheng, M. Qian and J. H. Cantrell, Phase image contrast mechanism in intermittent contact atomic force microscopy, J. Appl. Phys., 2010, 108, 094311 CrossRef.
- J. Tamayo, Energy dissipation in tapping-mode scanning force microscopy with low quality factors, Appl. Phys. Lett., 1999, 75, 3569–3571 CrossRef CAS.
- J. Melcher, X. Xu, A. Raman, C. Carrasco-Pulido, J. Gomez-Herrero, P. J. de Pablo and J. L. Carrascosa, Origins of phase contrast in the atomic force microscope in liquids, Proc. Natl. Acad. Sci. U. S. A., 2009, 106, 13655 CrossRef CAS PubMed.
- A. F. Payam, J. R. Ramos and R. Garcia, Molecular and Nanoscale Compositional Contrast of Soft Matter in Liquid: Interplay between Elastic and Dissipative Interactions, ACS Nano, 2012, 6, 4663–4670 CrossRef CAS PubMed.
- B. Anczykowski, B. Gotsman, H. Fuchs, J. P. Cleveland and V. B. Elings, How to measure energy dissipation in dynamic mode atomic force microscopy, Appl. Surf. Sci., 1999, 140, 376 CrossRef CAS.
- N. F. Martinez and R. Garcia, Measuring phase shifts and energy dissipation with amplitude modulation atomic force microscopy, Nanotechnology, 2006, 17, S167 CrossRef CAS PubMed.
- E. Sahagun, P. Garcia-Mochales, G. M. Sacha and J. J. Saenz, Energy dissipation due to capillary interactions: Hydrophobicity maps in force microscopy, Phys. Rev. Lett., 2007, 98, 176106 CrossRef.
- C. J. Gomez and R. Garcia, Determination and simulation of nanoscale energy dissipation processes in amplitude modulation AFM, Ultramicroscopy, 2010, 110, 626–633 CrossRef CAS PubMed.
- S. Santos, V. Barcons, A. Verdaguer, J. Font, N. H. Thomson and M. Chiesa, How localized are energy dissipation processes in nanoscale interactions?, Nanotechnology, 2011, 22, 345401 CrossRef PubMed.
- D. Wang, X. B. Liang, Y. H. Liu, T. Nishi and K. Nakajima, Characterization of Surface Viscoelasticity and Energy Dissipation in a Polymer Film by Atomic Force Microscopy, Macromolecules, 2011, 44, 8693–8697 CrossRef CAS.
- F. Lavini, F. Cellini, M. Rejhon, J. Kunc, C. Berger, W. de Heer and E. Riedo, Atomic Force Microscopy Phase Imaging of Epitaxial Graphene films, J. Phys.: Mater., 2020, 3, 024005 Search PubMed.
- R. Proksch and D. G. Yablon, Loss tangent imaging: Theory and simulations of repulsive-mode tapping atomic force microscopy, Appl. Phys. Lett., 2012, 100, 073106 CrossRef.
- R. Proksch, M. Kocun, D. C. Hurley, M. Viani, A. Labuda, W. Meinhold and J. Bemis, Practical Loss Tangent Imaging with Amplitude-Modulated Atomic Force Microscopy, J. Appl. Phys., 2016, 119, 134901 CrossRef.
- E. C. Spitzner, C. Riesch and R. Magerle, Subsurface Imaging of Soft Polymeric Materials with Nanoscale Resolution, ACS Nano, 2011, 5, 315–320 CrossRef CAS PubMed.
- M. Dehnert, E. C. Spitzner, F. Beckert and R. Magerle, Subsurface Imaging of Functionalized and Polymer-Grafted Graphene Oxide, Macromolecules, 2016, 49, 7415–7425 CrossRef CAS.
- E. C. Spitzner, S. Röper, M. Zerson, A. Bernstein and R. Magerle, Nanoscale Swelling Heterogeneities in Type I Collagen Fibrils, ACS Nano, 2015, 9, 5683–5694 CrossRef CAS PubMed.
- M. R. Uhlig and R. Magerle, Unraveling Capillary Interaction and Viscoelastic Response in Atomic Force Microscopy of Hydrated Collagen Fibrils, Nanoscale, 2017, 9, 1244–1256 RSC.
- H. K. Nguyen, X. Liang, M. Ito and K. Nakajima, Direct Mapping of Nanoscale Viscoelastic Dynamics at Nanofiller/Polymer Interfaces, Macromolecules, 2018, 51, 6085–6091 CrossRef CAS.
- H. K. Nguyen, M. Ito, S. Fujinami and K. Nakajima, Viscolasticity of inhomogenous polymers characterized by loss tangent measurements using AFM, Macromolecules, 2014, 47, 7971–7977 CrossRef CAS.
- J. G. Raybin, J. G. Murphy, M. Dolejsi and S. J. Sibener, Direct Imaging of Interfacial Fluctuations in Confined Block Copolymer with in Situ Slow-Scan-Disabled Atomic Force Microscopy, ACS Nano, 2019, 13, 11741–11752 CrossRef CAS PubMed.
- G. L. Alharbe, R. A. Register and J. K. Hobbs, Orientation Control and Crystallization in a Soft Confined Phase Separated block copolymer, Macromolecules, 2017, 50, 987–996 CrossRef.
- J. Raybin, J. Ren, X. Chen, R. Gronheid, P. F. Nealey and S. J. Sibener, Real-time atomic force microscopy imaging of block copolymer directed self assembly, Nano Lett., 2017, 17, 7717–7723 CrossRef CAS PubMed.
- Y. Kikuchi, N. Obana, M. Toyofuku, N. Kodera, T. Soma, T. Ando, Y. Fukumori and T. Nomura, Diversity of physical properties of bacterial extracellular membrane vesicles revealed through atomic force microscopy phase imaging, Nanoscale, 2020, 12, 7950–7959 RSC.
- D. J. Muller, J. B. Heymann, F. Oesterhelt, C. Moller and H. Gaub, G. and A. Engel, Atomic force microscopy of native purple membrane, Biochim. Biophys. Acta, 2000, 1460, 27–38 CrossRef CAS.
- J. L. Hutter and J. Bechhoefer, Calibration of atomic-force microscope tips, Rev. Sci. Instrum., 1993, 64, 1868 CrossRef CAS.
- H. J. Butt and M. Jaschke, Calculation of thermal noise in atomic force microscopy, Nanotechnology, 1995, 6, 1–7 CrossRef.
- S. M. Cook, T. E. Schäffer, K. M. Chynoweth, M. Wigton, R. W. Simmonds and K. M. Lang, Practical implementation of dynamic methods for measuring atomic force microscope cantilever spring constants, Nanotechnology, 2006, 17, 2135–2145 CrossRef CAS.
- J. E. Sader, R. Borgani, C. T. Gibson, D. B. Haviland, M. J. Higgins, J. I. Kilpatrick, J. Lu, P. Mulvaney, C. J. Shearer, A. D. Slattery, P.-A. Thorén, J. Tran, H. Zhang, H. Zhang and T. Zheng, A virtual instrument to standardise the calibration of atomic force microscope cantilevers, Rev. Sci. Instrum., 2016, 87, 093711 CrossRef PubMed.
- J. R. Lozano, D. Kiracofe, J. Melcher, R. Garcia and A. Raman, Calibration of higher eigenmode spring constants of atomic force microscope cantilevers, Nanotechnology, 2010, 21, 465502 CrossRef PubMed.
- A. Labuda, M. Kocun, M. Lysy, T. Walsh, J. Meinhold, T. Proksch, W. Meinhold, C. Anderson and R. Proksch, Calibration of Higher Eigenmodes of Cantilevers, Rev. Sci. Instrum., 2016, 87, 073705 CrossRef PubMed.
- J. Liu, J. K. Notbohm, R. W. Carpick and K. T. Turner, Method for characterizing nanoscale wear of atomic force microscope tips, ACS Nano, 2010, 4, 3763–3772 CrossRef CAS PubMed.
- S. Santos, L. Guang, T. Souier, K. Gadelrab, M. Chiesa and N. H. A. Thomson, Method to Provide Rapid in Situ Determination of Tip Radius in Dynamic Atomic Force Microscopy, Rev. Sci. Instrum., 2012, 83, 043707 CrossRef PubMed.
- M. Li, N. Xi, Y. Wong and L. Liu, Advances in atomic force microscopy for single-cell analysis, Nano Res., 2019, 12, 703–714 CrossRef CAS.
- D. R. Chery, B. Han, Q. Li, Y. Zhou, S. J. Heo, B. Kwok, P. Chandrasekaran, C. Wang, L. Qin, L. D. Kong, M. Enomoto-Iwamoto, R. L. Mauck and L. Han, Early Changes in Cartilage Pericellular Matrix Micromechanobiology Portend the Onset of Post-Traumatic Osteoarthritis, Acta Biomater., 2020, 111, 267–278 CrossRef CAS PubMed.
- I. Jorba, J. J. Uriarte, N. Campillo, R. Farre and D. Navajas, Probing micromechanical properties of the extracellular matrix of soft tissues by AFM, J. Cell Phys., 2016, 232, 19–26 CrossRef PubMed.
- B. Han, et al., Decorin regulates teh aggrecan network integrity and biomechanical functions of cartilage extracellular matrix, ACS Nano, 2019, 13, 11320–11333 CrossRef CAS PubMed.
- R. P. Chartoff, J. D. Menczel and S. H. Dillman, Dynamic mechanical analysis (DMA), ed. J. D. Menczel and R. B. Prime, Thermal Analysis of Polymers, John Wiley & Sons, Inc, Hoboken, New Jersey, 2009, pp. 387–495 Search PubMed.
- J. D. Ferry, Viscoelastic properteis of polymers, John Wiley & Sons, 3rd edn, 1980 Search PubMed.
- J. B. Pethica, R. Hutchings and W. C. Oliver, Hardness measurement at penetration depths as small as 20 nm, Philos. Mag. A, 1983, 48, 593–606 CrossRef CAS.
- P. Schön, K. Molnár, P. Markus, B. Pukánszky and G. J. Vancso, Quantitative mapping of elastic moduli at the nanoscale in phase separated polyurethanes by AFM, Eur. Polym. J., 2011, 47, 692–698 CrossRef.
- M. E. Dokukin and I. Sokolov, Quantitative mapping of the elastic modulus of soft materials with HarmoniX and PeakForce QNM AFM modes, Langmuir, 2012, 28, 16060–16071 CrossRef CAS PubMed.
- T. J. Young, T. J. M. A. Monclus, T. L. Burnett, W. R. Broughton, S. L. Ogin and P. A. Smith., The use of the PeakForce™ quantitative nanomechanical mapping AFM-based method for high-resolution Young's modulus measurement of polymers, Meas. Sci. Technol., 2011, 22, 125703 CrossRef.
- B. Pittenger, S. Osechinskiy, D. Yablon and T. Mueller, Nanoscale DMA with the atomic force microscope: A new method for measuring viscoelastic properties of nanostructured polymer materials, JOM, 2019, 71, 3390–3398 CrossRef.
- M. E. Dokukin and I. Sokolov, On the Measurements of Rigidity Modulus of Soft Materials in Nanoindentation Experiments at Small Depth, Macromolecules, 2012, 45, 4277–4288 CrossRef CAS.
- M. Griepentrog, G. Kramer and B. Cappella, Comparison of nanoindentation and AFM methods for the determination of mechanical properties of polymers, Polym. Test., 2013, 32, 455–460 CrossRef CAS.
- H. Askes and E. C. Aifantis, Gradient elasticity in statics and dynamics: an overview of formulations, length scale identification procedures, finite element implementations and new results, Int. J. Solids Struct., 2011, 48, 1962–1990 CrossRef.
- M. Li, L. Liu, X. Xiao, N. Xi and Y. Wang, Viscoelastic properties measurement of human lymphocites by AFM based on magnetic beads cell isolation, IEEE Trans. NanoBiosci., 2016, 15, 1236–1241 Search PubMed.
- H. T. Nia, I. S. Bozchalooi, Y. Li, L. Han, H. H. Hung, E. Frank, K. Youcemi-Toumi, C. Ortiz and A. Grodzinsky, High-Bandwidth AFM-Based Rheology Reveals that Cartilage is Most Sensitive to High Loading Rates at Early Stages of Impairment, Biophys. J., 2013, 104, 1529–1537 CrossRef CAS PubMed.
- B. Han, H. T. Nia, C. Wang, P. Chandrasekaran, Q. Li, D. R. Chery, H. Li, A. J. Grodzinsky and L. Han, AFM-Nanomechanical Test: An Interdisciplinary Tool That Links the Understanding of Cartilage and Meniscus Biomechanics, Osteoarthritis Degeneration, and Tissue Engineering, ACS Biomater. Sci. Eng., 2017, 3, 2033–2049 CrossRef CAS PubMed.
- V. G. Gisbert, S. Benaglia, M. R. Uhlig, R. Proksch and R. Garcia, private communication.
- R. E. Wilusz, L. E. DeFrate and F. Guilak, Immunofluorescence-guided atomic force microscopy to measure the micromechanical properties of the perinuclear matrix of porcine articular cartilage, J. R. Soc., Interface, 2012, 9, 2997–3007 CrossRef CAS PubMed.
- S. W. Hell, Microscopy and its focal switch, Nat. Methods, 2009, 6, 24–32 CrossRef CAS PubMed.
- S. V. Kalinin, E. Strelcov, A. Belianinov, S. Somnath, R. K. Vasudevan, E. J. Lingerfelt, R. K. Archibald, C. Chen, R. Proksch, N. Laanait and S. Jesse, Big, Deep, and Smart Data in Scanning Probe Microscopy, ACS Nano, 2016, 10, 9068–9086 CrossRef CAS PubMed.
- S. Santos, C. Y. Lai, T. Olukan and M. Chiesa, Multifrequency AFM: from origins to convergence, Nanoscale, 2017, 9, 5038–5043 RSC.
- I. Sokolov, M. E. Dokukin, V. Kalaparthi, M. Miljkovica, A. Wanga, J. D. Seigned, P. Grivase and E. Demidenkof, Noninvasive diagnostic imaging using machine-learning analysis of nanoresolution images of cell surfaces: Detection of bladder cancer, Proc. Natl. Acad. Sci. U. S. A., 2018, 115, 12920–12925 CrossRef CAS PubMed.
- C. Y. Lai, S. Santos and M. Chiesa, Machine learning assisted quantification of graphitic surfaces exposure to defined environments, Appl. Phys. Lett., 2019, 114, 241601 CrossRef.
| This journal is © The Royal Society of Chemistry 2020 |