 Open Access Article
Molecular spectroscopy of aqueous solutions: a theoretical perspective
Tommaso
Giovannini†
 ,
Franco
Egidi
 and
Chiara
Cappelli
 *
*
Scuola Normale Superiore, Piazza dei Cavalieri 7, I-56126 Pisa, Italy. E-mail: chiara.cappelli@sns.it
First published on 3rd August 2020
Abstract
Computational spectroscopy is an invaluable tool to both accurately reproduce the spectra of molecular systems and provide a rationalization for the underlying physics. However, the inherent difficulty to accurately model systems in aqueous solutions, owing to water's high polarity and ability to form hydrogen bonds, has severely hampered the development of the field. In this tutorial review we present a technique developed and tested in recent years based on a fully atomistic and polarizable classical modeling of water coupled with a quantum mechanical description of the solute. Thanks to its unparalleled accuracy and versatility, this method can change the perspective of computational and experimental chemists alike.
Key learning points(1) Highlight the importance of including solvent effects for a reliable theoretical modeling of spectra of aqueous solutions.(2) Expose the drawbacks of current established methods for the calculation of spectra of aqueous systems. (3) Highlight the characteristics that a theoretical model of molecular system dissolved in aqueous solution should include to achieve a direct comparison between theory and experiments. (4) Guideline for readers through the current status of computable properties/spectroscopies by exploiting the presented strategy. (5) Current challenges and perspectives of computational spectroscopy of aqueous solutions. |
1 Introduction
Since its foundations, the field of computational chemistry has expanded in scope, and thanks to both technological and methodological advances it has become an indispensable tool in most other fields of chemical research. Of particular interest is the development of computational methods for the modeling of spectral properties of molecular systems. In fact, spectroscopic techniques can be used to probe molecular properties directly, as opposed to bulk features which pertain to the solution as a whole. As such, within the field of molecular spectroscopy, experimental and computational methods are highly synergistic and when taken together they constitute an extremely powerful approach to explore and interpret molecular properties and behaviors, and describe them in terms of structural motifs and patterns.The theoretical modeling of molecular spectroscopy is rooted in quantum mechanics (QM). A wide variety of techniques for the accurate description of the spectroscopic response that can be induced upon isolated molecules (i.e. in the gas phase) have been extensively explored over the years, offering many distinct levels of compromise between accuracy and computational cost. Despite the huge success and widespread availability of such algorithms, most actual chemistry happens in the condensed phase, both in the laboratory and in the world around us. A specifically relevant case is that of aqueous solutions. The primacy of water as a chemical environment is due to both its ubiquity and its extraordinary properties.1,2 Water covers over 70% of Earth's surface, it is the environment where almost all known biological processes take place, it is a crucial player in the field of environmental chemistry, and it has gained the moniker of “universal solvent” thanks to its unmatched solvation properties which have earned it a supreme status in all fields of chemistry. The peculiar chemical properties that single out water as such a unique substance affect systems dissolved within it in ways that can be just as profound.3,4 This fact can be readily appreciated by probing the spectroscopic response of a molecule in water and comparing it with the same measurement performed on the isolated system, or even on the same substance dissolved in a different solvent. Differences are often striking, as the properties of molecule in aqueous solution can be drastically different than those of the isolated system. Accordingly, theoretical models developed to reproduce the properties of isolated molecules to a high degree of accuracy often lose their predictive power when they are blindly applied to the problem of modeling aqueous solutions, unless special care is taken to account for all relevant solute–solvent interactions. Therefore the necessity of developing reliable and accurate algorithms to model the effect of the aqueous environment on calculated spectral quantities has strongly emerged, in order to allow a direct comparison between computed and experimental data. However, due the nature of spectral signals, and their deep connection with the electronic structure of the probed system, it would in principle be compulsory to resort to a QM description of the whole system, i.e. both the solute and its solvation environment. This poses serious issues, given the enormous number of degrees of freedom that would need to be treated. Also, given the variety of interactions at play between a target molecule and water and the range of properties that can be investigated (from electronic spectroscopies, such as absorption or fluorescence, to vibrational spectroscopies, such as IR and Raman, to mixed electric–magnetic–vibrational spectroscopies) the reliable modeling of the spectroscopy of molecules in aqueous media would be unaffordable. Luckily, this is not the case.
2 How to build a reliable model for the spectroscopy of aqueous solutions
2.1 Definition of the system
When compared to a computational simulation of the spectral outcome for an isolated molecule, the same calculation for aqueous systems is considerably more difficult. The difficulties inherent to this undertaking present themselves at the very first conceptual step of the calculation: how would one define the chemical system? For isolated molecules such definition is straightforward, because the actual molecule constitutes a clearly defined model, with an unambiguous boundary. For molecules in aqueous solution (or any other solvent medium) the definition of the system is not trivial. In order to capture solute–solvent interactions, a sizable portion of matter needs to be considered, because a single solute molecule with only a few proximate solvent molecules is not physically consistent with the actual solution.5 On the other hand, it is unfeasible to treat a very large portion of matter describing a solution at the relatively high computational level necessary to calculate spectral properties, which is unavoidably based on the machinery of quantum chemistry.It should be emphasized that, contrary to bulk properties such as specific heat or isothermal compressibility, which are characteristics of the whole solution, the origin of a spectral response remains the solute, not the solution. For instance, the vibrational absorption spectrum of an amino acid will present the characteristic bands associated with amide vibrations, both in the gas phase and in solution. But water can drastically affect both frequencies and intensities of such bands, because long and short range interactions are constantly present between the solute and the solvent, and in the case of water hydrogen bonds can form between, for instance, water and the carbonyl groups of a molecule, which chemically bind the two systems. Likewise, a π–π* absorption band of an aromatic molecule can be readily identified in both the gas-phase and solution spectra, however water can produce vast solvatochromic shifts, which we wish to be able to model computationally.
These considerations help to explain why the most successful answer to these problems has been found within the realm of focused models:6,7 there, the focus is always the molecule, which is accurately described in all its degrees of freedom, whereas the solvent is treated at a lower level of sophistication. This partition can be very successful because it focuses on accurately reproducing the solute–solvent interactions, and thus the effect of the solvent on the spectrum, rather than the properties of the solvent itself. These models have enjoyed great success in modern chemical research because they can be effectively coupled with all QM descriptions, ranging from semi-empirical methods to Density Functional Theory (DFT) or Wavefunction Theory, at computational costs almost identical to those of the corresponding QM calculation for the isolated molecule.
In focused models, the evaluation of spectroscopic responses requires a QM description of the solute, whereas the solvent can be treated classically. This greatly reduces the number of degrees of freedom that need to be considered in the QM calculation, therefore the dimensionality of the QM problem does not substantially increase compared to the same simulation performed on an isolated chromophore. The solute–solvent interaction then enters the solute's QM Hamiltonian through explicit terms; this permits to exploit the machinery of quantum chemistry to obtain the desired spectral signals in the same way as they are calculated for isolated systems, i.e. without having to substantially modify the theoretical apparatus. Therefore, one can take full advantage of decades of research and development in the field performed on isolated systems.
2.2 Focused models for aqueous solutions
The use of a focused model starts with the choice of how to demarcate the separation between the solute and the solvent. Different choices are possible, with the main possibilities schematically represented in Fig. 1 and outlined below. The simplest is to include in the solute moiety only the target molecule and treat the bulk of the solvent classically. A popular choice is to “smear” the aqueous environment and treat it as a classical polarizable dielectric continuum, while the QM portion sits in a molecule-shaped cavity carved within it (see Fig. 1, left). The most popular approach of this class is the polarizable continuum model (PCM),5 which has allowed to extend the calculation of most molecular properties from the vacuum to the solvated phase without increasing the computational cost of the simulations. Water's ability to form hydrogen bonds, however, cannot be captured by continuum models, which lose all atomistic details.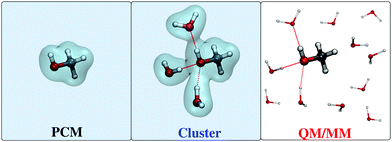 | ||
| Fig. 1 Schematic representation of continuum models (left), cluster or supermolecule models (middle), and QM/MM approaches (right) for treating molecular systems in aqueous solutions. | ||
Hydrogen bonding effects might in principle still be modeled within a continuum model framework by including a few explicit water molecules in the QM portion (see Fig. 1, middle). This approach defines the so-called cluster (or supermolecule) models.8 This full-quantum treatment of the nearest water molecules in principle assures that both the directional nature of a hydrogen bond and its covalent contribution are treated, however this still relies on a static description of the system, whereas in reality water moves about around the solute and a physically correct picture should not neglect the fact that the system is but an ensemble of many different configurations that may have varying spectroscopic properties. In fact, even though the positions of the explicit water molecules may be optimized to obtain a minimum-energy-structure, many such structures may be obtained in principle because of the high flexibility of the system, but none of them taken singularly can be representative of the whole. Therefore, such cluster models should be used with much care.
The limitations of both continuum and cluster models are more easily overcome by restoring the solvent's full atomistic detail, while still discarding its electronic degrees of freedom, in other words to treat the solvent molecules with classical molecular mechanics (MM). Such a choice defines a QM/MM approach for solvation (see Fig. 1, right).9,10
2.3 QM/MM approaches to the spectroscopy of aqueous systems
Conceptually, the formulation of a successful QM/MM model to reliably describe the spectroscopy of molecules in aqueous solutions requires the approach to adhere to the physics and chemistry of the aqueous system. Empirical models that are formulated simply to fit a certain system's behavior without being based on the underlying solute–solvent interactions, by contrast, may be very successful in reproducing a specific type of spectroscopic response of a limited set of systems, but cannot hope to be transferable. If we seek a model that can be safely applied to all types of spectroscopies and to a wide class of solutes, we must make sure that the model accounts for the specificity of water–solute interactions. This not an easy task, however it may be achieved by following the strategy that is sketched in the next sections.| E = EQM + EMM + EQM/MM | (1) |
 | (2) |
Different QM/MM approaches can be hierarchically classified based on how EeleQM/MM and EpolQM/MM in eqn (2) are formulated. In particular, the two main classes of methods introduced in the previous sections are thus identified:
• Electrostatic Embedding (EE): eqn (2) is limited to the first term only (EeleQM/MM), i.e.:
 | (3) |
In particular, the MM portion, and the resulting QM/MM electrostatic interaction energy, is represented by means of a set of fixed charges, placed on the MM atoms, which interact with the QM density. In eqn (3) the index i runs over the number of charges Nq, and Vi(ρ) is the QM electric potential calculated at the i-th charge qi placed in the MM portion. EeleQM/MM(ρQM) is expressed in terms of Coulomb's law, and it is explicitly dependent on the QM density, ρQM.
• Polarizable Embedding (PE): the interaction between the QM density and the MM portion is refined by accounting for the mutual polarization between the two moieties. Practically, this means that the coupling between the two portions is expressed as:
 | (4) |
The various PE approaches which have been proposed in the literature differ in the way they define the polarization energy EpolQM/MM in terms of the QM density ρQM. In particular, they prescribe different specifications for the electrostatic quantities x and the QM electric sources s, both employed to represent the MM portion. For instance, in the PE, MMPol and AMOEBA approaches3,12–15 the solvent charge distribution is approximated through the dipolar term only, therefore x = μ while s is in all cases the electric field generated by the QM solute. The QM density, therefore, generates an electric field E which polarizes the surrounding water molecules, changing their dipoles μ. Water molecules, in turn, polarize the QM density, and the mutual interaction enters the QM Hamiltonian through the energy term −μ·E.
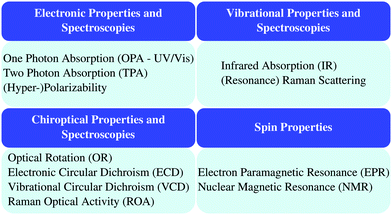 | ||
| Fig. 2 Properties and spectroscopies treatable by means of QM/FQ approach (see ref. 11, 16, 18 and 21–23). | ||
Both methods properly account of molecule–water mutual polarization and due to their unique formulation they can be readily extended to the calculation of molecular properties/spectra.
In this framework, each solvent atom is endowed with a charge q (and possibly dipole μ) which can “fluctuate”, i.e. it can dynamically respond to the presence of the solute.16 Charges can be further constrained so that each water molecule remains overall electrically neutral. For the QM/FQ or QM/FQFμ approaches, eqn (4) reads:17
 | (5) |
A remarkable difference between QM/FQ and QM/FQFμ and the other PE approaches mentioned in the previous section stands in the definition of the electrostatic energy term. The interaction energy is defined in terms of fluctuating charges and dipoles whereas in the case of other polarizable embedding schemes solvent polarization is limited to the dipolar term only (see also ref. 3, 6 and 12–14 for more details).
The simplest way to correct QM/MM energies for non-electrostatic interactions is to resort to ad hoc terms such as the Lennard-Jones potential, which is routinely and successfully used within the context of MD. However, this strategy is unsuitable to computational spectroscopy because spectral quantities are evaluated from response equations, which are related to energy derivatives. Therefore, constant terms which are simply added to the energy do not propagate to response equations/derivatives and have no effect to the resulting spectra.
A variety of approaches have been proposed to overcome this limitation. These include the Effective Fragment Potential (EFP),25 Polarizable Density Embedding (PDE)26 and QM/Gaussian Electrostatic Model (GEM).27 Most of these approaches are intended to only include repulsion effects, and are mainly focused at correcting energies. A remarkable exception to the above methods is given by the extensions of QM/FQ and QM/FQFμ to treat non-electrostatic terms which we have proposed in recent years and suitably extended to treat aqueous solutions.28 This approach models quantum repulsion in a pragmatic way as a function of an auxiliary density on the MM portion, while QM/MM dispersion interactions are described by extending the DFT approach by Tkatchenko and Scheffler, developed within different contexts.29,30 As a result, van der Waals terms directly affect the QM wavefunction and, as a consequence, computed spectral properties. Remarkably, this approach can be easily coupled to any kind of QM/MM model, because repulsion and dispersion are formulated in a way which is totally independent of the choice of the electrostatic/polarizable force field (i.e. based on fixed-charges or any kind of polarizable embedding).
To end this discussion, it is worth noticing that in any QM/MM approach, solute and solvent are not allowed to exchange charge, thus charge transfer interactions are neglected. To the best of our knowledge, methods to solve such an issue have never been investigated, based on the assumption that such terms are small in most cases.
2.4 Extension to non-aqueous media
All QM/MM models share the need to define and numerically determine a set of parameters to describe the interaction energy between the two portions of the system. The number of parameters as well as their nature depend on the QM/MM model. FQ and FQFμ are specified in terms of atomic electronegativities, hardnesses, and polarizabilities (the latter only applying to FQFμ).16,17 Any set of parameters specifies a given solvent (water for instance), i.e. they are independent of the solute and/or the spectral observable; therefore, the parametrization is transferable. Of course, changing the model's parameters results in a variation of the degree of polarization that the solute can induce on the surrounding solvent molecules; this directly affects the spectral response of the solute. Similar considerations also apply to non-electrostatic effects, whereupon the underlying model is expressed in terms of different parameters.28FQ and FQFμ models are by definition general approaches, which can appropriately capture the physics of any kind of medium. The modeling of a specific environment (e.g. water or other solvents) requires appropriate parametrization, i.e. the definition of specific values of atomic electronegativities, hardnesses, and polarizabilities. This may be achieved by fitting the calculated values of selected observables (e.g. interaction or total energies) with respect to reference data sets. The latter can be obtained from full ab initio calculations on representative structures, e.g. solvent clusters of different size. Such a strategy has been followed to parametrize FQ and FQFμ for aqueous solutions, and can easily be extended to other solvents. Non-electrostatic terms can be parametrized in a similar way, by extending to a given non-aqueous medium what we have proposed for water.28
3 Computational protocol
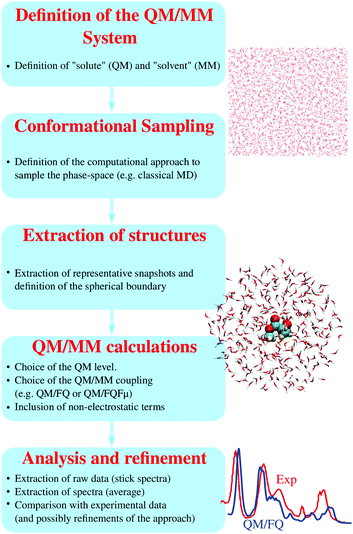
On the basis of the discussion reported in the previous sections, it should be clear that effective QM/MM simulations of spectral properties of aqueous systems require that the diverse physical interactions between the target molecule and the aqueous environment are consistently considered and transferred to computed spectra. This may be achieved trough a series of steps, which constitute the protocol that we propose (see Fig. 3). It is worth remarking that a careful choice and tuning of all parameters involved in all steps crucially determine the quality of the final simulated spectra.(1) Step 1. Definition of the QM/MM system: the part of the system to be treated as the “solute” (QM portion), and that defined as the “solvent” (MM portion), need to be defined. The definition may change depending on the system's chemical properties, its potential interactions with the surrounding aqueous environment, and the final spectral property to be modelled. The boundary between the two moieties (i.e. the QM/MM boundary) is defined accordingly.
(2) Step 2. Conformational sampling: the target system may generally be a rigid, semi-rigid, or flexible molecule. A highly rigid structure may reasonably be modelled by freezing its geometry into a minimum energy structure (possibly optimized at a given QM level). On the contrary, for flexible molecules, the configurational space needs to be reliably sampled. In addition, a reliable sampling of water configurations around the solute it is of the outmost importance. An effective way of sampling the phase space of a given aqueous solution consists of resorting to (classical) MD, where temperature and pressure are chosen to mirror the desired experimental setup. For this step one needs to choose a program to perform the simulations and also define a parametrization of the solute's force-field. For many common systems, such as molecules of high biological interest like nucleic acids or peptides, suitable parametrizations are available in the literature, whereas for hitherto unexplored systems one might have to parametrize the force-field anew. Once the force-field and boundary conditions (temperature, pressure, number of water molecules etc.) are defined, the simulation may be run. It is imperative that such simulations be long enough to sample the entire phase-space (of the order of tenths of ns for aqueous solutions) and that the simulation parameters correctly reproduce all possible system configurations and their relative energy (and thus population). The MD itself may be carried out using classical general-purpose force fields, which may be reparametrized as needed. The charges of the MM water molecules are routinely described by means of the TIP3P force field,31 although more accurate models may also be employed. As a (more expensive) alternative, ab initio MD may be performed, to refine the results of classical MD runs. Note that the force-field used in the MD sampling may differ from the force-field employed in subsequent polarizable QM/MM spectroscopy calculations. The force-field parametrization used for the MD sampling and the polarizable force-field used in the QM/MM calculations have different purposes: the former is employed to obtain an accurate conformational sampling, while the latter has to accurately model the effect of the solvent upon the spectroscopic observables.
(3) Step 3. Extraction of representative structures: a number of structures (snapshots) are extracted from MD runs and employed for the subsequent QM/MM calculations. In the particular case of our QM/FQ and QM/FQFμ approaches, such snaphosts have the shape of spherical “droplets”, obtained by cutting spheres of given radii centered on the solute. The radius of the droplet is chosen to be large enough to retain solute–solvent interactions in a physically consistent way, and is usually of the order of tenths of Ångstrom. The total number of snapshots to be extracted, which constitutes the computational sample, is chosen so to reach the convergence of the desired property/spectroscopy (steps 4 and 5 below). Notice that such a number is highly variable (from hundreds to thousands of snapshots), and our experience suggests that it strongly depends on the property/spectroscopy to be computed.21,32
(4) Step 4. (Polarizable) QM/MM calculations: once the bunch of snapshots has been obtained, on each of them a QM/MM calculation of the target property is performed. To complete this step, any quantum chemistry program where the desired property can be evaluated at the polarizable QM/MM level of theory may be used. Two choices must be made at this point. First there is the QM level of theory, which can depend on the system and the desired spectroscopic response, and should follow state-of-the-art of QM calculations of the same property for isolated systems. And second, there is the coupling of the QM and MM components, which should be made taking into account all considerations made in the previous section. We focus here on the QM/FQ and QM/FQFμ models, which have been presented in Section 2. At this point an additional distinction should be made between electronic and vibrational properties. For the former, including UV-vis absorption spectroscopies or spin properties, the polarizable QM/MM computations may be performed on the sampled structures themselves without further modification. For the latter, the solute structures should be minimized in order to find the local minimum of the potential energy surface. This is done because vibrational spectra (such as IR absorption or Raman scattering) require a model for the solute's potential energy surface. The most common approach is to adopt the harmonic approximation, which is based on a second-order expansion of the PES around a minimum-energy structure. Such geometry must be obtained at the same level of theory of the subsequent spectral calculation, i.e. using a polarizable QM/MM method. Following the optimization, the QM/MM vibrational spectra can be simulated. Note that, under the focused model paradigm, only the QM portion of the system (i.e. the solute) is optimized, while water molecules in each snapshot are kept fixed. This method preserves the sampling of the water configurational space obtained by means of the classical MD simulation.
(5) Step 5. Analysis of the results, extraction of spectra and (possibly) refinement: energies, structures, properties, and spectra obtained for each snapshot are extracted and averaged to produce final spectra. The results can then be analyzed, e.g. in terms of solute–solvent interactions and their propagation to spectra, and finally compared with experimental data. At this stage, any shortcomings of the procedure may emerge, e.g. an insufficient number of snapshots, an insufficiently long MD, a poor choice of classical force field, or inadequacies in the QM/MM or electronic structure method. Then, the procedure may be restarted from the step(s) that need refinement.
The discussed computational protocol is general and it can be applied to any solution. Also, in case a different QM/MM approach is exploited (either polarizable or not), only the step 4 of the protocol is redefined. Of course, this is only doable if the selected (polarizable) QM/MM approach is able to treat the desired property, i.e. it has been properly formulated, validated, and coded in a computer program. Finally, the proposed protocol is not linked to specific MM/MD or QM packages. Different codes can be exploited and properly combined to get the final results.
4 Illustrative applications
In this section we will illustrate the concepts discussed in the previous sections, and the relevance of all steps of the computational protocol through some selected applications taken from the recent literature. In particular, the aim of the present section is to show the role of the different water–solute interactions in the modeling of a variety of spectral signals, occurring in different spectral regions and connected to diverse molecular processes. The applications presented here are meant to illustrate specific aspects of the solvation phenomenon and its modeling (see Section 2), however it should be kept in mind that in all cases there are multiple effects at play. The applications we show in this section are not exhaustive, and serve only as illustrative examples of the commonly encountered challenges, and the ways they can be overcome.4.1 The role of solvent polarization
As discussed in Section 2, solvent polarization plays a crucial role in molecular spectroscopy of solutes in aqueous solution. Conceptually, solvent polarization bears an “electronic” component, i.e. the change in the electronic charge distribution of the solvent induced by the presence of the solute but it is also a consequence of the actual distribution and orientation of water molecules around the solute. In this section we will focus on the first term, whereas the importance of obtaining a correct conformational sampling of both the solute and the surrounding water environment is illustrated in more details in a following section. A way to appreciate the role of “electronic” solvent polarization upon a spectrum, is to compare simulated spectra obtained using two alternative models: one based on the electrostatic embedding where water is described by means of a fixed charge density (such as fixed charges), and a polarizable embedding model where water is polarized by the solute. In particular, we compare the results obtained when water is described with a standard, non polarizable force field based on fixed charges (TIP3P) or with the FQ.As a representative example, Fig. 4 shows the computed Vibrational Circular Dichroism (VCD) spectra of zwitterionic L-alanine in aqueous solution.11 As discussed in Section 2, our protocol requires an explicit average over many calculations which provide a statistical representation of the solute–solvent ensemble. As a result, each representative structure (snapshot) yields a different spectrum, and the total response is obtained by averaging all of them. This may be appreciated in Fig. 4a. Clearly, the spectrum of a single snapshot may differ vastly from the average, while still contributing to it, with positive and negative VCD bands overlapping, while still giving the correct overall bandshape. Such a feature is common to both QM/TIP3P and QM/FQ calculations, however the latter values show much greater variability owing to water polarization caused by the solute. In fact, since alanine is a zwitterion at neutral pH, large polarization effects are to be expected, which explains the large difference between final, averaged QM/TIP3P and QM/FQ spectra. In Fig. 4b, the experimental spectrum (taken from ref. 33) is compared to the spectrum obtained by modeling water by using QM/TIP3P (top panel) or QM/FQ (bottom panel). The difference in the quality of the results with respect to experiment is striking. In fact, QM/FQ is able to reproduce the sign of all VCD bands, the sign being the most fundamental information that can be extracted from VCD spectra, and which helps, for instance, to assign the absolute configuration of chiral systems. On the contrary, and remarkably, QM/TIP3P gives unreliable results, which in the present case could lead experimentalists to assign the molecule with the wrong absolute configuration. These issues do not only apply to the case of alanine. In fact, we have reported a similar behaviour when optical rotation is used to assign the absolute configuration of aqueous solutions of methyloxirane.21 It must also be mentioned that the QM/TIP3P spectra reached convergence with respect to the number of snapshots with just 200 structures, whereas QM/FQ results required 1000 structures. The number of snapshots required to reach convergence is highly dependent on the system and the property, as well as the method used to describe the solvent, therefore this difference should not be surprising.
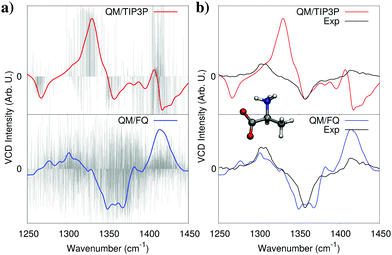 | ||
| Fig. 4 Calculated non-polarizable QM/TIP3P (red), and QM/FQ (blue) VCD spectra of zwitterionic (L)-alanine in aqueous solution. QM/TIP3P and QM/FQ raw data for each snapshot (stick spectra, grey) are also reported in panel (a). The experimental spectrum (black) taken from ref. 33 is given for comparison's sake in panel (b). QM level: B3LYP/6-311++G**. | ||
As we have reported in Section 2, there are different ways of including solvent polarization effects in QM/MM calculations. How do the spectra change as a function of the chosen PE model? To show that, in Fig. 5 computed UV-vis absorption spectra of p-nitroaniline and pyridine in aqueous solution are reported;19 there, QM/FQ and QM/FQFμ are compared. The figure shows how polarization affects the general shape of the spectra as well as solvatochromic shifts computed with respect to the vacuum. Notice that the reported QM/FQ and QM/FQFμ spectra are based on the same MDs and on the same sampling (i.e. the considered snapshots extracted from the MD are exactly the same). The QM level is likewise identical (here CAM-B3LYP/aug-cc-pVDZ for pNA and M06-2X/6-311+G(2df,2p) for pyridine), therefore the only difference in the calculations for a given system is the treatment of solvent polarization, i.e. the actual QM/MM coupling term which is inserted in the QM Hamiltonian. In fact, the inclusion of out-of-plane polarization effects which are correctly modelled by FQFμ (but neglected in FQ) has the effect of both shifting the absorption band and spreading it. Solvatochromism may also shift the band to either higher or lower energies with respect to vacuum, depending on the system and therefore the nature of the transition. Finally, let us focus on the stick-spectra shown in all four panels of Fig. 5. These lines correspond to absorption energies/intensities obtained for each individual snapshot extracted from the MD. Such data give us an idea of the variability of the spectral data as a function of the change in the solute's geometry and of the solvation pattern around it. Clearly, the actual distribution of the spectral response of the ensemble depends on the chosen polarization model, and in particular out-of-plane polarization results in a broader distribution.
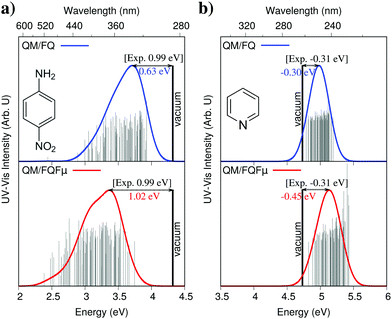 | ||
| Fig. 5 pNA (a) and pyridine (b) QM/FQ and QM/FQFμ UV-Vis spectra (FWHM = 0.3 eV). Raw data (stick spectra) and the position of the vertical computed transition for the isolated molecules (CAM-B3LYP/aug-cc-pVDZ for pNA and M06-2X/6-311+G(2df,2p) for pyridine) are also reported. Experimental solvatochromic shifts were taken from ref. 34 (pNA) and ref. 35 (pyridine). | ||
Difference in the description also reflect on the agreement with experimental data. Remarkably, both QM/FQ and QM/FQFμ correctly reproduce the sign of the experimental solvatochromic shift. However, QM/FQFμ gives almost perfect agreement with experiments for pNA, for which the solvatochromic shift is instead underestimated (of about 35%) by QM/FQ (see Fig. 5). Overall, the inclusion of fluctuating dipoles in the description of MM water molecules increases the solvatochromic shift (in absolute value) of more than 60% in case of pNA and 50% for pyridine, thus showing a remarkable effect of the quality of the description of polarization effects.
The quality of QM/FQ results has been compared to those obtained by using a different PE model (in particular a polarizable QM/MM approach based on fixed charges and induced dipoles).36 Computed UV/Vis and Magnetic Circular Dichroism (MCD) spectra of selected chromophores in aqueous solution obtained with the two different approaches have been compared. The results show that, by exploiting reliable parametrizations of both approaches, QM/FQ and QM/PE computed spectra look remarkably alike for all considered systems.36 As a further example, vacuo-to-water solvatochromic shifts have been investigated in the recent literature by exploiting other polarizable QM/MM approaches.14,37,38 A relevant example is given by Loco et al.,14 who correctly reproduce the vacuo-to-water solvatochromic shift of the betaine-30 chromophore. The authors compared the performance of three water models, i.e. PCM, a cluster model with a small number of water molecules treated at the QM level while the rest are described via the PCM, and by modeling the aqueous solution via the AMOEBA force field.14 They observed that PCM markedly underestimates solvatochromic shifts with respect to the other two models, while the inclusion of two hydrogen bonded water molecules in the QM region in combination with a continuum description still fails to recover a large portion of the observed solvatochromism. The inclusion of a larger number of explicit water molecules in QM/AMOEBA calculations leads instead to a computed solvatochromic shift which matches experiment almost exactly.
4.2 Hydrogen bonding
In the previous section we showed that water polarization effects cannot be safely neglected, however an even greater effect that separates water from other solvents is its ability to form hydrogen bonds. The most common approach employed for the inclusion of hydrogen bonding effects in molecular spectra involves the “promotion” of a few water molecules to the QM layer, while the rest of the aqueous environment is treated classically using continuum models. While this approach can recover the water–solute interactions to their fullest extent, it results into a static picture where the hydrogen-bonded water molecules and the solute are treated as a rigid cluster, which is not representative of the real system. Water is very loosely bounded to the solute by hydrogen bonds, therefore the system is in a dynamical equilibrium that can only be captured using an explicit sampling of the solute–solvent conformational space. In addition, as was shown in the previous section and will be amply demonstrated in this and later sections, this full-QM treatment is unnecessary. A proper polarizable QM/MM model where all water molecules are treated atomistically, albeit classically, is enough to reproduce experimental findings.An illustrative example of the role of water–solute hydrogen bonding on the spectral response is shown in Fig. 6. There, calculated UV-vis absorption spectra of bimane obtained by exploiting a hierarchy of solvation approaches are reported,40 together with the experimental spectrum.39 In particular, Fig. 6 compares spectra simulated with the standard QM/PCM, QM/PCM spectra obtained with the further inclusion of few water molecules in the QM portion of the system, and QM/FQ results. It can be readily seen that PCM results are considerably shifted compared to experiment, and that only minimal refinements in the continuum description arise from the inclusion of explicit solvent molecules in the QM portion (i.e. the use of a solvated minimal cluster). On the contrary, the experimental spectra are reproduced with significant accuracy by QM/FQ, due to its capability of appropriately treating the directionality of solute–solvent electrostatic interactions thanks to a fully atomistic treatment of the solvent and the averaging over all configurations. Many other studies on the pivotal role of hydrogen bonding in computing molecular spectra of aqueous systems are present in the literature and a comprehensive account of all of them is beyond the scope of this tutorial review. Suffice it to say that the role of hydrogen bonding is pervasive, and its extent strongly depends on the nature of the solute (i.e. its capability to establish an h-bond network with water) and the spectral property under investigation. Also, as we will see in more detail in the next section, hydrogen bonding may substantially affect the molecular conformational distribution. In fact, the consequences can be seen directly in the spectra, with shifts of a few nanometers in UV-Vis spectra and substantial broadening of IR/Raman bands, or even sign inversion in computed chiral properties.11,40,41 For this reason, neglecting a proper treatment of hydrogen bonding in the computation of spectral properties of aqueous systems is generally unsafe, can lead to relevant artifacts in the computed spectra and should therefore be avoided.14,21,40,41
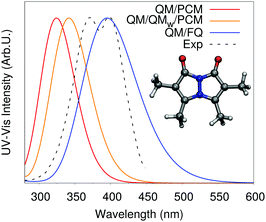 | ||
| Fig. 6 Calculated QM/PCM, QM/QMw/PCM and QM/FQ UV-Vis spectra of bimane in aqueous solution. The experimental spectrum, taken from ref. 39 is also reported. QM level: CAM-B3LYP/6-311++G**. | ||
4.3 How water affects conformational freedom
Hydrogen-bonding has been shown in the previous section to be able to significantly alter a molecule's spectral response by virtue of its effects upon the solute's electronic structure; however it can also cause profound changes in a molecule's geometric structure and conformational distribution. Chiral properties like circular dichroism (CD) and optical rotation (OR) are particularly sensitive to the system's conformation because they depend upon molecular dissymetries. For these properties, the two problems of modeling the effect of water on the geometrical and the electronic structure become equally important.As an illustrative example, we can look at the electronic circular dichroism (ECD) of nicotine.42 In the gas phase, nicotine has been shown to exist mainly as two distinct conformers, commonly known as A and B (see Fig. 7a), with a preponderance of the former (69% nicotine A, and 31% nicotine B).43 Calculations performed using the PCM, which do not consider hydrogen bonding effects, do not significantly alter this picture, however in the reality in aqueous solution, the equilibrium between the two forms is disrupted and their respective population changes. As seen in Fig. 7b, the resulting QM/PCM ECD spectrum is strikingly different from the experimental measurements.
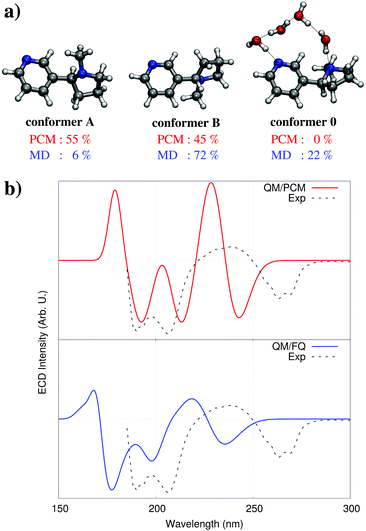 | ||
| Fig. 7 (a) Nicotine conformers with their populations in water solution obtained from single point QM/PCM calculations (top, red) or from the MD simulation (bottom, blue). (b) Nicotine experimental and calculated ECD spectra, computed with the QM/PCM and QM/FQ approaches (see ref. 42 for details). QM level: CAM-B3LYP/aug-cc-pVDZ. | ||
The application of our protocol, and the use of a classical MD sampling of the system reveals the formation of complex hydrogen bonding networks of water molecules connecting different parts of nicotine, that allow the stabilization of a third conformer, observed neither in the gas phase nor in PCM. Subsequent QM/FQ calculations performed on the snapshots extracted from the MD produce an ECD spectrum that agrees very well with experimental findings (see Fig. 7), barring an overall shift that is to be expected from the use of DFT for the QM description.42
The role of water in modifying the conformational distribution of solutes has been analyzed in-depth also in the case of the vibrational absorption spectrum of methyl-lactate (MLac) in water.32 In the gas phase, MLac can assume three distinct conformations,32,44 depending on the orientation of the internal dihedral angles within the molecule (see Fig. 8a), which are characterized by intra-molecular hydrogen bonds between the hydroxyl and ester groups. Modeling solvent electrostatics by means of the PCM alters conformer populations but does not qualitatively affect this picture. A classical MD however, reveals a very different conformational distribution of aqueous MLac. In fact, as can be seen in Fig. 8b, the conformational distribution emerging from the MD does not resemble at all the one that would be inferred by either gas phase or PCM calculations. Two of the minimal energy conformations found by PCM disappear, while the solute tends to cluster around a hitherto neglected conformer. This difference can be explained by noting that the intra-molecular hydrogen bond can be disrupted by water molecules which can saturate hydrogen bond sites, opening up the structure. Note that a previous study exploiting a supermolecule (cluster) approach,44 by considering an adduct between MLac and a single water molecule, did not reveal the presence of the conformation found by the MD.
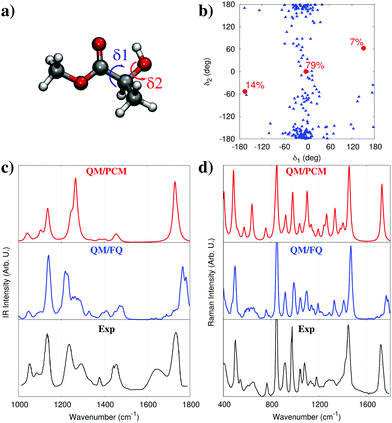 | ||
| Fig. 8 (a) Structure of methyl-lactate (the two dihedrals δ1 and δ2 are highlighted). (b) Conformational map of methyl-lactate as a function of the values assumed by δ1 and δ2. The red dots denote the three QM/PCM main conformations with their populations, the blue triangles correspond to MD snapshots. (c and d) QM/PCM, QM/FQ, and experimental IR and Raman spectra of methyl-lactate in water (see text and ref. 32 for more details). QM level: B3LYP/aug-cc-pVDZ. | ||
In terms of the spectrum, we can see the striking difference between the gas-phase and solvated-phase spectra in Fig. 8c. When compared to the experimental spectrum, almost all relative intensities are correctly reproduced by QM/FQ. Most importantly, the inhomogeneous broadening of the bands also naturally emerges from the calculation, due to the natural spreading of the stick spectra of the single snapshots as a result of the distribution of solvent around the different conformations of MLac. Remarkably, in our approach this broadening is modelled without resorting to ad-hoc processing of different bands, i.e. by using artificial broadening shapes. It is also worth noticing that vibrational motions involving the OH group (around 1200–1300 cm−1), are almost perfectly reproduced. The role of hydrogen bonding in the generation of the spectrum can be even better appreciated by looking at results obtained with PCM. As can be seen in Fig. 8c the results are much poorer, with an intensity pattern that fails to even qualitatively reproduce the experimental spectrum.
Similar conclusions can be reached by analyzing the Raman scattering spectrum in Fig. 8d. Though experimental data are not available in this case, it is worth noting that PCM and QM/FQ yield drastically differing results in terms of relative intensities. Overall these findings expose the need to carefully consider how water interacts with a solute, affecting its conformational landscape, vibrational motions, and spectroscopic intensities, in particular when hydrogen-bonding plays a direct role in the interaction.
4.4 Non-electrostatic effects
Usually, the solvation properties of water almost entirely focus on its high polarity and its hydrogen-bonding ability. These properties are responsible for much of its chemistry, however they often monopolize the discourse around water overshadowing other effects which therefore tend to be neglected, leading to a wrong physico-chemical description of certain phenomena. When considering spectroscopic properties, particular care must be taken because the interaction between the probing electromagnetic radiation and the solute can alter its electronic properties and therefore the way it interacts with the solvation environment, which can amplify the role of non-electrostatic interactions, even in a medium as polar as water. This has been shown to be evident even in the case of solvatochromic shifts, which are often rationalized in terms of electrostatics alone. Aidas et al.37 have shown that for vacuo-to-water solvatochromic shift of the π–π* excitations of acrolein, non-electrostatic effects play a significant role. This was demonstrated by sampling the solute–solvent phase space by means of a classical MD, followed by different QM/MM calculations which treated some solvent molecules at the QM level. Treating part of the solvation layer at the QM level, however, comes with a significant increase in the computational cost, and carries the complication of having to carefully select which water molecules should be included in the QM layer. Both these difficulties can be obviated by enriching the MM description using a model that accounts for quantum confinement effects. This has been recently demonstrated45 to yield excellent results, provided the solvation model accounts for all relevant interactions, i.e. electrostatic, polarization, and quantum repulsion.One aspect of the solvation problem that emerges prominently is the fact that the effect of water upon solvatochromic shifts is the result of a sensitive balance of electrostatic, polarization, and repulsion forces. Fig. 9 reports calculated vacuo-to-water solvatochromic shifts for the n–π* and π–π* excitations of acrolein, evaluated with different levels of theory: non-polarizable fixed-charges QM/TIP3P model, polarizable QM/FQ and QM/FQFμ models, and finally both polarizable models with the addition of repulsion forces.45 Experimental data are also included for comparison.37 Clearly, the non-polarizable QM/TIP3P approach does not appropriately model this system, in fact it describes fairly well the solvatochromic shift of the n–π* transition, however it largely underestimated that of the π–π* band. The picture does not change when repulsion forces are included, which on the contrary results in a significant reduction of the agreement with experimental values. This is because solvent polarization constitutes an essential mechanism by which different solute electronic states may be stabilized, as can be seen in Fig. 9 where both QM/FQ and QM/FQFμ lead to a significant increase in computed solvatochromic shifts. Repulsion has instead the opposite effect. Note that electrostatic effects are not uniform, and differ visibly for the two types of transitions considered, i.e. n–π* and π–π*, therefore using a non-polarizable description for the solvent that simply increases electrostatic effects uniformly cannot hope to describe both types of states equally well. This can only be achieved by means of a polarizable method that dynamically and self-consistently responds to changes in the solute's electronic density. And, as the description of electrostatic effects becomes ever more refined, the inclusion of quantum repulsion becomes more vital. Without it the predicted solvatochromic shifts might be too hastily judged as being too high with respect to the observed values, when in fact the discrepancy would have to be blamed to an unbalanced description of the different forces acting upon the solute, rather than an overestimation of electrostatic effects themselves. Notice in particular that, for the n–π* transition, quantum confinement shifts the polarizable QM/MM results towards the experimental value, whereas the opposite behavior is observed for π–π*. Such a discrepancy is due to the fact that the calculations reported in Fig. 9 neglect the charge exchange that can take place between water molecules. If such an effect is included in addition to electrostatic/polarization and Pauli repulsion, the computed data achieve an almost perfect agreement with experiment (for more details see ref. 45). Finally, it is worth noticing that confinement effects have an opposite effect on the two excitations, either increasing (for π–π*) or decreasing (for n–π*) the excitation energy. Such a trend has also been reproduced by exploiting a different approach to model the repulsion contribution,26,46 and it is basically due to the differences in the excited-state dipole moments of the two excitations as reported in ref. 45.
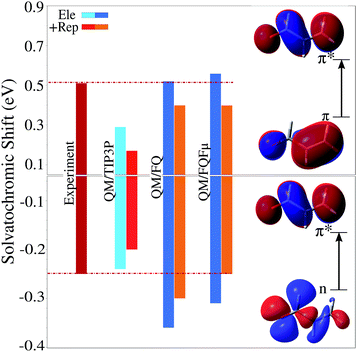 | ||
| Fig. 9 Vacuo-to-water solvatochromic shift for the n–π* and π–π* electronic excitation bands of acrolein in water computed using different levels of theory (see text and ref. 45 for details). Experimental value reproduced from ref. 37. QM level: CAM-B3LYP/aug-cc-pVDZ. | ||
Another example that well illustrates the role of non-electrostatics is reported in Fig. 10, which shows computed Electron Paramagnetic Resonance (EPR) nitrogen hyperfine coupling constants (hcc) calculated for the PROXYL and TEMPO nitroxyl radicals in water (molecular structures shown in Fig. 10a).47 While these molecules are not especially flexible, the oxygen atom can still move about the molecular plane leading to a pyramidalization of the nitrogen atom. The degree of deviation from the planar structure can be evaluated by measuring the improper dihedral angle δ = CαNOCα. Classical MDs of both molecules in water reveal that, in fact, this angle can vary approximately between +40 and −40 degrees (see panels in Fig. 10b). As a consequence, the hcc computed on each snapshot from the MD using the QM/FQ method vary significantly for both systems, as reported in the figure, where the values are distributed around a curved path, showing that the hcc tends to increase significantly with increasing degree of pyramidalization. Compounding this conformational effect is, of course, the direct influence of water molecules on the system. Panels in Fig. 10c show the result of the averages over all snapshots from the MD, as well as the experimental data.48,49 In addition to the simple base QM/FQ method, values obtained by including either just quantum repulsion or both repulsion and dispersion effects are also shown, along with results obtained after the complete removal of the solvent molecules, to serve as a reference. Non-electrostatic effects are treated using the novel approach presented in ref. 28 by some of the present authors and briefly discussed in Section 2.3.5. Solvent electrostatics provides a visible boost in the nitrogen hcc while, predictably, the inclusion of quantum repulsion has the opposite effects. Interestingly, dispersion interactions have almost no effect, though the same conclusion might not hold for solvents such as benzene or tetrachloromethane, which have much more diffuse electron clouds.
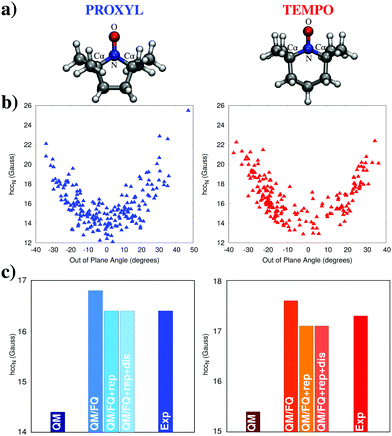 | ||
| Fig. 10 (a) Molecular structures and atom labeling for the PROXYL and TEMPO radicals. (b) Nitrogen hcc (in Gauss) computed for each snapshot at the PBE0/N07D/FQ level of theory, expressed as a function of the nitrogen pyramidalization angle. (c) Average over all snapshots of the nitrogen hcc computed using the QM (with no solvent included), QM/FQ, QM/FQ + rep, and QM/FQ + rep + dis levels of theory. The QM level of theory is based on PBE0/N07D calculations with additional electronic-correlation effects based on Coupled-Cluster theory (see ref. 47 for details). | ||
5 Conclusions and perspectives
In this Tutorial Review we have outlined conceptually and through the discussion of a set of selected applications, the challenges involved in the computational simulation of the spectroscopic response of molecular systems in aqueous solutions. Using a first-principle approach as a guideline for our discussion, we have detailed all the physico-chemical characteristics that set water apart as a unique molecular environment, and pointed out the grave limitations of the approaches (continuum or cluster-based) which are currently (and widely) exploited in the chemical research. An effective solution for the challenges posed by the spectroscopy of aqueous systems can be found in the realm of polarizable QM/MM methods, which couple a QM description of a molecular solute (a necessary requirement for the evaluation of spectroscopic observables) with a classical treatment of the aqueous environment. The coupling between the QM and MM portions introduced in this class of methods can be enhanced so that it treats all types of solute–solvent interactions that are relevant for the generation of the spectroscopic response. The FQ and FQFμ models are of particular relevance in this field, since they were specifically designed to simulate any spectroscopic property and have proven to be effective in a wide variety of scenarios. These approaches find their success rooted in a physically consistent formulation of solute–water interactions, together with their integration within a 5-step protocol, that can be followed by non-experts to simulate any type of spectra. We hope that this Tutorial Review will serve the wider community of chemists and help them to move away from the more antiquated methods and take advantage of the new approaches proposed.While QM/FQ-FQFμ methods have been validated for the reproduction of a variety of spectroscopic observables of small-to-medium sized test systems, they await to be measured against larger and more complex applications, and thus be used for their predictive power rather than as just a tool for interpreting existing spectra. Also, more developments can still be anticipated. One of the most crucial steps in our computational protocol is the sampling of the solute/solvent conformational space. This can be achieved through either standard MD or Monte-Carlo simulations, however for very large systems this could prove to be computationally prohibitive. This limitation could be overcome by effective coupling with enhanced sampling techniques.50 Finally, all types of spectra we have shown in this presentation sample ensembles of molecules that are frozen in place. Time-resolved spectroscopies such as pump–probe techniques which dynamically sample degrees of freedom of a molecule evolving in different timescales, have yet to be properly framed in a theoretical context that can take fully advantage of QM/MM techniques, and especially of QM/FQ-FQFμ. The latter approaches have the potential to tackle such complex phenomena, and this field undoubtedly provides an exciting avenue for future developments.7
Conflicts of interest
There are no conflicts to declare.Acknowledgements
This work has received funding from the European Research Council (ERC) under the European Union's Horizon 2020 research and innovation programme (grant agreement No. 818064). TG acknowledges funding from the Research Council of Norway through its grant TheoLight (grant no. 275506).Notes and references
- F. Paesani, Acc. Chem. Res., 2016, 49, 1844–1851 CrossRef CAS PubMed.
- S. Naserifar and W. A. Goddard 3rd, Proc. Natl. Acad. Sci. U. S. A., 2019, 116, 1998–2003 CrossRef CAS PubMed.
- O. Demerdash, L.-P. Wang and T. Head-Gordon, Wiley Interdiscip. Rev.: Comput. Mol. Sci., 2018, 8, e1355 Search PubMed.
- W. Xie and J. Gao, J. Chem. Theory Comput., 2007, 3, 1890–1900 CrossRef CAS PubMed.
- J. Tomasi, R. Cammi, B. Mennucci, C. Cappelli and S. Corni, Phys. Chem. Chem. Phys., 2002, 4, 5697–5712 RSC.
- B. Mennucci and S. Corni, Nat. Rev. Chem., 2019, 3, 315–330 CrossRef.
- J. Segarra-Mart, S. Mukamel, M. Garavelli, A. Nenov and I. Rivalta, Multidimensional Time-Resolved Spectroscopy, Springer, 2019, pp. 63–112 Search PubMed.
- A. S. Perera, J. Thomas, M. R. Poopari and Y. Xu, Front. Chem., 2016, 4, 9 Search PubMed.
- H. M. Senn and W. Thiel, Angew. Chem., Int. Ed., 2009, 48, 1198–1229 CrossRef CAS PubMed.
- U. N. Morzan, D. J. Alonso de Armino, N. O. Foglia, F. Ramirez, M. C. Gonzalez Lebrero, D. A. Scherlis and D. A. Estrin, Chem. Rev., 2018, 118, 4071–4113 CrossRef CAS PubMed.
- T. Giovannini, M. Olszowka and C. Cappelli, J. Chem. Theory Comput., 2016, 12, 5483–5492 CrossRef CAS PubMed.
- C. Curutchet, A. Muñoz-Losa, S. Monti, J. Kongsted, G. D. Scholes and B. Mennucci, J. Chem. Theory Comput., 2009, 5, 1838–1848 CrossRef CAS PubMed.
- J. M. H. Olsen and J. Kongsted, Adv. Quantum Chem., Elsevier, 2011, vol. 61, pp. 107–143 Search PubMed.
- D. Loco, É. Polack, S. Caprasecca, L. Lagardere, F. Lipparini, J.-P. Piquemal and B. Mennucci, J. Chem. Theory Comput., 2016, 12, 3654–3661 CrossRef CAS PubMed.
- Z. Jing, C. Liu, S. Y. Cheng, R. Qi, B. D. Walker, J.-P. Piquemal and P. Ren, Ann. Rev. Biophys., 2019, 48, 371–394 CrossRef CAS PubMed.
- C. Cappelli, Int. J. Quantum Chem., 2016, 116, 1532–1542 CrossRef CAS.
- T. Giovannini, A. Puglisi, M. Ambrosetti and C. Cappelli, J. Chem. Theory Comput., 2019, 15, 2233–2245 CrossRef CAS PubMed.
- T. Giovannini, M. Olszòwka, F. Egidi, J. R. Cheeseman, G. Scalmani and C. Cappelli, J. Chem. Theory Comput., 2017, 13, 4421–4435 CrossRef CAS PubMed.
- T. Giovannini, R. Russo, M. Ambrosetti, A. Puglisi and C. Cappelli, J. Chem. Phys., 2019, 151, 174104 CrossRef PubMed.
- T. Giovannini, L. Grazioli, M. Ambrosetti and C. Cappelli, J. Chem. Theory Comput., 2019, 15, 5495–5507 CrossRef CAS PubMed.
- F. Lipparini, F. Egidi, C. Cappelli and V. Barone, J. Chem. Theory Comput., 2013, 9, 1880–1884 CrossRef CAS PubMed.
- T. Giovannini, M. Ambrosetti and C. Cappelli, Theor. Chem. Acc., 2018, 137, 74 Search PubMed.
- R. Di Remigio, T. Giovannini, M. Ambrosetti, C. Cappelli and L. Frediani, J. Chem. Theory Comput., 2019, 15, 4056–4068 CrossRef CAS PubMed.
- M. Stöhr, T. Van Voorhis and A. Tkatchenko, Chem. Soc. Rev., 2019, 48, 4118–4154 RSC.
- M. S. Gordon, Q. A. Smith, P. Xu and L. V. Slipchenko, Annu. Rev. Phys. Chem., 2013, 64, 553–578 CrossRef CAS PubMed.
- P. Reinholdt, J. Kongsted and J. M. H. Olsen, J. Phys. Chem. Lett., 2017, 8, 5949–5958 CrossRef CAS PubMed.
- H. Gokcan, E. G. Kratz, T. A. Darden, J.-P. Piquemal and G. A. Cisneros, J. Phys. Chem. Lett., 2018, 9, 3062–3067 CrossRef CAS PubMed.
- T. Giovannini, P. Lafiosca and C. Cappelli, J. Chem. Theory Comput., 2017, 13, 4854–4870 CrossRef CAS PubMed.
- J. Hermann, R. A. DiStasio and A. Tkatchenko, Chem. Rev., 2017, 117, 4714–4758 CrossRef CAS PubMed.
- C. Curutchet, L. Cupellini, J. Kongsted, S. Corni, L. Frediani, A. H. Steindal, C. A. Guido, G. Scalmani and B. Mennucci, J. Chem. Theory Comput., 2018, 14, 1671–1681 CrossRef CAS PubMed.
- P. Mark and L. Nilsson, J. Phys. Chem. A, 2001, 105, 9954–9960 CrossRef CAS.
- T. Giovannini, G. Del Frate, P. Lafiosca and C. Cappelli, Phys. Chem. Chem. Phys., 2018, 20, 9181–9197 RSC.
- M. Diem, J. Am. Chem. Soc., 1988, 110, 6967–6970 CrossRef CAS.
- S. Kovalenko, R. Schanz, V. Farztdinov, H. Hennig and N. Ernsting, Chem. Phys. Lett., 2000, 323, 312–322 CrossRef CAS.
- UV-VIS atlas of organic compounds, ed. H.-H. Perkampus, Wiley, Weinheim, 1996 Search PubMed.
- P. Reinholdt, M. S. Nörby and J. Kongsted, J. Chem. Theory Comput., 2018, 14, 6391–6404 CrossRef CAS PubMed.
- K. Aidas, A. Møgelhøj, E. J. Nilsson, M. S. Johnson, K. V. Mikkelsen, O. Christiansen, P. Söderhjelm and J. Kongsted, J. Chem. Phys., 2008, 128, 194503 CrossRef PubMed.
- A. DeFusco, N. Minezawa, L. V. Slipchenko, F. Zahariev and M. S. Gordon, J. Phys. Chem. Lett., 2011, 2, 2184–2192 CrossRef CAS.
- I. R. Politzer, K. T. Crago, D. L. Kiel and T. Hampton, Anal. Lett., 1989, 22, 1567–1580 CrossRef CAS.
- T. Giovannini, M. Macchiagodena, M. Ambrosetti, A. Puglisi, P. Lafiosca, G. Lo Gerfo, F. Egidi and C. Cappelli, Int. J. Quantum Chem., 2019, 119, e25684 CrossRef.
- F. Egidi, T. Giovannini, G. Del Frate, P. M. Lemler, P. H. Vaccaro and C. Cappelli, Phys. Chem. Chem. Phys., 2019, 21, 3644–3655 RSC.
- F. Egidi, R. Russo, I. Carnimeo, A. D'Urso, G. Mancini and C. Cappelli, J. Phys. Chem. A, 2015, 119, 5396–5404 CrossRef CAS PubMed.
- J. Grabow, S. Mata, J. L. Alonso, I. Peña, S. Blanco, J. C. López and C. Cabezas, Phys. Chem. Chem. Phys., 2011, 13, 21063–21069 RSC.
- M. Losada and Y. Xu, Phys. Chem. Chem. Phys., 2007, 9, 3127–3135 RSC.
- T. Giovannini, M. Ambrosetti and C. Cappelli, J. Phys. Chem. Lett., 2019, 10, 5823–5829 CrossRef CAS PubMed.
- D. Hrsak, J. M. H. Olsen and J. Kongsted, J. Chem. Theory Comput., 2018, 14, 1351–1360 CrossRef CAS PubMed.
- T. Giovannini, P. Lafiosca, B. Chandramouli, V. Barone and C. Cappelli, J. Chem. Phys., 2019, 150, 124102 CrossRef PubMed.
- J. F. Keana, T. D. Lee and E. M. Bernard, J. Am. Chem. Soc., 1976, 98, 3052–3053 CrossRef CAS PubMed.
- A. Rockenbauer, L. Korecz and K. Hideg, J. Chem. Soc., Perkin Trans. 2, 1993, 2149–2156 RSC.
- G. Bussi and A. Laio, Nat. Rev. Phys., 2020, 2, 200–2012 CrossRef.
Footnote |
| † Present address: Department of Chemistry, Norwegian University of Science and Technology (NTNU), N-7491 Trondheim, Norway. |
| This journal is © The Royal Society of Chemistry 2020 |


