
 Open Access Article
 This Open Access Article is licensed under a
 Creative Commons Attribution 3.0 Unported Licence
Microhydration of substituted diamondoid radical cations of biological relevance: infrared spectra of amantadine+-(H2O)n![[thin space (1/6-em)]](https://www.rsc.org/images/entities/h2_char_2009.gif) =1–3 clusters†
=1–3 clusters†
Martin Andreas Robert
George
 ,
Friedrich
Buttenberg
,
Marko
Förstel
and
Otto
Dopfer
*
,
Friedrich
Buttenberg
,
Marko
Förstel
and
Otto
Dopfer
*
Institut für Optik und Atomare Physik, Technische Universität Berlin, Hardenbergstr. 36, 10623 Berlin, Germany. E-mail: dopfer@physik.tu-berlin.de
First published on 18th November 2020
Abstract
Hydration of biomolecules and pharmaceutical compounds has a strong impact on their structure, reactivity, and function. Herein, we explore the microhydration structure around the radical cation of the widespread pharmaceutical drug amantadine (C16H15NH2, Ama) by infrared photodissociation (IRPD) spectroscopy of mass-selected Ama+Wn![[thin space (1/6-em)]](https://www.rsc.org/images/entities/char_2009.gif) =1–3 clusters (W = H2O) recorded in the NH, CH, and OH stretch range of the cation ground electronic state. Analysis of the size-dependent frequency shifts by dispersion-corrected density functional theory calculations (B3LYP-D3/cc-pVTZ) provides detailed information about the acidity of the protons of the NH2 group of Ama+ and the structure and strength of the NH⋯O and OH⋯O hydrogen bonds (H-bonds) of the hydration network. The preferred sequential cluster growth begins with hydration of the two acidic NH protons of the NH2 group (n = 1–2) and continues with an extension of the H-bonded hydration network by forming an OH⋯O H-bond of the third W to one ligand in the first hydration subshell (n = 3), like in the W2 dimer. For n = 2, a minor population corresponds to Ama+W2 structures with a W2 unit attached to Ama+via a NH⋯W2 H-bond. Although the N–H proton donor bonds are progressively destabilized by gradual microhydration, no proton transfer to the Wn solvent cluster is observed in the investigated size range (n ≤ 3). Besides the microhydration structure, we also obtain a first impression of the structure and IR spectrum of bare Ama+, as well as the effects of both ionization and hydration on the structure of the adamantyl cage. Comparison of Ama+ with aliphatic and aromatic primary amine radical cations reveals differences in the acidity of the NH2 group and the resulting interaction with W caused by substitution of the cycloalkyl cage.
=1–3 clusters (W = H2O) recorded in the NH, CH, and OH stretch range of the cation ground electronic state. Analysis of the size-dependent frequency shifts by dispersion-corrected density functional theory calculations (B3LYP-D3/cc-pVTZ) provides detailed information about the acidity of the protons of the NH2 group of Ama+ and the structure and strength of the NH⋯O and OH⋯O hydrogen bonds (H-bonds) of the hydration network. The preferred sequential cluster growth begins with hydration of the two acidic NH protons of the NH2 group (n = 1–2) and continues with an extension of the H-bonded hydration network by forming an OH⋯O H-bond of the third W to one ligand in the first hydration subshell (n = 3), like in the W2 dimer. For n = 2, a minor population corresponds to Ama+W2 structures with a W2 unit attached to Ama+via a NH⋯W2 H-bond. Although the N–H proton donor bonds are progressively destabilized by gradual microhydration, no proton transfer to the Wn solvent cluster is observed in the investigated size range (n ≤ 3). Besides the microhydration structure, we also obtain a first impression of the structure and IR spectrum of bare Ama+, as well as the effects of both ionization and hydration on the structure of the adamantyl cage. Comparison of Ama+ with aliphatic and aromatic primary amine radical cations reveals differences in the acidity of the NH2 group and the resulting interaction with W caused by substitution of the cycloalkyl cage.
1. Introduction
Amantadine (Ama, 1-tricyclo[3.3.1.13,7]decylamine, 1-adamantylamine, 1-aminoadamantane, C16H15NH2) is the amino derivative of adamantane (C10H16, Ad), which is the parent molecule of the diamondoids (also called polymantanes),1,2 a fundamental class of saturated sp3-hybridized hydrocarbon molecules. These rigid and stress-free cycloalkanes are nanometer-sized H-passivated nanodiamonds, which are thermodynamically and chemically highly stable and perfectly size-selectable.3–5 Diamondoids are therefore an important class of hydrocarbon molecules, with a variety of applications in materials and polymer sciences, molecular electronics, astrochemistry, chemical synthesis, and medical sciences.6–14 Concerning pharmaceutical applications, Ama is one of the best known commercially available diamondoid, because it is successfully marketed as an antiviral and antiparkinson drug under the brand names Symmetrel® (Ama·HCl), Gocovri®, Symadine®, and Osmolex ER®.15–18 The antiviral properties result from the ability of the drug to prevent the virus from entering the host cell by blocking the ion channel. The drug interferes with a viral protein, M2 (an ion channel), which is needed for the virus to become “uncoated” as soon as it is absorbed into the cell by endocytosis.19 However, its use for influenza is no longer recommended due to drug resistance.20,21 The mechanism of its antiparkinsonian effect is not yet fully understood at the molecular level, but the drug increases dopamine release from the nerve endings of brain cells, together with a stimulation of the norepinephrine response.22–24 Moreover, it also has NMDA receptor antagonistic effects.25,26 Ama is also under discussion for the treatment of fatigue in multiple sclerosis, depression, and cocaine dependence.27–29 The methylated derivative, memantine or Namenda®, was amongst the top 100 sold drugs worldwide, with sales of more than 109 US$ in the year 2013.30 Herein, we study microhydrated clusters of the Ama+ cation, Ama+Wn (W = water = H2O), to characterize the intermolecular interaction of this biomolecular cation with W at the molecular level. In addition to its pharmaceutical importance, Ama and particularly its radical cation is also of relevance in the context of astrochemistry. In particular, due to their high stability, diamondoids are postulated to be highly abundant in the interstellar medium.31–36 The large fraction of primary amines detected in interstellar space suggests a significant abundance of Ama and its radical cation, whereby the latter is produced by ionizing radiation. Microhydrated clusters of Ama+ are relevant to investigate the chemical reactivity of diamondoid radical cations in interstellar ice grains, in which ionizing radiation may induce photochemical reactions of organic molecules leading to molecules with higher complexity (e.g., ethers, alcohols).37,38Neutral Ama has a structure with Cs symmetry and consists of a primary pyramidal amino group (NH2) attached to the adamantyl backbone (C10H15), which grants the molecule the special chemical properties of diamond-like structures.26,39 The geometric, vibrational, and electronic properties of Ama have been characterized by infrared (IR), Raman, and electron momentum spectroscopy.40–42 Moreover, the Ama⋯DNA interaction has been studied by Raman spectroscopy.43 In contrast to neutral Ama, there are no studies on the Ama+ cation so far, with the notable exception of low-resolution electron momentum spectra yielding approximate energies for the electronic states.41 The latter study reveals that ionization of Ama into the ground electronic state of the cation occurs by removal of one electron from the nonbonding N lone pair of the amino group, with a rough estimation of the vertical ionization energy of 8.6 eV.
Herein, we analyse IR photodissociation (IRPD) spectra of size-selected Ama+Wn clusters with n = 1–3 generated in a molecular beam with the aid of quantum-chemical dispersion-corrected density functional theory (DFT) calculations at the B3LYP-D3/cc-pVTZ level, with the major goal of characterizing the initial steps of the microhydration process of this important diamondoid cation. This dual experimental and computational approach has been well established in our laboratory for the study of microhydrated cations,38,44–68 and provides direct access to the interaction potential between the cation and the solvent molecules. The Ama+Wn cluster system has been chosen for the following reasons. (1) No spectroscopic studies are available for both Ama+ and any of its clusters. Hence, our Ama+Wn data provide a first impression of the interaction of this biological ion with neutral solvent molecules at the molecular level. The IRPD spectra recorded in the informative OH, NH, and CH stretch range serve as a very sensitive probe of the ion–ligand interaction potential with respect to both binding site and interaction strength, as well as the structure of the hydrogen-bonded (H-bonded) solvent network. In addition, the cluster data also provide information about the properties of the Ama+ monomer ion, such as the acidity of its N–H bonds. (2) In previous work, we characterized the structure and bonding in the bare adamantane cation (Ad+)35 and its monohydrated cluster (Ad+W).38 Ionization of Ad with tetrahedral symmetry (Td) from the triply-degenerate bonding t2 highest occupied molecular orbital (HOMO), which is delocalized over the Ad cage, results in a Jahn–Teller distorted cation with C3v symmetry, with one very acidic C–H bond along the C3 axis.35 Formation of the CH⋯O H-bond in the Ad+W monohydrate activates this C–H bond even further. Thus, microhydration of cationic diamondoids can have a profound impact on their structure, IR spectrum, and chemical reactivity, and the magnitude of these effects may differ largely from that observed for related simple cationic hydrocarbons such as CH4+.38 As ionization of Ama into the cation ground state occurs by removal of an electron from the N lone pair and not from the adamantyl cage, H → NH2 substitution will have a big impact on the structure of the diamondoid cation, as well as its interaction with ligands. (3) Microhydration of aromatic amine radical cations has been studied before by IRPD spectroscopy and computations, and examples relevant for the present work include aniline (AN+Wn)69,70 and aminobenzonitrile (ABN+Wn).55 Surprisingly, no experimental data are available for the microhydrated methylamine cation (CH3NH2+), the most simple aliphatic amine cation, so that all information relies on recent computational data for CH3NH2+Wn≤5.71 Comparison of Ama+ with AN+, ABN+, and CH3NH2+ reveals the differences of an aromatic, aliphatic, and cycloaliphatic substituent on the acidity and intermolecular interaction of the NH protons of primary amine cations. Cationic NH2 and NH groups of primary and secondary amines are known to form strong NH⋯O ionic H-bonds with W ligands and larger Wn clusters.54,55,57,69–73 A particular question to be addressed is thus the competition between the formation of the H-bonded solvent network (which is strongly favoured by nonadditive cooperative three-body interactions) and interior cation hydration with individual ligands binding by simple charge–dipole forces (suffering from noncooperative three-body forces).44 A further issue to be addressed is the question of proton transfer to solvent. As the proton affinity of Wn clusters strongly increases with cluster size n (PA = 691, 808, 862, 900, 904, and 908 kJ mol−1 for n = 1–6),74–78 proton transfer from the NH group of the cation to the Wn solvent cluster can occur above a critical size nc.44,56,67,79 The critical size depends strongly on the structure of the molecule, functional groups, the charge and protonation state, and the way of generating the clusters. For example, for protonated benzaldehyde (C7H7O+Wn) proton transfer to the solvent is observed for n ≥ nc = 3,56 and for protonated benzonitrile at nc = 2,67 whereas in AN+Wn it occurs for n ≥ 6 or n > 12, depending on the way the clusters are generated.69,70 Calculations for CH3NH2+Wn predict no proton transfer up to n = 5.71 Our analysis of the IRPD spectra of Ama+Wn provides information on the interaction strength of the NH⋯O H-bonds, the structure of the microhydration shell (H-bonded solvent network vs. interior ion solvation), and the degree of N–H bond activation by hydration.
2. Experimental and computational techniques
IRPD spectra of Ama+Wn with n = 1–3 are recorded in a tandem quadrupole mass spectrometer coupled to an electron ionization cluster source described elsewhere.44,80 Briefly, the clusters are produced in a pulsed supersonic plasma expansion by electron and/or chemical ionization of Ama (Sigma Aldrich, >97%) close to the nozzle orifice and subsequent three-body clustering reactions. The expanding gas mixture is generated by passing Ar carrier gas (5 bar) through a reservoir containing solid Ama. To produce hydrated Ama+ clusters, distilled water is added into the gas line just before the sample reservoir. A typical mass spectrum of the ion source in the mass range m/z 115–220 is shown in the ESI† (Fig. S1). The chemical composition of the mass-selected Ama+Wn clusters is confirmed by collision-induced dissociation (CID) spectra (Fig. S2, ESI†), which show the exclusive loss of W ligands. The generated Ama+Wn parent clusters are mass selected by a first quadrupole and irradiated in an adjacent octopole with a tunable IR laser pulse (νIR) of an optical parametric oscillator pumped by a nanosecond Q-switched Nd:YAG laser. The IRPD spectra are recorded in the spectral range of 2700–3800 cm−1 to cover the informative CH, NH, and OH stretch modes. The IR laser pulses are characterized by an energy of 2–5 mJ in the considered spectral range, a repetition rate of 10 Hz, and a bandwidth of 2 cm−1. The laser frequency is calibrated to better than 1 cm−1 using a wavemeter. Resonant vibrational excitation of Ama+Wn induces evaporation of a single W ligand. Resulting Ama+Wn−1 fragment ions are selected by a second quadrupole and monitored as a function of the laser frequency to obtain the IRPD spectra of Ama+Wn. The ion source is triggered at twice the laser frequency to allow for a separation of laser-induced Ama+Wn−1 fragments from those produced by metastable decay. All IRPD spectra are normalized for frequency-dependent variations in the photon flux.
Dispersion-corrected DFT calculations are carried out at the B3LYP-D3/cc-pVTZ level for the Ama, Ama+, and W monomers and the Ama+Wn clusters to determine their structural, vibrational, and energetic properties.81 This computational approach has proven to provide reliable results for the monohydrated adamantane cation (Ad+W) and is an efficient compromise between computing time and accuracy.38 In particular, spin contamination for the open-shell Ama+ radical cation is negligible at this DFT level, with values of 〈S2〉−0.75 below 0.005 and 10−4 before and after annihilation, respectively. This is in contrast to MP2/aug-cc-pVTZ calculations, with a significantly higher contamination of 〈S2〉−0.75 = 0.04 and 0.0006 before and after annihilation, respectively. All coordinates are relaxed in the search for stationary points, and their nature as minima or transition states is verified by harmonic frequency analysis. Relative energies and equilibrium dissociation energies (Ee, De) are corrected for harmonic zero-point vibrational energy to yield E0 and D0 values. If not stated otherwise, the binding energies are computed for dissociation into the relevant Ama+Wn−1 fragment isomer and W. The total binding energies (Dtotal0) are calculated with respect to Ama+ and separated W ligands (Table S1, ESI†). Free energies (G) are obtained at room temperature (T = 298.15 K, Table S1, ESI†). Cartesian coordinates and energies of all structures are available in the ESI.† Harmonic frequencies are scaled by factors of 0.9630 and 0.9491 for OH and NH/CH stretch frequencies, respectively. These factors are derived from fitting calculated harmonic OH stretch frequencies of W and CH/NH stretch frequencies of Ama to available experimental values.42,82 Such a dual scaling factor procedure accounts for the somewhat different anharmonicities of the OH and CH/NH stretch modes. To calculate harmonic combination bands and overtones, harmonic frequencies below 2000 cm−1 (fingerprint range) are scaled by a factor of 0.9672. This factor results from fitting the calculated harmonic OH and NH bending frequencies of W and Ama to experimental values.42,82 For Ama+W, additional anharmonic calculations are performed.81 Computed IR stick spectra are convoluted with Gaussian line profiles (fwhm = 10 cm−1). Natural bond orbital (NBO) analysis is employed to evaluate the charge distribution and charge transfer in Ama+Wn, as well as the second-order perturbation energies (E(2)) of donor–acceptor orbital interactions involved in the H-bonds.83,84
3. Experimental results
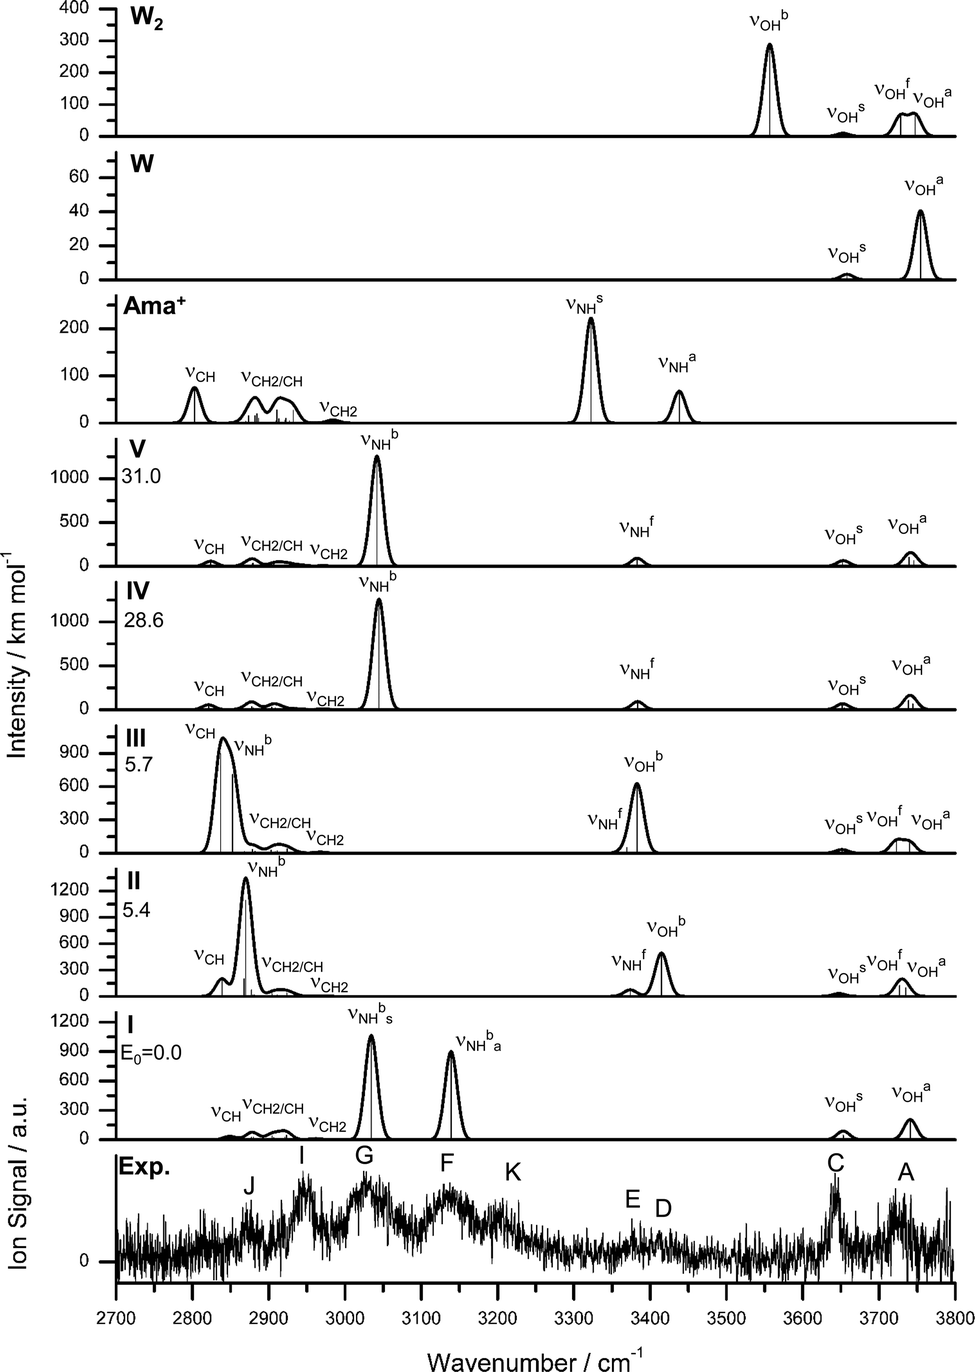
A typical mass spectrum of the electron ionization source is shown in Fig. S1 (ESI†). The molecules present in the source (Ama, W, Ar) form different cluster combinations including the desired Ama+Wn clusters. The mass spectrum is dominated by WnH+, Ama+ and its fragment ions, and hydrated Ama+Wn clusters. As mentioned above, the CID spectrum of Ama+Wn reveals only the loss of W ligands, which confirms the cluster composition and excludes unwanted isobaric mass contaminations. While the CID spectra reveal the loss of 1 to n W ligands, the IRPD process leads to the loss of only a single W ligand, because the relatively high hydration energies are comparable to the IR photon energy (D0 ∼ hνIR).The IRPD spectra of Ama+Wn with n = 1–3 are compared in Fig. 1, and the observed transitions are listed in Table 1, along with their vibrational assignments. The investigated spectral range (2700–3800 cm−1) covers free and bound OH stretch modes of the W ligands (A–D, νOH, 3400–3800 cm−1), free and bound NH stretch modes of the amino group of Ama+ (E–H, νNH, 2800–3500), aliphatic CH stretch modes of the Ama+ cage (I and J, νCH, 2800–3000 cm−1), and combination and overtone bands of the OH, NH, and CH(2) bend fundamentals (K and L, 2900–3300 cm−1). The IRPD spectra show a clear dependence on the cluster size n and thus provide insight into the details of the hydration motif with respect to both the water binding site and the structure of the solvation network.
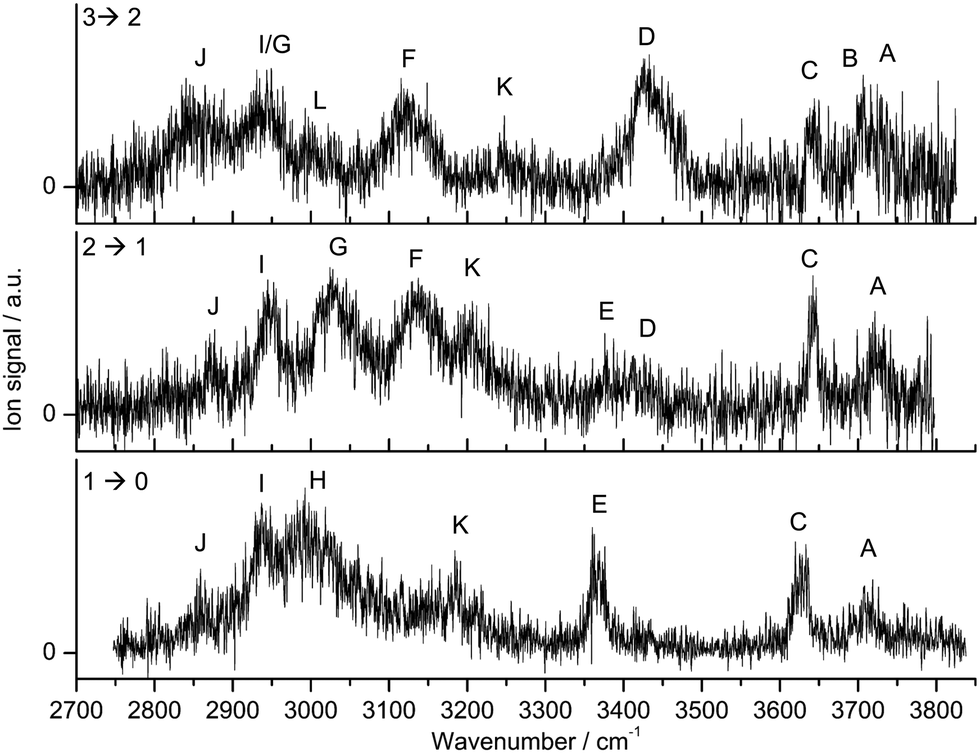 | ||
| Fig. 1 IRPD spectra of Ama+Wn=1–3 in the 2700–3800 cm−1 range recorded in the W loss channel. The spectral range investigated covers CH, NH, and OH stretch fundamentals. The positions, widths, and assignments of the transitions observed (A–L) are listed in Table 1. | ||
=1–3 (Fig. 1)a
| Peak | Mode | Ama+W | Ama+W2 | Ama+W3 |
|---|---|---|---|---|
| a All values are given in cm−−1. b Combination or overtone band. | ||||
| A | ν OH a | 3717 (28) | 3721 (24) | 3730 (20) |
| B | ν OH f | 3707 (12) | ||
| C | ν OH s | 3627 (31) | 3642 (17) | 3644 (21) |
| D | ν OH b | 3413 (30) | 3426 (86) | |
| E | ν NH f | 3368 (27) | 3376 (28) | |
| F | ν NH b a | 3137 (68) | 3116 (97) | |
| G | ν NH b s | 3027 (58) | 2944 (45) | |
| H | ν NH b | 2992 (66) | ||
| I | ν CH2 | 2937 (35) | 2949 (37) | 2944 (45) |
| J | ν CH | 2858 (20) | 2874 (29) | 2840 (40) |
| K | 3187 (20) | 3206 (32) | 3247 (15) | |
| L | 2993 (20) | |||
The IRPD spectrum of the Ama+W monohydrate contains clear signatures for the predominant presence of a single H-bonded isomer, in which W binds as an acceptor in an NH⋯O ionic H-bond to one of the acidic NH groups of Ama+. Such a structure is expected from the strong charge–dipole forces between the Ama+ cation and dipolar W, which dominate the long-range part of the intermolecular attraction. The two coupled free OH stretch modes of W appear at 3717 (A, ν3 = νOHa, antisymmetric OH stretch) and 3627 cm−1 (C, ν1 = νOHs, symmetric OH stretch) with a width of about 30 cm−1. Their redshifts of 39 and 30 cm−1 from the corresponding transitions of bare W (ν3 = 3756 cm−1, ν1 = 3657 cm−1), as well as the IR enhancement of ν1 are typical for cation–W clusters.44,51,63,64,67 Only a single band appears in the spectral range of the free NH stretch modes of Ama+ (3300–3450 cm−1), which is readily assigned to the remaining free NH group of the H-bonded Ama+W dimer (E, νNHf, 3368 cm−1). The absence of a second intense free NH stretch band implies that nearly all detected Ama+W isomers feature a strong NH⋯O ionic H-bond involving the amino group, which shifts the resulting bound NH stretch (νNHb) down to the spectral range 2800–3100 cm−1. In this range, it couples strongly with NH, OH, and CH(2) bend overtones (via anharmonic Fermi resonances) as well as CH stretch fundamentals (via local mode mixing), giving rise to a broad vibrational multi-band pattern in the IRPD spectrum. A similar complex pattern has previously been observed for a variety of monohydrated cationic dimers with a NH⋯O ionic H-bond such as formanilide, acetanilide, hydroxyindole, or pyrrole.54,57,60–62 As the νNHb band is expected to carry the highest IR oscillator strength, it is assigned to the broad band H at 2992 cm−1 with a width of 66 cm−1. Its large redshift of 376 cm−1 from νNHf is a measure of the strength of the NH⋯O H-bond. The interpretation of the sharper bands I, J, and K at 2937, 2858, and 3187 cm−1 are less obvious. By comparison with the Ad+W spectrum,38 bands I and J are assigned to CH stretch modes, while band K is attributed to a combination or overtone band.
Most transitions in the IRPD spectrum of Ama+W2 show only small changes in frequency and intensity compared to the n = 1 spectrum, with the major exception that the transitions in the free NH stretch range disappear almost completely (e.g., E), while the intense transition H in the bound NH stretch range now splits into the doublet F and G. Thus, the coarse structure of the Ama+W2 spectrum demonstrates the predominant presence of an isomer, in which the two W ligands bind separately to the two NH groups of Ama+ leading to the formation of two equivalent NH⋯O H-bonds. In line with this interpretation, bands A and C at 3721 and 3642 cm−1 are attributed to νOHa and νOHs of the individual uncoupled W ligands. Their redshifts from the transitions of bare W, 35 and 15 cm−1, are slightly smaller than those for n = 1, because of the noncooperative (i.e., anticooperative) three-body effects typical for interior ion solvation.44,55 Peaks F and G at 3137 and 3027 cm−1 are then readily assigned to bound antisymmetric and symmetric NH stretch modes, νNHba and νNHbs, respectively. The centre of the two bands at 3082 cm−1, which is a measure for the strength of the N–H bonds, is blueshifted by 90 cm−1 from νNHb of n = 1 (H), confirming that the NH⋯O H-bonds in n = 2 are indeed weaker than in n = 1. Peaks J and I at 2874 and 2949 cm−1 assigned to CH stretch modes are also slightly blueshifted from the corresponding n = 1 transitions, consistent with their mixing with the NH stretch modes. Band K at 3206 cm−1 also has a somewhat higher frequency than in n = 1. The weak bands E and D at 3376 and 3413 cm−1 are clear spectral signatures of a less abundant isomer, in which a H-bonded W2 dimer is attached to one of the acidic NH groups of Ama+. This isomer has a remaining free NH stretch mode (νNHf) assigned to band E, and this band is slightly blueshifted by 8 cm−1 compared to that of n = 1. Band D is attributed to the bound OH stretch mode of the W2 dimer corresponding to the OH donor in the OH⋯O H-bond (νOHb). Its frequency is drastically reduced from the corresponding transition in bare W2 (3601 cm−1),85 because of the large cooperativity of the H-bonded network, which arises from the strong polarisation forces induced by the nearby positive charge of Ama+. The weak intensities of bands D and E indicate that this isomer is far less abundant than the isomer in which both NH groups of Ama+ are solvated by a single W. As a result, the free uncoupled OH stretch of the proton donor (νOHf) expected near 3700 cm−1 is not visible.
The appearance of the Ama+W3 spectrum is consistent with a predominant isomer, in which one NH group of Ama+ is solvated by W and the other one by W2. As a result, the bands associated with the W2 ligand become very prominent in the OH stretch range, and the characteristic bound and free OH stretch modes of the proton donor W molecule are clearly apparent at 3426 (D, νOHb) and 3707 cm−1 (B, νOHf), while the free OH stretch modes of the acceptor occur at 3730 (A, νOHa) and 3644 cm−1 (C, νOHs). The νOHa/s modes of the single W ligand overlap with bands A and C. The fact that band E disappears completely for n = 3 implies that at this cluster size both NH bonds of the NH2 group are fully solvated, and that isomers with a free N–H bond and one N–H bond solvated with W3 are below the detection limit. The bound NH stretch modes are now quite decoupled, because of asymmetric solvation of the NH2 group with W and W2. Because W2 has a much higher proton affinity than W (808 and 691 kJ mol−1),74,75 the NH⋯W2 H-bond is much stronger than the NH⋯W H-bond, giving rise to a larger redshift in νNHb. Thus, band F at 3116 cm−1 is assigned to νNHb of the NH⋯W moiety, while band G at 2944 cm−1 is attributed to νNHb of the NH⋯W2 unit. Band J at 2840 cm−1 is broader and redshifted compared to the n = 2 spectrum, while band I overlaps with band G. There are weaker bands L and K at 2993 and 3247 cm−1, whose interpretation is again less obvious. In summary, the IRPD spectra of Ama+Wn with n = 1–3 can be interpreted with a predominant sequential cluster growth, in which the two acidic NH protons of the amino group of Ama+ are first solvated by single W ligands via NH⋯O ionic H-bonds (n = 1–2), before further W molecules are attached to the initial W ligands via the formation of an OH⋯O bonded network (n = 3). In order to identify more precise structural motifs, DFT calculations are employed in Section 4.
4. Computational results and assignments
4.1. Ama, Ama+, and W
In an effort to determine the structures responsible for the IRPD spectra, quantum chemical calculations are performed at the B3LYP-D3/cc-pVTZ level. The calculated structures of the Ama, Ama+, and W monomers are shown in Fig. 2. The structure of Ama (Cs) in its 1A′ ground electronic state consists of a pyramidal NH2 group (θCNX = 124° with the dummy atom X located on the C2 axis of the NH2 group) attached to an adamantyl cage (C10H15), which has slightly different binding parameters compared to Ad arising from H → NH2 substitution (Fig. S3, ESI†).35,38 Especially the C–C bond adjacent to the NH2 group in the Cs plane is significantly longer than in Ad (rCC = 1.544 vs. 1.538 Å). The NH2 group in Ama has similar binding parameters (θHNH = 106.4°, rNH = 1.015 Å, rCN = 1.467 Å) as in CH3NH2 (θHNH = 106.4°, rNH = 1.013 Å, rCN = 1.465 Å, Fig. S4, ESI†). The calculated structure and IR spectrum of Ama (Fig. 3) is consistent with previous computational and experimental data.41,42,86,87 Concerning W, the O–H bond parameters in its 1A1 ground state (rOH = 0.961 Å, ν1/3 = 3658/3754 cm−1) agree well with the experimental data (0.9578 Å, 3657/3756 cm−1).88,89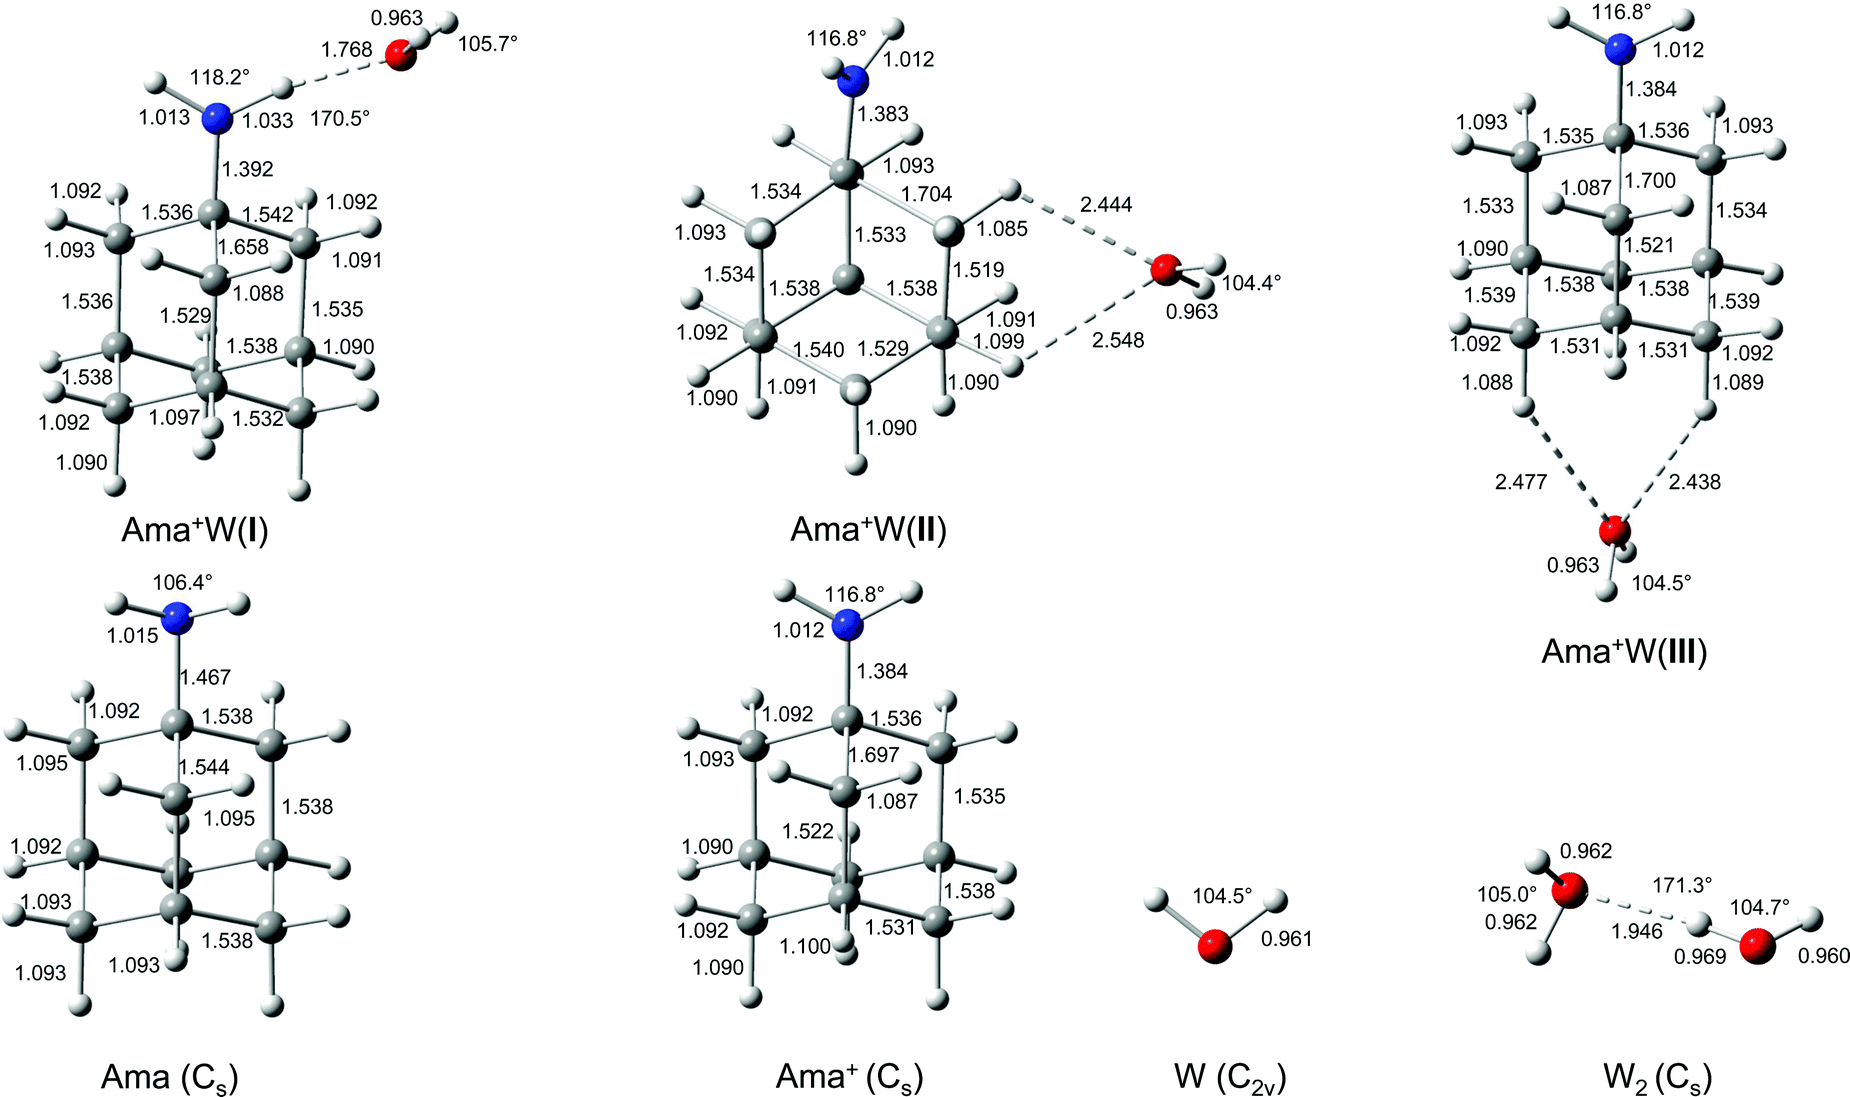 | ||
| Fig. 2 Calculated equilibrium structures (in Å and degrees) of W, W2, Ama, Ama+, and Ama+W(I–III) in their ground electronic state (B3LYP-D3/cc-pVTZ). | ||
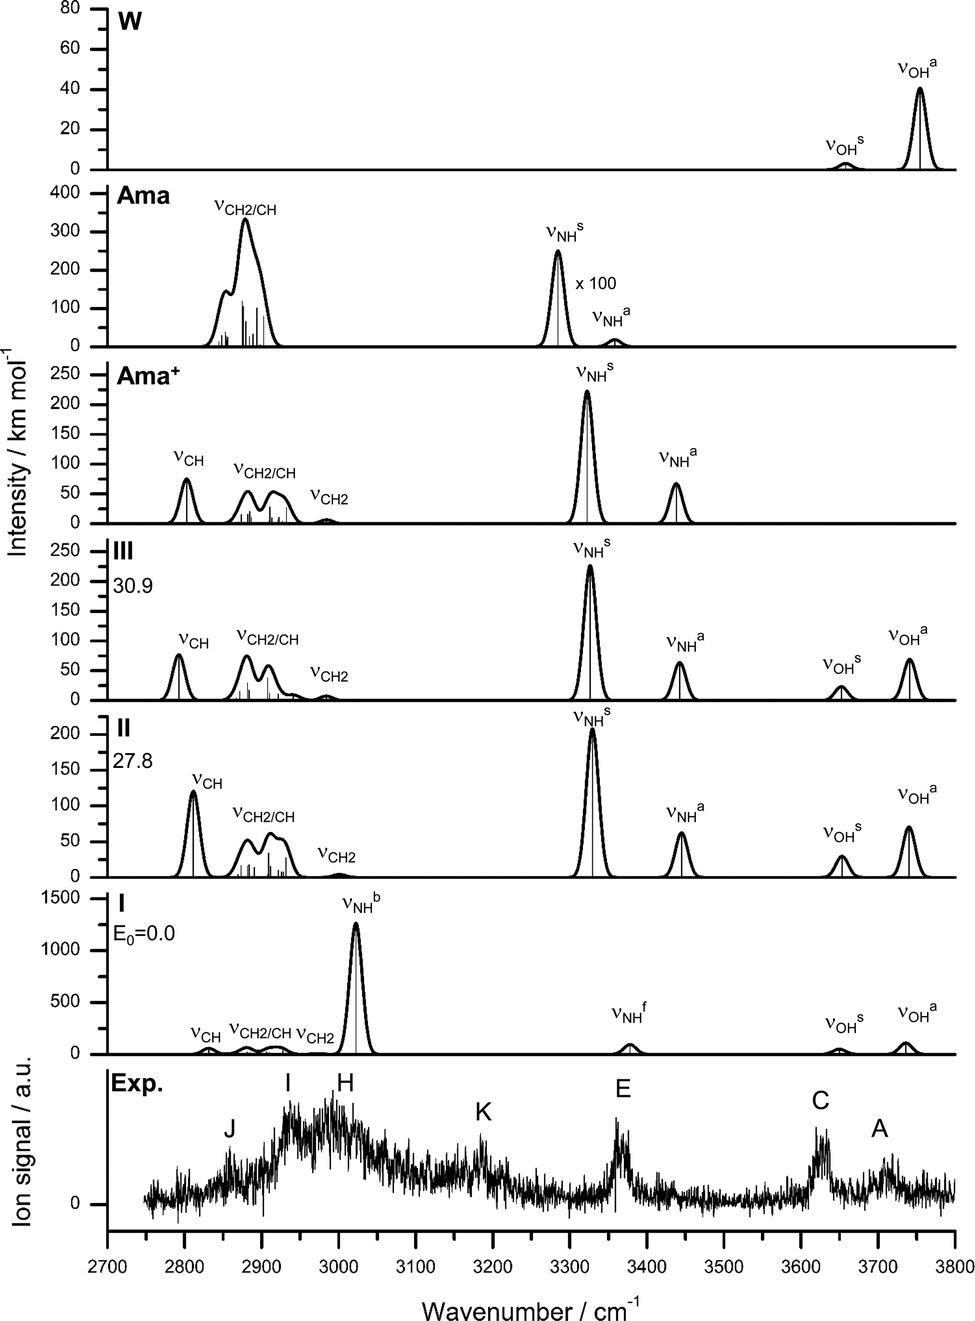 | ||
| Fig. 3 IRPD spectrum of Ama+W compared to linear IR absorption spectra of W, Ama, Ama+, and Ama+W(I–III) calculated at the B3LYP-D3/cc-pVTZ level. The positions of the transition observed in the IRPD spectrum of Ama+W and their vibrational assignment are listed in Table 2. Differences in relative energy (ΔE0) are given in kJ mol−1 for isomers I–III. | ||
Ionization of Ama into the ground electronic state of Ama+ (2A′, Cs) occurs by removal of one electron from the HOMO, which is largely described by the nonbonding a′ lone pair orbital of N, as illustrated by the orbitals of Ama(+) shown in Fig. S5 (ESI†).41 As a result, the pyramidal NH2 group becomes essentially planar upon ionization (θCNX = 170.7°, close to the NH3 case with θHNX = 180°), with the NH2 plane being perpendicular to the symmetry plane. As a result, the NH2 angle opens up from 106 to 117°. Due to the increasing conjugation of the nitrogen lone pair orbital, the bond order of the C–N bond increases substantially from 1 to ∼1.5, as illustrated by the massive bond contraction of 83 mÅ. Ionization increases the charge on the NH2 group by Δq = 474 me, which is substantially smaller than in the related CH3NH2(+) molecule, because of enhanced charge delocalization into the adamantyl cage (Fig. S6, ESI†). Nonetheless, qNH2 = 313 me remains on the NH2 group in Ama+ (as compared to 597 me in CH3NH2+), making this binding site highly attractive for the W ligands. Ionization slightly contracts the N–H bonds by 3 mÅ, leading to significantly higher frequencies (∼40/80 cm−1) for the free symmetric and antisymmetric NH stretch normal modes (νNHs = 3322 vs. 3285 cm−1 and νNHa = 3438 vs. 3358 cm−1, Fig. 3 and Table 2). Ionization also increases the positive charge of the NH protons to qH = 405 me, which drastically enhances the IR intensity of the NH stretch modes (by two orders of magnitude). Because the charge on the NH protons is much higher than on all CH protons (206–232 me), the resulting rather acidic N–H bonds are excellent H-bond donors for NH⋯O ionic H-bonds with W. Most of the C–C bonds of the Ama cage remain nearly unchanged. The notable exception is the C–C bond adjacent to the C–N bond denoted C–Cext (which elongates by 153 mÅ), because it lies in the symmetry plane and thus can conjugate with the in-plane lone pair of N. The next adjacent C–Cadj bond in the Cs plane shortens by a smaller amount (16 mÅ) because of the increased distance from the N lone pair, thus damping the conjugation effects. Ionization increases the variation of the C–H bond lengths drastically from 1.092–1.095 Å (ΔrCH = 3 mÅ) in Ama to 1.087–1.100 Å in Ama+ (ΔrCH = 13 mÅ). As a result, the single broad and unresolved intense convoluted band of the coupled νCH(2) stretch vibrations in the computed IR spectrum of Ama splits for Ama+ into four better resolved and more widely spread bands, including one intense peak of the isolated νCH mode at 2803 cm−1, two broader peaks of νCH/CH2 modes at 2882 and 2914 cm−1, and one weak peak of the isolated νCH2 mode at 2984 cm−1 (Table 2). The isolated low and high frequency transitions result from the long and short C–H bonds at the C atoms in the symmetry plane of Ama+, where the HOMO is concentrated. The adiabatic computed ionization energy of 7.95 eV corresponds well with the measured vertical value of 8.6 eV, derived from low-resolution electron momentum spectra.41
| Mode | Ama | Ama+ | W | Ama+W(I) | Ama+W exp. |
|---|---|---|---|---|---|
| a IR intensities in km mol−1 are given in parentheses. The computational data for isomers II and III are available in Table S2 (ESI). The experimental frequencies with width (fwhm in parenthesis) are assigned to the most dominant vibrations. b Harmonic value. c Result of anharmonic calculation. | |||||
| ν CH | 2845 (13) | 2803 (76) | 2831 (59) | J 2858 (20) | |
| ν CH2 | 2848 (30) | 2870 (4) | 2869 (11) | ||
| ν CH2 | 2853 (39) | 2874 (16) | 2879 (12) | ||
| ν CH2 | 2854 (29) | 2882 (16) | 2881 (14) | ||
| ν CH2 | 2855 (18) | 2884 (20) | 2882 (22) | ||
| ν CH2 | 2856 (25) | 2887 (10) | 2884 (14) | ||
| ν CH2/νCH | 2875 (119) | 2910 (5) | 2906 (23) | ||
| ν CH2/νCH | 2876 (105) | 2911 (28) | 2909 (14) | ||
| ν CH2/νCH | 2880 (66) | 2912 (1) | 2911 (14) | ||
| ν CH2/νCH | 2884 (26) | 2913 (10) | 2915 (7) | ||
| ν CH2 | 2888 (12) | 2922 (6) | 2919 (5) | ||
| ν CH2 | 2889 (33) | 2922 (11) | 2922 (7) | ||
| ν CH2 | 2894 (102) | 2927 (4) | 2923 (12) | ||
| ν CH2 | 2898 (5) | 2932 (27) | 2927 (36) | I 2937 (35) | |
| ν CH2 | 2903 (80) | 2984 (7) | 2973 (7) | ||
| ν NH b | 3022 (1267) | H 2992 (66) | |||
| 2βCH2 | 2960b | I 2937 (35) | |||
| 2940 (12)c | |||||
| β NH + βOH | 3187b | K 3187 (20) | |||
| 3167 (136)c | |||||
| ν NH f | 3378 (95) | E 3368 (27) | |||
| ν NH s | 3285 (3) | 3322 (223) | |||
| ν NH a | 3358 (0.2) | 3438 (67) | |||
| ν OH s | 3658 (3) | 3650 (51) | C 3627 (31) | ||
| ν OH a | 3754 (40) | 3736 (110) | A 3717 (28) | ||
4.2. Ama+W
The Ama+ cation offers three main attractive binding sites for dipolar W, which can be attached either to the NH2 group (isomer I) or to the side (II) or bottom (III) of the Ama+ cage (Fig. 2 and Table S1, ESI†). The computed IR spectra of all Ama+W isomers are compared in Fig. 3 to the experimental IRPD spectrum and to those calculated for Ama, Ama+, and W. The position and widths of the transitions observed in the IRPD spectrum of Ama+W are listed in Table 2, along with their vibrational assignments. While W forms in the most stable isomer I a strong NH⋯O ionic H-bond to the NH2 group (E0 = 0), it is attached in II and III to the Ama+ cage by substantially weaker charge–dipole forces resulting in much higher relative energies (E0 = 27.8 and 30.9 kJ mol−1). All structures have a favourable charge–dipole configuration, with the electronegative O atom of W pointing toward the Ama+ cation. Due to the low ionization energy of Ama and the higher proton affinity of the amantandinyl radical as compared to W (IE = 7.95 vs. 12.6 eV, PA = 960 vs. 691 kJ mol−1)42,74 neither charge nor proton transfer occurs upon monohydration.In the Ama+W(I) global minimum, W forms a strong and nearly linear NH⋯O H-bond (170.5°) to the NH2 group, with a bond length of 1.768 Å and a high binding energy of D0 = 61.4 kJ mol−1 (Fig. 2). The barrier for internal W rotation around its C2 rotational axis is relatively high (Vb = 3.28 kJ mol−1 or 274 cm−1) and the pyramidal angle of the amino group is nearly unchanged from that in bare Ama+ (θCNX = 170.1°). Upon monohydration, the N–H bond is stretched by 21 mÅ and the NH2 bond angle increases by 1.4° to 118.2°. As a result, its bound NH stretch frequency shifts down to νNHb = 3022 cm−1 along with a drastic enhancement in IR intensity (by a factor 6), as is typical for RNH2+-W dimers.55 The redshift of 358 cm−1 from the average NH stretch frequency of Ama+ (νNHav = 3380 cm−1) is a direct measure of the strength of the H-bond. The remaining free N–H bond does not change its strength (≤1 mÅ) resulting in a less intense νNHf mode at 3378 cm−1, essentially unshifted from νNHav (ΔνNH = 2 cm−1). The NBO charge analysis shows that formation of the H-bond involves a charge transfer of 38 me from Ama+ to W and a second order perturbative energy of E(2) = 33.9 kJ mol−1 for the donor–acceptor interaction between the lone pairs of O and the antibonding σ* orbital of the N–H donor bond. As a result, the O–H bonds of W elongate by 2 mÅ and the W bond angle increases by 1.2°. Further, the free OH stretch modes νOHs and νOHa experience redshifts of 8 and 18 cm−1 and a substantial IR intensity enhancement (factor 17 and 3). These effects are typical for the formation of cation–W clusters.44 Apart from the NH2 group, monohydration has also a certain impact on the structure of the Ama+ cage. Because of partial charge transfer from Ama+ to W, the molecule gets more neutral again, and as a result the structural effects upon ionization of Ama are somewhat reduced. For example, the strongly contracted C–N bond upon ionization is slightly elongated again by 8 mÅ upon hydration, the C–Cext bond contracts by 39 mÅ, and the C–Cadj bond elongates by 7 mÅ. As a result, the low-frequency νCH mode is blueshifted by 28 cm−1 to 2831 cm−1, while the remaining CH and CH2 stretch frequencies do not change much (Fig. 3).
There is a large energy gap of ∼30 kJ mol−1 between the global minimum I and the next two local minima II and III. Due to their high relative energy, they are not observed experimentally and we do not discuss them in detail here. Briefly, W binds in II and IIIvia CH⋯O contacts to two CH2 groups of Ama+ with low binding energies of D0 = 33.6 and 30.6 kJ mol−1, respectively. The Ama+⋯W bonds in II and III are essentially based on electrostatic charge–dipole forces with long intermolecular distances of more than 2.4 Å. Because of the strongly nonlinear CH⋯O contacts, there is little contribution from H-bonding. As a result, charge transfer is minor (Δq < 9 me) and E(2) ≤ 2 kJ mol−1. Due to this weak intermolecular bonding, complex formation in II and III has much less impact on the structures of both monomer units than for I. Consequently, the resulting IR spectra are essentially an addition of those of W and Ama+ in the considered spectral range, with characteristic intense free NH stretch bands at ∼3330 and ∼3440 cm−1 (Fig. 3 and Table S2, ESI†).
The comparison of the measured IRPD spectrum of Ama+W with the linear IR spectra computed for isomers I–III in Fig. 3 immediately demonstrates the predominant abundance of the most stable structure I, because of the observation of only a single free intense NH stretch band between 3300 and 3450 cm−1. Based on the achieved signal-to-noise ratio and the computed oscillator strengths, the absence of the two bands of the free and fully coupled intense NH stretch modes of the unperturbed NH2 group of II and III near ∼3330 and ∼3440 cm−1 provides an estimate of the upper limit of their abundance as ∼15%. Thus, the whole observed spectrum is fully attributed to isomer I whose computed spectrum agrees well with the measured one. Specifically, bands E and H at 3368 and 2992 cm−1 are readily assigned to the free and bonded NH stretch bands predicted at νNHf = 3378 cm−1 and νNHb = 3022 cm−1. Both frequencies are close to those found for the related ABN+W dimer at 3433 and 3040 cm−1, a complex with a similar NH⋯O H-bond between a cationic amine and W.55 Moreover, due to the larger redshifts of the free OH stretch frequencies of isomer I, the observed bands C and A at 3627 and 3717 cm−1 agree better with those predicted for I (3650 and 3736 cm−1) than for II and III. Peak J (2858 cm−1) and I (2937 cm−1) are attributed to the νCH/CH2 modes of the adamantyl cage, and these agree indeed well with the corresponding bands measured for Ad+ (2868/2875 and 2954/2942 cm−1).35,38 While J is assigned to the intense νCH mode predicted at 2831 cm−1, peak I is associated with several overlapping CH2 modes. If only the most intense CH2 mode (2927 cm−1, I = 36 km mol−1) is taken into account, the deviation is only 10 cm−1. The high intensity of peak I cannot be explained by a fundamental mode of isomer I and is probably enhanced from signal of the intense band H (νNHb). Possibly, an overtone of a CH2 bending mode at 1480 cm−1 (anharmonic: 2βCH = 2940 cm−1) may gain intensity by a Fermi resonance with the strongly IR active νNHb mode at 3022 cm−1 and thus contribute further to the intensity of band I. The isolated peak K at 3187 cm−1 can also not be explained by a fundamental transition of isomer I but may be associated with a combination band βNH + βOH at 3187 cm−1 of the symmetric (1578 cm−1) and antisymmetric (1609 cm−1) coupled OH and NH bending modes. The anharmonic vibrational calculation of the IR spectrum of Ama+W(I) supports such a scenario and predicts the combination band βNH + βOH at 3167 cm−1 with high intensity (I = 136 km mol−1).
4.3. Ama+W2
The IRPD spectrum of Ama+W2 detailed in Fig. 1 (Table 1) shows only very weak activity in the free NH stretch range, providing a strong indication that both NH donors of the NH2 group of Ama+ are hydrated in the predominant isomer. The weak band E near 3350 cm−1 (νNHf) may be taken as evidence for minor isomers in which only one of the N–H bonds is solvated. The absence of any signal in the range of νNHs and νNHa near 3350 and 3450 cm−1 suggests that the population of isomers with a completely free NH2 group is below the detection limit. Consequently, we investigated computationally only isomers in which one or both NH groups are hydrated. Indeed, based on the Ama+W dimer potential, such isomers are expected to be by far lowest in energy. The structures of the five isomers found are shown in Fig. 4 and Table S1, ESI.† Their calculated IR spectra are compared in Fig. 5 to the IRPD spectrum of Ama+W2 and the IR spectra computed for Ama+, W, and W2 (Table 3 and Table S3, ESI†).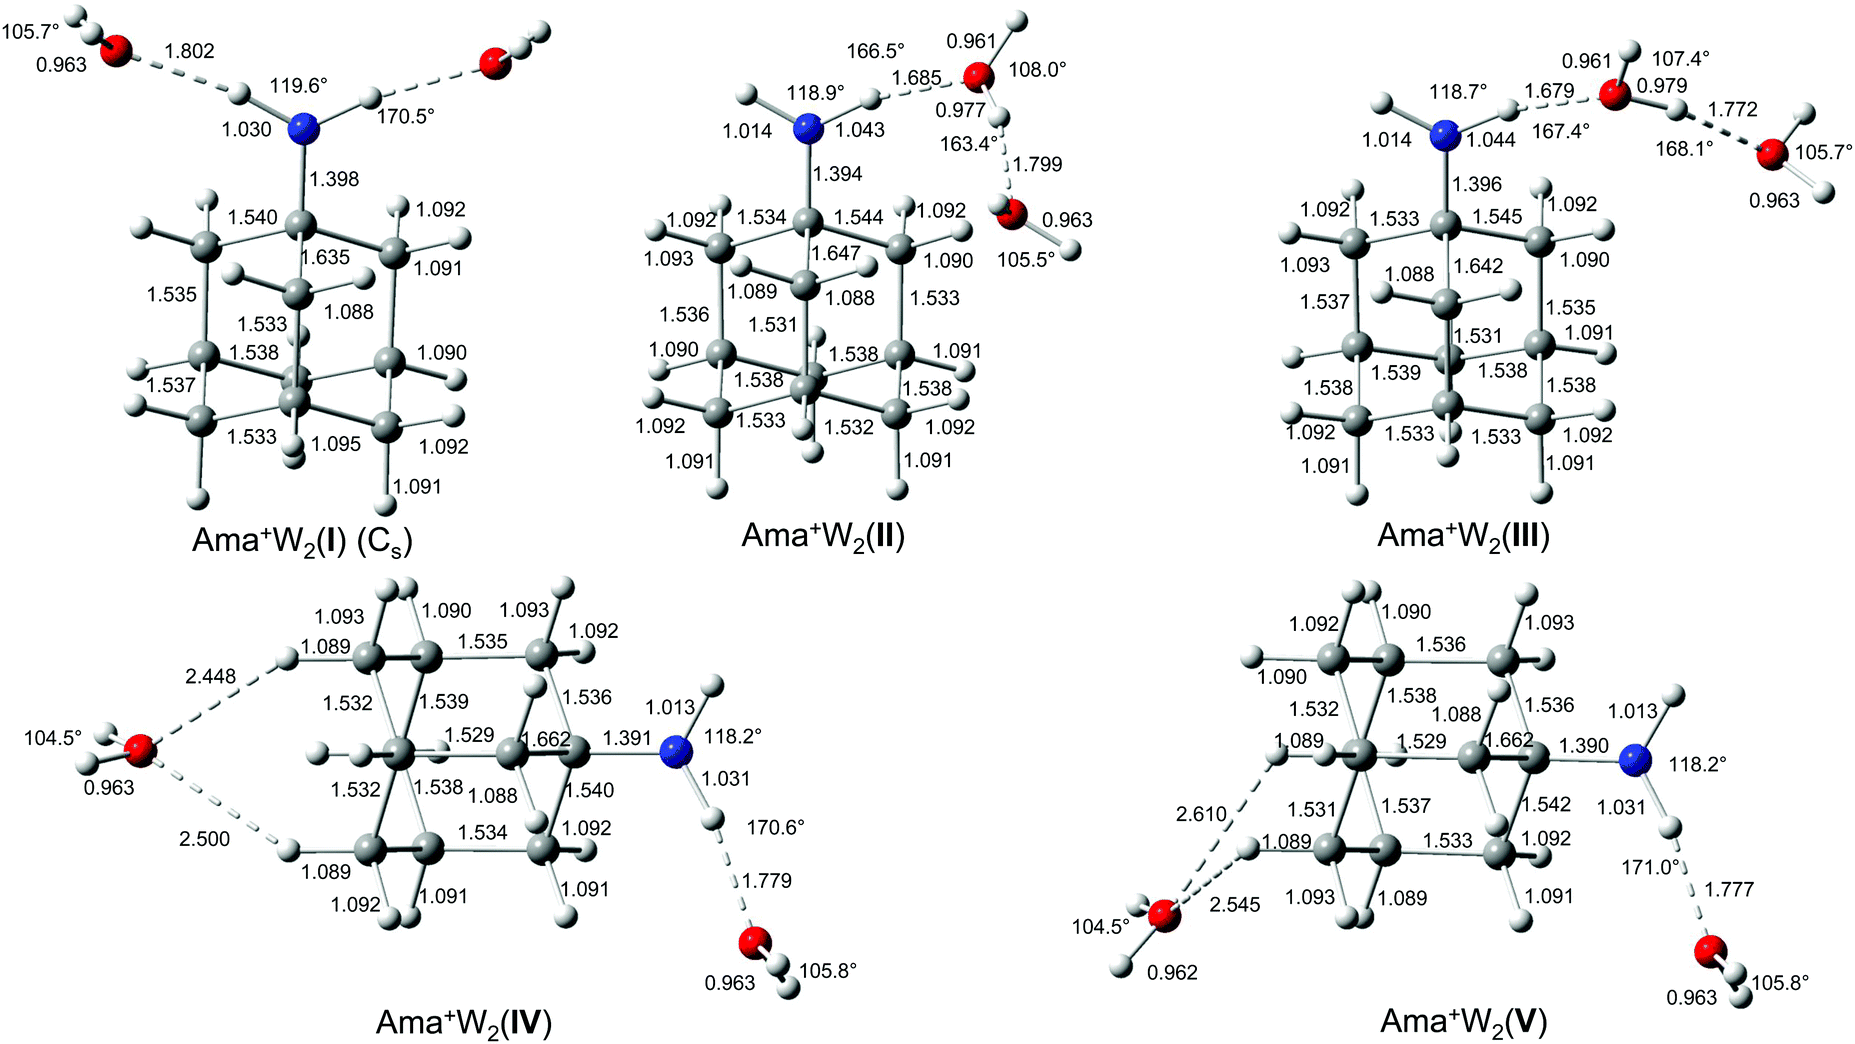 | ||
| Fig. 4 Calculated equilibrium structures (in Å and degrees) of Ama+W2(I–V) in their ground electronic state (B3LYP-D3/cc-pVTZ). | ||
 | ||
| Fig. 5 IRPD spectrum of Ama+W2 compared to linear IR absorption spectra of Ama+, W, W2, and Ama+W2(I–V) calculated at the B3LYP-D3/cc-pVTZ level. The positions of the transition observed in the IRPD spectrum of Ama+W2 and their vibrational assignment are listed in Table 3. Differences in relative energy (ΔE0) are given in kJ mol−1 for isomers I–V. | ||
| Mode | Ama+ | W2 | Ama+W2(I) | Ama+W2(II) | Ama+W2(III) | Ama+W2 exp. |
|---|---|---|---|---|---|---|
| a IR intensities in km mol−1 are given in parentheses. The experimental frequencies with width (fwhm in parenthesis) are assigned to the most dominant vibrations. The computational data for isomers IV and V are available in Table S3 (ESI). | ||||||
| ν CH | 2803 (76) | 2849 (36) | 2839 (201) | 2837 (896) | J 2874 (29) | |
| ν CH2 | 2870 (4) | 2876 (0.4) | 2868 (199) | 2868 (15) | J 2874 (29) | |
| ν CH2 | 2874 (16) | 2876 (17) | 2877 (75) | 2878 (14) | ||
| ν CH2 | 2882 (16) | 2877 (27) | 2879 (13) | 2879 (33) | ||
| ν CH2 | 2884 (20) | 2880 (25) | 2881 (16) | 2882 (16) | ||
| ν CH2 | 2887 (10) | 2881 (9) | 2887 (7) | 2885 (8) | ||
| ν CH2/νCH | 2910 (5) | 2904 (39) | 2904 (28) | 2903 (27) | ||
| ν CH2/νCH | 2911 (28) | 2907 (23) | 2909 (10) | 2909 (12) | ||
| ν CH2/νCH | 2912 (1) | 2909 (1) | 2911 (16) | 2911 (23) | ||
| ν CH2/νCH | 2913 (10) | 2915 (3) | 2912 (10) | 2912 (7) | ||
| ν CH2 | 2922 (6) | 2917 (0.03) | 2918 (7) | 2917 (10) | ||
| ν CH2 | 2922 (11) | 2919 (12) | 2919 (7) | 2919 (5) | ||
| ν CH2 | 2927 (4) | 2921 (24) | 2924 (40) | 2924 (39) | ||
| ν CH2 | 2932 (27) | 2923 (46) | 2933 (15) | 2935 (8) | I 2949 (37) | |
| ν CH2 | 2984 (7) | 2962 (12) | 2970 (4) | 2967 (10) | ||
| 2βCH2 | 2958 | I 2949 (37) | ||||
| ν NH b | 2870 (1094) | 2853 (711) | J 2874 (29) | |||
| ν NH b s | 3034 (1065) | G 3027 (58) | ||||
| ν NH b a | 3139 (901) | F 3137 (68) | ||||
| β NH + βOH | 3191 | K 3206 (32) | ||||
| ν NH f | 3374 (75) | 3369 (51) | E 3376 (28) | |||
| ν NH s | 3322 (223) | |||||
| ν NH a | 3438 (67) | |||||
| ν OH b | 3557 (290) | 3415 (494) | 3383 (612) | D 3413 (30) | ||
| ν OH s | 3653 (10) | 3652 (48) | 3647 (33) | 3651 (33) | C 3642 (17) | |
| ν OH s | 3653 (41) | C 3642 (17) | ||||
| ν OH f | 3728 (65) | 3727 (124) | 3722 (111) | A 3721 (24) | ||
| ν OH a | 3747 (68) | 3741 (5) | 3735 (100) | 3740 (100) | A 3721 (24) | |
| ν OH a | 3741 (201) | A 3721 (24) | ||||
In the Ama+W2(I) global minimum structure with Cs symmetry, both N–H bonds of the NH2 group are symmetrically monohydrated by a single W ligand in form of nearly linear NH⋯O ionic H-bonds (170.5°). Due to noncooperative effects typical for internal ion solvation, the binding energy of D0 = 56.9 kJ mol−1 is slightly lower (by 7.3%) than that of the corresponding Ama+W(I) dimer (D0 = 61.4 kJ mol−1). As a result, the H-bond is slightly longer (1.802 vs. 1.768 Å) and described by a lower orbital interaction energy (E(2) = 29.4 vs. 33.9 kJ mol−1) and smaller charge transfer (34 vs. 38 me, Fig. S7, ESI†). Consequently, the intramolecular N–H bonds in n = 2 are less stretched than in n = 1 (1.030 vs. 1.033 Å) and the NH2 angle increases further (119.6° vs. 118.2°). The pyramidal character of the amino group is not much affected (θCNX = 171.1°). Due to symmetric water solvation of both N–H bonds, both NH stretch frequencies shift down to 3034 (νNHbs) and 3139 cm−1 (νNHba) along with a strong increase in IR intensity. Their centre frequency (3137 cm−1) is somewhat higher than νNHb in n = 1 (3022 cm−1) due to the weaker NH⋯O H-bonds in n = 2. Just as with Ama+W(I), the O–H bonds in W are elongated by 2 mÅ and the W bond angle is increased by 1.2°. This effect shifts the νOHs and νOHa modes to 3653 and 3741 cm−1 along with an increase in IR intensity. Upon addition of two W molecules to Ama+, the C–N bond becomes further elongated (1.398 Å), while the C–Cext bond contracts further (1.635 Å). These two geometry effects are amplified by the second W ligand.
In the slightly less stable isomers II and III of Ama+W2 (E0 = 5.4 and 5.7 kJ mol−1), a H-bonded W2 dimer is attached to the NH2 group via a NH⋯O ionic H-bond. These isomers correspond to the formation of a H-bonded solvent network, which is strongly cooperative in nature. The orientation of the W2 unit differs slightly in the two isomers, because they are stabilized by weak secondary CH⋯O contacts involving two different CH2 groups adjacent to the CNH2 moiety (2.579 and 2.626 Å for II and III). Because the proton affinity of W2 is much larger than for W (808 vs. 691 kJ mol−1),74,75 the NH⋯W2 H-bonds in II and III are much stronger and shorter than the NH⋯W H-bonds in isomer I of n = 1 (and also n = 2), with R = 1.685/1.679 (II/III) vs. 1.768 Å, respectively. As a result, charge transfer to the solvent is increased from 38 to 57/60 me, while E(2) increases from 33.9 to 46.8/51.8 kJ mol−1. Due to the stronger H-bond, the bound N–H bond elongates from 1.033 to 1.043/1.044 Å, which shifts its νNHb frequency from 3022 cm−1 further down to 2870/2853 cm−1. In case of III, this leads to strong mode mixing with the CH stretch mode at 2837 cm−1, which thus gains substantial IR activity from the NH stretch mode. The free N–H bond of II and III elongates only slightly by the addition of the second W ligand (by 1 mÅ), leading to a small decrease in νNHf (by 4 and 9 cm−1). The presence of the nearby Ama+ charge causes, via strongly cooperative three-body polarization forces, the OH⋯O H-bond in the W2 unit in II and III to be much stronger and shorter than in bare W2 (1.799/1.772 Å vs. 1.946 Å). The binding energy of the terminal W ligand of D0 = 51.6/51.3 kJ mol−1 exceeds by far the one in bare neutral W2 (19.7 kJ mol−1) and reaches almost the strength of the NH⋯O ionic bonds in isomer I (56.9 kJ mol−1). The large cooperativity in total binding energy amounts to 11% for II/III, and makes these isomers energetically competitive with I. The OH⋯O H-bond in III is somewhat stronger and more linear (168.1 vs. 163.4°) than in II, with a larger redshift in the bound OH stretch frequency from bare W2 (νOHb = 3383/3415 vs. 3557 cm−1), which places this band with high intensity into the vicinity of the free NH stretch bands of Ama+. These frequencies are in line with the bond lengths of the O–H proton donor bond (0.979/0.977 vs. 0.969 Å). The corresponding free O–H bond remains largely unchanged and produces an uncoupled νOHf band at 3727/3722 cm−1, while the νOHs and νOHa bands of the terminal W acceptor ligands are predicted at 3647/3651 and 3735/3740 cm−1. The C–N bonds (1.394 Å, 1.396 Å) are shorter and the extended C–Cext bonds (1.647 Å, 1.642 Å) are longer compared to Ama+W2(I), which however has no big influence on the CH2 frequencies.
There is a large energy gap of 23 kJ mol−1 between III and the higher energy Ama+W2 isomers IV and V at E0 = 28.6 and 31.0 kJ mol−1, so that we do not discuss them in detail. Briefly, both isomers have one W attached to the NH2 group (D0 = 59.2 and 56.8 kJ mol−1 for IV and V) and one to the CH2 groups on the opposite side of the Ama+ cage (D0 = 28.4 and 25.9 kJ mol−1). They result essentially by an addition of isomers I + II and I + III of the n = 1 cluster. Because the two W ligands do not interact much, their intermolecular bonding and resulting IR spectra in the NH and OH stretch range are similar to that of isomer I of n = 1.
Comparison of the IRPD spectrum of Ama+W2 to the calculated spectra in Fig. 5 demonstrates good agreement with that of the most stable isomer I with respect to both band positions and intensities. The lack of strong signals in the free NH stretch range (3300–3500 cm−1) provides strong evidence that in the predominantly observed isomer both N–H bonds of Ama+ are solvated, which exclusively occurs in I. The resulting two bound NH stretch bands νNHbs and νNHba of the two equivalent NH⋯O H-bonds are assigned to the intense bands G (3027 cm−1) and F (3137 cm−1), with deviations of only 7 and 2 cm−1 from the predicted values. These transitions are also consistent with νNHbs (3073 cm−1) and νNHba (3195 cm−1) of ABN+W2.55 The bands C and A at 3642 and 3721 cm−1 are then attributed to the free OH stretch modes νOHs and νOHa with deviations of 10 and 20 cm−1, which is acceptable concerning the widths of the transitions (17 and 24 cm−1). Peak J (2874 cm−1) can again be assigned to the lowest CH stretch mode predicted at 2849 cm−1, and its observed blueshift of 16 cm−1 by hydration with the second W is well reproduced by the calculated shift (18 cm−1). Band I is again composed of overlapping unresolved CH and CH2 stretching modes. When considering the most intense mode (2923 cm−1, 46 km mol−1), the deviation is merely 26 cm−1. It is also possible that again an overtone of a CH2 bending mode predicted at 2958 cm−1 may add to the intensity via Fermi resonance with the νNHbs mode. Like for n = 1, band K cannot be explained by any fundamental mode of Ama+W2(I) and any other Ama+W2 isomer but can again be attributed to a combination band βNH + βOH at 3191 cm−1 of the symmetric (1577 cm−1) and antisymmetric (1614 cm−1) coupled bending OH and NH modes.
The remaining weak but clearly discernible bands D and E at 3413 and 3376 cm−1 occur in the free NH stretch and/or bound OH stretch range can clearly not be attributed to a fundamental mode of isomer I. Hence, they are taken as spectroscopic signature for the presence of the low-energy local minima II and III. While bands D and E perfectly match νOHb (3415 cm−1) and νNHf (3374 cm−1) of II, with deviations of less than 3 cm−1, their relative intensities suggest an additional overlapping contribution of νNHf/νOHb of III (3369/3383 cm−1) to band E. The calculated free OH stretch modes of II and III (νOHs, νOHf, νOHa) also match with peaks C and A. The bound νNHb modes of II/III are strongly shifted into the CH stretch range (2870 and 2853 cm−1) and can possibly be assigned to peak J with a deviation of only 4 cm−1 and unstructured signal between 2800 and 2850 cm−1. The population of II and III may roughly be estimated as <20% and <10% of I by considering the achieved signal-to-noise ratio and the computed and observed IR intensities of peaks D, F, and the background in the 2800–2850 cm−1 range. While the higher energy isomers IV and V cannot readily be excluded spectroscopically, a significant population may be excluded by their rather low stability (E0 > 30 kJ mol−1).
4.4. Ama+W3
Increasing the number of W ligands to three leads to the nine possible isomers I–IX for Ama+W3 generated from the low energy isomers of n = 2 (Table S1, ESI†). The most important structures (I–VI) are shown in Fig. 6 and the remaining ones (VII–IX) are available in Fig. S8 (ESI†). Their computed IR spectra are compared in Fig. 7 to the experimental IRPD spectrum (Table 4 and Fig. S4, ESI†). The position of the transitions observed in the IRPD spectrum of Ama+W3 and their vibrational assignment are listed in Table 4. Because of the many isomers, we will not discuss their structures and properties in detail. The cooperative and noncooperative three-body effects resulting from the formation of a solvent network and interior ion solvation, respectively, are discussed for n = 2. Their impact on structure, energy, charge transfer, orbital interactions, and the IR spectrum of the n = 3 isomers are consistent with these three-body interactions.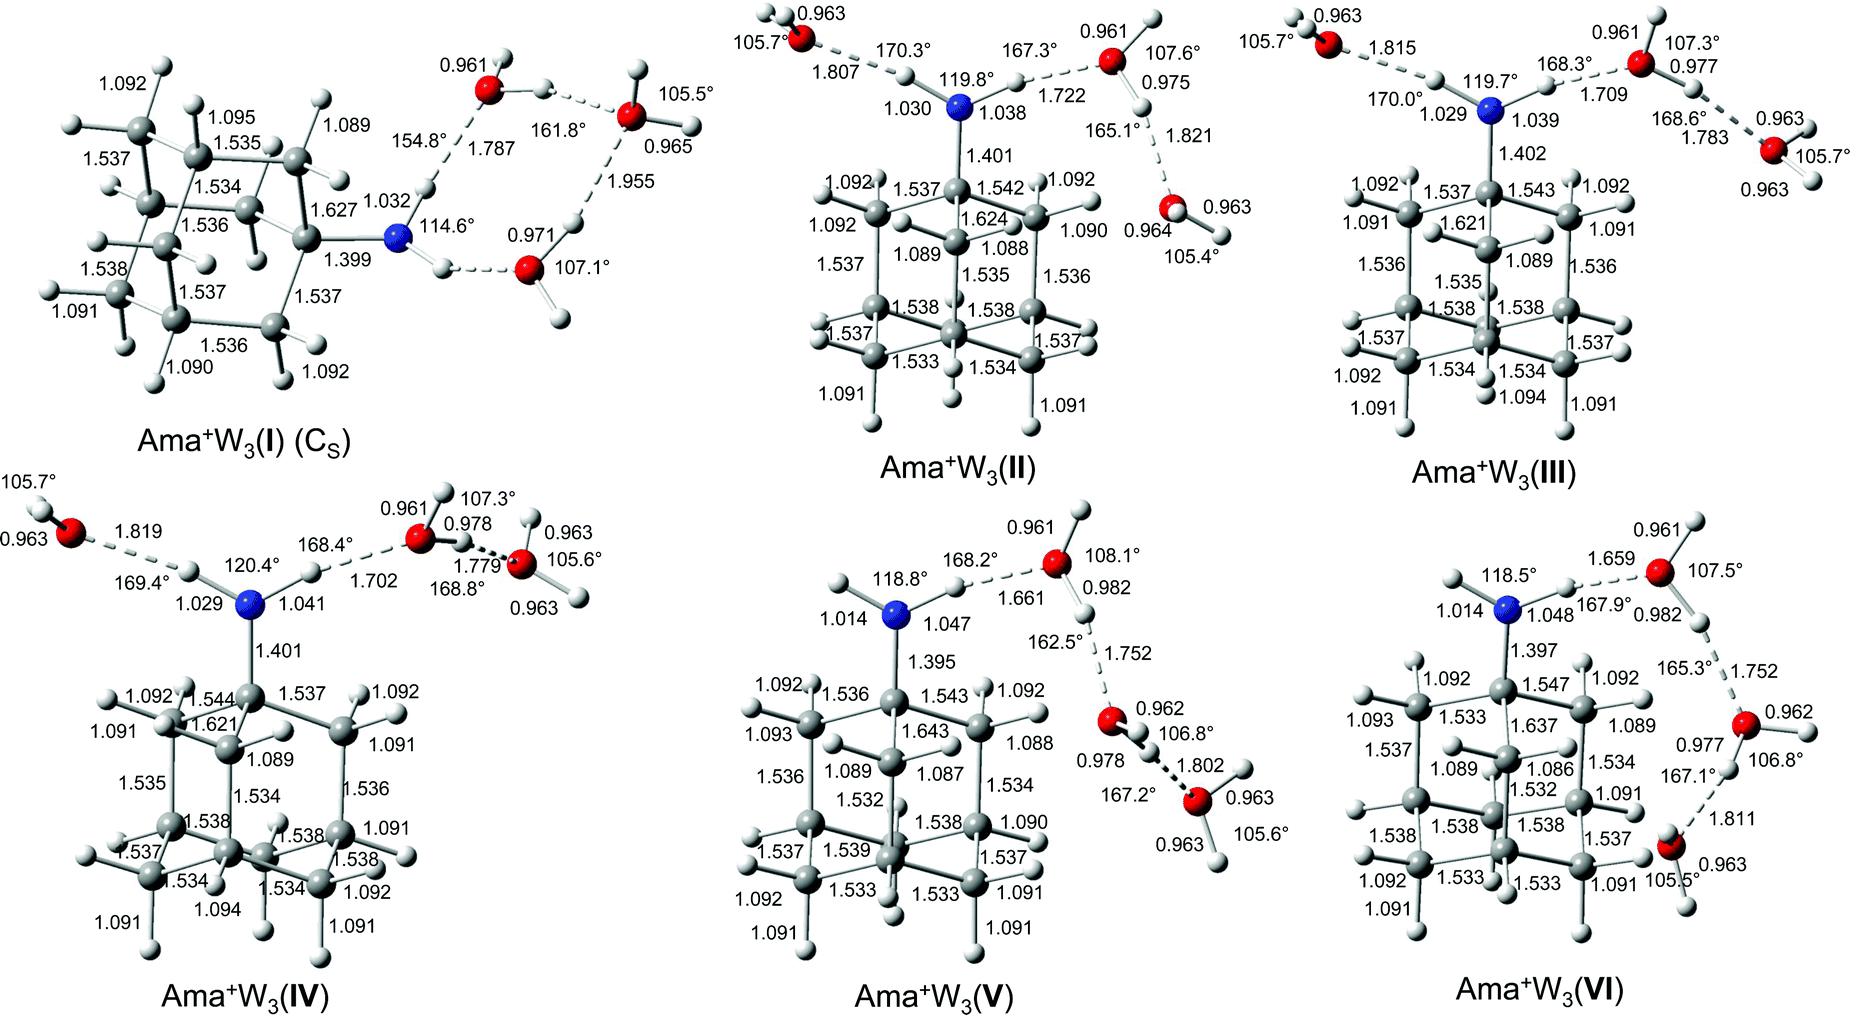 | ||
| Fig. 6 Calculated equilibrium structures (in Å and degrees) of Ama+W3(I–VI) in their ground electronic state (B3LYP-D3/cc-pVTZ). The structures of isomers VII–IX are shown in Fig. S8 (ESI†). | ||
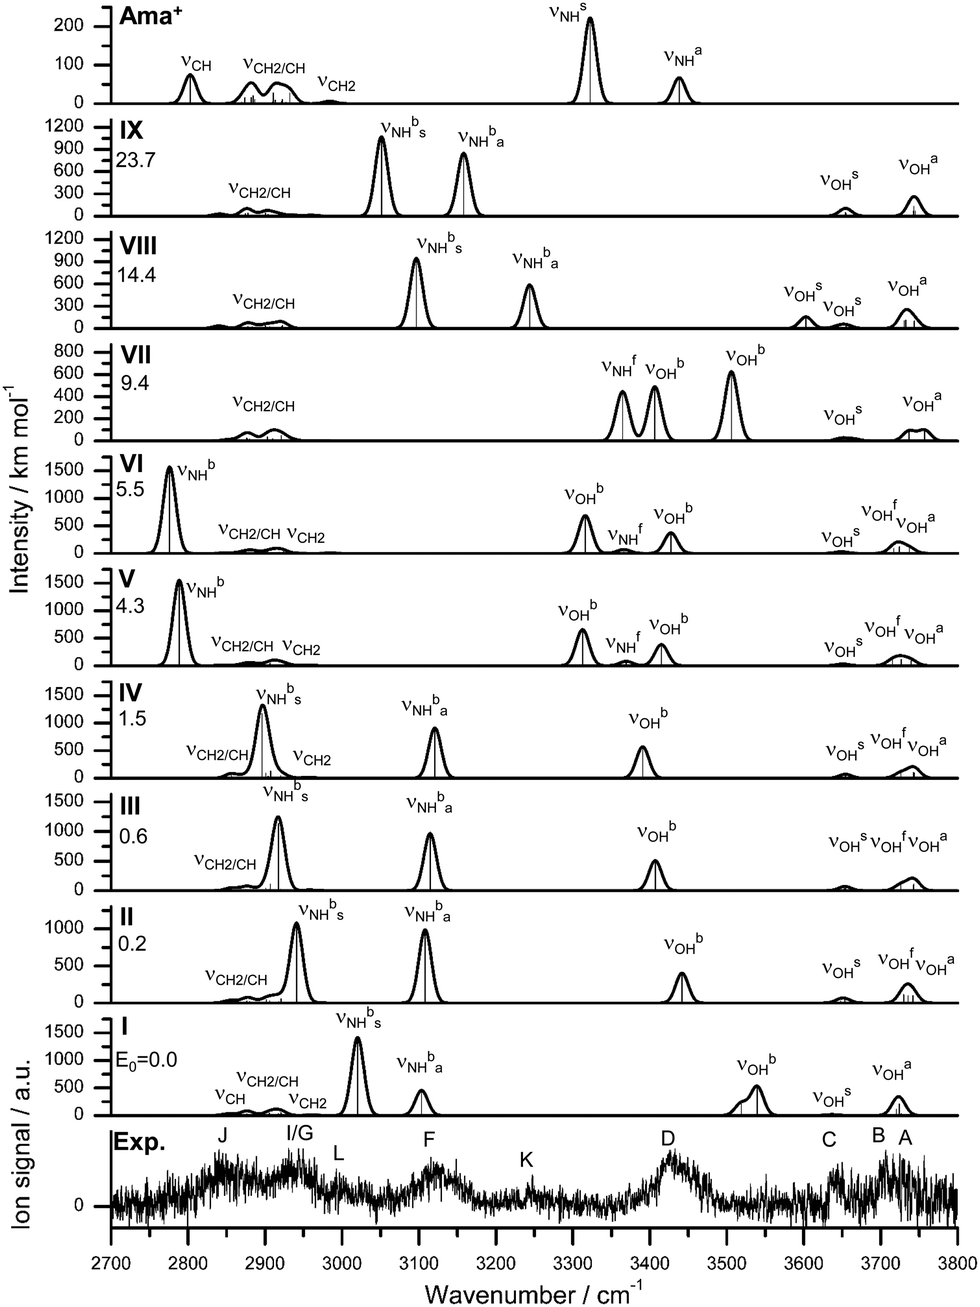 | ||
| Fig. 7 IRPD spectrum of Ama+W3 compared to linear IR absorption spectra of Ama+ and Ama+W3(I–IX) calculated at the B3LYP-D3/cc-pVTZ level. The positions of the transition observed in the IRPD spectrum of Ama+W2 and their vibrational assignment are listed in Table 4. Differences in relative energy (ΔE0) are given in kJ mol−1. | ||
| Mode | Ama+ | Ama+W3(II) | Ama+W3(III) | Ama+W3(IV) | Ama+W3(VIII) | Ama+W3 exp. |
|---|---|---|---|---|---|---|
| a IR intensities in km mol−1 are given in parentheses. The computational data for the other isomers are available in Table S4 (ESI). The experimental frequencies with width (fwhm in parenthesis) are assigned to the most dominant vibrations. | ||||||
| ν CH | 2803 (76) | 2855 (36) | 2856 (49) | 2856 (84) | 2840 (35) | J 2840 (40) |
| ν CH2 | 2870 (4) | 2875 (14) | 2875 (16) | 2874 (19) | 2872 (4) | |
| ν CH2 | 2874 (16) | 2876 (11) | 2875 (20) | 2876 (21) | 2875 (18) | |
| ν CH2 | 2882 (16) | 2876 (27) | 2876 (16) | 2878 (6) | 2877 (21) | |
| ν CH2 | 2884 (20) | 2880 (21) | 2879 (19) | 2880 (21) | 2878 (20) | |
| ν CH2 | 2887 (10) | 2885 (8) | 2883 (11) | 2883 (4) | 2883 (22) | |
| ν CH2/νCH | 2910 (5) | 2902 (43) | 2901 (39) | 2901 (91) | 2900 (36) | |
| ν CH2/νCH | 2911 (28) | 2906 (25) | 2905 (23) | 2904 (34) | 2906 (26) | |
| ν CH2/νCH | 2912 (1) | 2909 (15) | 2907 (113) | 2907 (128) | 2914 (8) | |
| ν CH2/νCH | 2913 (10) | 2912 (5) | 2912 (8) | 2913 (7) | 2917 (6) | |
| ν CH2 | 2922 (6) | 2915 (4) | 2915 (9) | 2916 (3) | 2918 (5) | |
| ν CH2 | 2922 (11) | 2918 (20) | 2919 (14) | 2920 (39) | 2922 (31) | |
| ν CH2 | 2927 (4) | 2921 (56) | 2920 (21) | 2922 (16) | 2923 (42) | I 2944 (45) |
| ν CH2 | 2932 (27) | 2930 (13) | 2931 (11) | 2925 (20) | 2932 (1) | |
| ν CH2 | 2984 (7) | 2964 (6) | 2958 (13) | 2957 (15) | 2990 (3) | |
| ν NH b s | 2941 (1072) | 2917 (1137) | 2896 (1172) | 3097 (949) | G 2944 (45) | |
| L 2993 (20) | ||||||
| νNHbs | 3097 (949) | F 3116 (97) | ||||
| ν NH b a | 3108 (989) | 3114 (967) | 3121 (914) | F 3116 (97) | ||
| ν NH b a | 3244 (588) | K 3247 (15) | ||||
| β NH + βOH | 3193 | K 3247 (15) | ||||
| ν NH s | 3322 (223) | |||||
| ν NH a | 3438 (67) | |||||
| ν OH b | 3442 (404) | 3407 (510) | 3391 (571) | D 3426 (86) | ||
| ν OH s | 3603 (157) | |||||
| ν OH s | 3648 (32) | 3653 (33) | 3654 (46) | 3645 (27) | C 3644 (21) | |
| ν OH s | 3654 (42) | 3654 (40) | 3654 (24) | 3655 (43) | C 3644 (21) | |
| ν OH f | 3730 (114) | 3726 (104) | 3726 (100) | B 3707 (12) | ||
| ν OH a | 3735 (95) | 3742 (90) | 3742 (97) | 3731 (105) | A 3730 (20) | |
| ν OH a | 3742 (102) | 3743 (108) | 3743 (99) | 3732 (113) | A 3730 (20) | |
| ν OH a | 3744 (102) | A 3730 (20) | ||||
In the global minimum I with Cs symmetry, the W ligands form a cyclic ring involving the NH2 group via four H-bonds, leading to a total binding energy of Dtotal0 = 167.6 kJ mol−1, accompanied by a charge transfer of 78 me from Ama+ to W3 (Fig. S9, ESI†). Two W ligands act as single-donor single-acceptor molecules in NH⋯O and OH⋯O H-bonds, while the bridging terminal W ligand closes the ring as double-acceptor ligand in OH⋯O H-bonds. To close the solvation ring, the NH⋯O and OH⋯O H-bonds have to be quite nonlinear and the two single-donor single-acceptor ligands have to rotate into the plane of the NH2 group. Thus, although this isomer has four intermolecular H-bonds, the steric strain makes it only slightly more stable than the next isomers II–IV by 0.2 to 1.5 kJ mol−1, although the latter isomers have only three H-bonds. The low binding energy of the outer W, D0 = 49.3 kJ mol−1, is consistent with the long OH⋯O H-bonds (1.955 Å). These correlate with relatively high bound OH stretch frequencies of νOHb = 3519 and 3539 cm−1, which makes them a characteristic IR fingerprint of this cyclic isomer (Fig. 7). In the only slightly less stable isomers II–IV with E0 = 0.2, 0.6, and 1.5 kJ mol−1 (Dtotal0 = 166.1–167.4 kJ mol−1), the two N–H bonds of the NH2 group are solvated by W and W2 leading to a weaker NH⋯W and stronger NH⋯W2 ionic H-bond. They differ mainly in the orientation and binding parameters of the W2 unit (rOH = 0.975–0.978 Å, ROH⋯O = 1.783–1.821 Å), which leads to somewhat different frequencies of their νOHb modes (3442, 3407, 3391 cm−1, Fig. 7). Moreover, they differ slightly in their N–H bond lengths (1.030/1.038, 1.029/1.039, 1.029/1.041 Å), which results in different νNHb frequencies. The frequencies of νNHba (NH⋯W) occur in a narrow range between 3108 and 3121 cm−1, while νNHbs (NH⋯W2) varies more strongly between 2941 and 2896 cm−1. Overall, the binding energies of the terminal W ligand (D0 = 47.7, 48.6, 49.0 kJ mol−1) and the total charge transfer from Ama+ to the solvent are quite similar (81, 86 and 87 me, Fig. S9, ESI†).
In isomers V–VII of Ama+W3 with E0 = 4.3, 5.5, and 9.4 kJ mol−1 (Dtotal0 = 163.3, 162.2, 158.3 kJ mol−1), a W trimer is attached to the NH2 group via a NH⋯O H-bond in either a linear (V/VI) or branched (VII) fashion, while the other N–H bond remains free. Isomers V and VI differ only slightly in the orientation of the W3 chain, mainly by different ways to optimize the weak CH⋯O contacts (five between 2.5 and 3.0 Å), and thus have similar bonding parameters and IR spectra. Hence, we will discuss only V in more detail. The linear W3 chain has two OH⋯O H-bonds (1.752 and 1.802 Å), resulting in two intense νOHb modes at 3313 and 3415 cm−1. The terminal W ligand has a lower binding energy of D0 = 50.3 kJ mol−1 and the total charge transfer (70 me) to the solvent is lower than for II–IV. The rather short and strong NH⋯O H-bond (1.661 Å) results from the high proton affinity of W3 (862 kJ mol−1)78 and produces a strongly redshifted νNHb band at 2789 cm−1 because of the substantial elongation of the N–H bond (1.047 Å). The free νNHf mode occurs at 3369 cm−1 between the two more intense νOHb bands. Isomer VII with the branched W3 unit is slightly less stable than V/VI because it can develop less CH⋯O contacts. Due to reduced cooperativity, its OH⋯O bonds are slightly longer and weaker (1.768 and 1.856 Å, D0 ∼ 45 kJ mol−1) resulting in higher-frequency νOHb bands at 3406 and 3506 cm−1, which occur both to the blue of νNHf =3365 cm−1. Because the W ligands are closer to the Ama+ charge, charge transfer to W3 is somewhat higher (85 me, Fig. S9, ESI†). The resulting stronger NH⋯O H-bond (1.590 Å) causes a strong elongation of the N–H donor bond to 1.060 Å, and the corresponding νNHb mode (2589 cm−1) is shifted out of the investigated frequency range.
For completeness, we also computed two structures VIII and IX corresponding to interior ion solvation, in which three individual W ligands bind to the NH2 group (via NH⋯W H-bonds with 1.8–2.0 Å) and the Ama+ cage (via charge–dipole forces and CH⋯W contacts with 2.3–2.5 Å). They result essentially from adding one W to the cage of isomer I of n = 2. These are relatively high in energy (E0 = 14.4 and 23.7 kJ mol−1), because they lack the cooperativity effect of the formation of a H-bonded solvent network observed in isomers I–VII. VIII is slightly more stable than IX because it has a weak OH⋯O contact (2.02 Å), producing a slightly redshifted νOHs band at 3603 cm−1 in the free OH stretch range. Otherwise, their IR spectra are dominated by the two bound NH stretch bands between 3000 and 3250 cm−1 (Fig. 7).
The IRPD spectrum of Ama+W3 is compared in Fig. 7 to those calculated for isomers I–IX. At first glance, the best match between experimental and computed spectra is observed for II–IV, in which the NH2 group is hydrated by NH⋯W and NH⋯W2 H-bonds. These isomers are expected from the predominant observation of isomers I and II of the n = 2 cluster. Clearly, there is no spectroscopic signature for the formation of isomer I, which is computed as global minimum on the n = 3 potential at T = 0 K (E0 = 0). In particular, the characteristic νOHb modes of the cyclic W3 ring (3519 and 3539 cm−1) and the most intense νNHbs band at 3020 cm−1 are absent. The population of I is estimated to be below 20% of II by considering the achieved signal-to-noise ratio and the computed IR intensities. The lack of detection of the cyclic isomer can be rationalized by considering entropic effects, which favour the more flexible chain structures over the more rigid cyclic solvation ring. Indeed, free energy calculations at 300 K show that I lies above II by ΔG = 5.1 kJ mol−1. Such entropic effects changing the order of isomers are not observed for the n ≤ 2 clusters (Table S1, ESI†). A major contribution of isomers V–VII to the IRPD spectrum can be excluded because of the mismatch of their predicted spectra in the range of the bound NH and OH stretch modes (νNHb, νOHb). For example, the population of V is estimated to be ≤15% of that of II. Similarly, VIII and IX can be excluded because of the disagreement in the νNHb range and their high relative energy (E0 > 14 kJ mol−1).
Out of the energetically and spectroscopically favourable isomers II–IV, the most stable structure II (concerning both E0 and G) shows by far the best agreement with the IRPD spectrum, with maximum, mean, and summed deviations of 23, 11, and 10 cm−1, respectively. The IR spectra of the similar structures III and IV are also in good accord with the IRPD spectrum, but the frequency deviations are larger and thus we will not discuss them in further detail. Peaks A–C at 3730, 3707, and 3644 cm−1 are attributed to the various free OH stretch modes of II (νOHa, νOHf, νOHs). B and D at 3426 cm−1 corresponds well to νOHb predicted at 3442 cm−1, and is close to the corresponding mode measured for ABN+W3 (3402 cm−1).55 Bands F and G at 3116 and 2944 cm−1 are attributed to νNHba and νNHbs predicted at 3108 and 2941 cm−1, and their observed shifts upon addition of the third W ligand (21 and 83 cm−1) agree well with the computed trend (31 and 93 cm−1). This assignment is also consistent with νNHbs (2919 cm−1) and νNHba (3180 cm−1) measured for ABN+W3.55 Similar to Ama+W2, peak J at 2840 cm−1 is attributed to a νCH mode, while I (2944 cm−1) arising from νCH2 modes overlaps with band G (νNHbs) in the n = 3 spectrum. Again, the origin of peaks K (3247 cm−1) and L (2993 cm−1) remains unclear. They cannot be explained by fundamental modes and thus are ascribed to combination bands or overtones. For example, K could again be assigned to the combination band βNH + βOH of the symmetric (1583 cm−1) and antisymmetric (1610 cm−1) coupled NH and OH bending modes, although the observed blueshift of peak K to 3247 cm−1 is not reproduced by the harmonic calculation.
5. Further discussion
The analysis of the IRPD spectra of Ama+Wn in the CH, NH, and OH stretch range with the aid of B3LYP-D3 calculations provides a consistent picture of the sequential cluster growth of this fundamental diamondoid amine cation. All main bands in the IRPD spectra can readily be assigned to the energetically most stable isomer I, except for Ama+W3 where free energies must be considered and then isomer II becomes more stable than I at room temperature by 5 kJ mol−1. For n ≤ 2, the W ligands preferentially bind to the acidic protons of the NH2 group via strong and nearly linear NH⋯O ionic H-bonds, corresponding to interior ion solvation. The H-bonds in n = 2 are slightly weaker than in n = 1 due to noncooperative effects typical for interior ion solvation. Hence, for n = 2 a local minimum with a H-bonded W2 dimer attached to the NH2 group becomes competitive because of strong cooperative effects of the H-bonded solvent network (E0 = 5.4 kJ mol−1) and thus is observed as a minor isomer. Starting from n = 3, the microhydration network expands as a H-bonded Wn network incorporating the acidic NH2 group. Such H-bonded isomers appear energetically favoured over other isomers, in which the Ama+ cage is progressively solvated by single W ligands via cation–dipole forces supported by weak CH⋯O contacts. The calculated binding energies for the identified Ama+Wn clusters decrease as D0 = 61.4 > 56.9 > 54.4 kJ mol−1 for n = 1–3, and a linear extrapolation to larger cluster sizes would suggest that for n > 8 internal ion solvation becomes more favourable than the extension of the solvation network (Fig. S10, ESI†). However, this prediction is in contradiction to the observed sublimation enthalpy of bulk ice of 51.0 kJ mol−1,90 suggesting that larger Ama+Wn clusters also prefer structures with the hydrophobic adamantyl cage residing at the surface of the water solvent network. Clearly, structural isomers in which W ligands are attached to the adamantyl cage via charge–dipole forces supported by weak CH⋯O contacts are much less stable than those with hydration around the NH2 group. The computed hydration energies for n = 1–3 (54–61 kJ mol−1) exceed by far the absorbed IR photon energy (hν < 48 kJ mol−1 = 4000 cm−1), indicating that under the employed single-photon absorption conditions, using an unfocused IR laser beam, only cluster ions with significant internal energy can undergo the IRPD process. This result can also explain the widths of the transitions and the contributions of entropy necessary for the evaluation of the energetic order of the isomers. Although there is progressive partial charge transfer from Ama+ to the Wn solvent cluster, most of the charge in [AmaWn]+ remains on Ama+ because of the large disparity in the ionization energy of Ama (computed as 7.95 eV) and Wn (>10 eV),79 justifying the notation Ama+Wn in the considered size range. Similarly, the computed proton affinity of the amantadinyl radical (PA = 960 kJ mol−1) is substantially higher than that of Wn clusters (PA = 691, 808, 862, 900, 904, and 908 kJ mol−1 for n = 1–6),74–78 suggesting that no proton transfer to solvent occurs for small polyhydrates of Ama+, although the tendency for proton shift from Ama+ to Wn gradually increases with n.The detailed evolution of the properties of the N–H bonds of the predominantly observed Ama+Wn clusters as a function of n are compared in Fig. 8. These include the calculated individual and averaged free and bound N–H bond lengths (rNHf, rNHb), the corresponding calculated and experimental individual and averaged free and bound NH stretch frequencies (νNHf, νNHb), and the E(2) energies for the NH⋯O H-bonds. In general, the experimental and theoretical frequencies agree quantitatively in terms of both, absolute values and incremental changes, which confirms the given isomer assignments. These diagrams show monotonous trends for all averaged values with increasing degree of hydration. As n increases, the intermolecular NH⋯O H-bonds become stronger due to the increasing proton affinity of the solvent cluster, as illustrated by the rising E(2) energies. As a result, the intramolecular N–H bonds become weaker and longer and this trend directly transfers in the reduction of the NH stretch frequencies. However, the N–H bonds are far from being broken by the solvent at the considered cluster size range.
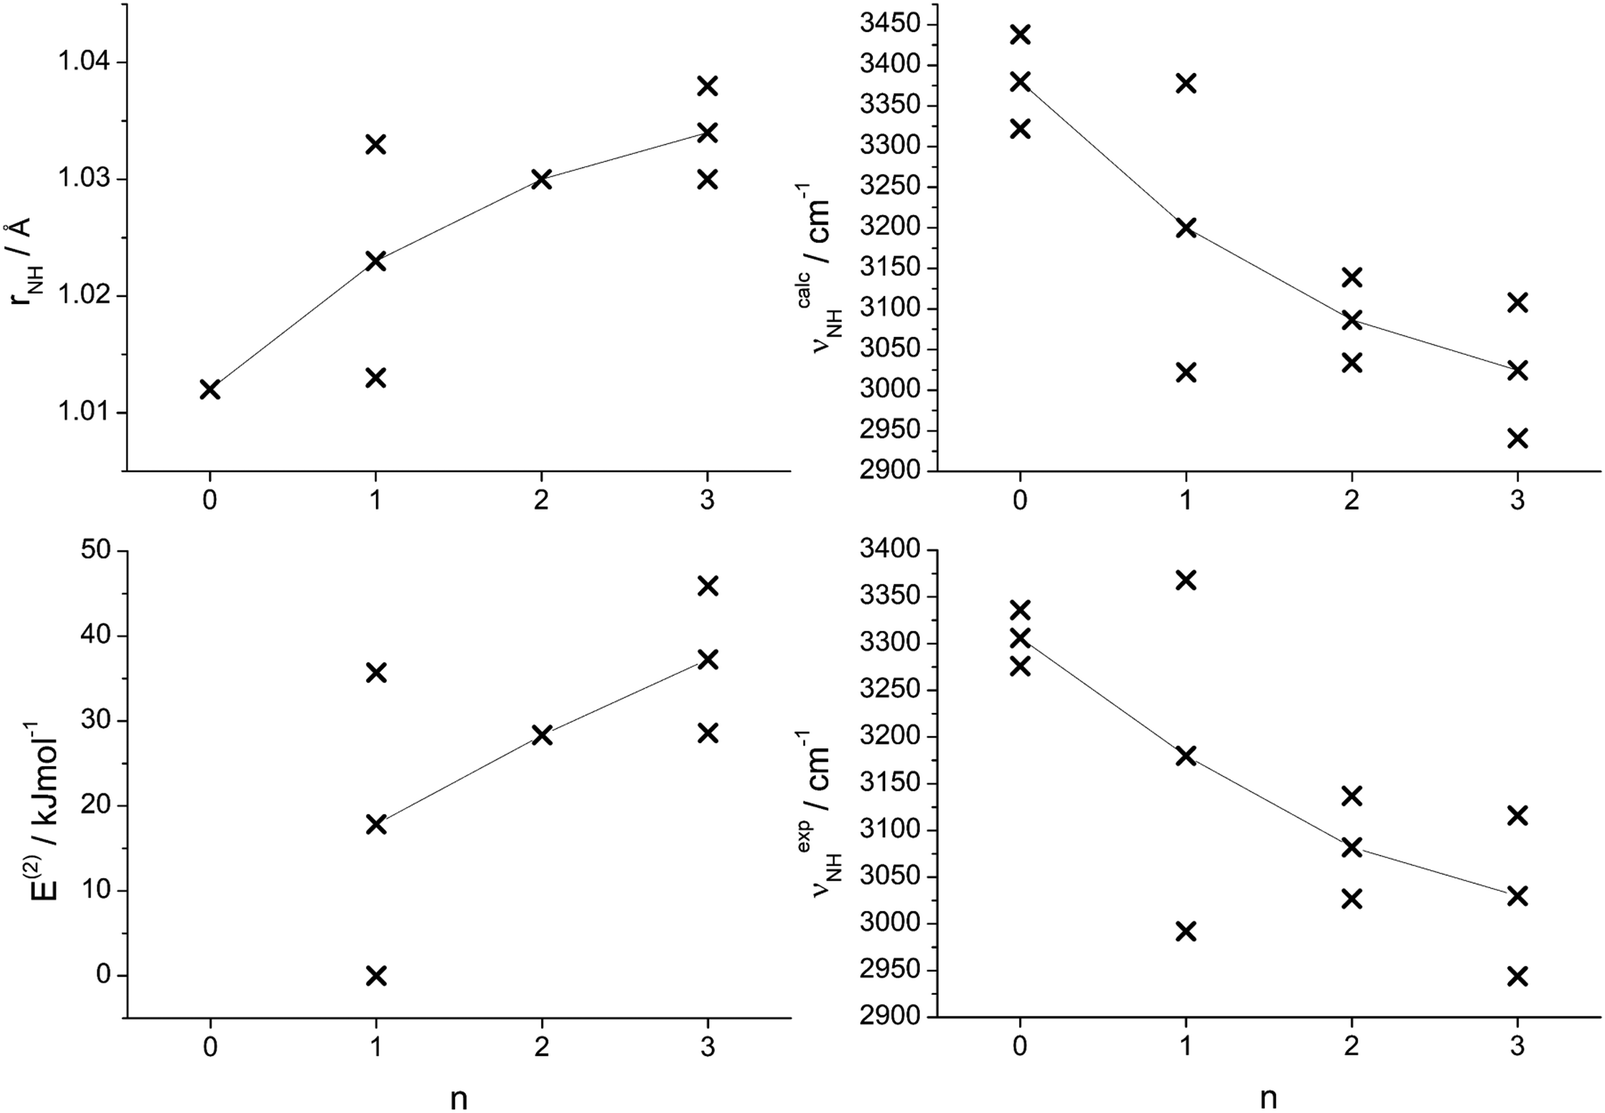 | ||
| Fig. 8 Plots of various calculated and experimental properties of the N–H bonds of the most stable Ama+Wn clusters as a function of the cluster size n: calculated N–H bond lengths (rNH); calculated second-order perturbation energies (E(2)) of donor–acceptor orbital interactions involved in the H-bonds; calculated and experimental NH stretch frequencies (νNH). Crosses indicate individual data points, whereas connected points correspond to averaged values. | ||
Apart from the NH2 group, there are further structural changes induced by hydration and the resulting charge transfer to the solvent. To illustrate the major effects on the distortion of the Ama+ cage as a function of progressive solvation, the most affected C–C and C–N bond lengths of Ama(+) and the observed most stable Ama+Wn clusters are plotted in Fig. 9 as a function of the partial charge on the adamantyl cage. Ionization of Ama increases the partial charge on this cage from 161 to 687 me. As a result, the C–Cext bond in the Cs plane is strongly elongated, while the C–Cadj and C–N bonds are shortened. The charge of the cage decreases again with addition of each W ligand, and thus the trends induced by ionization are progressively reversed. However, this process slows down with each additional W ligand so that a complete return to the properties of neutral Ama by hydration is unlikely, because of the disparity in the ionization energies of Ama and Wn (IE = 10.12 ± 0.15 eV for liquid water).91
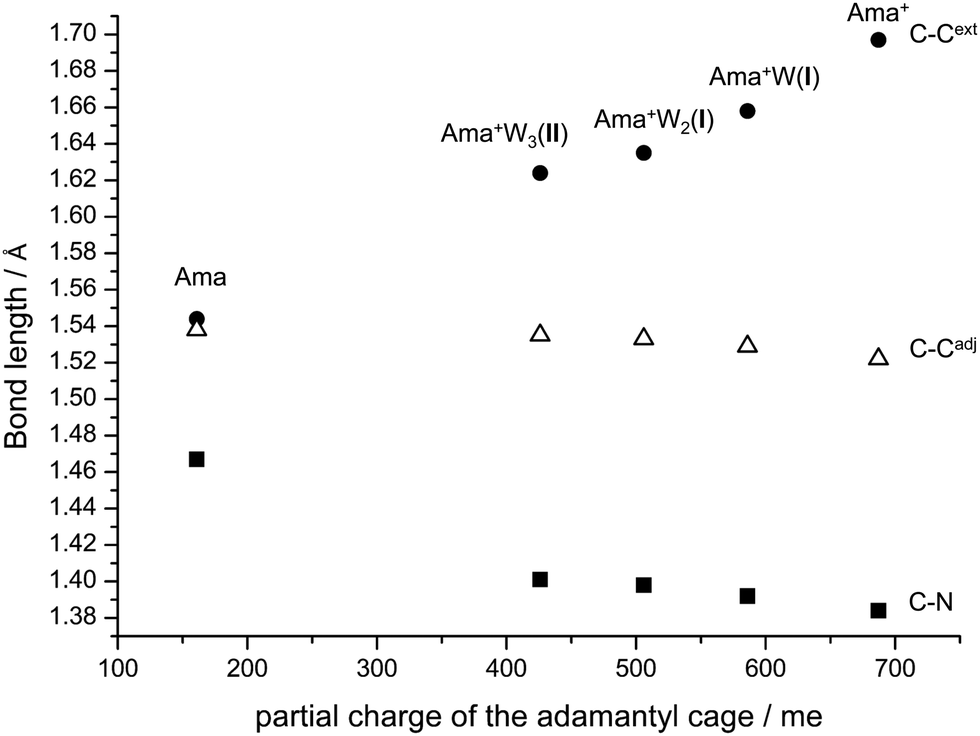 | ||
| Fig. 9 Plot of the bond lengths of the extended C–C bond (C–Cext), the adjacent C–C bond (C–Cadj), and the C–N bond of Ama, Ama+, and the most stable structures of Ama+W1–3 as a function of the partial charge of the adamantyl cage to illustrate that the bond lengths of Ama+ approach those of neutral Ama upon progressive hydration. | ||
It is instructive to compare the results of Ama+Wn with those obtained previously for microhydration of other primary amine cations, such as aromatic amines (e.g., AN, ABN)55,69 or aliphatic amines (e.g., CH3NH2).71 Microhydration of AN+Wn and ABN+Wn shows the same preferential cluster growth as Ama+Wn. However, the N–H bonds in AN+ and ABN+ are less acidic, leading to weaker NH⋯O H-bonds than in Ama+Wn. For example, the redshifted bound NH stretch bands occurs at νNHb = 3105, 3040, and 2992 cm−1 for the monohydrates of AN+, ABN+, and Ama+. As a result, the IR spectra of AN+W and ABN+W are not complicated by the anharmonic interaction of νNHb with CH stretch modes. Furthermore, because of smaller charge transfer to the solvent, the IRPD spectra of the dehydrates of AN+ and ABN+ reveal isomer I as a single isomer without any population of the minor isomers II and III as observed for Ama+.
In an effort to study the effects of replacing the cycloalkyl cage by a simple linear alkyl group on the hydration of aliphatic amine cations, we compare in the following Ama+Wn with CH3NH2+Wn, which is the simplest alkylamine cation with a comparable microhydration process.71 Although the latter clusters are rather simple, no IRPD spectra have been reported yet, and the only information available comes from computational studies at the MP2/6-311+G(2d,p) level.71 Because the MP2 level often suffers from spin contamination when applied to radical cations and because we like to compare directly with our data on Ama+Wn, we computed herein the properties of CH3NH2+Wn at the B3LYP-D3 level (Fig. S4, ESI†). In general, the B3LYP-D3 results are consistent with previous MP2 results.71 The ionization energy of CH3NH2 is substantially higher than for Ama (8.9 vs. 7.9 eV) and the calculated proton affinity of CH3NH is lower than for C10H15NH (896 vs. 960 kJ mol−1).92 The major difference between Ama+ and CH3NH2+ is that the HOMO orbital is largely delocalized over the Ama cage, while in CH3NH2+ it is essentially the localized nitrogen p orbital perpendicular to the CNH2 plane. Hence, the positive charge on the NH2 group is much higher in CH3NH2+ (qNH2 = 597 vs. 313 me) leading to more acidic NH protons (rNH = 1.020 vs. 1.012 Å). As a result, the NH⋯O H-bonds in CH3NH2+Wn are substantially stronger than in Ama+Wn. For example, the NH⋯O H-bond in CH3NH2+W has a higher binding energy than Ama+W(I), associated with a shorter H-bond, larger orbital interactions, higher charge transfer to solvent, and stronger intramolecular deformation (D0 = 88.7 vs. 61.4 kJ mol−1, RNH⋯O = 1.613 Å vs. 1.768 Å, E(2) = 62.4 vs. 33.8 kJ mol−1, Δq = 68 vs. 38 me, ΔrNH = 39 vs. 21 mÅ). On the other hand, the C–N bond elongation is reduced (ΔrNH = 3 vs. 8 mÅ), because of the lacking orbital delocalization. The hydration motif in CH3NH2+W2 is quite similar to that of Ama+W2(I), but again with shorter and stronger NH⋯O H-bonds (D0 = 73.0 vs. 56.9 kJ mol−1, RNH⋯O = 1.695 Å vs. 1.802 Å, E(2) = 44.7 vs. 29.3 kJ mol−1, Δq = 97 vs. 68 me, rNH = 1.045 Å vs. 1.030 Å). A similar trend is also observed for n = 3, where in CH3NH2+W3 the NH⋯O (1.587 vs. 1.722 Å) and OH⋯O H-bonds (1.715 vs. 1.821 Å) of the W2 unit are also shorter than in Ama+W3(II), based on the higher total binding energy (Dtotal0 = 216 vs.167 kJ mol−1) and the larger charge transfer to the solvent (Δq = 120 vs. 81 me).
6. Concluding remarks
In summary, we combined IRPD spectroscopy of size-selected Ama+Wn clusters with n ≤ 3 in the sensitive OH, NH, and CH stretch range with DFT calculations at the B3LYP-D3/cc-pVTZ level to determine the first steps in the microhydration process around the radical cation of this important pharmaceutical molecular drug. Significantly, these spectra provide the first spectroscopic information about the Ama+ cation and any Ama+Ln cluster with neutral ligands L. Thus, they yield a first impression about the acidity of its NH2 group and its interaction with solvent molecules. The salient results may be summarized as follows.(1) In agreement with previous experimental and computational evidence, ionization of Ama into the ground state of the cation is achieved by removal of an electron from the nonbonding lone pair of the N atom of the NH2 group, which has a′ symmetry in the Cs point group. As a result, the pyramidal NH2 group in neutral Ama becomes essentially planar upon ionization, much like for NH3. As this orbital is significantly delocalized into the adamantyl cage, ionization also strongly affects the lengths of the neighbouring C–N and C–C bonds lying in the symmetry plane. These structural changes of the NH2 group and the adamantyl cage are further modulated by sequential microhydration because the formation of the NH⋯O H-bonds is accompanied by partial charge transfer from Ama+ to Wn.
(2) The measured IRPD spectra of Ama+Wn can essentially be assigned to the energetically most favourable structures for a given cluster size obtained by the DFT calculations, whereby for n = 3 the free energies have to be considered. The preferred sequential cluster growth starts with the hydration of the two acidic NH protons of the NH2 group via strong NH⋯O ionic H-bonds (n = 1–2) and continues with further extension of the H-bonded solvent network by the formation of a W2 unit via an OH⋯O H-bond (n = 3). Clearly, structural isomers in which W ligands are attached to the adamantyl cage via charge–dipole forces supported by weak CH⋯O contacts are much less stable than those with hydration around the NH2 group. However, for n = 2 a minor additional isomer with a W2 dimer attached to the NH2 group is detected, because the nearby Ama+ charge strongly enhances the binding energy of the W2 dimer via polarization effects. The formation of a cyclic hydration structure for n = 3, computed to be the global minimum at T = 0 K, can be excluded by spectroscopy, and indeed this structure becomes destabilized by 5 kJ mol−1 compared to the observed structure when considering free energies. Overall, the IRPD spectra and calculations reveal a similar solvation process as observed previously for related RNH2+Wn clusters,55,69,70 in which also the formation of a H-bonded network is favoured over internal ion solvation.55 While the formation of the H-bonded solvation network is strongly favoured by cooperative three-body interactions, the tendency for interior ion solvation is somewhat reduced by noncooperative three-body induction forces.
(3) In general, the solvent increasingly attracts the acidic NH protons of Ama+ as the number of W ligands increases. Although the N–H bonds are progressively destabilized by gradual microhydration, no proton transfer to the solvent is observed for n ≤ 3, which is in line with the proton affinities of C10H15NH and Wn. From the increasing proton affinity of the Wn, such a proton transfer may only occur for large n (n ≫6). Similarly, charge transfer from Ama+ to Wn increases with n, but remains below 0.1 e due to the large discrepancy between the ionization energies of Ama and Wn.
(4) From comparison of computational spectroscopic data, we conclude that the acidity of the NH2 group in RNH2+ cations increases in the order aniline < amantadine < methylamine, because of decreasing charge delocalization and resulting stronger H-bonds.
For a more detailed investigation of the bare Ama+ cation, experiments with weakly bound rare gas ligands are currently underway.
Conflicts of interest
There are no conflicts of interest to declare.Acknowledgements
This study was supported by Deutsche Forschungsgemeinschaft (grant DO 729/8).References
- S. Landa and V. Machacek, Collect. Czech. Chem. Commun., 1933, 5, 1–5 CrossRef CAS.
- J. Kirschbaum, Analytical Profiles of Drug Substances, Elsevier, 1983, pp. 1–36 Search PubMed.
- R. C. Fort and P. v. R. Schleyer, Chem. Rev., 1964, 64, 277–300 CrossRef CAS.
- J. E. Dahl, S. G. Liu and R. M. K. Carlson, Science, 2003, 299, 96–99 CrossRef CAS.
- P. v. R. Schleyer, J. Am. Chem. Soc., 1957, 79, 3292 CrossRef CAS.
- J. E. P. Dahl, J. M. Moldowan, Z. Wei, P. A. Lipton, P. Denisevich, R. Gat, S. Liu, P. R. Schreiner and R. M. K. Carlson, Angew. Chem., Int. Ed., 2010, 49, 9881–9885 CrossRef CAS.
- H. Schwertfeger, A. A. Fokin and P. R. Schreiner, Angew. Chem., Int. Ed., 2008, 47, 1022–1036 CrossRef CAS.
- P. R. Schreiner, L. V. Chernish, P. A. Gunchenko, E. Y. Tikhonchuk, H. Hausmann, M. Serafin, S. Schlecht, J. E. P. Dahl, R. M. K. Carlson and A. A. Fokin, Nature, 2011, 477, 308 CrossRef CAS.
- W. L. Yang, J. D. Fabbri, T. M. Willey, J. R. I. Lee, J. E. Dahl, R. M. K. Carlson, P. R. Schreiner, A. A. Fokin, B. A. Tkachenko and N. A. Fokina, Science, 2007, 316, 1460–1462 CrossRef CAS.
- A. A. Fokin and P. R. Schreiner, Chem. Rev., 2002, 102, 1551–1594 CrossRef CAS.
- L. Wanka, K. Iqbal and P. R. Schreiner, Chem. Rev., 2013, 113, 3516–3604 CrossRef CAS.
- D. F. Blake, F. Freund, K. F. M. Krishnan, C. J. Echer, R. Shipp, T. E. Bunch, A. G. Tielens, R. J. Lipari, C. J. D. Hetherington and S. Chang, Nature, 1988, 332, 611 CrossRef CAS.
- R. S. Lewis, E. Anders and B. T. Draine, Nature, 1989, 339, 117 CrossRef CAS.
- O. Pirali, M. Vervloet, J. E. Dahl, R. M. K. Carlson, A. Tielens and J. Oomens, Astrophys. J., 2007, 661, 919 CrossRef CAS.
- W. L. Davies, R. R. Grunert, R. F. Haff, J. W. McGahen, E. M. Neumayer, M. Paulshock, J. C. Watts, T. R. Wood, E. C. Hermann and C. E. Hoffmann, Science, 1964, 144, 862–863 CrossRef CAS.
- R. S. Schwab, A. C. England, D. C. Poskanzer and R. R. Young, JAMA, 1969, 208, 1168–1170 CrossRef CAS.
- G. Hubsher, M. Haider and M. S. Okun, Neurology, 2012, 78, 1096–1099 CrossRef CAS.
- K. Spilovska, F. Zemek, J. Korabecny, E. Nepovimova, O. Soukup, M. Windisch and K. Kuca, Curr. Med. Chem., 2016, 23, 3245–3266 CrossRef CAS.
- J. Hu, R. Fu and T. A. Cross, Biophys. J., 2007, 93, 276–283 CrossRef CAS.
- WHO, Summary of influenza antiviral susceptibility surveillance findings, 2010–2011. Retrieved 2019.
- A. S. Monto and N. H. Arden, Clin. Infect. Dis., 1992, 15, 362–367 CrossRef CAS.
- R. P. Grelak, R. Clark, J. M. Stump and V. G. Vernier, Science, 1970, 169, 203–204 CrossRef CAS.
- L.-O. Farnebo, K. Fuxe, M. Goldstein, B. Hamberger and U. Ungerstedt, Eur. J. Pharmacol., 1971, 16, 27–38 CrossRef CAS.
- P. F. Vigtlander and K. E. von; Moore, Science, 1971, 174, 408–410 CrossRef.
- J. Kornhuber, M. Weller, K. Schoppmeyer and P. Riederer, J. Neural Transm., 1994, 43, 91–104 CAS.
- A. A. Spasov, T. V. Khamidova, L. I. Bugaeva and I. S. Morozov, Pharm. Chem. J., 2000, 34, 1–7 CrossRef CAS.
- T. J. Murray, Can. J. Neurol. Sci., 1985, 12, 251–254 CrossRef CAS.
- K. M. Kampman, J. R. Volpicelli, A. I. Alterman, J. Cornish and C. P. O’Brien, Am. J. Psychiatry, 2000, 157, 2052–2054 CrossRef CAS.
- J. Kornhuber, W. Retz and P. Riederer, J. Neural Transm., Suppl., 1995, 46, 315–324 CAS.
- F. Weber and S. Gottfried, Nachr. Chem., 2014, 62, 997 CrossRef.
- L. J. Allamandola, S. A. Sandford, A. G. Tielens and T. M. Herbst, Science, 1993, 260, 64–66 CrossRef CAS.
- T. Henning and F. Salama, Science, 1998, 282, 2204–2210 CrossRef CAS.
- O. Guillois, G. Ledoux and C. Reynaud, Astrophys. J., Lett., 1999, 521, L133 CrossRef CAS.
- M. Steglich, F. Huisken, J. E. Dahl, R. M. K. Carlson and T. Henning, Astrophys. J., 2011, 729, 91 CrossRef.
- A. Patzer, M. Schütz, T. Möller and O. Dopfer, Angew. Chem., Int. Ed., 2012, 51, 4925–4929 CrossRef CAS.
- P. B. Crandall, D. Müller, J. Leroux, M. Förstel and O. Dopfer, Astrophys. J., Lett., 2020, 900, L20 CrossRef CAS.
- L. J. Allamandola, M. P. Bernstein, S. A. Sandford and R. L. Walker, Space Sci. Rev., 1999, 90, 219–232 CrossRef CAS.
- M. George, M. Förstel and O. Dopfer, Angew. Chem., Int. Ed., 2020, 59, 12098–12104 CrossRef CAS.
- J. C. Garcia, J. F. Justo, W. V. M. Machado and L. V. C. Assali, J. Phys. Chem. A, 2010, 114, 11977–11983 CrossRef CAS.
- L. Rivas, S. Sanchez-Cortes, J. Stanicova, J. V. García-Ramos and P. Miskovsky, Vib. Spectrosc., 1999, 20, 179–188 CrossRef CAS.
- I. V. Litvinyuk, Y. Zheng and C. E. Brion, Chem. Phys., 2000, 261, 289–300 CrossRef CAS.
- P. J. Linstrom and W. G. Mallard, NIST Chemistry WebBook, NIST Standards and Technology, Gaithersburg, MD, 20889, 2011, http://webbook.nist.gov Search PubMed.
- J. Staničová, G. Fabriciová, L. Chinsky, V. Šutiak and P. Miškovský, J. Mol. Struct., 1999, 478, 129–138 CrossRef.
- O. Dopfer, Z. Phys. Chem., 2005, 219, 125–168 CrossRef CAS.
- O. Dopfer and M. Fujii, Chem. Rev., 2016, 116, 5432–5463 CrossRef CAS.
- N. Solcà and O. Dopfer, Chem. Phys. Lett., 2001, 347, 59–64 CrossRef.
- N. Solcà and O. Dopfer, Chem. – Eur. J., 2003, 9, 3154–3161 CrossRef.
- O. Dopfer, N. Solcà, J. Lemaire, P. Maitre, M.-E. Crestoni and S. Fornarini, J. Phys. Chem. A, 2005, 109, 7881–7887 CrossRef CAS.
- H.-S. Andrei, N. Solcà and O. Dopfer, ChemPhysChem, 2006, 7, 107–110 CrossRef CAS.
- S. Chakraborty, A. Patzer, A. Lagutschenkov, J. Langer and O. Dopfer, Chem. Phys. Lett., 2010, 485, 49–55 CrossRef CAS.
- K. Chatterjee and O. Dopfer, J. Phys. Chem. A, 2020, 124, 1134–1151 CrossRef CAS.
- K. Tanabe, M. Miyazaki, M. Schmies, A. Patzer, M. Schütz, H. Sekiya, M. Sakai, O. Dopfer and M. Fujii, Angew. Chem., Int. Ed., 2012, 124, 6708–6711 CrossRef.
- I. Alata, M. Broquier, C. Dedonder-Lardeux, C. Jouvet, M. Kim, W. Y. Sohn, S.-S. Kim, H. Kang, M. Schütz, A. Patzer and O. Dopfer, J. Chem. Phys., 2011, 134, 74307 CrossRef.
- J. Klyne, M. Schmies, M. Miyazaki, M. Fujii and O. Dopfer, Phys. Chem. Chem. Phys., 2018, 20, 3148–3164 RSC.
- M. Schmies, M. Miyazaki, M. Fujii and O. Dopfer, J. Chem. Phys., 2014, 141, 214301 CrossRef.
- O. Dopfer, A. Patzer, S. Chakraborty, I. Alata, R. Omidyan, M. Broquier, C. Dedonder and C. Jouvet, J. Chem. Phys., 2014, 140, 124314 CrossRef.
- J. Klyne, M. Schmies, M. Fujii and O. Dopfer, J. Phys. Chem. B, 2015, 119, 1388–1406 CrossRef CAS.
- M. Schütz, K. Sakota, R. Moritz, M. Schmies, T. Ikeda, H. Sekiya and O. Dopfer, J. Phys. Chem. A, 2015, 119, 10035–10051 CrossRef.
- A. Bouchet, M. Schütz and O. Dopfer, ChemPhysChem, 2016, 17, 232–243 CrossRef CAS.
- M. Schütz, Y. Matsumoto, A. Bouchet, M. Öztürk and O. Dopfer, Phys. Chem. Chem. Phys., 2017, 19, 3970–3986 RSC.
- J. Klyne, M. Miyazaki, M. Fujii and O. Dopfer, Phys. Chem. Chem. Phys., 2018, 20, 3092–3108 RSC.
- J. Klyne and O. Dopfer, Phys. Chem. Chem. Phys., 2019, 21, 2706–2718 RSC.
- K. Chatterjee and O. Dopfer, Phys. Chem. Chem. Phys., 2017, 19, 32262–32271 RSC.
- K. Chatterjee and O. Dopfer, Chem. Sci., 2018, 9, 2301–2318 RSC.
- K. Chatterjee and O. Dopfer, J. Chem. Phys., 2018, 149, 174315 CrossRef.
- K. Chatterjee and O. Dopfer, J. Phys. Chem. A, 2019, 123, 7637–7650 CrossRef CAS.
- K. Chatterjee and O. Dopfer, Phys. Chem. Chem. Phys., 2019, 21, 25226–25246 RSC.
- K. Chatterjee and O. Dopfer, Phys. Chem. Chem. Phys., 2020, 22, 13092–13107 RSC.
- Y. Inokuchi, K. Ohashi, Y. Honkawa, N. Yamamoto, H. Sekiya and N. Nishi, J. Phys. Chem. A, 2003, 107, 4230–4237 CrossRef CAS.
- M. Alauddin, J. K. Song and S. M. Park, Int. J. Mass Spectrom., 2012, 314, 49–56 CrossRef CAS.
- S.-K. Jiang, D. Yang, X.-T. Kong, C. Wang, X.-Y. Zang, H.-J. Zheng, G. Li, H. Xie, W.-Q. Zhang and X.-M. Yang, Chin. J. Chem. Phys., 2020, 33, 31–36 CrossRef CAS.
- S. Scheiner, Hydrogen bonding: a theoretical perspective, Oxford University Press, 1997 Search PubMed.
- G. A. Jeffrey and W. Saenger, Hydrogen bonding in biological structures, Springer, 2012 Search PubMed.
- E. P. L. Hunter and S. G. Lias, J. Phys. Chem. Ref. Data, 1998, 27, 413–656 CrossRef CAS.
- D. J. Goebbert and P. G. Wenthold, Eur. J. Mass Spectrom., 2004, 10, 837–845 CrossRef CAS.
- A. Courty, M. Mons, J. Le Calvé, F. Piuzzi and I. Dimicoli, J. Phys. Chem. A, 1997, 101, 1445–1450 CrossRef CAS.
- M. Miyazaki, A. Fujii, T. Ebata and N. Mikami, Chem. Phys. Lett., 2004, 399, 412–416 CrossRef CAS.
- R. Knochenmuss, Chem. Phys. Lett., 1988, 144, 317 CrossRef CAS.
- L. Belau, K. R. Wilson, S. R. Leone and M. Ahmed, J. Phys. Chem. A, 2007, 111, 10075–10083 CrossRef CAS.
- O. Dopfer, Int. Rev. Phys. Chem., 2003, 22, 437–495 Search PubMed.
- M. Frisch, et al., Gaussian 09, version D.01, Gaussian, Inc, Wallingford, CT, 2009 Search PubMed.
- T. Shimanouchi, Tables of Molecular Vibrational Frequencies Consolidated, National Bureau of Standards, Washington, DC, 1972, pp. 1–160, vol. I Search PubMed.
- E. D. Glendening, J. K. Badenhoop, A. E. Reed, J. E. Carpenter, J. A. Bohmann, C. M. Morales, C. R. Landis and F. Weinhold, Theoretical Chemistry Institute, University of Wisconsin, Madison, 2013 Search PubMed.
- A. E. Reed, L. A. Curtiss and F. Weinhold, Chem. Rev., 1988, 88, 899–926 CrossRef CAS.
- F. Huisken, M. Kaloudis and A. Kulcke, J. Chem. Phys., 1996, 104, 17–25 CrossRef CAS.
- C. Parlak and Ö. Alver, Chem. Phys. Lett., 2017, 678, 85–90 CrossRef CAS.
- P. C. Yates, T. J. Hill and M. Kaur, J. Mol. Struct., 1992, 258, 299–313 CrossRef.
- A. G. Császár, G. Czakó, T. Furtenbacher, J. Tennyson, V. Szalay, S. V. Shirin, N. F. Zobov and O. L. Polyansky, J. Chem. Phys., 2005, 122, 214305 CrossRef.
- G. Herzberg, Molecular Spectra and Molecular Structure. II. Infrared and Raman Spectra of Polyatomic Molecules, Krieger Publishing Company, Malabar, Florida, 1991 Search PubMed.
- S. Heiles, R. J. Cooper, M. J. DiTucci and E. R. Williams, Chem. Sci., 2017, 8, 2973–2982 RSC.
- C. F. Perry, P. Zhang, F. B. Nunes, I. Jordan, A. Conta and H. J. von Wörner, J. Phys. Chem. Lett., 2020, 11, 1789–1794 CrossRef CAS.
- D. H. Aue and M. T. Bowers, Gas phase ion chemistry, Elsevier, 1979, pp. 1–51 Search PubMed.
Footnote |
| † Electronic supplementary information (ESI) available. See DOI: 10.1039/d0cp05299j |
| This journal is © the Owner Societies 2020 |