 Open Access Article
Creative Commons Attribution 3.0 Unported Licence
The role of vibronic coupling in the electronic spectroscopy of maleimide: a multi-mode and multi-state quantum dynamics study†
Andreas
Lehr
 a,
Sandra
Gómez
 b,
Michael A.
Parkes
 b and
Graham A.
Worth
 *b
*b
aTechnical University of Darmstadt, Eduard-Zintl-Institut, Alarich-Weiss-Straße 8, 64287 Darmstadt, Germany
bUniversity College London, Department of Chemistry, 20 Gordon Street, London WC1H 0AJ, UK. E-mail: g.a.worth@ucl.ac.uk
First published on 20th October 2020
Abstract
The first two excitation bands below 7 eV in the electronic absorption spectrum of maleimide are investigated using a model Hamiltonian including four low-lying singlet excited states within the manifold of 24 vibrational modes. The role of non-adiabatic effects is studied and shines light on both the broad, inter-state coupling–dominated spectral band as well as the fine-structured, not-so-strong coupled band. Calculations have been performed using the Multiconfigurational Time-Dependent Hartree (MCTDH) wavepacket propagation method as well as its multilayer version (ML-MCTDH) using a quadratic vibronic coupling (QVC) Hamiltonian model where parameters are obtained from fitting adiabatic potential energy surfaces computed by ab initio methods. The quantum dynamics calculations provide information on the relaxation dynamics and the vibrational modes involved. Already with a low-order vibronic coupling model and only a few modes being considered, a quantitative agreement with the experimental spectrum is obtained. However, it is found that all modes need to be considered to get a full picture of the photo-excited relaxation dynamics of this molecule.
1 Introduction
Small heterocyclic organic compounds are ideal test systems for probing theoretical concepts in photochemistry and photophysics in order to reveal and grasp their photoactive features. This is motivated by a wide array of applications ranging from organic synthesis through drug design to polymer and biomolecular chemistry. Understanding the fundamental photochemical nature of these building blocks, with pyrrole, furan and thiophene playing a central role, facilitates the generation of new compounds with tailored properties.1,2In this context maleimides have gained increasing interest over the past years. In addition to the traditional use in photoinduced polymer synthesis due to their copolymerisable and self-bleaching properties,3,4 they can be applied in a variety of research- and technology-related areas. To provide a few examples, this involves the development of new diagnostic devices5 and antitumor agents6 as well as the use of polyimides in the electronic industry.7 Maleimide-based chromophores are also found in nature exhibiting an electron accepting affinity which is highly sensitive to chemical substitution. By careful substitution, the fluorescence can be tuned to a required emission frequency.3 The impact of substitution is also seen in photoinduced reactions of several classes of maleimide derivates.8 While maleimide is well-known for its dimerisation via intramolecular [2+2] photocycloaddition,9 commonly observed together with photopolymerisation, N-substituted derivates avoid this reaction type and favour [5+2] photocycloadditions.10 Derivatives containing oxygen- and thio-substituted functional groups on the carbon double bond, known as next-generation maleimides, speed up and further expand the spectrum of accessible photocycloaddition reactions enabled by altered UV absorption mechanisms and their unique excited-state physics.11,12
Maleimide and its N-alkyl derivates have been subject to experimental absorption spectroscopy by Seliskar et al. who identified four electronic transitions below 6.5 eV for maleimide in solution, three being allowed singlet excitations increasing in intensity.13–15 These results were later confirmed by studies including a (1+1) REMPI experiment and theoretical investigation by ter Steege et al.16 and Climent et al.17 designating four singlet excited states of nπ* and ππ* character: 11B1(nπ*), 11A2(nπ*), 11B2(ππ*) and 21B2(ππ*). Regarding the vibrational spectrum of maleimide, more theoretical18–21 and experimental data are available including infrared,22–24 Raman23,24 and inelastic neutron scattering spectroscopy.24 To our knowledge there are no highly-resolved vapour phase absorption spectra published so far impeding a spectral mapping with vibronic simulations.
The aim of this work is to achieve a deeper understanding of the excited-state photophysics of maleimide by studying the fine structure of the first two excitation bands in the vapour phase absorption spectrum related to the 11B2 and 21B2 excited state, respectively. Solving the time-dependent Schrödinger equation using molecular quantum dynamics simulations has been proven a solid and efficient strategy to study small aromatic and heterocyclic compounds where non-adiabatic effects are well-known to dominate the spectrum composed of vibronically-coupled electronic states.2 By applying the vibronic coupling model of Köppel et al.25,26 to construct an approximate Hamiltonian, the Multiconfigurational Time-Dependent Hartree (MCTDH) wavepacket propagation method27–29 and its multilayer version (ML-MCTDH)30–34 are used for calculating dynamical and spectral properties including a fixed number of electronic states within the manifold of vibrational modes. Although we only consider the singlet states in this work, the triplet states are also likely to play a role in the photo-excited dynamics of this molecule, and their importance will be treated in future work.
2 Theoretical framework
2.1 The vibronic coupling model
The vibronic coupling model has become routine in the description of vibronically coupled states by setting up an approximate Hamiltonian to cover the features required to simulate vibrationally-resolved electronic spectra.35–42 A diabatic electronic basis is used in order to avoid singularities at points where potential energy surfaces (PESs) cross such as conical intersections. While the diabatic basis is crucial for dynamical calculations, the adiabatic picture still holds when describing the important features of the PESs following from ab initio calculations.43,44 In the diabatic picture it is assumed that the PESs are smooth and a potential matrix W can be defined which is expressed in a Taylor series in terms of mass- and frequency-scaled normal mode coordinates Q. If the expansion is truncated at second order, the approach is known as the quadratic vibronic coupling (QVC) model.| H = H(0) + W(0) + W(1) + W(2) | (1) |
The zeroth-order ground state Hamiltonian H(0) is represented by the on-diagonal nuclear kinetic energy operator TN and has the dimensionality of five, i.e. the number of electronic states being considered here. In this model, the vibrational degrees of freedom, α, enter with frequencies ωα. The zeroth-order diabatic potential matrix W(0) defines the main shape of the potentials. While various functions can be chosen, the simplest form is of the ground-state adiabatic potential in the harmonic approximation shifted by the relative energy Ei of each excited state at the Franck–Condon (FC) point.
 | (2) |
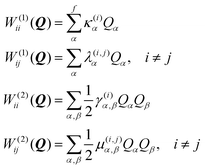 | (3) |
The linear intra-state coupling constants κ(i)α are related to the gradients of the adiabatic potentials at the FC point Q0 with respect to the nuclear coordinates, and modulate the energy gap between states along the vibrational mode corresponding to Qα. The linear inter-state coupling constants λ(i,j)α provide an interaction between electronic states close in energy. The bilinear (quadratic) on-diagonal coupling constants γ(i)α,β (γ(i)α,α) account for the mode-coupling Duschinsky rotation (frequency shifts). It was found that both the frequency shifts and Duschinsky rotation can become non-negligible for selected vibrational modes. The bilinear (quadratic) off-diagonal coupling constants μ(i,j)α,β (μ(i,j)α,α), that provides higher order coupling between electronic states, are usually of minor importance throughout and can be reasonably neglected.
By simple group theory arguments the molecular symmetry can be used to reduce this large number of contributing parameters. Since all coupling constants can be derived as a sum of integrals with integrands belonging to a certain direct product representation, these constants will be zero if the integrands do not contain the totally symmetric irreducible representation ΓA of the point group of interest (here C2v). Thus, a set of selection rules is given depending on the electronic state symmetries Γi, Γj ∈ {A1,A2,B1,B2} and vibrational symmetries Γα, Γβ ∈ {a1,a2,b1,b2}.
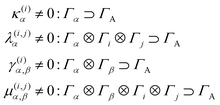 | (4) |
For some vibrational modes, the significant anharmonicity in the potentials indicate that the harmonic approximation is a poor description and the diabatic potentials must be replaced by state-specific quartic, Wq,ii, or Morse, Wm,ii, potentials.
 | (5) |
| Wm,ii(Qα) = D(i)0{1 − exp[−a(i)α(Qα − Q(i)0,α)]}2 | (6) |
For the Morse potential, the parameter D(i)0 defines the state-specific dissociation energy, a(i)α controls the width of the potential, and Q(i)0,α describes the equilibrium position relative to the FC point of normal mode coordinate Qα. In the quartic potential, ε(i)α is the quartic expansion coefficient. The coupling parameters for the PESs entering the model Hamiltonian are then obtained from a least-squares fitting procedure introduced in Section 3.3. It was checked that the use of Morse potentials, which are unbound, does not introduce errors into the simulations due to the wavepacket reaching the end of the grid. In all the modes for which a Morse potential was used the dissociation channel is high enough in energy not to be accessible.
2.2 The MCTDH wavepacket propagation method
Utilising the derived multi-mode and multi-state model Hamiltonian, the goal is to solve the time-dependent Schrödinger equation for the nuclear dynamics of a molecule. | (7) |
![[Q with combining tilde]](https://www.rsc.org/images/entities/i_char_0051_0303.gif) k with k = 1,…, p.
k with k = 1,…, p.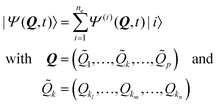 | (8) |
The state- and time-dependent multiconfigurational wavefunction Ψ(i) can then be written in terms of a set of expansion coefficients  and single-particle functions
  (SPFs) which, introducing a generalised index J = (ji1,…, jip), constitute the Hartree product Φ(i)J.
 | (9) |
 | (10) |
A limiting factor in MCTDH calculations is the length of the vector A describing the set of expansion coefficients. This length is reduced by combining several degrees of freedom in the same SPF (cf.eqn (8)). However, now high-dimensional SPFs need to be propagated and if one over combines, the propagation of the SPFs can take longer than the propagation of the A vector and the efficiency is lost. If the propagation of the multidimensional SPFs is still too long, MCTDH can be used to propagate them in a multilayer manner (ML-MCTDH). In this case, the SPFs are expanded recursively in sets of time-dependent SPFs and only the last layer is represented by the discrete time-independent grid. This latter approach has been used extensively to treat large systems.30–34
2.3 Derivation of spectral properties
The simulation of the electronic excitation spectrum requires calculating the absorption cross section σ, which is proportional to the squared transition matrix element of an appropriate transition operator![[T with combining circumflex]](https://www.rsc.org/images/entities/i_char_0054_0302.gif) . The initial wavefunction Ψi0 denotes the vibrational and electronic ground state which serves as reference for the vertical excitation into the excited state manifold.
. The initial wavefunction Ψi0 denotes the vibrational and electronic ground state which serves as reference for the vertical excitation into the excited state manifold. | (11) |
In a time-dependent scheme the spectral signature follows from the Fourier transform of the autocorrelation function C.
 | (12) |
| C(t) = 〈Ψ(0)|Ψ(t)〉 |
| = 〈Ψ*(t/2)|Ψ(t/2)〉 | (13) |
Ψ(0) = ![[T with combining circumflex]](https://www.rsc.org/images/entities/i_char_0054_0302.gif) |Ψi0〉 |Ψi0〉 | (14) |
Fourier transform artifacts arising from a finite propagation time are reduced by introducing a cosine function,
 | (15) |
Since very long propagation times are computationally inaccessible, another advantageous method has been shown to be satisfactory for many applications.26,44 Reinserting the vibronic eigenstates into the integral form of eqn (11), the time-independent Schrödinger equation can be recovered. When using a direct product ansatz of harmonic oscillator eigenfunctions, the unperturbed Hamiltonian TN + V now states a highly sparse algebraic eigenvalue problem that can be solved efficiently by Lanczos diagonalisation yielding the excitation energies and intensities.
3 Results
3.1 Experimental absorption spectrum
The experimental absorption spectrum has been recorded in the range 3.6–6.2 eV using a PerkinElmer Lambda 365 spectrometer. The maleimide sample was heated up to 315 K in a gas cell containing fused silica windows to produce a detectable vapour pressure. The first two excitation bands occur at 4.7 eV and 5.9 eV as shown in the experimental spectra together with simulation results in Section 3.4. The first one, described in detail by Seliskar et al. in 3-methylpentane at 77 K and EPA mixed solvent at 300 K,13 is broad and shows little vibrational fine structure fading towards higher energies. The second one has only been characterised for the N-alkyl derivates13 indicating well-structured progressions for these type of compounds. The intensity ratio between the first and second excitation band is measured to be 1![[thin space (1/6-em)]](https://www.rsc.org/images/entities/char_2009.gif) :
:![[thin space (1/6-em)]](https://www.rsc.org/images/entities/char_2009.gif) 15.6 which is in excellent agreement with our EOM-CCSD and CASPT2 value of 1
15.6 which is in excellent agreement with our EOM-CCSD and CASPT2 value of 1![[thin space (1/6-em)]](https://www.rsc.org/images/entities/char_2009.gif) :
:![[thin space (1/6-em)]](https://www.rsc.org/images/entities/char_2009.gif) 15.3 (cf.Table 2) as well as Seliskar et al.'s ratio of 1
15.3 (cf.Table 2) as well as Seliskar et al.'s ratio of 1![[thin space (1/6-em)]](https://www.rsc.org/images/entities/char_2009.gif) :
:![[thin space (1/6-em)]](https://www.rsc.org/images/entities/char_2009.gif) 13.3.
13.3.
3.2 Electronic structure calculations
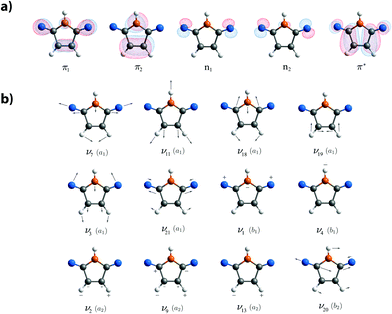
The diabatic PESs entering the model Hamiltonian are obtained from fitting adiabatic PESs which, in turn, result from ab initio single-point calculations along the mass- and frequency-scaled normal mode coordinates. Therefore, geometry optimisations and ground-state frequency analyses were performed at the CCSD level of theory to match experimental IR data as listed in Table 1. The mode and symmetry labels follow the energetically-ordered CCSD/cc-pVDZ results whose normal mode coordinates span the adiabatic PESs. In general, deviations get smaller when extending the basis set used. The most important normal modes are shown in Fig. 1b. It is worth mentioning that in contrast to related heterocycles such as pyrrole,40 the N–H bond dissociation during photoexcitation, approximately described by the totally-symmetric stretching mode ν24, is of minor importance due to a high energy barrier. Hence, the vibronic coupling model does not require further adjustments regarding this vibrational mode.![[small nu, Greek, tilde]](https://www.rsc.org/images/entities/i_char_e0e1.gif) , for the S0(11A1) ground state of maleimide in C2v symmetry ordered by increasing energy. The CCSD/cc-pVDZ level of theory is chosen as best balance between accuracy and computational cost. Stretching vibrations are labeled by ν, bending vibrations by δ and out-of-plane vibrations by γ followed by the most prominent atomic counterparts. The labels sym and asym define the retained and broken symmetry with respect to the σv mirror plane perpendicular to the molecular plane
, for the S0(11A1) ground state of maleimide in C2v symmetry ordered by increasing energy. The CCSD/cc-pVDZ level of theory is chosen as best balance between accuracy and computational cost. Stretching vibrations are labeled by ν, bending vibrations by δ and out-of-plane vibrations by γ followed by the most prominent atomic counterparts. The labels sym and asym define the retained and broken symmetry with respect to the σv mirror plane perpendicular to the molecular plane
| Mode | Symmetry | CCSD/cc-pVDZ | CCSD/aug-cc-pVTZ | Experimental | |
|---|---|---|---|---|---|
![[small nu, Greek, tilde]](https://www.rsc.org/images/entities/i_char_e0e1.gif) /cm−1 /cm−1 |
![[small nu, Greek, tilde]](https://www.rsc.org/images/entities/i_char_e0e1.gif) /cm−1 /cm−1 |
![[small nu, Greek, tilde]](https://www.rsc.org/images/entities/i_char_e0e1.gif) /cm−1 /cm−1 |
Description | ||
| a Woldbaek et al.: IR frequencies of a vapour at ∼430 K.22 b Woldbaek et al.: IR frequencies of an oriented polycrystalline film at 300 K.22 | |||||
| ν 1 | b1 | 112.96 | 125.32 | 175b | sym γ O![[double bond, length as m-dash]](https://www.rsc.org/images/entities/char_e001.gif) C–N–C C–N–C![[double bond, length as m-dash]](https://www.rsc.org/images/entities/char_e001.gif) O O |
| ν 2 | a2 | 288.95 | 296.27 | 301b | asym γ C![[double bond, length as m-dash]](https://www.rsc.org/images/entities/char_e001.gif) C C |
| ν 3 | a1 | 396.55 | 398.71 | 415b | sym δ C![[double bond, length as m-dash]](https://www.rsc.org/images/entities/char_e001.gif) O O |
| ν 4 | b1 | 498.44 | 496.94 | 504a | sym γ N–H |
| ν 5 | b2 | 541.09 | 545.55 | 635b | asym δ C![[double bond, length as m-dash]](https://www.rsc.org/images/entities/char_e001.gif) O O |
| ν 6 | b1 | 638.89 | 644.80 | 637a | sym γ C–H |
| ν 7 | a1 | 642.03 | 648.71 | 668a | sym δ C–N–C |
| ν 8 | b2 | 679.46 | 685.81 | 721b | asym ν C–C![[double bond, length as m-dash]](https://www.rsc.org/images/entities/char_e001.gif) C–C C–C |
| ν 9 | a2 | 778.63 | 795.06 | 776b | asym γ C–C |
| ν 10 | b2 | 848.86 | 861.39 | 831a | sym γ C–H |
| ν 11 | a1 | 922.80 | 923.57 | 897a | sym ν C![[double bond, length as m-dash]](https://www.rsc.org/images/entities/char_e001.gif) C C |
| ν 12 | b2 | 931.49 | 936.19 | 906a | asym ν C–N–C |
| ν 13 | a2 | 958.67 | 985.76 | 972b | asym γ C–H |
| ν 14 | a1 | 1070.29 | 1087.45 | 1067b | sym δ C–H |
| ν 15 | b2 | 1168.78 | 1176.60 | 1130a | asym ν C–N–C |
| ν 16 | b2 | 1345.29 | 1348.58 | 1285a | asym δ C–H |
| ν 17 | b2 | 1367.22 | 1366.65 | 1322a | asym δ N–H |
| ν 18 | a1 | 1387.60 | 1383.81 | 1335a | sym ν C–N–C |
| ν 19 | a1 | 1663.88 | 1663.28 | 1580a | sym ν C![[double bond, length as m-dash]](https://www.rsc.org/images/entities/char_e001.gif) C C |
| ν 20 | b2 | 1871.13 | 1854.01 | 1756a | asym ν C![[double bond, length as m-dash]](https://www.rsc.org/images/entities/char_e001.gif) O O |
| ν 21 | a1 | 1908.41 | 1897.42 | 1775a | sym ν C![[double bond, length as m-dash]](https://www.rsc.org/images/entities/char_e001.gif) O O |
| ν 22 | b1 | 3265.78 | 3266.89 | 3090a | asym ν C–H |
| ν 23 | a1 | 3288.53 | 3289.00 | 3108b | sym ν C–H |
| ν 24 | a1 | 3692.99 | 3702.85 | 3482a | sym ν N–H |
The accurate description of excited-state surfaces often requires the inclusion of static correlation in terms of multireference methods employing an active space such as CASSCF/CASPT2.47,48 The active space CAS(12,9) has been chosen to comprise every orbital of nπ and ππ* character. The five orbitals that mainly characterise the first five electronic states are shown in Fig. 1a. The CASSCF computations used a state average over eleven roots. Multistate CASPT2 was performed on top of the CASSCF wavefunction to account for the missing dynamical correlation. The calculations were done in absence of symmetry and no level shifts or IPEA shift were needed. Since it was not possible to produce continuous PESs for all nuclear configurations and excited states at bearable computational costs, the SA(11)-CASPT2(12,9)/cc-pVDZ and EOM-CCSD/aug-cc-pVTZ single-point results have been used to verify the applicability of the EOM-CCSD/cc-pVDZ level of theory.47 The electronic state and symmetry labels given in Table 2 follow the energetically-ordered EOM-CCSD/cc-pVDZ results which have been chosen for the computation of the adiabatic PESs due to their appropriate accuracy-cost balance. Analysing the character of the transitions indicates that the 3s, 3p and 3d Rydberg and corresponding mixed-valence orbitals do not contribute below 7 eV, as also mentioned by Climent et al.17 using CASPT2 calculations with varying active spaces. At all levels of the theory tested the same order of states was found, with EOM-CCSD overestimating the excitation energy by approximately 0.5 eV compared to the best CASPT2 results. It was found that only the S3 and S4 states are bright, with the latter having the largest oscillator strength. These states are therefore responsible for the bands measured in the vapour phase spectrum centred at 4.72 and 5.95 eV.
| State | Symmetry | EOM-CCSD/cc-pVDZ | EOM-CCSD/aug-cc-pVTZ | SA(11)-CASPT2(12,9)/cc-pVDZ | Experiment |
|---|---|---|---|---|---|
| E/eV (f) | E/eV (f) | E/eV (f) | E/eV (f) | ||
| a Our vapour phase results at 315 K. b Seliskar et al.: maleimide in EPA mixed solvent at 77 K.13 c Seliskar et al.: maleimide in 3-methylpentane at 300 K.13 | |||||
| S0(n22) | 11A1 | 0.00 | 0.00 | 0.00 | |
| S1(n2π*) | 11B1 | 4.06 (0.00) | 4.13 (0.00) | 3.37 (0.00) | 3.33b |
| S2(n1π*) | 11A2 | 4.84 (—) | 4.90 (—) | 3.96 (—) | |
| S3(π2π*) | 11B2 | 5.22 (0.03) | 5.23 (0.03) | 4.62 (0.03) | 4.72,a 4.48,b 4.67c |
| S4(π1π*) | 21B2 | 6.68 (0.42) | 6.55 (0.46) | 5.80 (0.46) | 5.95,a 6.20bc |
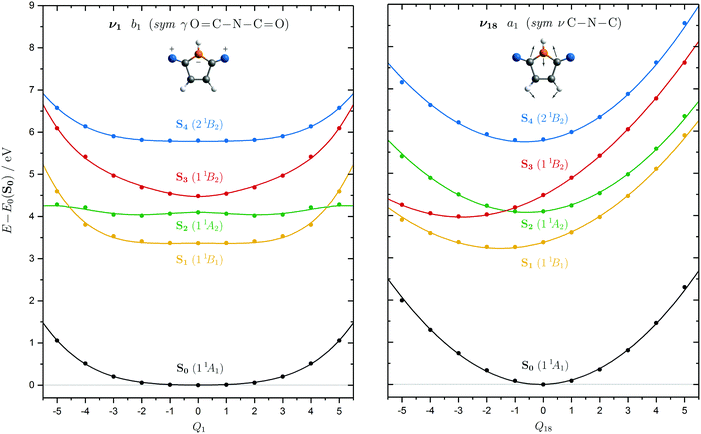
Cuts through the PESs at the EOM-CCSD/cc-pVDZ level of theory were made at points along all the normal mode coordinates for the chosen electronic states, denoted as S0–S4. Examples of the cuts are shown in Fig. 2. A larger state manifold comprising ten singlet excited states, S1–S10, and the first five triplet excited states, T1–T5, can be found in the ESI† employing EOM-CCSD/cc-pVDZ, along with vertical excitation energies using the SA(11)-CASPT2(12,9), EOM-CCSD and ADC(3) methods. Coupling between the S4 and S5 excited state is vanishingly small throughout owing to the big energy gap at the FC region. Thus, ignoring the triplet states, a model Hamiltonian selecting the first five singlet electronic states is expected to cover most of the vibronic features necessary for the description of the absorption spectrum below 7 eV.
The characterisation of excited-state PESs along selected normal mode coordinates can be divided into two classes of vibrational modes that contribute to the model Hamiltonian (cf.Fig. 2). Mode ν18 is representative for symmetric stretching vibrations of a1 symmetry that provide non-zero intra-state coupling and show surface crossings. Mode ν1 class vibrations on the other hand correspond to either symmetric out-of-plane or asymmetric bending vibrations of b1 or b2 symmetry. These potentials are symmetric with respect to the FC point and these modes can provide inter-state and higher-order coupling (cf. Section 3.3). The double well of the S2 surface along Q1 in Fig. 2 is due to strong inter-state non-adiabatic coupling with the S3 state. An overview of the PESs of all 24 normal modes can be found in the ESI.†
The CCSD geometry optimisation and frequency analysis, as well as excited state calculations employing the EOM-CCSD method, have been performed using Gaussian1649 and Q-Chem5.3.50 The CASSCF/CASPT2 calculations were performed with the program Molcas8.2.51
3.3 Fitting the potential energy surfaces
The coupling parameters which need to be determined are included in the model potentials W entering the electronic Hamiltonian in the diabatic basis. Since diagonalisation of the corresponding matrix provides the adiabatic energies, the coupling parameters can be determined by minimising the root-mean-square deviation of these energies with respect to the computed single-point energies at different nuclear configurations. This was done using the VCHam programs, which are a part of the quantum dynamics software Quantics.52,53 The actual quantity to be optimised (eqn (16)) is the functional Δ with σ being here the number of electronic states and nσ the number of points along each adiabatic PES considered. A weight function Ωsi is added where Vs0 corresponds to the sth adiabatic potential at the FC point. | (16) |
The optimisation is performed order-by-order in the Taylor expansion with on-diagonal elements being calculated before off-diagonal contributions. It is known that linear intra- and inter-state coupling constants κ(i)α and λ(i,j)α, listed in Tables 3 and 4, are responsible for the main features of the spectra while the quadratic and bilinear on-diagonal coupling constants γ(i)α,α and γ(i)α,β only have a small impact for most vibrational modes. The most important normal modes based on first-order parameters are shown in Fig. 1b. The full Hamiltonian is provided in the ESI.†
| Mode | ω/eV | κ (i) α /eV | |||
|---|---|---|---|---|---|
| (1) | (2) | (3) | (4) | ||
| ν 3 | 0.049 | −0.044 | 0.020 | −0.054 | −0.006 |
| ν 7 | 0.080 | −0.041 | −0.065 | −0.158 | −0.078 |
| ν 11 | 0.114 | ![[thin space (1/6-em)]](https://www.rsc.org/images/entities/char_2009.gif) 0.069 0.069 |
![[thin space (1/6-em)]](https://www.rsc.org/images/entities/char_2009.gif) 0.089 0.089 |
![[thin space (1/6-em)]](https://www.rsc.org/images/entities/char_2009.gif) 0.127 0.127 |
![[thin space (1/6-em)]](https://www.rsc.org/images/entities/char_2009.gif) 0.064 0.064 |
| ν 18 | 0.172 | ![[thin space (1/6-em)]](https://www.rsc.org/images/entities/char_2009.gif) 0.187 0.187 |
![[thin space (1/6-em)]](https://www.rsc.org/images/entities/char_2009.gif) 0.083 0.083 |
![[thin space (1/6-em)]](https://www.rsc.org/images/entities/char_2009.gif) 0.352 0.352 |
![[thin space (1/6-em)]](https://www.rsc.org/images/entities/char_2009.gif) 0.109 0.109 |
| ν 19 | 0.206 | ![[thin space (1/6-em)]](https://www.rsc.org/images/entities/char_2009.gif) 0.049 0.049 |
![[thin space (1/6-em)]](https://www.rsc.org/images/entities/char_2009.gif) 0.130 0.130 |
![[thin space (1/6-em)]](https://www.rsc.org/images/entities/char_2009.gif) 0.169 0.169 |
![[thin space (1/6-em)]](https://www.rsc.org/images/entities/char_2009.gif) 0.229 0.229 |
| ν 21 | 0.237 | 0.229 | ![[thin space (1/6-em)]](https://www.rsc.org/images/entities/char_2009.gif) 0.359 0.359 |
![[thin space (1/6-em)]](https://www.rsc.org/images/entities/char_2009.gif) 0.100 0.100 |
![[thin space (1/6-em)]](https://www.rsc.org/images/entities/char_2009.gif) 0.279 0.279 |
| Mode | Symmetry | ω/eV | λ (i,j) α /eV | ||||||
|---|---|---|---|---|---|---|---|---|---|
| (0,1) | (1,2) | (1,3) | (1,4) | (2,3) | (2,4) | (3,4) | |||
| ν 1 | b1 | 0.014 | −0.011 | −0.131 | |||||
| ν 2 | a2 | 0.036 | 0.055 | −0.121 | |||||
| ν 3 | a1 | 0.049 | −0.061 | ||||||
| ν 4 | b1 | 0.062 | 0.039 | 0.090 | −0.076 | ||||
| ν 7 | a1 | 0.080 | −0.089 | ||||||
| ν 9 | a2 | 0.097 | 0.110 | 0.138 | |||||
| ν 10 | b2 | 0.105 | −0.075 | ||||||
| ν 13 | a2 | 0.119 | 0.164 | ||||||
| ν 20 | b2 | 0.232 | −0.172 | ||||||
Since the intra-state coupling constants κ(i)α correspond to the gradients of the adiabatic potentials at the FC point, large non-zero values weighted by the corresponding frequencies, ωα, indicate modes that will significantly influence the dynamics following the vertical excitation to the S3(11B2) and S4(21B2) singlet excited states. Only totally-symmetric a1 modes exhibit non-zero gradients at the FC point, as illustrated for mode ν18 in Fig. 2 (cf.eqn (4)). Concerning the vertical excitation to the S3(11B2) state, modes ν7, ν18 and ν21 are of special importance as they exhibit surface crossings with the S2(11A2) state which provide a barrierless pathway for the relaxation. Although they do not lead directly to any crossings, ν7, ν18, ν19 and ν21 are the most important vibrations for excitation to the S4(21B2) state.
Non-zero inter-state coupling constants λ(i,j)α represent the first-order off-diagonal elements of the diabatic potential matrix meaning that these are the most important non-adiabatic coupling contributions with respect to the short-time dynamics. The larger the frequency-weighted values are for electronic states close in energy, the bigger is the impact on the vibronic spectrum. Significant coupling is obtained between the S3(11B2) and lower lying S2(11A2) and S1(11B1) excited states. Specifically the vibrational modes ν1(b1), ν2(a2), ν4(b1), ν9(a2) and ν20(b2) dominate the coupling between these energetically close states. The excited state S4(21B2) is only coupled weakly to the low-lying states due to the increased energy gap around the FC region. As a consequence, first-order non-adiabatic effects are small in the second excitation band leading to a clear fine structure in the spectrum. Nevertheless, significant couplings are present with the S3(11B2) state along the ν3 and ν7 vibrations. Note that these are totally symmetric vibrations as the S3 and S4 states have the same symmetry and these modes have significant κ parameters as well.
Second-order on-diagonal contributions of quadratic and bilinear character have also been included. The quadratic constants γ(i)α,α affect the spectrum by a state-specific change of frequency for mode α as shown in eqn (17).
 | (17) |
By inspection, modes ν1, ν4 and ν22 are not harmonic and were described instead by a quartic oscillator diabatic potential, as shown in eqn (5). Modes ν11, ν19, ν21, ν23 and ν24 were described by the Morse potential of eqn (6). The parameters obtained for these potentials from the least-squares fit are given in the ESI.†
It was found that minor adjustments had to be made to some parameters to achieve a good agreement with the experimental spectrum, in particular to get the fine structure of the second spectral band. These adjusted parameters are presented in Table 5. In addition, the CASPT2 energies were used to adjust the position of the EOM-CCSD potential energy surfaces at the FC point.
| Parameter | From fitting | Adjusted |
|---|---|---|
| Q (4)0,11 | −0.808 | −1.100 |
| Q (4)0,21 | −1.430 | −1.200 |
| a (4)19 | −0.032 | −0.030 |
| κ (4)7/eV | −0.078 | −0.100 |
| λ (3,4)3/eV | −0.061 | −0.100 |
| γ (4)18,18/eV | −0.014 | −0.020 |
3.4 Quantum dynamics calculations
Within the quantum dynamics simulations employing the MCTDH method, a wavepacket is vertically excited to the singlet states S3(11B1) and S4(21B1) from which the absorption spectra are obtained by evaluating the autocorrelation function, i.e. a constant transition dipole moment is assumed. The spectra are then normalised to have the same maximum intensity. Two models have been set up for the MCTDH simulations containing six and twelve modes, as well as a full 24-mode model using the ML-MCTDH approach. The 6-mode model for the simulations starting on the S4 state includes all of the totally symmetric modes, which provide the intra-state coupling and coupling to the S3 state. For the dynamics starting on the S3 state, the ν3 and ν21 modes that have the weakest inter-state coupling are replaced by ν1 and ν4 to include the coupling to the S2 state.The 12-mode model Hamiltonian is the same for the simulations starting on both states and includes all of the modes with strong coupling terms listed in Tables 3 and 4, except ν10 that should have the smallest effect on the dynamics as it only weakly couples states S2 and S4. Details concerning the mode combination, the number of SPFs and the DVR grid for converged spectra and state populations up to 200 fs can be found in Table 6 and Fig. 3. All calculations were done using the Quantics Package.52,53
| State | Model | Particle | n | DVR | N |
|---|---|---|---|---|---|
| 11B2 | 6-mode | (ν7,ν18) | [2,2,35,32,5] | HO | (21,31) |
| (ν1,ν11) | [2,2,35,32,5] | HO | (16,16) | ||
| (ν4,ν19) | [2,2,18,18,4] | HO | (16,16) | ||
| 12-mode | (ν3,ν4,ν7,ν11) | [2,22,19,22,5] | HO | (21,16,21,16) | |
| (ν1,ν9,ν13,ν18) | [2,26,22,22,7] | HO | (16,21,11,31) | ||
| (ν2,ν19,ν20,ν21) | [2,20,15,15,4] | HO | (11,16,11,16) | ||
| 21B2 | 6-mode | (ν7,ν18) | [2,2,2,12,7] | HO | (21,31) |
| (ν3,ν11) | [2,2,2,11,7] | HO | (21,16) | ||
| (ν19,ν21) | [2,2,2,11,7] | HO | (16,16) | ||
| 12-mode | (ν3,ν4,ν7,ν11) | [2,6,4,13,5] | HO | (21,16,21,16) | |
| (ν1,ν9,ν13,ν18) | [2,9,4,14,9] | HO | (16,21,11,31) | ||
| (ν2,ν19,ν20,ν21) | [2,9,3,13,8] | HO | (11,16,11,16) | ||
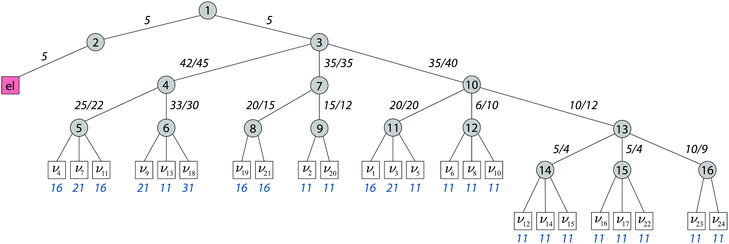 | ||
| Fig. 3 Layer structure of the ML-MCTDH simulations including all 24 normal modes. The number in the circles (grey) denotes the node number in the layered structure, while within nodes the number n of SPFs is noted next to the link lines. From the second layer onwards two values are given representing the simulation for the first and second excitation band, respectively. In the last layer, comprising the normal modes of one “particle”, the number N of primitive functions (blue) is used to represent the grid in each normal mode. The maximum depth of the tree is five layers and the first one separates the 24 vibrational coordinates from the discrete electronic degree of freedom (red) in the single-set formulation.31 | ||
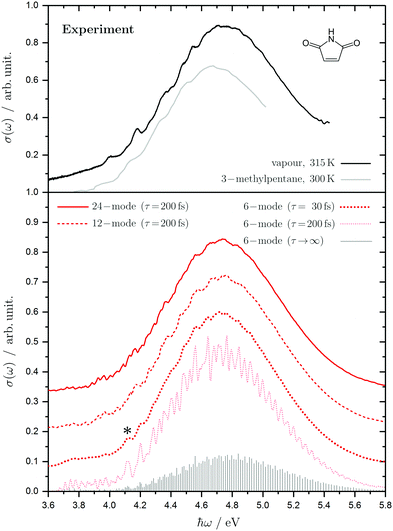 | ||
| Fig. 4 Experimental (top) and calculated absorption spectra (bottom) for the first excitation band of maleimide represented by the absorption cross section σ as a function of the photon energy ħω. The experimental spectrum is shown for our vapour phase result at 315 K (black) and for Seliskar et al.'s measurement in 3-methylpentane at 300 K (grey).13 The simulated spectrum results are shown for the vertical excitation to the S3(11B2) diabatic state using a 6-mode (dotted line), 12-mode (dashed line) and 24-mode model (solid line). The simulated spectra have been shifted to overlap the experimental band by approximately the zero-point energy of the ground-state. A damping time of τ = 30 fs (red) has been used for the 6-mode model to account for the phenomenological broadening. The * indicates the origin of the vibrational progressions found in the 6-mode model. The vibronic fine structure for the 6-mode model is enhanced using a damping time of τ = 200 fs (light red) and the stick spectrum in the limit τ → ∞ (grey) is obtained from direct Lanczos diagonalisation in 1000 steps. The 12-mode and 24-mode spectra are broadened using only a 200 fs damping time. The spectra are shifted vertically for reasons of visibility. | ||
With a damping time of 200 fs the vibronic lines are enhanced. It is impossible to resolve them further. The spectrum is thus found to be a complicated set of multi-mode lines and it is difficult to assign the structure to particular vibrations as the bands overlap. The main shape and width, however, is due to the strong excitation of the ν7, ν11 and ν18 modes. These are responsible for the strong progression of peaks – the first four of which are at approximately 0.08, 0.12, 0.17, 0.20 and 0.25 eV above the origin (marked with an asterisk) and thus due to 710, 1110, 710 + 1810, 7101110 and 7101810 vibronic excitations. There is also clear structure below the S3 origin due to excitations involving the S2 state.
The 12-mode model adds in the remaining a1 modes ν3 and ν21, and includes the inter-state coupling to the S1 state, either directly to S3 or indirectly via S2, by adding the modes ν2, and ν20, and the coupling to S0 by modes ν9 and ν13. A damping time of 200 fs now produces the broad band with little structure. The full 24-mode model then masks the structure further and reproduces the experimental spectra very well. Going from the 12-mode to 24-mode models does not increase the inter-state coupling appreciably, and so this extra damping of the spectrum must be due to intra-state dephasing in the full set of vibrations.
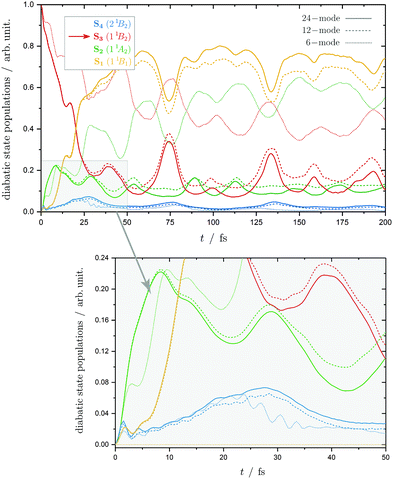
The diabatic population transfer for the three models between the excited states S1–S4 is shown in Fig. 5. While adiabatic populations refer to electronic state surfaces provided by the clamped-nucleus Hamiltonian, the diabatic populations are based on PESs for a certain electronic configuration.44 For example the S3(11B2) diabatic state is the π2π* configuration, and the S2(11A2) the n1π*, etc. These populations can thus be related to the electronic structure of the state at the FC point and are obtained directly from the wavepacket dynamics simulations due to the construction of the model.
Considering the 6-mode model first, an ultrafast decay of the initially populated S3(11B2) state is obtained due to the coupling with the adjacent S2(11A2) state. This initial transfer of population can be associated with the conical intersections between these states close to the FC point. At around 100 fs the populations of those states becomes approximately saturated with a transfer of 60% to the S2 state, while the S4(21B2) makes a negligibly small contribution. The S1 and S0 states are not coupled and do not receive any population. The populations in states S2 and S3 are seen to coherently oscillate with two time period of approximately 25 and 50 fs, which correlates nicely with the time periods of ν7 and ν18 which are approximately 25 and 50 fs, respectively.
The calculations performed with more modes, i.e. the 12- and 24-mode models, show that adding the coupling to the lower lying states dramatically changes the population dynamics and now the population is transferred mostly to the S1 state. With 12-modes, after 100 fs there is approximately a ratio of 66![[thin space (1/6-em)]](https://www.rsc.org/images/entities/char_2009.gif) :
:![[thin space (1/6-em)]](https://www.rsc.org/images/entities/char_2009.gif) 12
12![[thin space (1/6-em)]](https://www.rsc.org/images/entities/char_2009.gif) :
:![[thin space (1/6-em)]](https://www.rsc.org/images/entities/char_2009.gif) 20
20![[thin space (1/6-em)]](https://www.rsc.org/images/entities/char_2009.gif) :
:![[thin space (1/6-em)]](https://www.rsc.org/images/entities/char_2009.gif) 2 in the S1, S2, S3 and S4 states. A negligible transfer to S0 is found. While the initial transfer goes from S3 to S2, a coherent transfer between S3 and S1 with a time period of approximately 50 fs also takes place. With all 24 modes included, a very similar population dynamics is seen, but the final ratios are now approximately 72
2 in the S1, S2, S3 and S4 states. A negligible transfer to S0 is found. While the initial transfer goes from S3 to S2, a coherent transfer between S3 and S1 with a time period of approximately 50 fs also takes place. With all 24 modes included, a very similar population dynamics is seen, but the final ratios are now approximately 72![[thin space (1/6-em)]](https://www.rsc.org/images/entities/char_2009.gif) :
:![[thin space (1/6-em)]](https://www.rsc.org/images/entities/char_2009.gif) 12
12![[thin space (1/6-em)]](https://www.rsc.org/images/entities/char_2009.gif) :
:![[thin space (1/6-em)]](https://www.rsc.org/images/entities/char_2009.gif) 12
12![[thin space (1/6-em)]](https://www.rsc.org/images/entities/char_2009.gif) :
:![[thin space (1/6-em)]](https://www.rsc.org/images/entities/char_2009.gif) 3 for S1
3 for S1![[thin space (1/6-em)]](https://www.rsc.org/images/entities/char_2009.gif) :
:![[thin space (1/6-em)]](https://www.rsc.org/images/entities/char_2009.gif) S2
S2![[thin space (1/6-em)]](https://www.rsc.org/images/entities/char_2009.gif) :
:![[thin space (1/6-em)]](https://www.rsc.org/images/entities/char_2009.gif) S3
S3![[thin space (1/6-em)]](https://www.rsc.org/images/entities/char_2009.gif) :
:![[thin space (1/6-em)]](https://www.rsc.org/images/entities/char_2009.gif) S4, and less than 1% ends up in the ground-state.
S4, and less than 1% ends up in the ground-state.
Thus, the many small couplings play a crucial role in the population transfer. This can be explained by the inclusion of the vibrational modes ν2(a2), ν9(a2) and ν20(b2) which mediate the population transfer into S1, either directly from S3 or via S2. Hence, even though the 6-mode model can qualitatively reproduce the experimental spectrum, a higher-dimensional Hamiltonian is essential for describing the full dynamical behavior.
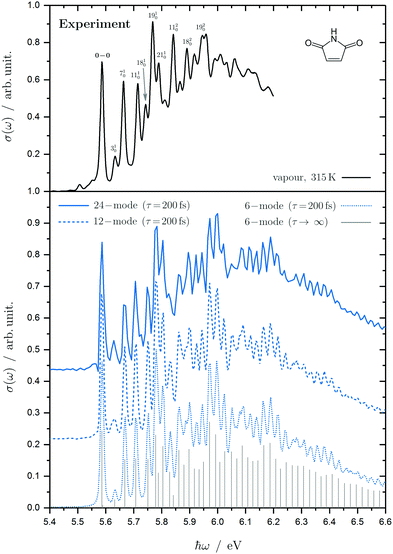 | ||
| Fig. 6 Experimental (top) and calculated absorption spectra (bottom) for the second excitation band of maleimide represented by the absorption cross section σ as a function of the photon energy ħω. The experimental spectrum is shown for our vapour phase result at 315 K (black). The simulated spectrum results from the vertical excitation to the S4(21B2) diabatic state using a 6-mode (dotted line), 12-mode (dashed line) and 24-mode model (solid line). The simulated spectra have been shifted to align with the experimental band by subtracting approximately the ground-state zero-point energy. A damping time of τ = 200 fs (blue) has been chosen to account for the phenomenological broadening. The stick spectrum in the limit τ → ∞ (grey) is obtained from direct Lanczos diagonalisation in 1000 steps for the 6-mode model. The simulated spectra are shifted for reasons of visibility. The peak assignment of the most important vibronic excitations in the experimental spectrum follows from the 6-mode model (cf. ESI† for details). | ||
As the S3 and S4 states have the same symmetry, the totally symmetric modes in the 6-mode model include the linear coupling between these states. As a result, the 6-mode model comprising the a1 modes ν3, ν7, ν11, ν18, ν19 and ν21 is capable of producing results of quantitative accuracy for the energy regime below 6.0 eV. The low-energy regime is mostly shaped by fundamental vibronic excitations as labeled in Fig. 6. A more detailed peak assignment is given in the ESI.† The high-energy regime of the spectrum, however, shows a more complex structure of broader nature than the experimental one, which can be explained by the errors in the Hamiltonian parameters and would be improved by further adjustments.
Adding the extra modes in the 12-mode and 24-mode models does not affect the main features of the spectrum, except for increasing the intensity in the middle of the band. It should be mentioned that heating or cooling the sample would introduce a temperature-dependent broadening of the experimental peak widths as well as producing a tail towards higher energies additionally affecting the absolute intensities.
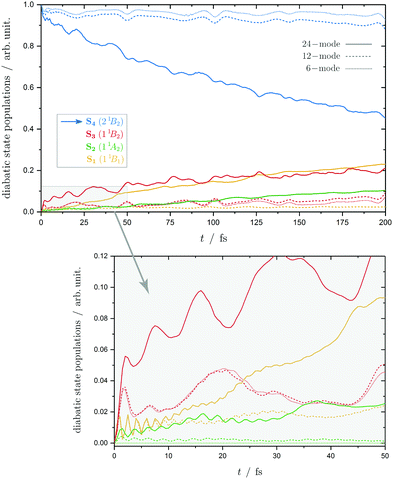
The diabatic population transfer following the excitation to the S4(21B2) state is depicted in Fig. 7. It is clear to see that by just considering the dominant intra-state coupling, the wavepacket preferably remains on the initial excited state and only about 5% transfer to the S3 occurs. Adding in the main couplings to the lower states in the 12-mode model does not appreciably change this behaviour, except that now some population is transferred to S1, with a ratio of approximately 2![[thin space (1/6-em)]](https://www.rsc.org/images/entities/char_2009.gif) :
:![[thin space (1/6-em)]](https://www.rsc.org/images/entities/char_2009.gif) 0
0![[thin space (1/6-em)]](https://www.rsc.org/images/entities/char_2009.gif) :
:![[thin space (1/6-em)]](https://www.rsc.org/images/entities/char_2009.gif) 9
9![[thin space (1/6-em)]](https://www.rsc.org/images/entities/char_2009.gif) :
:![[thin space (1/6-em)]](https://www.rsc.org/images/entities/char_2009.gif) 89 after 200 fs for S1
89 after 200 fs for S1![[thin space (1/6-em)]](https://www.rsc.org/images/entities/char_2009.gif) :
:![[thin space (1/6-em)]](https://www.rsc.org/images/entities/char_2009.gif) S2
S2![[thin space (1/6-em)]](https://www.rsc.org/images/entities/char_2009.gif) :
:![[thin space (1/6-em)]](https://www.rsc.org/images/entities/char_2009.gif) S3
S3![[thin space (1/6-em)]](https://www.rsc.org/images/entities/char_2009.gif) :
:![[thin space (1/6-em)]](https://www.rsc.org/images/entities/char_2009.gif) S4.
S4.
There is, however, a striking change in the population dynamics when all the modes are included. There is now a steady transfer of population to the lower states, and after 200 fs the ratio of populations is approximately 25![[thin space (1/6-em)]](https://www.rsc.org/images/entities/char_2009.gif) :
:![[thin space (1/6-em)]](https://www.rsc.org/images/entities/char_2009.gif) 10
10![[thin space (1/6-em)]](https://www.rsc.org/images/entities/char_2009.gif) :
:![[thin space (1/6-em)]](https://www.rsc.org/images/entities/char_2009.gif) 20
20![[thin space (1/6-em)]](https://www.rsc.org/images/entities/char_2009.gif) :
:![[thin space (1/6-em)]](https://www.rsc.org/images/entities/char_2009.gif) 45 in the S1, S2, S3 and S4 respectively. This is a huge change due to the addition of many small couplings between the states (listed in ESI†). Looking in more detail at the initial population dynamics, it can be seen that at the start the additional modes provide a slightly larger transfer to S3 and S2 states. After 10 fs, this leads to a steady flow of population into S1 and S2, while the S3 population starts to plateau.
45 in the S1, S2, S3 and S4 respectively. This is a huge change due to the addition of many small couplings between the states (listed in ESI†). Looking in more detail at the initial population dynamics, it can be seen that at the start the additional modes provide a slightly larger transfer to S3 and S2 states. After 10 fs, this leads to a steady flow of population into S1 and S2, while the S3 population starts to plateau.
4 Conclusions
This work constructs an approximate model Hamiltonian in order to study quantum dynamical aspects of the first two excitation bands of maleimide's electronic absorption spectrum. In short, the quadratic vibronic coupling model is applied together with the MCTDH wavepacket propagation method. Adiabatic potential energy surfaces, from which the diabatic electronic basis is obtained, were calculated at the EOM-CCSD level of theory and verified with CASPT2. Only a small number of parameters required adjustment to provide good agreement between the model and experiment.New experimental spectra have also been recorded. The good agreement between the experimental absorption spectra and the simulated spectra from quantum dynamics simulations following vibronic excitation can be regarded as a validation of the simple model Hamiltonian. The two excitation bands studied have been found to be of fundamental different character. The 4.72 eV transition is dominated by inter-state coupling, and is broad and structureless. In contrast, the 5.95 eV transition has detailed structure owing to weaker inter-state couplings.
The second band is clearly identifiable as being due to excitation to the S4(21B2) state, and is well reproduced by a 6-mode model that includes all the totally symmetric vibrations that provide both the intra- and inter-state couplings to the lower S3(11B2) state. Little change is made to the spectrum by adding more modes and it was possible to assign the spectral peaks. The first band is identified as being due to excitation to the S3(11B2) state. Both bands are ππ* transitions. In contrast to the S4 band, the full 24-mode model was required to simulate the broad, fairly featureless spectrum. Lower dimensional calculations could, however, give insight into the vibrational modes being excited and the origin of the structure in the spectrum was found to be multi-mode in nature, with two dominant vibrations.
The population dynamics of the two bands also shows a different behaviour. Relaxation from the S3 state is fast and goes directly to both the S2 and S1 states. Negligible population returns to the ground state. Both the 12-mode and 24-mode models show the same dynamics, with over 70% of the population transferred to the S1 state after 100 fs. In contrast, relaxation from the S4 state in both the 6-mode and 12-mode models is seen to be very small. Only once all of the modes with many small inter-state couplings are added, an appreciable relaxation is seen (55% after 200 fs). Most of the population ends up in the S3 and S1 states.
In conclusion, the four lowest singlet excited states of maleimide provide a strongly coupled manifold. Even from the energetically more separated S4 state, which leads to a highly structured spectral band, ultrafast vibronic relaxation is seen providing all the vibrational modes are taken into account. Interestingly, after vertical excitation to the S3 state there is a highly efficient pathway directly to the S1 state, but after vertical excitation to the S4 the state population is left trapped in the S3 as well as relaxing down to the S1 state.
Conflicts of interest
There are no conflicts to declare.Acknowledgements
S. Gómez thanks the EPSRC for funding (Grant EP/S028781/1). A. Lehr gratefully acknowledges the Verband der Chemischen Industrie for scholarship funds.References
- A. B. Trofimov, H. Köppel and J. Schirmer, J. Chem. Phys., 1998, 109, 1025–1040 CrossRef CAS.
- H. Köppel, E. V. Gromov and A. B. Trofimov, Chem. Phys., 2004, 304, 35–49 CrossRef.
- J. Von Sonntag and W. Knolle, J. Photochem. Photobiol., A, 2000, 136, 133–139 CrossRef.
- C. W. Miller, E. Sonny Jönsson, C. E. Hoyle, K. Viswanathan and E. J. Valente, J. Phys. Chem. B, 2001, 105, 2707–2717 CrossRef CAS.
- X. H. Liu, H. K. Wang, J. N. Herron and G. D. Prestwich, Bioconjugate Chem., 2000, 11, 755–761 CrossRef CAS.
- C. Antczak, B. Bauvois, C. Monneret and J. C. Florent, Bioorg. Med. Chem., 2001, 9, 2843–2848 CrossRef CAS.
- J. P. LaFemina, G. Arjavalingam and G. Hougham, J. Chem. Phys., 1989, 90, 5154–5160 CrossRef CAS.
- J. Von Sonntag, W. Knolle, S. Naumov and R. Mehnert, Chem. – Eur. J., 2002, 8, 4199–4209 CrossRef CAS.
- B. Pierre and J. Lemaire, J. Chem. Phys., 1980, 77, 161–165 Search PubMed.
- D. M. Davies, C. Murray, M. Berry, A. J. Orr-Ewing and K. I. Booker-Milburn, J. Org. Chem., 2007, 72, 1449–1457 CrossRef CAS.
- K. I. Booker-Milburn, J. K. Cowell, A. Sharpe and F. Delgado Jiménez, Chem. Commun., 1996, 249–251 RSC.
- L. M. Tedaldi, A. E. Aliev and J. R. Baker, Chem. Commun., 2012, 48, 4725–4727 RSC.
- C. J. Seliskar and S. P. McGlynn, J. Chem. Phys., 1971, 55, 4337–4342 CrossRef CAS.
- C. J. Seliskar and S. P. McGlynn, J. Chem. Phys., 1972, 56, 275–279 CrossRef CAS.
- C. J. Seliskar and S. P. Mculynn, J. Chem. Phys., 1972, 56, 1417–1422 CrossRef CAS.
- D. H. Ter Steege and W. J. Buma, J. Chem. Phys., 2003, 118, 10944–10955 CrossRef CAS.
- T. Climent, R. González-Luque and M. Merchán, J. Phys. Chem. A, 2003, 107, 6995–7003 CrossRef CAS.
- C. Corsaro and S. F. Parker, Physica B, 2004, 350, 591–593 CrossRef.
- E. C. Aguiar, J. B. P. da Silva and M. N. Ramos, Spectrochim. Acta, Part A, 2008, 71, 5–9 CrossRef.
- Y. Shigemitsu, K. Komiya, N. Mizuyama, M. Hagimori and Y. Tominaga, Lett. Org. Chem., 2009, 2009, 1–5 CrossRef.
- E. C. Aguiar, J. B. P. Da Silva and M. N. Ramos, J. Mol. Struct., 2011, 993, 431–434 CrossRef CAS.
- T. Woldbæk, P. Klaboe and C. J. Nielsen, J. Mol. Struct., 1975, 27, 283–301 CrossRef.
- J. Barnes, L. L. E. Gall, C. Madec and J. Lauransan, J. Mol. Struct., 1977, 38, 109–120 CrossRef.
- S. F. Parker, Spectrochim. Acta, Part A, 1995, 51, 2067–2072 CrossRef.
- L. S. Cederbaum, H. Köppel and W. Domcke, Int. J. Quantum Chem., 1981, 20, 251–267 CrossRef.
- H. Köppel, W. Domcke and L. S. Cederbaum, Adv. Chem. Phys., 1984, 57, 59–246 Search PubMed.
- H. D. Meyer, U. Manthe and L. S. Cederbaum, Chem. Phys. Lett., 1990, 165, 73–78 CrossRef CAS.
- M. H. Beck, A. Jäckle, G. A. Worth and H. D. Meyer, Phys. Rep., 2000, 324, 1–105 CrossRef CAS.
- G. A. Worth, H. D. Meyer, H. Köppel, L. S. Cederbaum and I. Burghardt, Int. Rev. Phys. Chem., 2008, 27, 569–606 Search PubMed.
- H. Wang and M. Thoss, J. Chem. Phys., 2003, 119, 1289–1299 CrossRef CAS.
- O. Vendrell and H. D. Meyer, J. Chem. Phys., 2011, 134, 044135 CrossRef.
- Q. Meng, S. Faraji, O. Vendrell and H. D. Meyer, J. Chem. Phys., 2012, 137, 134302 CrossRef.
- Q. Meng and H. D. Meyer, J. Chem. Phys., 2013, 138, 014313 CrossRef.
- Q. Meng and H. D. Meyer, J. Chem. Phys., 2017, 146, 184305 CrossRef.
- A. Raab, G. A. Worth, H.-D. Meyer and L. S. Cederbaum, J. Chem. Phys., 1999, 110, 936–946 CrossRef CAS.
- G. A. Worth, G. Welch and M. J. Paterson, Mol. Phys., 2006, 104, 1095–1105 CrossRef CAS.
- G. A. Worth, J. Photochem. Photobiol., A, 2007, 190, 190–199 CrossRef CAS.
- T. J. Penfold and G. A. Worth, J. Chem. Phys., 2009, 131, 064303 CrossRef.
- F. Wang, S. P. Neville, R. Wang and G. A. Worth, J. Phys. Chem. A, 2013, 117, 7298–7307 CrossRef CAS.
- S. P. Neville and G. A. Worth, J. Chem. Phys., 2014, 140, 034317 CrossRef CAS.
- G. W. Richings and G. A. Worth, J. Chem. Phys., 2014, 141, 244115 CrossRef.
- M. P. Taylor and G. A. Worth, Chem. Phys., 2018, 515, 719–727 CrossRef CAS.
- G. A. Worth and L. S. Cederbaum, Annu. Rev. Phys. Chem., 2004, 55, 127 CrossRef CAS.
- H. Köppel, W. Domcke and L. S. Cederbaum, Conical Intersections: Electronic Structure, Dynamics and Spectroscopy, 2004, ch. 7, pp. 323–367 Search PubMed.
- H. D. Meyer and G. A. Worth, Theor. Chem. Acc., 2003, 109, 251–267 Search PubMed.
- G. A. Worth, H.-D. Meyer and L. S. Cederbaum, Conical Intersections: Electronic Structure, Dynamics and Spectroscopy, 2004, ch. 14, pp. 583–612 Search PubMed.
- M. Schreiber, M. R. Silva-Junior, S. P. Sauer and W. Thiel, J. Chem. Phys., 2008, 128, 134110 CrossRef.
- V. Veryazov, P. A. Malmqvist and B. O. Roos, Int. J. Quantum Chem., 2011, 111, 3329–3338 CrossRef CAS.
- M. J. Frisch, G. W. Trucks, H. B. Schlegel, G. E. Scuseria, M. A. Robb, J. R. Cheeseman, G. Scalmani, V. Barone, G. A. Petersson, H. Nakatsuji, X. Li, M. Caricato, A. V. Marenich, J. Bloino, B. G. Janesko, R. Gomperts, B. Mennucci, H. P. Hratchian, J. V. Ortiz, A. F. Izmaylov, J. L. Sonnenberg, D. Williams-Young, F. Ding, F. Lipparini, F. Egidi, J. Goings, B. Peng, A. Petrone, T. Henderson, D. Ranasinghe, V. G. Zakrzewski, J. Gao, N. Rega, G. Zheng, W. Liang, M. Hada, M. Ehara, K. Toyota, R. Fukuda, J. Hasegawa, M. Ishida, T. Nakajima, Y. Honda, O. Kitao, H. Nakai, T. Vreven, K. Throssell, J. J. A. Montgomery, J. E. Peralta, F. Ogliaro, M. J. Bearpark, J. J. Heyd, E. N. Brothers, K. N. Kudin, V. N. Staroverov, T. A. Keith, R. Kobayashi, J. Normand, K. Raghavachari, A. P. Rendell, J. C. Burant, S. S. Iyengar, J. Tomasi, M. Cossi, J. M. Millam, M. Klene, C. Adamo, R. Cammi, J. W. Ochterski, R. L. Martin, K. Morokuma, O. Farkas, J. B. Foresman and D. J. Fox, Gaussian 16, Revision C.01, 2016 Search PubMed.
- Y. Shao, Z. Gan, E. Epifanovsky, A. T. Gilbert, M. Wormit, J. Kussmann, A. W. Lange, A. Behn, J. Deng, X. Feng, D. Ghosh, M. Goldey, P. R. Horn, L. D. Jacobson, I. Kaliman, R. Z. Khaliullin, T. Kuś, A. Landau, J. Liu, E. I. Proynov, Y. M. Rhee, R. M. Richard, M. A. Rohrdanz, R. P. Steele, E. J. Sundstrom, H. L. Woodcock, P. M. Zimmerman, D. Zuev, B. Albrecht, E. Alguire, B. Austin, G. J. Beran, Y. A. Bernard, E. Berquist, K. Brandhorst, K. B. Bravaya, S. T. Brown, D. Casanova, C. M. Chang, Y. Chen, S. H. Chien, K. D. Closser, D. L. Crittenden, M. Diedenhofen, R. A. Distasio, H. Do, A. D. Dutoi, R. G. Edgar, S. Fatehi, L. Fusti-Molnar, A. Ghysels, A. Golubeva-Zadorozhnaya, J. Gomes, M. W. Hanson-Heine, P. H. Harbach, A. W. Hauser, E. G. Hohenstein, Z. C. Holden, T. C. Jagau, H. Ji, B. Kaduk, K. Khistyaev, J. Kim, J. Kim, R. A. King, P. Klunzinger, D. Kosenkov, T. Kowalczyk, C. M. Krauter, K. U. Lao, A. D. Laurent, K. V. Lawler, S. V. Levchenko, C. Y. Lin, F. Liu, E. Livshits, R. C. Lochan, A. Luenser, P. Manohar, S. F. Manzer, S. P. Mao, N. Mardirossian, A. V. Marenich, S. A. Maurer, N. J. Mayhall, E. Neuscamman, C. M. Oana, R. Olivares-Amaya, D. P. Oneill, J. A. Parkhill, T. M. Perrine, R. Peverati, A. Prociuk, D. R. Rehn, E. Rosta, N. J. Russ, S. M. Sharada, S. Sharma, D. W. Small, A. Sodt, T. Stein, D. Stück, Y. C. Su, A. J. Thom, T. Tsuchimochi, V. Vanovschi, L. Vogt, O. Vydrov, T. Wang, M. A. Watson, J. Wenzel, A. White, C. F. Williams, J. Yang, S. Yeganeh, S. R. Yost, Z. Q. You, I. Y. Zhang, X. Zhang, Y. Zhao, B. R. Brooks, G. K. Chan, D. M. Chipman, C. J. Cramer, W. A. Goddard, M. S. Gordon, W. J. Hehre, A. Klamt, H. F. Schaefer, M. W. Schmidt, C. D. Sherrill, D. G. Truhlar, A. Warshel, X. Xu, A. Aspuru-Guzik, R. Baer, A. T. Bell, N. A. Besley, J. D. Chai, A. Dreuw, B. D. Dunietz, T. R. Furlani, S. R. Gwaltney, C. P. Hsu, Y. Jung, J. Kong, D. S. Lambrecht, W. Liang, C. Ochsenfeld, V. A. Rassolov, L. V. Slipchenko, J. E. Subotnik, T. Van Voorhis, J. M. Herbert, A. I. Krylov, P. M. Gill and M. Head-Gordon, Mol. Phys., 2015, 113, 184–215 CrossRef CAS.
- F. Aquilante, J. Autschbach, R. K. Carlson, L. F. Chibotaru, M. G. Delcey, L. De Vico, I. F. Galván, N. Ferré, L. M. Frutos, L. Gagliardi, M. Garavelli, A. Giussani, C. E. Hoyer, G. Li Manni, H. Lischka, D. Ma, P. Å. Malmqvist, T. Müller, A. Nenov, M. Olivucci, T. B. Pedersen, D. Peng, F. Plasser, B. Pritchard, M. Reiher, I. Rivalta, I. Schapiro, J. Segarra-Martí, M. Stenrup, D. G. Truhlar, L. Ungur, A. Valentini, S. Vancoillie, V. Veryazov, V. P. Vysotskiy, O. Weingart, F. Zapata and R. Lindh, J. Comput. Chem., 2016, 37, 506–541 CrossRef CAS.
- G. A. Worth, K. Giri, G. W. Richings, I. Burghardt, M. H. Beck, A. Jäckle and H.-D. Meyer, The Quantics Package, Version 1.1, 2015, https://www2.chem.ucl.ac.uk/quantics/ Search PubMed.
- G. A. Worth, Comput. Phys. Commun., 2020, 248, 107040 CrossRef.
Footnote |
| † Electronic supplementary information (ESI) available: Extended set of ab initio singlet and triplet electronic structure calculations; all 24 normal modes and fitted adiabatic potential energy surfaces; full list of linear and quadratic coupling constants; suggested peak assignment for the experimental second excitation band; source code for the quantics input and operator file. See DOI: 10.1039/d0cp04514d |
| This journal is © the Owner Societies 2020 |

