
 Open Access Article
 This Open Access Article is licensed under a
 Creative Commons Attribution 3.0 Unported Licence
Viscosity effects on optically generated electron and nuclear spin hyperpolarization†
Matthew W.
Dale
 a,
Daniel J.
Cheney
b,
Claudio
Vallotto
a and
Christopher J.
Wedge
*ab
a,
Daniel J.
Cheney
b,
Claudio
Vallotto
a and
Christopher J.
Wedge
*ab
aDepartment of Physics, University of Warwick, Gibbet Hill Road, Coventry, CV4 7AL, UK
bDepartment of Chemical Sciences, University of Huddersfield, Huddersfield, HD1 3DH, UK. E-mail: c.wedge@hud.ac.uk
First published on 8th December 2020
Abstract
Spin hyperpolarization can dramatically increase signal intensities in magnetic resonance experiments, providing either improved bulk sensitivity or additional spectroscopic detail through selective enhancements. While typical hyperpolarization approaches have utilized microwave irradiation, one emerging route is the use of optically generated triplet states. We report an investigation into the effects of solution viscosity on radical–triplet pair interactions, propose a new standard for quantification of the hyperpolarization in EPR experiments, and demonstrate a significant increase in the optically generated 1H NMR signal enhancement upon addition of glycerol to aqueous solutions.
Introduction
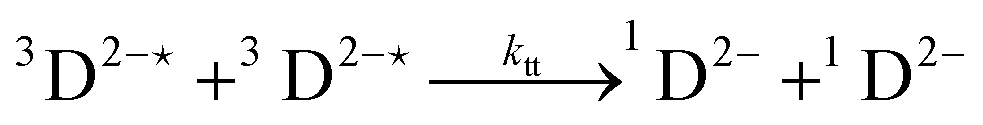
Nuclear magnetic resonance (NMR) and electron paramagnetic resonance (EPR) offer versatile probes of chemical information which are indispensable to the modern physical scientist. Nevertheless magnetic resonance methods are hampered by low intrinsic sensitivity arising from weak thermal Boltzmann polarization of the relevant nuclear or electronic spin energy levels.1 Population differences across the relevant spectroscopic transitions are therefore small, such that only a tiny fraction of the spins are actually observed, e.g. only 1 in 105 for 1H at 14.1 T (600 MHz NMR). A range of hyperpolarization methods, providing greater population differences and hence higher sensitivity than attainable with thermal spin systems, are now under investigation.1,2 We recently demonstrated that photochemically generated electronic hyperpolarization can be transferred to nuclei to enhance sensitivity in solution-state NMR,3 a method we refer to as optical DNP (dynamic nuclear polarization). Here we examine how optical generation of hyperpolarization in the electron spin-system can be maximised through changes to the solution environment, achieving an increased optical NMR enhancement and providing insights relevant to direct use of electronic hyperpolarization in EPR spectroscopy.4–8Optically generated triplet states often have a large initial electron spin polarization which has been utilized directly in both EPR and NMR studies.9 In the solid-state application of triplet polarization to enhance sensitivity in EPR distance measurements using pulsed dipolar spectroscopy have recently attracted significant interest,10–13 whereas in NMR impressive enhancements have been observed for matrix nuclei but are much reduced upon transfer to a solution-state substrate.14,15 In solution although some triplet states can still be relatively long-lived they undergo rapid spin relaxation, hence their EPR spectra are not normally observed and direct exploitation of their initial polarization is difficult. It is however possible for state mixing in the encounter pair formed by a radical and unpolarized triplet to lead to electronic hyperpolarization of a radical.16 The distinguishing feature of this radical triplet pair mechanism (RTPM)17 as compared to other spin chemical mechanisms generating hyperpolarized electron spin states, such as the radical pair, relaxation and triplet mechanisms,9,18 is that hyperpolarization can be generated on a persistent rather than transient radical species. The RTPM therefore has great potential to provide hyperpolarization that can be utilized more generally for sensitivity enhancement, without the complication of radical reaction or decay.
In the RTPM photoexcitation of a suitable dye molecule followed by rapid intersystem crossing generates an excited triplet state which undergoes collisional encounters with a stable doublet radical. During these encounters the energy levels of the combined radical–triplet pair are best described as quartet and doublet states, which are separated by the electron exchange interaction (J), Fig. 1. The doublet levels are rapidly depopulated by spin-allowed transitions to the ground state of the dye molecule making the radical an efficient triplet quencher by the so-called enhanced intersystem crossing (EISC) mechanism.19 Due to spin-state mixing driven by the zero-field splitting of the triplet molecule this process results in generation of net polarization of the radical, which is emissive in the case of a positive exchange interaction.18
 | ||
| Fig. 1 Schematic energy level diagram of a radical and dye molecule. (i) At large separations the spin states of the two molecules are independent. Shortly after photoexcitation triplet sub-levels (T+,T0,T−) of the dye are equally populated with only a small Boltzmann polarization difference (not visible) of the radical levels (α and β). (ii) Upon diffusive encounter the resultant radical–triplet complex occupies exchange split quartet and doublet states. Spin-allowed quenching by the process known as enhanced intersystem crossing (EISC) selectively depopulates the doublet states to produce radical–singlet pair character (iii). Finally the pair separates, with passage through the level anti-crossing (LAC) region resulting in generation of emissive electron spin polarization of the radical (iv), with overpopulation of the |T+α〉 and |T0α〉 states.18 The diagram assumes a constant applied magnetic field resulting in equal Zeeman splitting of the radical and triplet energy levels (gR ≈ gT ≈ 2). | ||
The majority of early studies of the RTPM focussed on polyaromatic triplet sensitizers in organic solvents, but recently the electron spin polarization efficiency of the RTPM was investigated for a range of xanthene dyes and nitroxide radicals in aqueous solution.20 Not only is generation of hyperpolarization in aqueous solution essential to applications in biological systems, but unusually large electronic polarizations were observed in these systems; in the case of Rose Bengal and 2,2,6,6-tetramethylpiperidine-1-oxyl (TEMPO) the net electron spin polarization (Pnet) generated by each radical triplet encounter was reported to be −150 times the thermal electron spin polarization (Peq).20 This large polarization was attributed to slow rotational and translational diffusion of the dianionic Rose Bengal molecule at the neutral pH used. Having already demonstrated transfer of this large electronic hyperpolarization to nuclei,3 in the present study the scope to further enhance the polarization level through increasing the solvent viscosity is considered, and the effects on both hyperpolarized EPR and NMR spectra are reported.
Experimental
All experiments reported were carried out at room temperature (∼295 K). Key experimental details are given below with further information available in the ESI.†EPR spectroscopy
Pulsed and continuous-wave (CW) EPR spectra were recorded using a Bruker Elexsys E580 spectrometer with a dielectric resonator (Bruker EN 4118X-MD4). All pulsed EPR experiments were echo detected using a standard 90°–τ–180°–τ–echo sequence, with τ = 120 ns and the receiver protection time reduced to 230 ns in order to allow detection of the fast relaxing nitroxide radicals. Relaxation time T1e was measured using an inversion recovery sequence. Due to the high dielectric loss of the aqueous solvent mixture the sample volume was reduced by using 1.1 mm inner diameter quartz EPR tubes (Wilmad WG221).Samples were illuminated in the EPR resonator using a frequency-doubled Nd:YAG (Continuum Surelite SLI-20 Hz) whose beam diameter of 6 mm filled the optical window of the resonator. For synchronisation with the microwave pulse sequence the laser was operated in DAT mode with a fixed Q-switch delay set using a digital delay generator (Quantum Composer QC9512) triggered by the EPR spectrometer. Adjustment of laser power was achieved using a Glan-laser polarizer and half-wave plate (Thorlabs GL10A and WPMH05M-532) in rotation mounts. Laser power levels were checked using a volume absorbing head (Gentec UP19K-15S-VR).
NMR spectroscopy
NMR spectra were recorded using the radiofrequency coil of a Bruker X-band ENDOR resonator (EN 4118X-MD4) which was tuned to 14.6 MHz and matched using an external circuit (Bruker H132224). Data were acquired using a Bruker Avance spectrometer, and the external magnetic field of 0.342 T was supplied by a 10′′ EPR electromagnet (Bruker ER 073) with 12 kW power supply. Considerations of field stability and homogeneity when using this arrangement with a resistive magnet have been discussed previously, along with the construction of our 1 mm internal diameter quartz flow cell.3 The spectra recorded are unreferenced, with chemical shift reported relative to the H2O solvent peak.Samples were illuminated using a diode-pumped solid-state laser at 532 nm (MGL-F-532-2W), gated by an optical shutter (Lasermet LS-10) controlled by a TTL pulse from the NMR console. A pair of N-BK7 lenses were used to expand the beam diameter before a multi-order half-wave plate in rotation mount and polarizing beamsplitter (Thorlabs WPMH05M-532 and CCM1-PBS251/M) used to adjust laser power. This was measured using a surface absorbing thermal sensor (Thorlabs S310C). A cylindrical lens was used to fill the optical window of the resonator.
Sample flow
In order to avoid photodegradation of samples both EPR and NMR measurements were performed using a flow system operating at 10 μl min−1 driven by a syringe pump (Legato 110). Deoxygenation was achieved by bubbling dry nitrogen gas through the sample contained in a gas tight glass syringe (SGE 50MR-LL-GT) for 20 min prior to the experiment. To prevent oxygen ingress during the experiment and also reduce laser induced sample heating, nitrogen gas flowed through an outer jacket around the PTFE sample tubing as described previously.3Results and discussion
Time-resolved EPR data
The time-evolution of electron spin-polarization was monitored by pulsed EPR spectroscopy by altering the delay between the triplet generating laser pulse and an electron spin echo sequence. Compared to direct transient EPR detection (continuous microwaves with no field modulation)21 this delay after flash experiment has the benefit of detecting the thermal magnetization (S0), thereby allowing quantification of the spin-polarization effect. A similar approach with detection of the free-induction decay has been used before,20 but we found the echo detection experiment to be preferable owing to compatibility with a 4-step phase cycle which removes artefacts arising from the effect of the laser pulse on the EPR resonator. Data obtained for a range of volume fractions of glycerol are shown in Fig. 2a, from which it can be seen that the peak magnetization reaches nearly 13 times the thermal equilibrium signal.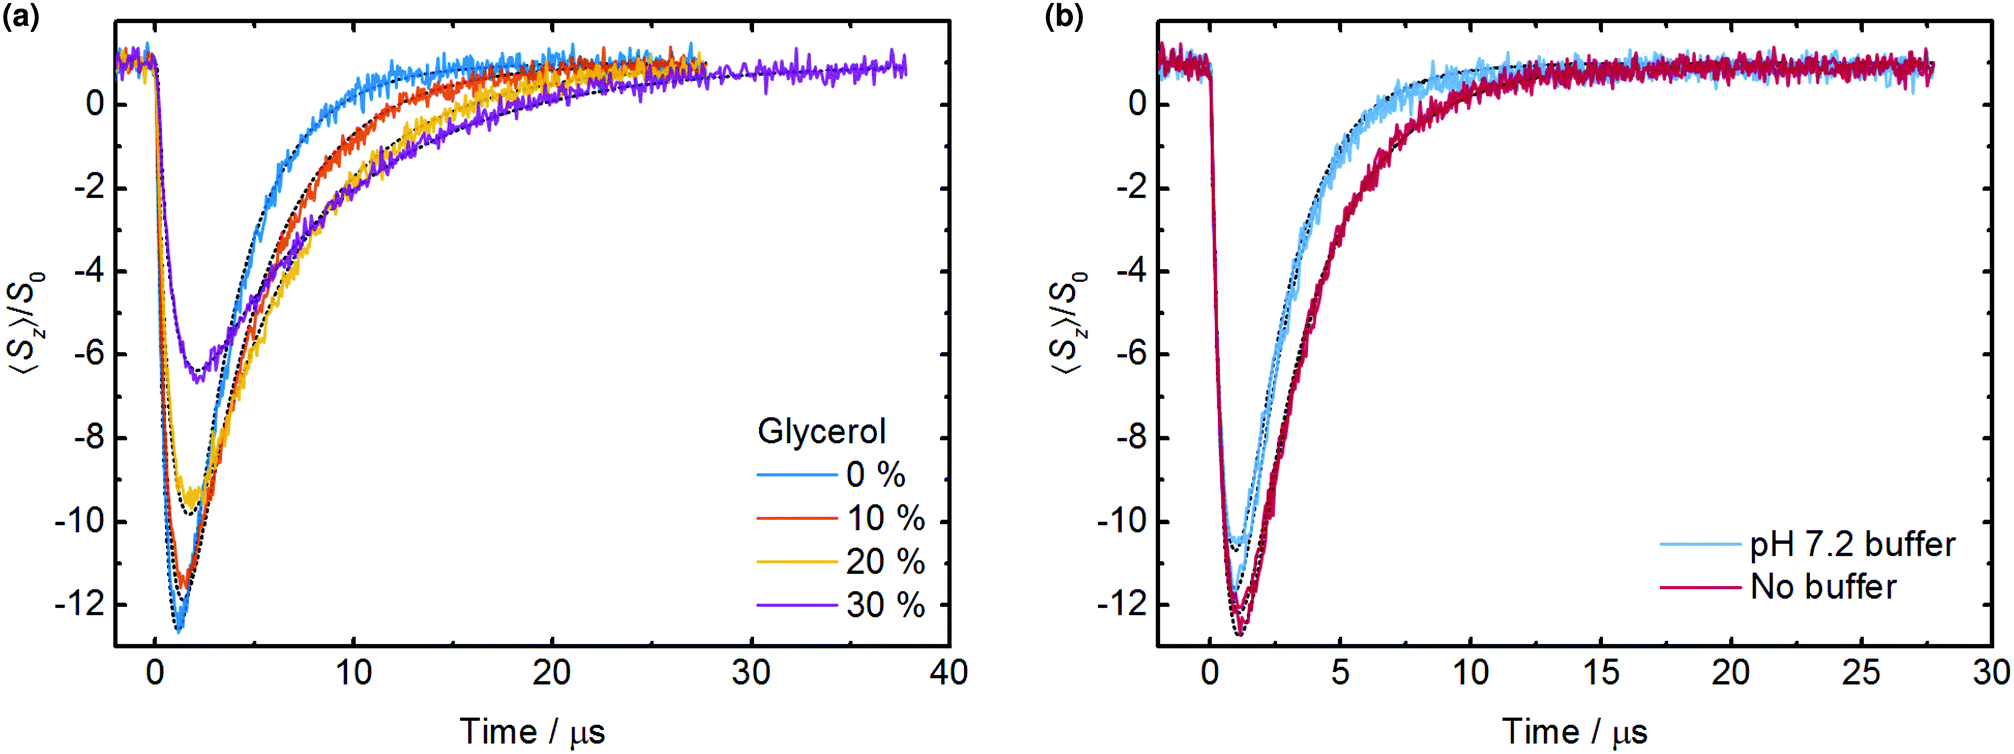 | ||
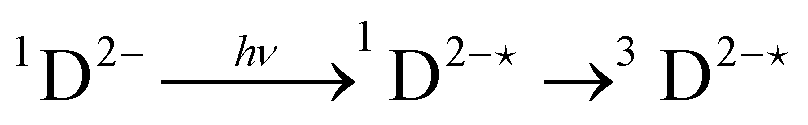
| Fig. 2 Delay after flash EPR experiments for (a) solutions with varying amounts of glycerol in the solvent with percentage by volume as indicated (unbuffered) and (b) water solutions with and without pH 7.2 phosphate buffer (two replicates of each condition). Sample composition 0.2 mM Rose Bengal, 0.2 mM TEMPO, deoxygenated by N2 bubbling; illumination 6 mJ per pulse at 532 nm. Dashed lines are fits to the data. As described in the text, triplet concentration was determined based on the buffered solution for which Pnet/Peq = −150 has been reported,20 and was held constant in the other fits to permit the relative value of Pnet/Peq to be determined. The uncertainty in the determined fit parameters is provided in the main text and Table 1. | ||
All triplets may be considered to form instantaneously on the EPR timescale as intersystem crossing from the singlet to triplet excited state of the dye takes places on a picosecond timescale, and the laser pulse width of approximately 5 ns is comparable to normal microwave EPR pulse widths. The peak emissive signal intensity is reached rapidly as the triplets are quenched by radicals which become spin-polarized, followed by a slower decay to thermal equilibrium governed by electron spin lattice relaxation (timescale T1e). Addition of glycerol notably alters the time profile, lowering the peak magnetization obtained but also significantly extending the lifetime of the polarization.
Molecular oxygen as a ground state triplet is an effective quencher of the triplet state of the dye molecule, competing with quenching by the nitroxide radicals. As shown in Fig. S1a (ESI†) the removal of oxygen from the sample therefore significantly increases the peak magnitude of the magnetization detected. The decay kinetics are also slower in the deoxygenated case as a result of (i) an increase in the effective triplet lifetime 1/kd and (ii) an increase in the electronic relaxation time T1e of approximately 50% in the absence of the Heisenberg exchange contribution from dissolved oxygen (values in ESI†). Sample deoxygenation by nitrogen bubbling was therefore carried out in all cases as described in the Experimental section. This is in contrast to previous work on the Rose Bengal/TEMPO system, and along with the fact that we chose not to use a pH buffer (see below), results in a larger and longer lived magnetization in Fig. 2a than reported in ref. 20.
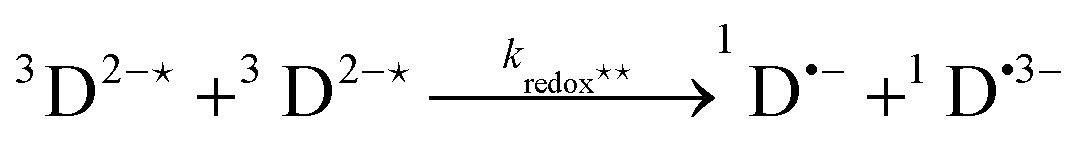
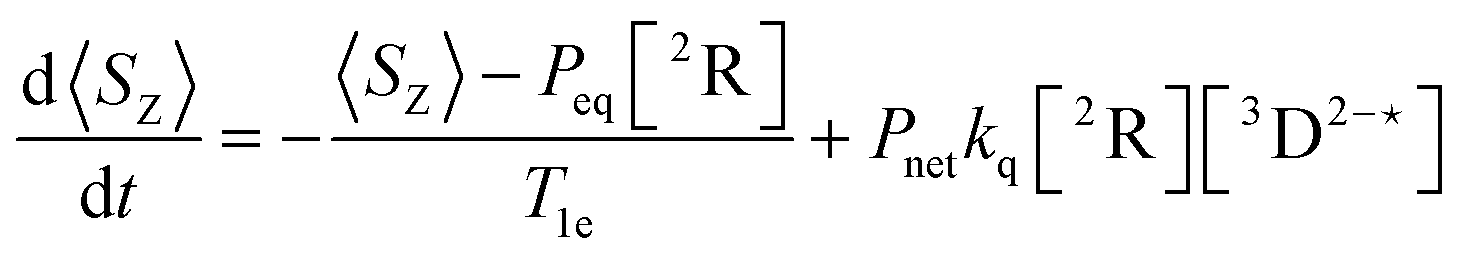
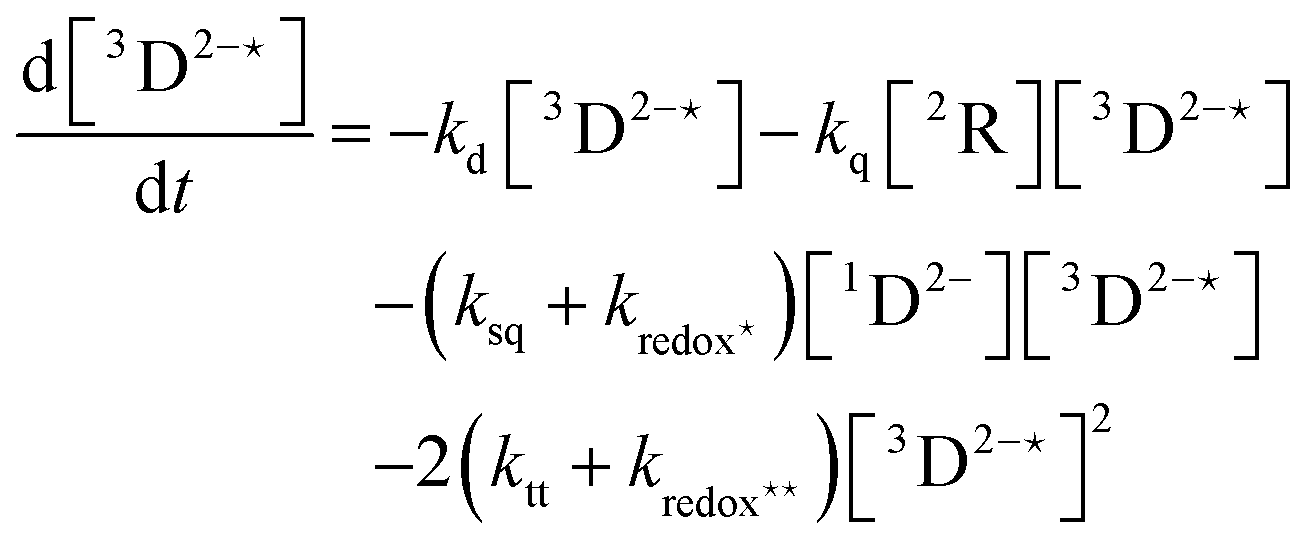
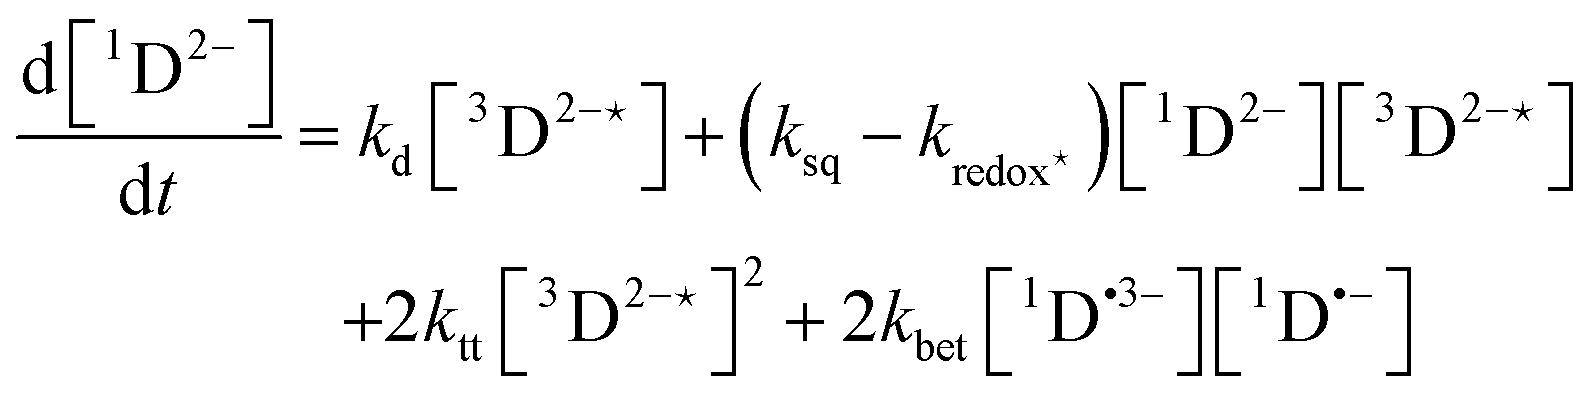
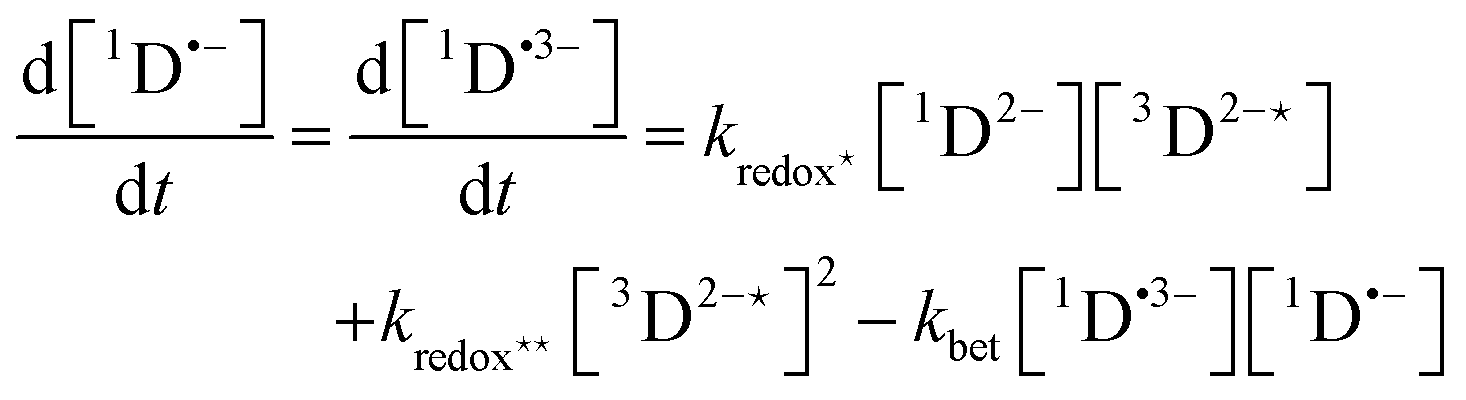
In order to extract information on the efficiency of generation of electron spin-polarization the time evolution of the magnetization may be modelled using a kinetic approach based on the Bloch equations.20,22,23 While previous work used a simple kinetic scheme we have found that excellent agreement between simulations and experiment can be obtained by using a more detailed photochemical reaction scheme arising from a recent comprehensive study of the photochemistry of Rose Bengal in water.24 The full scheme is as follows:
 | (1) |
 | (2) |
 | (3) |
 | (4) |
 | (5) |
 | (6) |
 | (7) |
 | (8) |
 | (9) |
 | (10) |
 | (11) |
 | (12) |
 | (13) |
The time-profile of the magnetization 〈SZ(t)〉 was simulated by numerically solving eqn (10)–(13) to produce a fit to the experimental data. For standard aqueous solutions the kinetic parameters relating to Rose Bengal were taken from ref. 24 and the electron spin–lattice relaxation rate T1e was measured using an inversion recovery pulse sequence (Table 1). With this information the MATLAB25 solver ode45 was used to compute the EPR time profiles, with variable parameters as described below determined by using the lsqcurvefit routine to minimise the sum of squares deviation between the simulated and experimental transients. The kinetic parameters used are given in Table S1 (ESI†).
| Volume fraction glycerol/% | P net (relative) | Max. seff | T 1e/ns |
|---|---|---|---|
| 0 | 1.92 | 13.6 | 620 ± 20 |
| 10 | 2.4 ± 0.2 | 12.9 | 670 ± 10 |
| 20 | 2.29 ± 0.09 | 10.8 | 745 ± 3 |
| 30 | 1.92 ± 0.04 | 7.4 | 807 ± 2 |
If the initial triplet concentration generated by the laser pulse is known the only remaining variable parameter in fitting the experimental data is the polarization ratio Pnet/Peq. It is theoretically possible to calculate triplet concentrations using the laser illumination intensity, extinction coefficient of the dye and quantum yield of triplet formation. A global fit across multiple illumination intensities ought then to produce a unique value for the polarization ratio,20 however incomplete and non-uniform illumination of the total sample volume contributing to the EPR signal complicates this approach, and calculated triplet concentrations are prone to errors arising from slight variations in laser focus and unquantified optical losses such as refraction from the curved surface of the capillary sample tube. To avoid these difficulties and as the polarization ratio for the Rose Bengal/TEMPO system has already been determined for an aqueous solution to be Pnet/Peq = −150 (ref. 20), this value was taken as a fixed reference and all polarization values are given relative to this system. Delay after flash EPR data for the Rose Bengal/TEMPO system in aqueous solution with the same pH 7.2 phosphate buffer as in this previous work were recorded in duplicate and fitted with the triplet concentration as the sole variable parameter (Fig. 2b), providing a convenient way to determine the initial Rose Bengal triplet concentration as 0.143 ± 0.005 mM in our experimental arrangement with 532 nm illumination at 6 mJ per pulse. When the experiment was repeated under identical conditions but without pH buffer the polarization was longer lived. A fit to this data can only be obtained by reducing the radical quenching rate kq from 1.7 × 10⁹ M−1 s−1 to (8.9 ± 0.3) × 108 M−1 s−1, which holding the previously determined triplet concentration constant requires that Pnet/Peq = −287.6 ± 0.1, an increase of 1.92 times relative to the same sample in a buffered solution. The work described below was therefore carried out using deoxygenated aqueous solutions without pH buffer. The origin of the buffer effect remains unknown but is not thought to be a simple pH effect, the nitrogen bubbled solutions being at close to neutral pH (see ESI†); investigations into pH effects in these samples are ongoing and will be reported elsewhere.
Data were collected for laser pulse energies from 1 to 6 mJ. In order to fit these time profiles while holding all other parameters constant a non-linear variation in triplet concentration with laser pulse energy was necessary. This implies a non-linear scaling of triplet concentration with photon flux, which may be rationalised by considering the known tendency of Rose Bengal to form intermolecular aggregates at concentrations above 1 μM.26,27
Measurements across the same range of laser powers were repeated for each of the solvent mixtures containing added glycerol, without adjusting the laser alignment. The 6 mJ per pulse data are shown in Fig. 2a, with full laser power dependent data sets in Fig. S2 (ESI†). As noted above addition of glycerol to the aqueous solvent leads to a reduction in the peak magnetization and a lengthening of the magnetization decay profile. The prolonged magnetization is a result of a substantial increase of the electron spin–lattice relaxation time with glycerol addition (Table 1). Spin relaxation mechanisms in nitroxides have been studied extensively by Eaton and Eaton, and found to have contributions from spin rotation, modulation of the large g-factor and hyperfine anisotropies of the nitroxide, and a thermally activated process.28,29 Slower spin relaxation in glycerol containing solutions (up to 69% added glycerol) was previously shown to arise from an increase in the tumbling correlation time of the radical, which affects both the spin rotation and modulation of g- and hyperfine anisotropies.29 While the reproducibility of solid-state DNP studies has been reported to be affected by polymorphism of water–glycerol solutions upon freezing to below 150 K,30 to our knowledge there are no reports of polymorphism influencing relaxation properties at ambient temperatures. As our measurements are carried out exclusively at room temperature (∼295 K), over 100 K above the glass transition temperature of the water–glycerol mixtures used and in a composition region not subject to reported liquid–liquid transitions,31 polymorphism is not expected to affect our study. We also note that any clustering of radicals in the water–glycerol mixtures would increase the relaxation rate (T1e)−1 of the radicals in the glycerol containing solutions, which is the opposite behaviour to that we observe.
Increasing the volume fraction of glycerol also affects the triplet lifetime by a reduction in the rate of radical quenching kq and other bimolecular decay processes arising from slower diffusion in the more viscous media. The initial polarization generation from the Rose Bengal triplet therefore occurs over a longer timescale, permitting electron spin relaxation to begin to contribute such that the peak magnetization obtained is reduced. Fits to the data in Fig. S2b–d (ESI†) are obtained assuming the initial triplet concentration for each laser power to be invariant upon addition of glycerol, and using the increased values of T1e measured by inversion recovery. The reduction in the rates of the reaction steps are accounted for by scaling the relevant rate constants by the ratio of viscosities (Table S1, ESI†). In this way excellent fits to the data are obtained with the only free parameter being the polarization ratio Pnet/Peq. The magnitude of the polarization shows a moderate increase upon addition of small amounts of glycerol but at 30% glycerol by volume is identical within error to the sample without glycerol (Table 1), although the peak polarization is lower and polarization lifetime significantly extended. This illustrates the inadequacy of the polarization ratio in isolation for comparison of the polarization characteristics of different systems.
The increase in Pnet with addition of 10% glycerol is in line with earlier experimental results for the 1-chloronaphthalene (1CN)/TEMPO system for which the increase in net polarization with solvent viscosity upon cooling has been extensively studied.32–34 This effect has been related to reduced translational diffusion, enabling the radical–triplet pair to spend more time in the crossing region of the quartet and doublet states. This has led to attempts to increase polarization by chemically linking the dye and radical to further restrict motion.35 The unusually large dynamic electron polarization of the xanthene dyes has also been attributed to the slow diffusional motion of the strongly hydrated dianionic dye molecules, and slow rotational diffusion highlighted as critical to polarization generation to prevent rotational averaging of the anisotropic zero-field splitting interaction that drives state mixing.20
Analytical expressions relating Pnet to the relative diffusion coefficient Dr have been derived for the weak and strong exchange limits,34 with the strong-exchange result Pnet ∝ 1/Dr when Dr → 0 applicable to xanthene/nitroxide systems at X-band.20 Deviations from this simple linear relationship between Pnet and viscosity have previously been observed for 1CN/TEMPO in highly viscous media (η > 20 mPa s). Kobori et al. were able to model the observed viscosity dependence numerically and attributed the deviation to neglected back transitions during slow passage through the level-crossing region.33 Shushin revised the earlier analytical expressions to account for Kobori's data resulting in a simple expression of the form Pnet ∝ 1/(constant + Dr).36 This cannot reproduce the present result of decreasing polarization in the more viscous mixtures, which in fact exhibit Dr values of 2.1 to 6.2 × 10⁻¹⁰ m2 s−1, spanning the linear dependence range of the earlier work. Shushin's analytical expression has been used to calculate the polarization efficiency of a range of dye and radical systems in benzene and water solutions, but we note experimentally observed variations in Pnet between Rose Bengal and Erythrosine-B or between different radicals with Eosin-Y (which we also see in the Rose Bengal case, Fig. S1b, ESI†) were not reproduced.20 At present the range of chemical systems studied experimentally is rather limited with further investigations needed to test the validity of the existing theory and determine the reasons for numerous discrepancies when treating xanthene dyes. Such work is beyond the scope of the present study, so having identified that glycerol addition can alter the magnitude and timescale of electron spin-polarization in the Rose Bengal/TEMPO system we now move on to consider the resultant effects on the optically generated nuclear hyperpolarization arising from cross-relaxation of the electron–nuclear spin system.
Nuclear polarization
The 1H NMR signals of the solvent mixtures described above were measured at 14.6 MHz in the presence and absence of illumination from a 532 nm continuous-wave laser. The nuclear hyperpolarization generated was quantified in the conventional way by the enhancement factor ε = (〈IZ〉 − I0)/I0 where 〈IZ〉 is the expectation value of the nuclear polarization with optical pumping and I0 the thermal equilibrium nuclear polarization in the abscence of optical pumping. As shown in Fig. 3a the addition of even 10% glycerol by volume is associated with a significant increase in the NMR enhancement over the pure water (0% glycerol) case. In fact for a fully protonated solvent mixture with 20% added glycerol (Fig. 3b) the enhancement of −6.4 ± 0.4 exceeds the largest previously reported enhancement of −3.6 ± 0.6 for a deuterated solvent mixture (80% D2O/20% H2O by volume) with optimized concentrations of 0.2 mM Rose Bengal and 1.0 mM TEMPO.3 | ||
| Fig. 3 Optically generated enhancement in NMR signal intensity with varying glycerol concentration. (a) Optimization of illumination power for 10 s continuous illumination. (b) NMR spectra recorded in the presence and absence of illumination (4.0 s at 2.0 W) for aqueous solvent with or without added glycerol. (c) Optimization of illumination time for 2.0 W illumination. (d) Variation in enhancement with glycerol content for 4.0 s illumination at powers as indicated. All samples 0.2 mM Rose Bengal and 1.0 mM TEMPO, deoxygenated by nitrogen bubbling and illuminated at 532 nm. As discussed in the text with 2.0 W illumination data for samples containing 30% glycerol were unreliable, hence these points are omitted in (a) and (d) and no data for this mixture appears in (c). The illumination time dependence for all mixtures with 1.0 W illumination can be found in Fig. S3 (ESI†). | ||
An upgraded optical system permitted preliminary investigation into optimal illumination conditions. Whereas our earlier study with a relatively divergent 520 nm laser diode source was power limited,3Fig. 3a shows that with a collimated 532 nm laser the NMR enhancement of glycerol containing solutions drops for powers over 1.0 W. Given sample flow is used to reduce photodegradation this is likely due to heating effects and shorter illumination periods were therefore trialled to reduce the heating duty cycle. As shown in Fig. 3c the enhancement achieved is increased further by using a higher laser power of 2.0 W gated to 4 s of illumination immediately prior to the NMR acquisition which was repeated at a fixed rate of 0.1 Hz. It can be seen that even for 2 s illumination (20% duty cycle) a significant enhancement is achieved, and such conditions will significantly reduce the likelihood for sample heating and potentially permit recovery of a reversibly photobleached sample. Data for lower illumination power (1.0 W) also showed significant enhancement with reduced duty cycle, and signs of a plateau for longer illumination times (Fig. S3, ESI†). The scope for maintaining enhancements using a pulsed laser to produce much lower duty cycle trains of pulses has been discussed elsewhere and remains a target for future experimental investigation.23
As noted elsewhere the build-up time for the optical enhancement is expected to be governed by the nuclear relaxation time T1n,23,37 values for which are given in Table 2. While one might therefore expect maximal polarization to be achieved with illumination for ∼5T1n, corresponding to 3.5–7.0 s in the present case, illumination longer than 4 s reduced the enhancement obtained. This is likely the result of unwanted heating effects when using a high power illumination source, similar to observations of Liu et al. who noted polarization build up at twice the expected rate.37 Laser induced heating was particularly problematic in the most viscous solvent mixture when using the highest illumination power of 2.0 W, with data showing poor reproducibility under these conditions. For this reason only data recorded with illumination powers of up to 1.5 W are presented for samples containing 30% glycerol by volume.
| Volume fraction glycerol/% | T 01n/s | T 1n/s | f | ξ |
|---|---|---|---|---|
| 0 | 2.59 ± 0.05 | 1.39 ± 0.05 | 0.46 ± 0.02 | 0.37 |
| 10 | 2.11 ± 0.06 | 1.19 ± 0.03 | 0.44 ± 0.02 | 0.34 |
| 20 | 1.72 ± 0.05 | 0.96 ± 0.02 | 0.44 ± 0.02 | 0.30 |
| 30 | 1.13 ± 0.04 | 0.70 ± 0.01 | 0.38 ± 0.01 | 0.24 |
To rationalize the variation in NMR enhancement with addition of glycerol, Fig. 3d, it is necessary to introduce the Overhauser formula:38
 | (14) |
Before considering the change in electronic hyperpolarization with glycerol addition the effect on the other parameters in eqn (14) must be accounted for. The leakage factor f = 1 − T1n/T01n, where the superscript indicates the relaxation time in the absence of radical, was obtained from 1H NMR inversion recovery data. Both the nuclear relaxation time and leakage factor decrease upon addition of glycerol (Table 2). The coupling factor is also expected to decrease with increasing viscosity, being strongly dependent on the tumbling rate of the molecules. Using the force free hard sphere (FFHS) approximation introduced by Hwang and Freed39 it is possible to calculate the spectral density and hence coupling factor, from the correlation time τc of the radical.40,41 While the Han group use this approach to determine local water dynamics from enhancement values in microwave-driven Overhauser DNP,41 here we estimate the variation in coupling factor upon glycerol addition (Table 2) by using literature values of the closest approach distance and diffusion constants for the radical and water molecules,40,41 and scaling these according to the changing solution viscosity. Details of the spectral density function used and discussion of this choice are provided elsewhere.23
Considering the leakage and coupling factors both reduce on addition of glycerol it is clear that the increased NMR enhancement must arise from a significantly increased saturation factor. By rearranging eqn (14) we determined the effective saturation factor in optical DNP experiments (Fig. 4a). With 1.0 W illumination the saturation factor increases across the series as the glycerol content is increased, implying that the maximal enhancements recorded in the 20% glycerol case arise from the interplay of increasing saturation factor with the decreasing leakage and coupling factors. A similar compromise between saturation and leakage factors was previously recognised as determining optimal radical concentrations for the optical DNP method.3
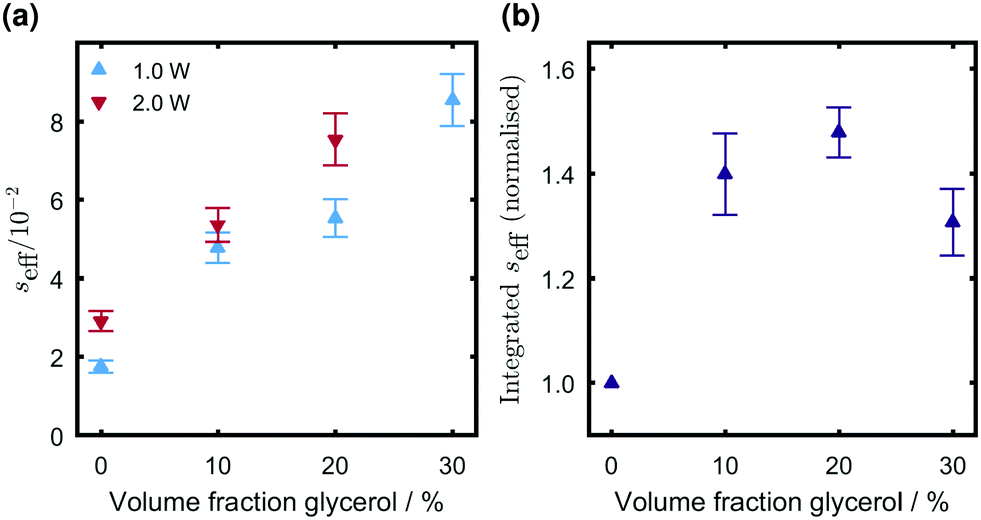 | ||
| Fig. 4 Variation in seff calculated from (a) optical DNP experiments (4 s illumination period at power as indicated, 1.0 mM TEMPO) and (b) through direct time domain integration of the electronic magnetization in pulsed EPR experiments (6 mJ per pulse, 0.2 mM TEMPO). All samples contain 0.2 mM Rose Bengal and were deoxygenated by nitrogen bubbling prior to measurement. | ||
Looking at the absolute value of the saturation factor in all cases seff < 0.1, with only a small increase upon doubling the illumination power from 1.0 W to 2.0 W, hence the optical DNP method does not yet compete with microwave driven methods for which seff ∼ 1 has been achieved.42–45 Further optimization of the polarizing system is therefore required, for which it will be useful to quantify the extent of electronic hyperpolarization achieved in different systems. It is notable that the saturation factor for 1.0 W illumination is higher in the 30% glycerol case than in the absence of added glycerol, despite the relative electronic polarization per quenching event Pnet being within experimental uncertainty identical for these two volume fractions (Table 1). An alternative measure of the efficiency of optical polarization is therefore needed.
Quantifying electronic polarization
In light of the difficulties discussed above in determining the polarization per quenching event Pnet and the fact that alone this value cannot provide the trend in saturation factors under continuous illumination conditions relevant to optical DNP, we consider alternative measures of RTPM efficiency. Ideally these should be readily assessed by consideration of directly measurable parameters rather than relying on accurate knowledge of numerous kinetic parameters and quantum yield values. The electronic magnetization 〈SZ〉 may be determined unambiguously and seff(t) calculated by reference to the thermal magnetization S0 in pulsed EPR experiments, assuming care is taken to remove any instrumental baseline by an appropriate phase cycling (echo detection) or field jumping (FID detection) procedure. This value is directly dependent upon excitation conditions meaning a common standard is required (e.g. the Rose Bengal/TEMPO system used as a reference here) for comparisons between measurements using different experimental arrangements. The maximum achievable value directly indicates the signal enhancement that may be achieved if utilizing electronic hyperpolarization to boost EPR sensitivity, but the peak magnetization (max. seff, Table 1) decreases as glycerol is added to the system whereas the saturation factor relevant to polarization transfer to generate nuclear hyperpolarization has been shown to increase (Fig. 4a). This is as a result of increased persistence time of the electronic magnetization, hence for transfer to nuclei it would be useful to derive a measure of electronic polarization that takes longevity of polarization into account.The time integral of seff obtained from delay after flash EPR measurements is shown in Fig. 4b as a function of glycerol content. The value of this integral increases with the volume fraction of glycerol because although the peak magnetization progressively decreases, the polarization is also becoming longer lived. In this case the qualitative trend appears to mirror that in seff obtained from optical DNP measurements (Fig. 4a), though there is a discrepancy for the highest glycerol content. The approximation that the viscous solvent mixtures can be treated according to a single bulk diffusion constant in calculating the coupling factor and hence optical DNP saturation factor is a potential source of this discrepancy, and it should be recalled that for this volume fraction the polarization Pnet deviated from predicted trends. A quantitative correspondence between the saturation factors obtained from optical DNP and pulsed EPR studies has not yet been established and these measurements necessarily correspond to different illumination conditions and radical concentrations. It is, however, proposed that as a directly measurable quantity that reflects a combination of both the magnitude and persistence timescale of RTPM generated electronic hyperpolarization, the time-integrated electronic magnetization is a parameter that should be considered in the search for optimal polarization systems for the future implementation of the optical DNP method.
Future directions
The ultimate goal of the optical DNP method must be to increase the NMR sensitivity for a substrate of interest rather than the solvent, by which we mean increase for that substrate the signal-to-noise per unit square root of time compared to an optimized non-DNP NMR experiment.46 This should be achieved at a sufficiently high magnetic field to provide good chemical shift resolution, typically accepted as a minimum of 14.1 T for biomolecular NMR applications. The challenge for the optical DNP method is that both the coupling factor (ξ) for dipolar coupled protons, and magnitude of the RTPM generated electronic polarization (|Pnet/Peq|), are expected to decrease at higher magnetic fields. Our results for the viscosity dependence of Pnet already call in to question the validity of existing numerical models of the RTPM so experimental verification of the predicted magnetic field dependence is warranted, but it is a reasonable hypothesis that efficiency will decrease at higher magnetic fields where the Zeeman splitting of the radical–triplet pair becomes comparable to the exchange interaction.19 In this weak exchange limit the LAC region is shifted to separations of less than the van der Waals contact distance making the region inaccessible (Fig. 1). This could be circumvented by polarizing the nuclei at a lower magnetic field before shuttling to a higher field for measurement, an approach already applied to overcome the reduction of coupling factor in microwave pumped Overhauser DNP; a system shuttling from 0.34 T to 14.09 T was able to demonstrate DNP enhancements of up to −2.4 on L-tryptophan by microwave pumping a deuterated 15N nitroxide radical in aqueous solution.45 This provides confidence that polarization transfer to solutes can be achieved and unfavourable magnetic field dependencies can be overcome. Given the saturation factor was close to one in this study, the result is close to the theoretical limit for the maximum achievable enhancement in the microwave pumping case (−7.9 when the magnetic field ratio is considered) limited only by a coupling factor estimated as 0.23–0.27 and leakage factor of 0.89. The overall enhancement could be significantly increased if the shuttle approach can be replicated with optical pumping to give an effective saturation factor exceeding one. Another notable feature of this shuttle study is that global enhancement factors of up to −4.2 were also reported, these global values accounting for radical induced line broadening and differences in the repetition rate of optimal NMR and DNP experiments,47 to show that shuttle DNP offers a genuine improvement over a non-DNP experiment.To increase the effective saturation factor in optical DNP the electronic polarization step must be optimized. Reliance on diffusive encounters between the dye and radical was already identified as a limiting factor, leading the saturation factor to be maximised at low radical concentrations that give a sub-optimal leakage factor.3 This may be alleviated by linked dye–radical systems, with development of such polarizers targeted at improved liquid-state optical DNP performance already underway.35,48,49 As we have shown such efforts should consider not only the magnitude of the electronic polarization generated but also the persistence timescale of this polarization, as this significantly impacts upon the electronic saturation factor achieved under DNP conditions. At present a ten-fold increase in the saturation factor is needed to allow optical pumping to match the theoretical enhancement limit of microwave driven Overhauser DNP, provided the leakage and coupling factors can be simultaneously maximised to ensure efficient transfer of the optically generated electronic polarization to nuclei. The coupling factor for any new system requires direct measurement as has been demonstrated using the pulsed electron–electron double resonance (ELDOR) method for the fullerene-nitroxide polarizing agents developed by Bennati and co-workers, although ultimately the optical polarization in these systems was low.37,44 To simultaneously optimize all of these requirements in a single photo-stable system is undeniably challenging, but reflecting on the significant advances made in rational design of bi-radical polarizing agents for solid-state DNP illustrates what might be achieved through concerted synthetic, spectroscopic and theoretical efforts.50
Conclusions
We have demonstrated the effect of added glycerol on the dynamic electron and nuclear polarization generated by photoexcitation of Rose Bengal/TEMPO, a water soluble system reported to demonstrate one of the largest known RTPM hyperpolarization efficiencies. By optimizing solvent viscosity the magnitude of the nuclear polarization has been increased to nearly six times thermal levels, the highest enhancement yet reported for the burgeoning liquid-state optical-DNP method. This is despite a reduction in the peak electronic magnetization and is attributed to an increase in the effective electronic saturation factor under continuous illumination due to slower electronic relaxation. The electronic polarization generated per triplet quenching event, the conventional measure of RTPM efficiency, is difficult to determine unambiguously and is insufficient to fully describe the changing behaviour of the system upon glycerol addition. We therefore propose time averaged electronic magnetization is adopted as a means of quantifying RTPM efficiency for nuclear polarization applications. While the complexity of the phenomenon and various competing factors prevent rational design of improved dye–radical systems, this metric should form a key part of systematic experimental screening of candidates.37Conflicts of interest
There are no conflicts of interest to declare.Acknowledgements
We thank the Engineering and Physical Sciences Research Council (EPSRC) for financial support (EP/N007875/1, EP/J500045/1), and Bruker UK Ltd for an equipment loan. CJW thanks the UoW Department of Physics for startup funds enabling the purchase of the pulsed laser source used in this work, and Prof. Christopher Kay for helpful discussions.References
- J.-H. Ardenkjaer-Larsen, G. S. Boebinger, A. Comment, S. Duckett, A. S. Edison, F. Engelke, C. Griesinger, R. G. Griffin, C. Hilty, H. Maeda, G. Parigi, T. Prisner, E. Ravera, J. van Bentum, S. Vega, A. Webb, C. Luchinat, H. Schwalbe and L. Frydman, Angew. Chem., Int. Ed., 2015, 54, 9162–9185 CrossRef CAS.
- J. van Bentum, B. van Meerten, M. Sharma and A. Kentgens, J. Magn. Reson., 2016, 264, 59–67 CrossRef CAS.
- M. W. Dale and C. J. Wedge, Chem. Commun., 2016, 52, 13221–13224 RSC.
- C. Corvaja, E. Sartori, A. Toffoletti, F. Formaggio, M. Crisma and C. Toniolo, Biopolymers, 2000, 55, 486–495 CrossRef CAS.
- C. Corvaja, E. Sartori, A. Toffoletti, F. Formaggio, M. Crisma, C. Toniolo, J.-P. Mazaleyrat and M. Wakselman, Chem. – Eur. J., 2000, 6, 2775–2782 CrossRef CAS.
- E. Sartori, A. Toffoletti, F. Rastrelli, C. Corvaja, A. Bettio, F. Formaggio, S. Oancea and C. Toniolo, J. Phys. Chem. A, 2003, 107, 6905–6912 CrossRef CAS.
- A. Kawai, S. Mori, K. Tsuji and K. Shibuya, Appl. Magn. Reson., 2010, 38, 205–216 CrossRef CAS.
- A. Agostini, D. M. Palm, H. Paulsen and D. Carbonera, J. Phys. Chem. Lett., 2018, 9, 672–676 CrossRef CAS.
- D. J. Cheney and C. J. Wedge, Electron Paramagn. Reson., 2019, 26, 89–129 CAS.
- M. Di Valentin, M. Albertini, E. Zurlo, M. Gobbo and D. Carbonera, J. Am. Chem. Soc., 2014, 136, 6582–6585 CrossRef CAS.
- M. Di Valentin, M. Albertini, M. G. Dal Farra, E. Zurlo, L. Orian, A. Polimeno, M. Gobbo and D. Carbonera, Chem. – Eur. J., 2016, 22, 17204–17214 CrossRef CAS.
- M. G. Dal Farra, S. Ciuti, M. Gobbo, D. Carbonera and M. Di Valentin, Mol. Phys., 2018, 117, 2673–2687 CrossRef.
- M. G. Dal Farra, S. Richert, C. Martin, C. Larminie, M. Gobbo, E. Bergantino, C. R. Timmel, A. M. Bowen and M. Di Valentin, ChemPhysChem, 2019, 20, 931–935 CrossRef CAS.
- K. Tateishi, M. Negoro, S. Nishida, A. Kagawa, Y. Morita and M. Kitagawa, Proc. Natl. Acad. Sci. U. S. A., 2014, 111, 7527–7530 CrossRef CAS.
- M. Negoro, A. Kagawa, K. Tateishi, Y. Tanaka, T. Yuasa, K. Takahashi and M. Kitagawa, J. Phys. Chem. A, 2018, 122, 4294–4297 CrossRef CAS.
- A. Blank and H. Levanon, J. Phys. Chem. A, 2001, 105, 4799–4807 CrossRef CAS.
- C. Blättler, F. Jent and H. Paul, Chem. Phys. Lett., 1990, 166, 375–380 CrossRef.
- M. D. E. Forbes, L. E. Jarocha, S. Sim and V. F. Tarasov, Adv. Phys. Org. Chem., 2013, 47, 1–83 CrossRef CAS.
- A. Kawai and K. Shibuya, J. Photochem. Photobiol., C, 2006, 7, 89–103 CrossRef CAS.
- H. Takahashi, M. Iwama, N. Akai, K. Shibuya and A. Kawai, Mol. Phys., 2014, 112, 1012–1020 CrossRef CAS.
- S. S. Kim and S. I. Weissman, Rev. Chem. Intermed., 1979, 3, 107–120 CrossRef CAS.
- G. H. Goudsmit, H. Paul and A. I. Shushin, J. Phys. Chem., 1993, 97, 13243–13249 CrossRef CAS.
- D. J. Cheney and C. J. Wedge, J. Chem. Phys., 2020, 152, 034202 CrossRef CAS.
- L. Ludvíková, P. Friš, D. Heger, P. Šebej, J. Wirz and P. Klán, Phys. Chem. Chem. Phys., 2016, 18, 16266–16273 RSC.
- MATLAB. 9.2.0.556344 (R2017a), The Mathworks Inc., Natick, Massachusetts, 2017.
- D. C. Neckers, J. Photochem. Photobiol., A, 1989, 47, 1–29 CrossRef CAS.
- A. W.-H. Mau, O. Johansen and W. H. F. Sasse, Photochem. Photobiol., 1985, 41, 503–509 CrossRef CAS.
- R. Owenius, G. E. Terry, M. J. Williams, S. S. Eaton and G. R. Eaton, J. Phys. Chem. B, 2004, 108, 9475–9481 CrossRef CAS.
- J. R. Biller, H. Elajaili, V. Meyer, G. M. Rosen, S. S. Eaton and G. R. Eaton, J. Magn. Reson., 2013, 236, 47–56 CrossRef CAS.
- A. Leavesley, C. B. Wilson, M. Sherwin and S. Han, Phys. Chem. Chem. Phys., 2018, 20, 9897–9903 RSC.
- K. Murata and H. Tanaka, Nat. Mater., 2012, 11, 436–443 CrossRef CAS.
- A. Kawai and K. Obi, J. Phys. Chem., 1992, 96, 5701–5704 CrossRef CAS.
- Y. Kobori, K. Takeda, K. Tsuji, A. Kawai and K. Obi, J. Phys. Chem. A, 1998, 102, 5160–5170 CrossRef CAS.
- A. I. Shushin, J. Chem. Phys., 1993, 99, 8723–8732 CrossRef CAS.
- V. Rane and R. Das, J. Phys. Chem. A, 2015, 119, 5515–5523 CrossRef CAS.
- A. I. Shushin, J. Phys. Chem. A, 2014, 118, 11355–11363 CrossRef CAS.
- G. Liu, S.-H. Liou, N. Enkin, I. Tkach and M. Bennati, Phys. Chem. Chem. Phys., 2017, 19, 31823–31829 RSC.
- K. H. Hausser and D. Stehlik, Adv. Magn. Reson., 1968, 3, 79–139 CAS.
- L. Hwang and J. H. Freed, J. Chem. Phys., 1975, 63, 118–130 CrossRef CAS.
- P. J. M. van Bentum, G. H. A. van der Heijden, J. A. Villanueva-Garibay and A. P. M. Kentgens, Phys. Chem. Chem. Phys., 2011, 13, 17831–17840 RSC.
- J. M. Franck, A. Pavlova, J. A. Scott and S. Han, Prog. Nucl. Magn. Reson. Spectrosc., 2013, 74, 33–56 CrossRef CAS.
- M.-T. Türke and M. Bennati, Phys. Chem. Chem. Phys., 2011, 13, 3630–3633 RSC.
- N. Enkin, G. Liu, I. Tkach and M. Bennati, Phys. Chem. Chem. Phys., 2014, 16, 8795–8800 RSC.
- N. Enkin, G. Liu, M. del Carmen Gimenez-Lopez, K. Porfyrakis, I. Tkach and M. Bennati, Phys. Chem. Chem. Phys., 2015, 17, 11144–11149 RSC.
- P. Lottmann, T. Marquardsen, A. Krahn, A. Tavernier, P. Höfer, M. Bennati, F. Engelke and C. Griesinger, Appl. Magn. Reson., 2012, 43, 207–221 CrossRef CAS.
- D. Lee, S. Hediger and G. De Paëpe, Solid State Nucl. Magn. Reson., 2015, 66-67, 6–20 CrossRef CAS.
- V. Vitzthum, F. Borcard, S. Jannin, M. Morin, P. Miéville, M. A. Caporini, A. Sienkiewicz, S. Gerber-Lemaire and G. Bodenhausen, ChemPhysChem, 2011, 12, 2929–2932 CrossRef CAS.
- A. K. Tripathi, V. Rane, S. Kundu and R. Das, J. Chem. Phys., 2019, 151, 154305 CrossRef.
- A. Tripathi and V. Rane, J. Phys. Chem. B, 2019, 123, 6830–6841 CrossRef CAS.
- D. J. Kubicki, G. Casano, M. Schwarzwälder, S. Abel, C. Sauvée, K. Ganesan, M. Yulikov, A. J. Rossini, G. Jeschke, C. Copéret, A. Lesage, P. Tordo, O. Ouari and L. Emsley, Chem. Sci., 2016, 7, 550–558 RSC.
Footnote |
| † Electronic supplementary information (ESI) available: Further experimental details, simulation parameters and additional data. See DOI: 10.1039/d0cp04012f |
| This journal is © the Owner Societies 2020 |