
 Open Access Article
 This Open Access Article is licensed under a
 Creative Commons Attribution 3.0 Unported Licence
The reaction of oleic acid monolayers with gas-phase ozone at the air water interface: the effect of sub-phase viscosity, and inert secondary components†
Martin D.
King
 *a,
Stephanie H.
Jones
ab,
Claire O. M.
Lucas
a,
Katherine C.
Thompson
c,
Adrian R.
Rennie
d,
Andrew D.
Ward
b,
Amelia A.
Marks
a,
Fleur N.
Fisher
a,
Christian
Pfrang
e,
Arwel V.
Hughes
f and
Richard A.
Campbell
gh
*a,
Stephanie H.
Jones
ab,
Claire O. M.
Lucas
a,
Katherine C.
Thompson
c,
Adrian R.
Rennie
d,
Andrew D.
Ward
b,
Amelia A.
Marks
a,
Fleur N.
Fisher
a,
Christian
Pfrang
e,
Arwel V.
Hughes
f and
Richard A.
Campbell
gh
aDepartment of Earth Sciences, Royal Holloway University of London, Egham, Surrey, UK. E-mail: m.king@rhul.ac.uk
bCentral Laser Facility, Research Complex at Harwell, Rutherford Appleton Laboratory, Harwell Innovation Campus, Chilton, Didcot, OX11 0FA, UK
cInstitute of Structural and Molecular Biology, Department of Biological Sciences, Birkbeck College London, Malet Street, Bloomsbury, London, WC1E 7HX, UK
dCentre for Neutron Scattering, Uppsala University, Box 516, 75120, Uppsala, Sweden
eSchool of Geography, Earth, and Environmental Sciences, University of Birmingham, Edgbaston, Birmingham B15 2TT, UK
fISIS Pulsed Neutron and Muon Source, Rutherford Appleton Laboratory, Harwell Innovation Campus, Chilton, Didcot, OX11 0FA, UK
gInstitut Laue-Langevin, 71 Avenue des Martyrs, 38000 Grenoble, F-38042 Grenoble Cedex 9, France
hDivision of Pharmacy and Optometry, University of Manchester, Manchester M13 9PT, UK
First published on 8th December 2020
Abstract
Organic films that form on atmospheric particulate matter change the optical and cloud condensation nucleation properties of the particulate matter and consequently have implications for modern climate and climate models. The organic films are subject to attack from gas-phase oxidants present in ambient air. Here we revisit in greater detail the oxidation of a monolayer of oleic acid by gas-phase ozone at the air–water interface as this provides a model system for the oxidation reactions that occur at the air–water interface of aqueous atmospheric aerosol. Experiments were performed on monolayers of oleic acid at the air–liquid interface at atmospherically relevant ozone concentrations to investigate if the viscosity of the sub-phase influences the rate of the reaction and to determine the effect of the presence of a second component within the monolayer, stearic acid, which is generally considered to be non-reactive towards ozone, on the reaction kinetics as determined by neutron reflectometry measurements. Atmospheric aerosol can be extremely viscous. The kinetics of the reaction were found to be independent of the viscosity of the sub-phase below the monolayer over a range of moderate viscosities,  , demonstrating no involvement of aqueous sub-phase oxidants in the rate determining step. The kinetics of oxidation of monolayers of pure oleic acid were found to depend on the surface coverage with different behaviour observed above and below a surface coverage of oleic acid of ∼1 × 10¹⁸ molecule m−2. Atmospheric aerosol are typically complex mixtures, and the presence of an additional compound in the monolayer that is inert to direct ozone oxidation, stearic acid, did not significantly change the reaction kinetics. It is demonstrated that oleic acid monolayers at the air–water interface do not leave any detectable material at the air–water interface, contradicting the previous work published in this journal which the authors now believe to be erroneous. The combined results presented here indicate that the kinetics, and thus the atmospheric chemical lifetime for unsaturated surface active materials at the air–water interface to loss by reaction with gas-phase ozone, can be considered to be independent of other materials present at either the air–water interface or in the aqueous sub-phase.
1 Introduction
The ozone initiated oxidation of a monolayer of oleic acid at the air–water interface, reaction (1), is an important model reaction for the atmospheric oxidation of organic matter at the interface of aqueous atmospheric aerosol.1–3CH3(CH2)7CH![[double bond, length as m-dash]](https://www.rsc.org/images/entities/char_e001.gif) CH(CH2)7CO2H + O3 → products CH(CH2)7CO2H + O3 → products | (1) |
Organic films on atmospheric particulate matter affect the optical and hygroscopic properties of the matter and consequently affect modern climate change.1,4 The oxidation of oleic acid, and other surface-active organic species, at the air–water interface has been reviewed by several authors5–9 and whilst there is general agreement about the kinetics of the process, there is a lack of information about the effect of the presence of other, non-reactive, organic species within the monolayer and the effect of the sub-phase composition. There is also some disagreement about the propensities for the reaction products to remain at the air–water interface after the reaction.2,3 Thus, reaction (1) was re-visited and the previous study3 greatly expanded to include experiments performed at lower ozone concentrations, more representative of the ambient environment and to probe whether the reaction is sensitive to: the viscosity of the aqueous sub-phase below the organic layer and the effect of dilution of the oleic acid at the air–water interface by the incorporation of a second organic compound, stearic acid, in the monolayer at the air–water interface, that is unreactive towards ozone. To resolve the question concerning the fate of the reaction products, newly synthesised oleic acid samples were obtained to determine if the sample used in previous work3 contained a significant impurity.
One purpose of this work is to assess whether the reaction of oleic acid at the air–water interface is retarded by an increase in the viscosity of the solution phase below the oleic acid. The oxidation of a monolayer of oleic acid at the air–water interface by gas-phase ozone can be broken into a multi-step process. The gas-phase ozone must first diffuse to the interface, be accommodated into the interface, in this case into the oleic acid layer, then diffuse to the reaction site that is the carbon–carbon double bond of the oleic acid, and react. The process with the longest characteristic time will be the rate-limiting step and thus control the lifetime of oleic acid owing to chemical oxidation by ozone at the air–water interface. However, reaction with ozone “from above” is not the only possible process.10,11 Ozone is very soluble in water12 and may dissolve in the sub-phase and then diffuse through the sub-phase to the oleic acid attacking the oleic acid “from below”10,11i.e. reaction of oleic acid monolayers at the air–water interface from ozone, in the aqueous phase may be important. To assess whether such a sub-phase mechanism was important in the study presented here a series of experiments were performed to measure the first-order decay of oleic acid at the air–aqueous solution interface as the viscosity of the aqueous solution was increased. As described by the Stokes–Einstein equation,13,14 and related alternatives to it,15–19 the diffusion coefficient for a solute in a solution is inversely related to the viscosity of the solution, in the case where the diffusing species is less than five times the size of the solution molecule the relationship is modified, but still the diffusion coefficient will vary inversely with viscosity to the power  .20 Thus, increasing the viscosity of the solution will hinder the diffusion of the ozone in the aqueous phase, and if the aqueous-phase diffusion is important, increasing the viscosity of the sub-phase will retard the overall rate of oxidation of the oleic acid film. The chemical used in the work described here, sodium perchlorate NaClO4 increases the solution viscosity and the ionic strength of the solution, as atmospheric aerosol may have large viscosities21–24 and ionic strengths.25,26 The organic film found on an atmospheric aerosol is a complex mixture of organic and inorganic chemicals and to better represent the chemistry occurring in the real atmosphere the reaction kinetics of oleic acid with ozone in the presence of other similarly surface-active chemicals must be considered. The work presented here investigates the reaction of oleic acid when present in a mixed oleic acid/stearic acid monolayer at the air–water interface. Stearic acid (CH3(CH2)16CO2H) is structurally very similar to oleic acid (CH3(CH2)7CHCH(CH2)7CO2H), but lacking a carbon–carbon double bond does not directly react with ozone. Thus the work presented here investigates the effect of the presence of an inert miscible reaction partner at the air–water interface.
2 Experimental
Monolayers of oleic acid or oleic/stearic acid mixtures were spread at the air–aqueous liquid interface and exposed to gas-phase ozone whilst the properties of the interfacial material were probed using neutron reflection.2.1 Neutron reflection
Specular neutron reflection can be used to probe the composition and potentially the thickness of a series of parallel thin layers normal to an interface. Excellent descriptions of the use of neutron reflection for the study of interfaces can be found elsewhere27,28 along with a recent review on the study of kinetic and dynamic processes at fluid interfaces.29 A full description of the neutron technique specific to the study presented here can be found in ref. 2. Neutron reflection measurements were made at the ISIS Pulsed Neutron and Muon source at the Rutherford Appleton Laboratory and at the Institut Laue-Langevin (ILL) in Grenoble. The SURF reflectometer30 was used at ISIS and the FIGARO reflectometer was used at the ILL.31 The SURF reflectometer has an incident neutron beam at 1.5° to the horizontal of the air–liquid interface whilst the FIGARO reflectometer operates at angles of 0.62° and 3.8°. The time of flight instrument illuminates with a range of neutron wavelengths, λ, to give the reflectivity as function of the momentum transfer, Q,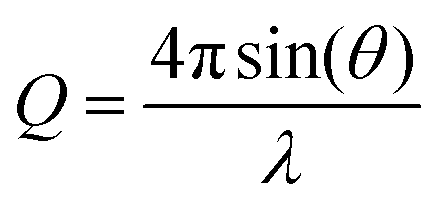 , over the Q range 0.06 to 0.5 Å−1. Reflectivity profiles (neutron reflectivity versus momentum transfer, Q) from all measurements were normalised to the intensity of the incident beam and absolute reflectivity profiles were obtained relative to a measurement of pure D2O.
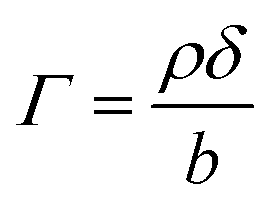
Modelled neutron reflectivity, R, versus neutron momentum transfer, Q, profiles were compared to experimental data to determine the scattering length density and thickness of the oleic acid or oleic and stearic acid layer using Abelès’ optical matrix method.32–35 A least-squares fitting procedure was used to compare the experimental reflectivity profile with a modelled neutron reflectivity profile by varying the values of the scattering length density, ρ, and a layer thickness, δ, to reproduce the experimental reflectivity profile. The surface excess, Γ, of known material at the air–water interface of a layer of thickness, δ, and scattering length density, ρ, is related to the coherent neutron scattering length, b by:
 | (2) |
 , where ρ0δ0 is the initial value of ρδ prior to addition of ozone and ρδ is the value at some time, t, later.
2.2 Materials
Previous work3 used a sample of perdeuterated oleic acid prepared in-house as a commercial sample of deuterated oleic acid was not available at the time. The deuterated oleic acid used in previous studies3 is referred to in this work as the old fully deuterated sample CD3(CD2)7CDCD(CD2)7CO2H. In this current work two new commercial samples were used, a sample of perdeuterated oleic acid, CD3(CD2)7CDCD(CD2)7CO2H obtained from Sigma Aldrich as a special synthesis at a stated isotopic purity of 98% and used without further purification, and a partially-deuterated oleic acid, CH3(CH2)7CHCD(CD2)7CO2H, synthesised by the Oxford Isotopes Service for this work and its purity confirmed by mass spectrometry. These fully and part deuterated oleic acids were used to test the mechanism of the oxidation of oleic acid at the air–water interface. According to the previous work3 the perdeuterated oleic would be expected to leave a deuterated product (consistent with deuterated nonanoic acid CD3(CD2)7CO2H) at the air–water interface. Mixed monolayers of fully deuterated oleic acid and undeuterated stearic acid, and undeuterated oleic acid and deuterated stearic acid, CD3(CD2)16CO2H, were prepared to investigate the influence of the unreactive stearic acid on the reaction kinetics. The oleic and stearic acids, both undeuterated and deuterated, for these experiments were procured from Sigma Aldrich and used without further purification, as was the sodium perchlorate and chloroform (stabilised with 1% ethanol). H2O was purified to a resistivity greater than 18 MΩ cm, D2O was supplied by ISIS and the ILL. Oxygen was technical grade BOC (ISIS) or Air Liquide (ILL) with a stated purity greater than 99%.
2.3 Generation of ozone and preparation of organic monolayers
The data described in the work presented here are the culmination of several experiments at ISIS and ILL using different troughs and gas containment around the troughs. A summary of experimental details is in the ESI.†A flow of gas-phase ozone in oxygen was generated by passing pure oxygen (1, 2 or 5 L min−1) through a quartz glass tube and photolysing the oxygen with a mercury pen-ray lamp in a commercial ozoniser from UVP Ltd. The concentration of ozone within the flow was controlled by shielding a known length of the pen-ray lamp and by switching the mercury pen-ray lamp on and off. The concentration of ozone was calibrated offline by UV-vis spectrometry using the absorption maxima36 around a wavelength of 254 nm. The flow was directed through perfluoroalkoxy (PFA) tubing either to a Tedlar bag or an aluminium box containing either a custom-made trough constructed from pure polytetrafluoroethylene (PTFE) or one of two different commercial Langmuir troughs (Nima). The maximum volume of the Tedlar bag was 20–25 L, but typically only inflated to 10 L, the free volume within the aluminium boxes was 30 L (ISIS) and 25 L (ILL) and the flow of oxygen was maintained throughout the experiment. The gas exhausted the bag or box via PFA tubing and was bubbled through aqueous potassium hydroxide solution and to a local exhaust vent. The mixing time in the bag was 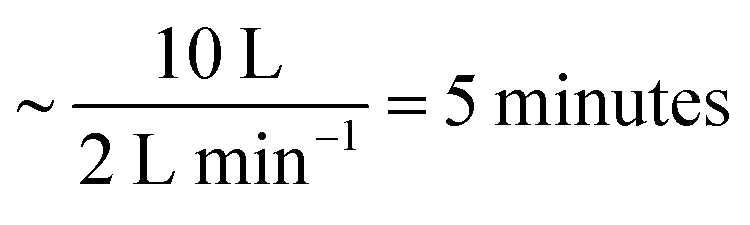 . Similar mixing times can be calculated for the aluminium boxes and are given in the table in the ESI.† The film of oleic acid or oleic/stearic acid mixture was placed at the air–water interface using a Hamilton syringe as a ∼1 mg mL−1 solution in chloroform. Approximately 20 μL, depending on the trough used, was added to the surface, giving an initial surface coverage of ∼2 × 10¹⁸ molecule m−2. Prior to the start of an experiment, the chloroform was allowed to evaporate and purged from the Tedlar bag or aluminium chamber by the oxygen flow. Two control experiments were performed: (1) monitoring the surface active species (oleic acid or mixture of oleic acid and stearic acid) at the air–liquid interface in a flow of oxygen only (no ozone) and (2) monitoring the air–water interface of the aqueous sodium perchlorate solution (or ACMW) in the absence of the organic film. Surface pressure of the interface was not routinely measured as the Wilhemy plate tensiometer may have been damaged by ozone and on the small trough the tensiometer would have blocked the neutron beam.
The viscosity of the aqueous sub-phase was increased by addition of sodium perchlorate (NaClO4). Sodium perchlorate is inert to ozone and dissolves readily, increasing the viscosity and the ionic strength, of the solution. The choice of the material used to increase viscosity was a compromise between it being unreactive to ozone and it making the least contribution to the scattering length density of the sub-phase. The concentrations used are shown in Table 2. The viscosities (relative to pure water) were calculated from values published in literature.37,38 The pH of the solutions (measured with pH paper owing to the presence of D2O as discussed in the literature39) decreased steadily as the concentration of ClO4− increased from 6.0 for the solution with no ClO4− to 4.5 for the solution with 9.0 M ClO4−.
Neutron reflectivity profiles (neutron reflectivity versus momentum transfer) were recorded continuously for reaction (1) at several different ozone concentrations. Unless explicitly stated the surface area of the Langmuir trough remained constant throughout the kinetic run. However, at the smallest ozone concentrations studied unusual behaviour was noted in the decay of the film at surface coverages of ∼1 × 10¹⁸ molecule m−2 of oleic acid. The behaviour was confirmed by recompressing the film (reducing the trough area and increasing the surface coverage) and observing the behaviour again. The re-compressions were typically at a barrier speed of 50 cm2 min−1.
A small series of experiments were conducted investigating the oxidation of oleic acid by ozone when the oleic acid was present within a monolayer film mixed with stearic acid. By using either deuterated oleic acid with undeuterated stearic acid or undeuterated oleic acid with deuterated stearic acid, the deuterated acid may be specifically followed during reaction as the majority of the neutron reflection signal (∼99%) is due to the deuterated component, as evidenced by the neutron scattering lengths in Table 1. Stearic and oleic acids are miscible in monolayers,40,41 but deviate from ideal mixing40,41 at surface pressures of ∼25–30 mN m−1 and above,40 where oleic acid is “squeezed out” into oleic acid lenses. Thus, all experiments described here were performed below these surface pressures, at a constant temperature of 20 ± 1 °C, with the barrier of the Langmuir trough held stationary, i.e. the trough area was held constant during the reaction. The sub-phase under the monolayer was air-contrast matched water, ACMW. Spreading solutions with mole fractions of deuterated stearic acid of 1, 0.75, 0.5 and 0.25 were used with the remaining fraction consisting of non-deuterated oleic acid and mole fractions of deuterated oleic acid of 0.75, 0.5 and 0.25 were used with the remaining part consisting of non-deuterated stearic acid.
| Compound | Formula | Relative molar mass/g mol−1 | Mass density/g cm−3 | Scattering length density (ρ)/Å−2 | Scattering length (b)/fm |
|---|---|---|---|---|---|
| Oleic acid | CH3(CH2)7CHCH(CH2)7CO2H |
282.47 | 0.894 | 0.0799 × 10⁻⁶ | 4.1 |
| D-Oleic acid | CD3(CD2)7CDCD(CD2)7CO2H |
315.67 | 1.000 | 6.96 × 10⁻⁶ | 347.7 |
| Partial D-oleic acid | CD3(CD2)7CDCH(CH2)7CO2H |
300.58 | 0.952 | 3.65 × 10⁻⁶ | 191.6 |
| Stearic acid | CH3(CH2)16CO2H | 284.48 | 0.941 | −0.0662 × 10⁻⁶ | −3.3 |
| D-Stearic acid | CD3(CD2)16CO2H | 318.69 | 1.057 | 7.19 × 10⁻⁶ | 361.1 |
| [ClO4−]/mol dm−3 |
|
Ionic strength/mol dm−3 |
|---|---|---|
| 9.0 | 7.20 | 9.0 |
| 8.1 | 5.04 | 8.1 |
| 7.2 | 3.69 | 7.2 |
| 6.3 | 2.78 | 6.3 |
| 5.4 | 2.16 | 5.4 |
| 3.6 | 1.43 | 3.6 |
| 2.7 | 1.25 | 2.7 |
| 1.8 | 1.12 | 1.8 |
| 0.8 | 1.03 | 0.8 |
| 0.0 | 1.00 | 0.0 |
2.4 Kinetic analysis
King et al.3 studied the kinetic decay of oleic acid at the air–water interface using neutron reflection and determined bimolecular rate constants for reaction (1). In the work presented here it is not the aim to repeat the determination of the value of the bimolecular rate constant but to investigate whether the temporal decay of the surface coverage of oleic acid with ozone is different with increasing viscosity of the sub-phase, ozone concentration and in the presence of stearic acid. The decay of versus reaction time is plotted for each experiment at a different sub-phase viscosity, ozone concentration and mole fraction of stearic acid. The pseudo first-order rate constant from these temporal decays is plotted versus the concentration of ozone within the organic layer to form a second-order plot as before.3
2.5 Characteristic times
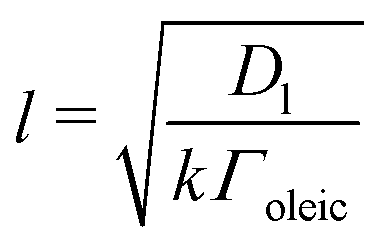
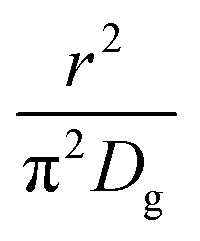
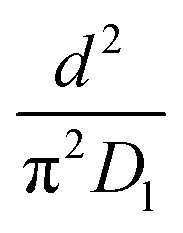
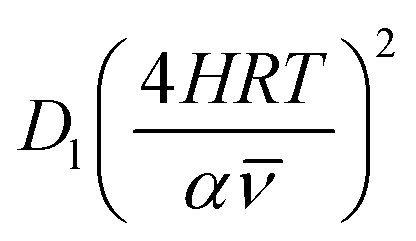
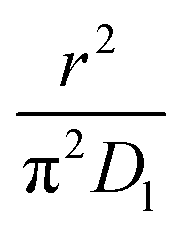
As highlighted in the introduction the characteristic times for transport and reaction of ozone can be used to estimate the rate limiting step. The calculations are contained in Table 3. Lee et al.44 report that the reactive-diffusive length offers a simple estimate of how immiscible surface layers can alter the oxidative lifetimes of the aerosol in the atmosphere. The reaction and slow diffusion of ozone within surface layers of an aerosol particle may prevent oxidation of reactive species within the core of the aerosol particle,45 and the oxidation lifetime with respect to oleic acid may reach a few hours if embedded within the core of the aerosol particle.46 Inspection of Table 3 shows that the gas-phase diffusion, interfacial equilibration and accommodation of ozone are all fast processes and effectively instantaneous on the timescale of the remaining processes. Examination of the characteristic time for reaction and diffusion of ozone (and the diffuso-reactive length) with and through the 20 Å film demonstrates that a significant portion of the ozone molecules may diffuse through the film to the aqueous sub-phase without reaction with the oleic acid.![[small nu, Greek, macron]](https://www.rsc.org/images/entities/i_char_e0ce.gif) is 470 m s−1 the rate coefficient for reaction (1), k, is 7.3 × 10⁻¹¹ cm2 molecule−1 s−1,3 a typical surface coverage of oleic acid was taken as 2 × 10¹⁸ molecule m−2, a typical diffusion distance, r, is taken as 20 Å, the approximate thickness, d of the oleic acid film, the diffusion coefficient of ozone in the gas-phase, Dg, is 1.76 × 10⁻⁵ m2 s−1.14 A Henry's law coefficient, H, for ozone with an organic liquid is 480 mol m−3 atm−1.47,48 The gas constant, R, of 8.205 × 10⁻⁵ m3 atm K−1 mol−1. The temperature, T, is 298 K. The ozone mixing time was calculated in a chamber of volume, V, with a flow rate of, f
is 470 m s−1 the rate coefficient for reaction (1), k, is 7.3 × 10⁻¹¹ cm2 molecule−1 s−1,3 a typical surface coverage of oleic acid was taken as 2 × 10¹⁸ molecule m−2, a typical diffusion distance, r, is taken as 20 Å, the approximate thickness, d of the oleic acid film, the diffusion coefficient of ozone in the gas-phase, Dg, is 1.76 × 10⁻⁵ m2 s−1.14 A Henry's law coefficient, H, for ozone with an organic liquid is 480 mol m−3 atm−1.47,48 The gas constant, R, of 8.205 × 10⁻⁵ m3 atm K−1 mol−1. The temperature, T, is 298 K. The ozone mixing time was calculated in a chamber of volume, V, with a flow rate of, f
| Quantity | Estimate | Characteristic dimension |
|---|---|---|
| Ozone mixing time |
|
∼300 s |
| Diffuso-reactive length in film |
|
350 nm |
| Gas-phase diffusion of ozone |
|
∼20 fs |
| Interfacial equilibrium |
|
∼0.3 ns |
| Accommodation |
|
∼10 ns |
| Liquid-phase diffusion of ozone through the oleic acid film |
|
0.4 ns |
| Liquid-phase diffusion of ozone through the water at a distance of 0.01 mm |

|
6 ms |
| Reaction |
|
∼7 ns |
3 Results
3.1 Characterisation of the deuterated oleic acid samples
The neutron reflectivity profiles of the old and new perdeuterated oleic acid samples and the part deuterated sample spread at the air–water interface to give a surface pressure of 19 mN m−1 were recorded over Q ranges of either 0.006 to 0.05 Å−1, or 0.006 to 0.3 Å−1 and compared to modelled neutron reflectivity profiles using an Abelès optical matrix method32–35 (Section 2.1) by varying scattering length density and layer thickness. A combined two layer fit to three contrasts (perdeuterated sample on ACMW, part-deuterated sample on ACMW and part-deuterated sample on D2O) measured for the new samples of oleic acid was performed and the results are shown in Fig. 1. The fitted thicknesses obtained are ∼8 Å and ∼6 Å, with scattering length densities of 6.97 × 10⁻⁶ Å−2 for both layers for the fully deuterated samples and −0.37 × 10⁻⁶ Å−2 and 6.97 × 10⁻⁶ Å−2 for the partially deuterated acid sample. For comparison, the data for the old perdeuterated sample is also shown in Fig. 1, it can be seen that although the reflectivity profile for the old perdeuterated sample is similar to that of the new perdeuterated sample it is not identical, and as will be argued in Section 4.1 the most likely explanation is that the old oleic acid sample was contaminated.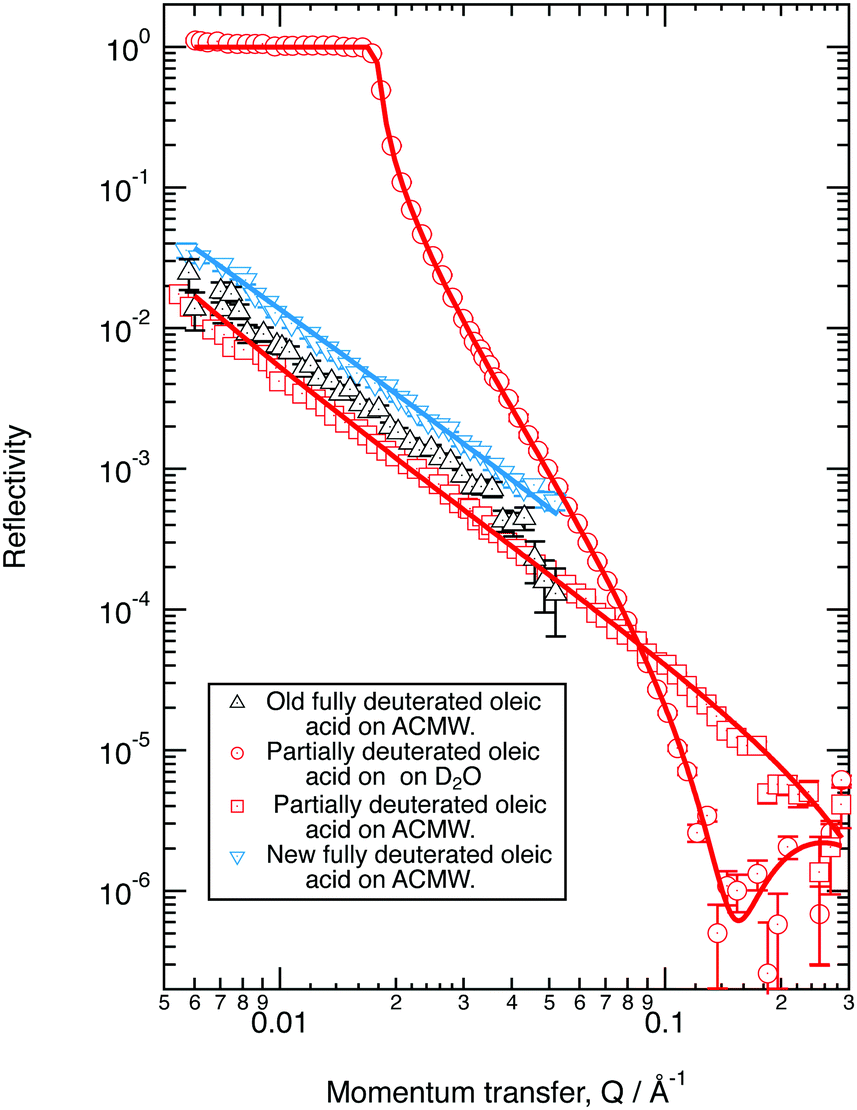 | ||
| Fig. 1 Neutron reflectivity plot for different samples of deuterated oleic acid (old fully deuterated oleic acid sample – black, commercial new fully deuterated oleic acid sample – blue and partially deuterated oleic – red) at the air–water interface at a surface pressure of 19 mN m−1. Experiment results (points) reproduced (solid lines) with a two layer model, thicknesses ∼8 Å and ∼6 Å, with scattering length densities of 6.97 × 10⁻⁶ Å−2 for the new fully deuterated samples and −0.37 × 10⁻⁶ Å−2 and 6.97 × 10⁻⁶ Å−2 for the partially deuterated sample. Note ACMW is Air Contrast Matched Water described in Section 2.1. | ||
Ozone is produced in a bath gas of oxygen. The loss of oleic acid by reaction with molecular oxygen is insignificant on the timescale of the experiment as shown previously.3,49Fig. 2 demonstrates that the new fully deuterated oleic acid is stable at the air–water interface in the absence of ozone and in the presence of molecular oxygen (unfilled squares with uncertainty bars) no loss of deuterated material occurs from the air–water interface on the timescale of the experiment. It can also be seen in Fig. 2, and later in Fig. 3 and 4, that, contrary to our previous work,3 the reaction of monolayers of the new fully deuterated sample of oleic acid with ozone at the air–liquid interface did not leave a significant amount of deuterated material at the interface.
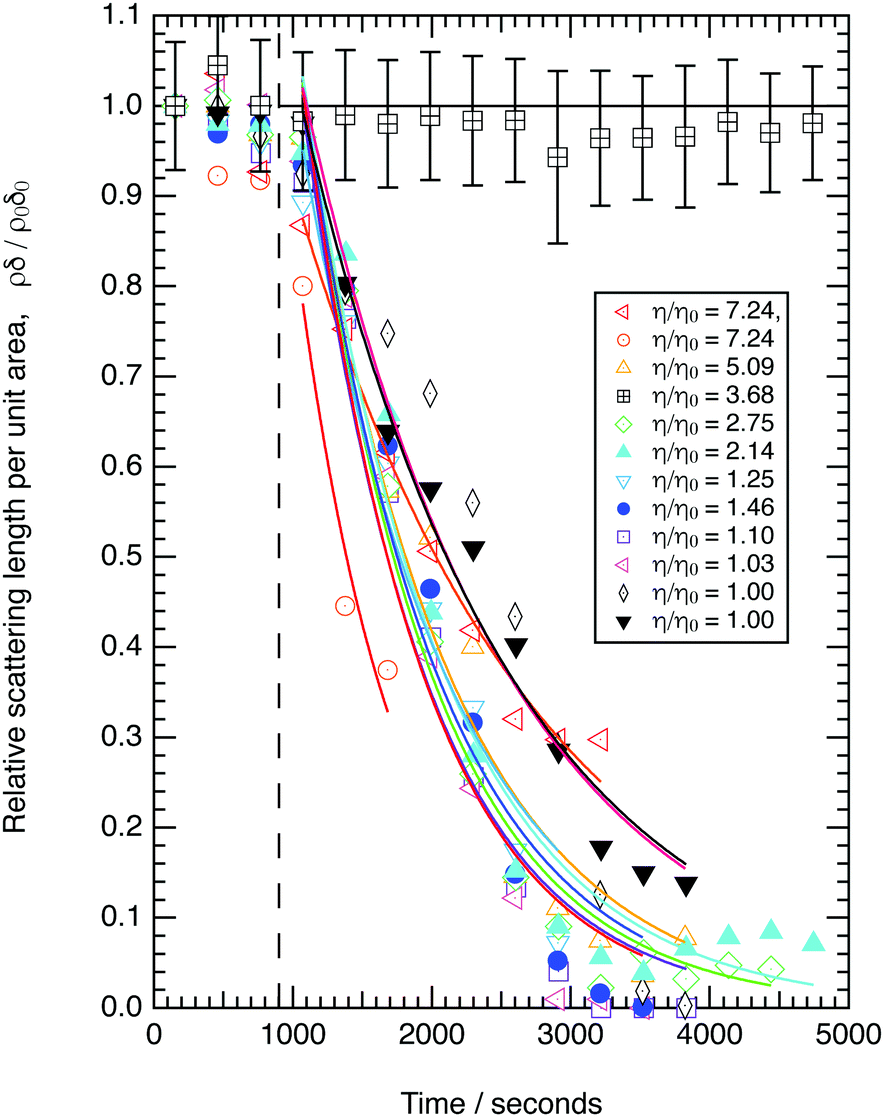 | ||
Fig. 2 The kinetic decays of new fully deuterated oleic acid at the air–water interface in the presence of 3.2 × 10¹² molecule cm3 of gas-phase ozone. The ozoniser was switched on after 900 seconds (vertical dashed line). The solid line through the points is an simple exponential decay. A control measurement demonstrating the stability of the oleic acid film in the absence of ozone and the presence of molecular oxygen demonstrates no loss of material (open black squares containing a cross). No significant amount of material remains at the interface at the end of the reaction. Uncertainty bars are plotted for the control run only and are typical for all data plotted. Concentrations of sodium perchlorate are listed in Table 2. The data corresponding to 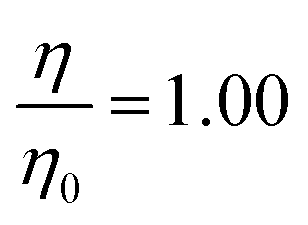 is either air contrast matched water (black diamonds) or pure H2O (black triangles). is either air contrast matched water (black diamonds) or pure H2O (black triangles). | ||
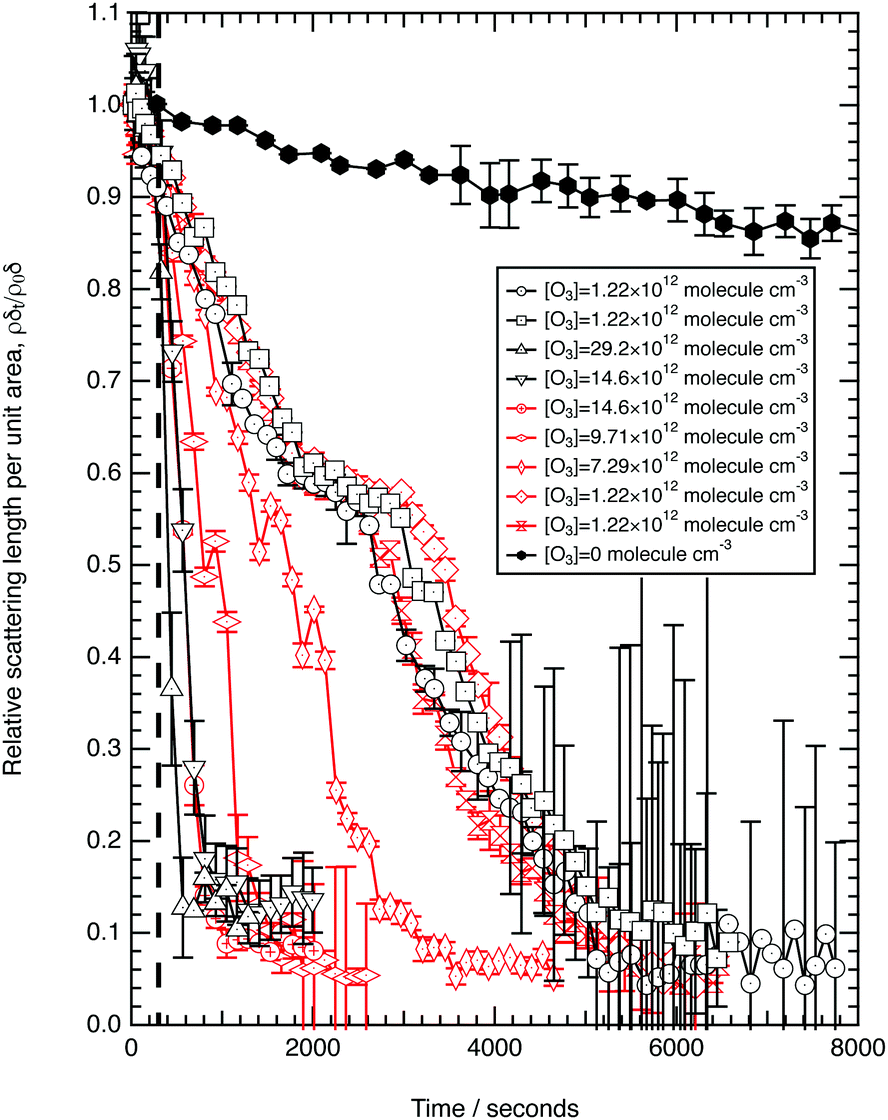 | ||
Fig. 3 The decay of deuterated oleic acids (partially deuterated d18, black symbols and fully deuterated d33, red symbols) in the presence of ozone and oxygen, or just oxygen, with different concentrations of gas-phase ozone. As the concentration of ozone decreases, a stationary point in the previous experiment becomes apparent at a surface coverage of oleic acid of ∼1 × 10¹⁸ molecule m−2 or  . The ozoniser was switched on after 300 seconds (vertical dashed line). The reaction of pure oxygen with oleic acid is slow and unimportant. . The ozoniser was switched on after 300 seconds (vertical dashed line). The reaction of pure oxygen with oleic acid is slow and unimportant. | ||
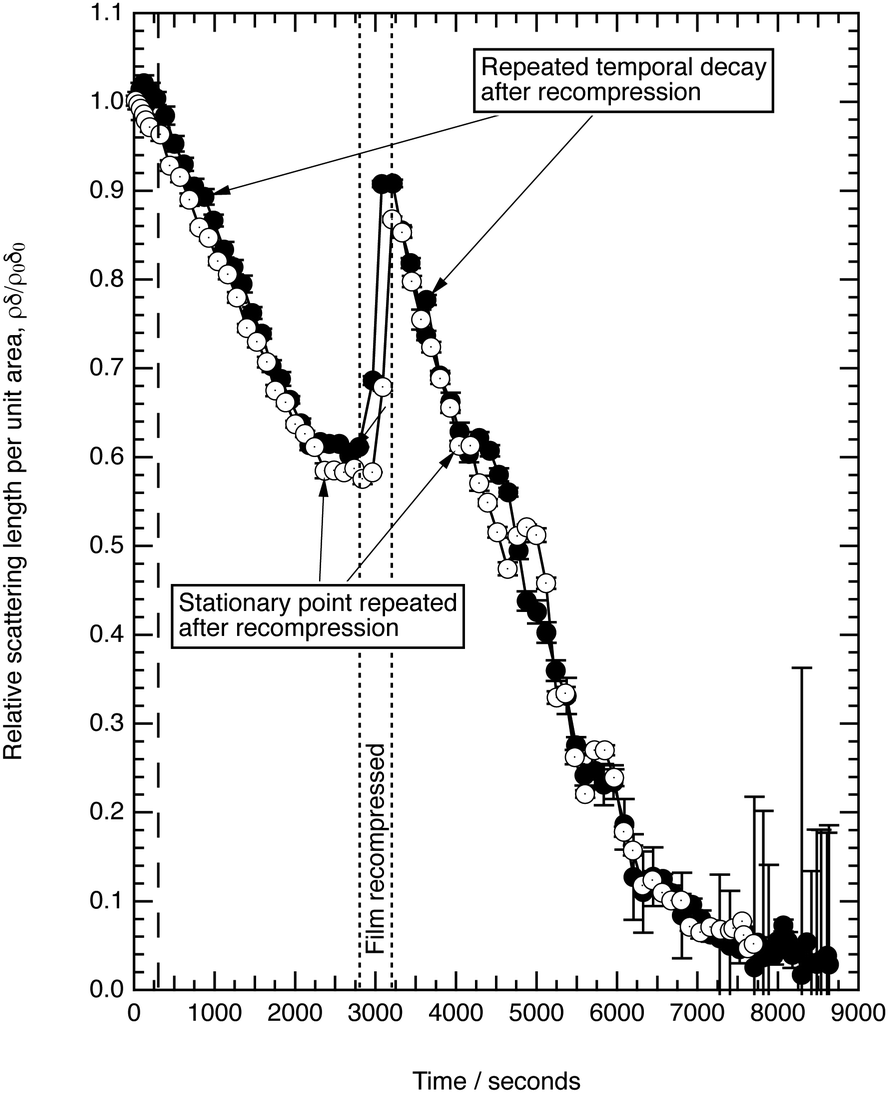 | ||
| Fig. 4 The decay of the new fully deuterated oleic acid at the air–water interface in the presence of ozone at (1.22 ± 0.23) × 1012 molecule cm−3. The ozoniser was switched on after 300 seconds (vertical dashed line). Note, the film is recompressed at ∼2750 s, at a barrier speed of 50 cm2 min−1, to a surface pressure of 18 mN m−1 and the reaction was allowed to continue. The stationary point reappears, demonstrating that it may be a phase transition in the surface packing of reactant and possibly intermediate molecules at the air–water interface. | ||
3.2 The effect of viscosity
The decay in the relative scattering length per unit area versus time is shown in Fig. 2 for a range of sub-phase viscosities. The decays observed may be approximated to an exponential decay. The kinetic decay constants are effectively the same within uncertainty (see the figure in the ESI†), which demonstrates that there is no statistically significant correlation between the measured first-order rate constants and relative viscosity of the sub-phase. An assessment of uncertainty in the individual points plotted in Fig. 2 is shown for the control kinetic run in the absence of ozone (open squares). The uncertainty is propagated from statistical fitting of computed reflectivity profiles (reflectivity vs. momentum transfer) to experimental reflectivity curves to determine values of ρ and δ from the neutron reflectivity profiles with momentum transfer.50,51 The data in Fig. 2, demonstrates that a seven-fold increase in viscosity does not affect the kinetics for the reaction between gas-phase ozone and oleic acid at the air–water interface within experimental uncertainties.3.3 The effect of atmospheric ozone concentrations
Fig. 3 shows the change in relative scattering length per unit area of oleic acid at the air–water interface when exposed to differing concentrations of gas phase ozone. It can be seen that the decay in the relative scattering length per unit area of oleic acid shows different behaviour depending on the concentration of gaseous ozone above the film. At large concentrations of ozone (∼10 × 1012 molecule cm−3) the decay of the material at the air–water interface follows a broadly exponential decay owing to reaction with ozone at the air–water interface. Note the initial part (300 s) of the decay of the deuterated material is affected by increasing concentration of ozone in the chamber, described in detail elsewhere.52 At small concentrations of ozone (∼2 × 10¹² molecule cm−3) the change of the deuterated material at the air–water interface has an almost linear decay to a stationary point around a surface coverage of ∼1 × 10¹⁸ molecule m−2 or followed by a more pronounced exponential decay. The stationary point in the temporal profile is reproducible; not only was the same effect observed when the experiment was repeated, but if the material at the air–water interface is recompressed to greater than ∼1 × 10¹⁸ molecule m−2 during an oxidation reaction as seen in Fig. 4 then the decay and stationary point are repeated. The stationary point may be owing to a phase transition or surface rearrangement of oleic acid molecules and/or diffusion of deuterated reaction products or reaction intermediates from the monolayer film at a surface coverage of ∼1 × 10¹⁸ molecule m−2.
3.4 Oxidation of oleic acid in the presence of unreactive surface active species
The reaction of ozone with mixed oleic and stearic acid monolayers at the air–water interface was studied for different mixing ratios of the acids. The product of the relative scattering length density and the monolayer thickness versus time is shown in Fig. 5. As shown in Table 1, the scattering length density of the deuterated stearic or oleic acid is approximately two orders of magnitude larger than the respective undeuterated molecule, and to a first approximation the neutron reflectivity, and the quantity relates only to the deuterated compound. The filled symbols in Fig. 5 represent the data for the binary mixtures of new fully deuterated oleic acid with undeuterated stearic acid. The decays in deuterated oleic acid owing to reaction with ozone may be considered broadly independent of the mole fraction of oleic acid present in the initial mixture demonstrating that the reaction between ozone and oleic acid is not significantly influenced by the presence of an unreactive surface-active material at the air–water interface. The pseudo first-order rate constants obtained from the fits to the data show a slight increase with increasing mole fraction of stearic acid. Unfortunately there was no time on the neutron source to perform further experiments with other mole fractions and elucidate if there was a weak dependence. Close inspection of Fig. 5 also demonstrated the loss of the stationary point of inflection seen in Fig. 3 as the mole fraction of undeuterated stearic acid increases. Thus, as a first approximation the decay of the unsaturated surface active compounds may crudely be fitted to a first-order loss process or exponential decay. The open symbols in Fig. 5 represent the reaction between ozone and undeuterated oleic acid in a mixture with deuterated stearic acid. In these experiments the quantity
  can be initially thought to represent the deuterated stearic acid only. For a pure film of stearic acid at the air–water interface there is, unsurprisingly, no reaction on the timescales of the experiment as ozone is not reactive towards saturated alkyl chains. As the proportion of undeuterated oleic increases the quantity
  gently increases with reaction time and will be discussed in Section 4.4.
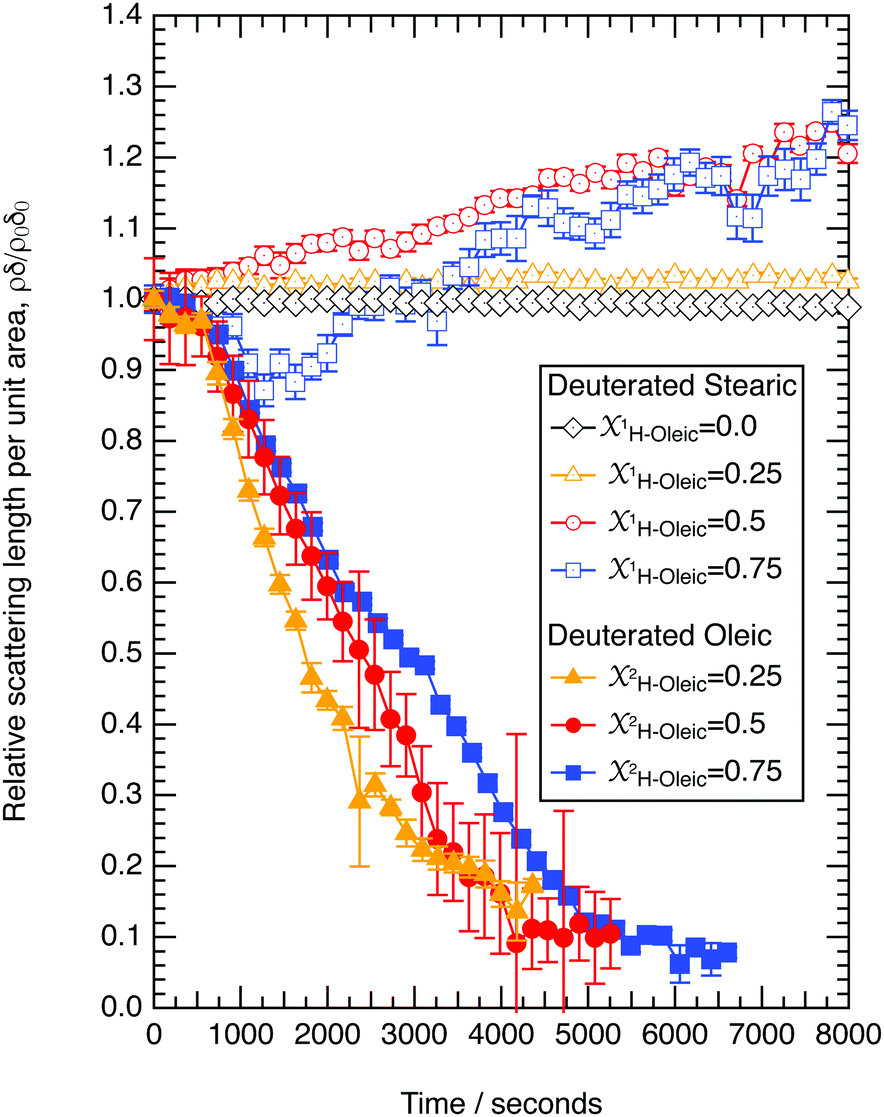 | ||
| Fig. 5 The reaction between gas-phase ozone (3 × 10¹² molecule cm−3) and a mixture of either deuterated oleic acid and undeuterated stearic acid or undeuterated oleic acid and deuterated stearic acid at the air–water interface. Stearic acid does not react with ozone on the timescale of these experiments and does not take part in the reaction between ozone and oleic acid. | ||
3.5 Kinetic analysis compared with previous work
Whilst it is not the aim of the work presented here to re-calculate the value of the bimolecular rate constant for reaction (1), where possible the decay of with time in Fig. 2, 3 and 5 have been approximated to an exponential decay and used to calculate pseudo first-order rate constants. The values, along with previous determinations.3 are plotted in a kinetic second-order plot, Fig. 6, to give a bimolecular rate constant of (7.8 ± 0.7) × 10−11 cm3 molecule−1 s−1 for reaction (1). The uncertainty in the rate constant is a statistical uncertainty from fitting a straight line through the data in Fig. 6. In agreement with the previous work,2 the rate determining step is the reaction between ozone and the oleic acid. The transport of ozone, accommodation, and equilibration of the ozone is fast relative to the reaction as seen from the various time-scales listed in Table 3.
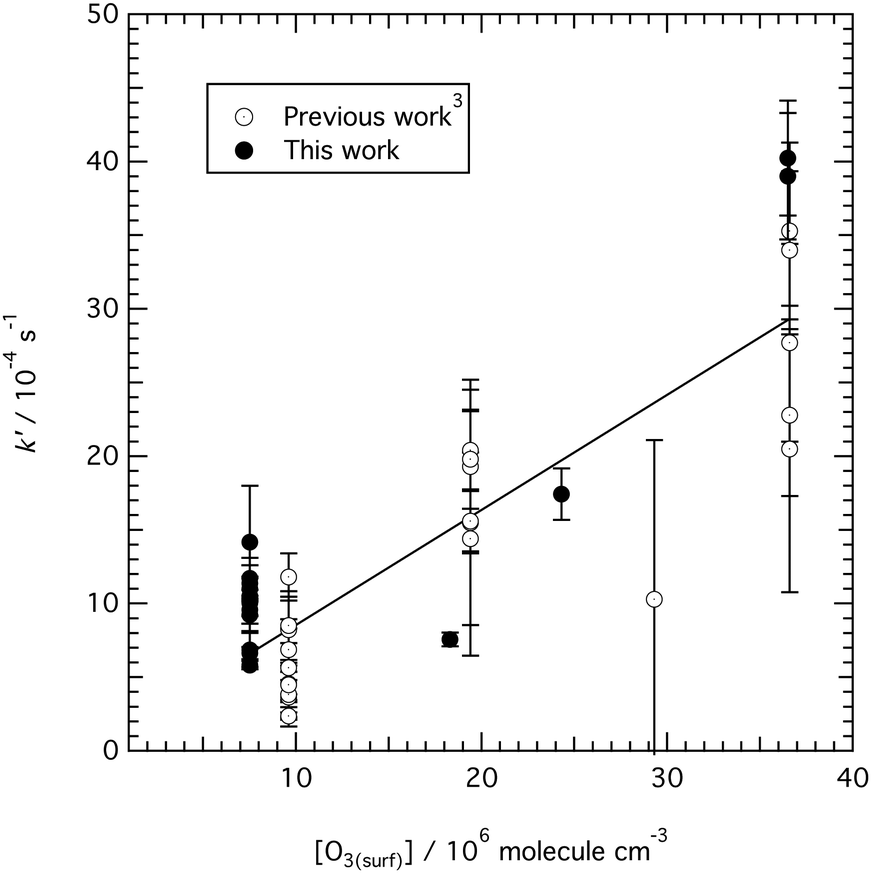 | ||
| Fig. 6 Second-order kinetic plot for reaction (1) between gas-phase ozone and oleic acid at the air–water interface. The data in a table in the ESI.† The uncertainty bars on the data are smaller for the present work than for the previous work3 owing to the improved temporal resolution of the data measured and presented in Fig. 2–5 compared to the previous work.3 A bimolecular rate constant of (7.8 ± 0.7) × 10−11 cm3 molecule−1 s−1 may be estimated from the data, where the uncertainty is the standard deviation from fitting the line of best fit to the experimental data. | ||
4 Discussion
4.1 Characterisation of the deuterated oleic acid samples
The rate constants presented here for the reaction of ozone with oleic acid monolayers at the air–water interface are broadly consistent with our earlier study,2 however, in this work, unlike our earlier study, the reaction did not lead to the presence of a deuterated product at the air–water interface. There are several possible explanations for this (for instance the presence of differing concentration of ions in the sub-phase) but the most likely explanation is that the old fully deuterated sample was contaminated with a deuterated, surface active species that was unreactive towards ozone. If such an impurity was contained within the sample used in the previous study2 it is likely to have similar physicochemical properties to the oleic acid as it was not separated on the purification columns used. Further evidence for the old sample of deuterated oleic acid containing an impurity is suggested by its melting temperature being slightly higher than the other deuterated and undeuterated samples of oleic acid in the literature.43 Unfortunately, there was an insufficiency of the old sample remaining to conduct further analysis on a GC-MS. The purity and structure of the partially deuterated sample used in this work was confirmed by the supplier with GC-MS and the new fully deuterated sample is a commercial sample. The results from this current study with the new fully deuterated sample are consistent with other work published in the literature53–56 where no final product film was observed. The results are consistent with other studies of the reaction between ozone and oleic acid (or a molecule that contains the oleic moiety) at the air–water interface.53–65 It is also noteworthy that Fig. 5 demonstrates that the stationary point in the kinetic decay shown in Fig. 3 is weakened on addition of an unreactive, surface active material giving a kinetic decay better described by an exponential decay.4.2 The effect of viscosity
The close correspondence between the experimental kinetic decays plotted in Fig. 2 indicates that the addition of sodium perchlorate to the sub-phase, and hence an increase in sub-phase viscosity, and corresponding decrease in the diffusion coefficient for ozone in the sub-phase, does not make large changes in the overall reaction rate. Other studies of the reaction of ozone with oleic acid at the air–water interface have not considered the effect of aqueous sub-phase viscosity on the reaction, but have considered the effect of ionic strength and the results agree with those presented here.3 Smith et al.48 considering the oxidation of oleic acid within particles by gas-phase ozone, demonstrated that the reaction probably occurred at the surface and may have been limited by the self-diffusion of oleic acid48 to the surface, a different mechanism to that for the monolayer of oleic acid presented here and is not directly comparable. It is worth noting that the viscosity explored here is small compared to those potentially possible for atmospheric aerosol, but the aim was to demonstrate ozone was not first dissolving into the aqueous layer and then reacting.4.3 The effect of atmospheric ozone concentrations
The decay kinetics of the reaction between gas-phase ozone and a monolayer of oleic acid at the air–water interface is not a simple exponential, although it has been approximated in that way in Section 3.5. Fig. 3 demonstrates that as the concentration of gas-phase ozone is reduced and the shape of the decay curve can be resolved in more detail the kinetics begin to change. The stationary point in the temporal decay of the scattering length per unit area during the oxidation of the deuterated oleic acid with ozone could be conjectured to be due to a change in the packing of the oleic acid molecules at the air–water interface which may allow more facile access of the oxidant, ozone, to the double bond but a detailed investigation into the phase behaviour of this mixed system would be required to confirm this. Of more interest for the study of the atmosphere is the absence, or decreased prominence, of the stationary point in the reaction decay curve (Fig. 5) in a mixture containing both unsaturated and saturated compounds allowing oxidation of unsaturated compounds in complex mixed films on atmospheric aerosol to be approximated by first-order kinetics (i.e. exponential loss of reagent). It may be hypothesised that the availability of the double bond to the gas-phase ozone is changing with surface coverage, although no experimental evidence is available to test this idea. There is evidence in another study66 that the regioselectivity of reaction of unsaturated organic material at the air–water interface may be affected by the position of the double bond relative to the air–water interface. The stationary point may have been seen in different but complimentary experiments of King et al.2 (their Fig. 2). A laser trapped67–69 droplet of oleic acid and synthetic seawater being oxidised by gas-phase ozone demonstrates a stationary point in the decay of oleic acid as followed by Raman spectroscopy, and rise of the reaction product nonanoic acid. The timing of the stationary point coincides with the completion of droplet growth by water absorption from the ambient air. The behaviour in the study2 may allow the suggestion that the reaction product, nonanoic acid, is potentially involved in the behaviour. Some of the concentrations of ozone used in the present study are large and not typical of the ambient atmosphere. However similar studies of the oxidation of organics at the air–water interface have considered different ozone concentrations and obtained similar exponential behaviour to that demonstrated here.3,524.4 The effect of mixing: oxidation of oleic acid in the presence of unreactive surface active species
The data in Fig. 5 demonstrate fully deuterated oleic acid (in different mole fractions of xoleic = 0.25, 0.5 and 0.75) decaying with similar temporal profiles whilst the reaction with deuterated stearic acid shows no decay and a gentle increase in the value of as the undeuterated oleic acid is removed by oxidation. As the mole fraction of undeuterated oleic acid is increased there is no evidence for a loss of stearic acid, demonstrating that the reaction between oleic acid and ozone is not producing secondary reactants that are capable of reacting with the stearic acid. A similar result was observed in our work with the reaction of ozone with lipids at the air–water interface.61,70 Whilst extrapolating from that work61,70 to the intermolecular example in the study presented here may be obvious, it is nevertheless useful.
The stationary point in the temporal decay of deuterated oleic acid with ozone at the air–water interface was weakened, almost removed as the mole fraction of oleic acid reduced. Thus the oxidation of a mixture of saturated and unsaturated materials at the air–water interface in atmospheric aerosol is unlikely to demonstrate the stationary point behaviour shown in Fig. 3. It was noted in Section 3.4 that the pseudo first-order rate constants for reaction of ozone with deuterated oleic acid increased slightly with increasing mole fraction of undeuterated stearic acid. The result was surprising and may be owing to two possible effects: either the concentration of ozone is larger in the predominantly stearic acid film (stearic acid is tighter packed that oleic acid,41 and may have a larger Henry's law coefficient, not unrealistic as Henry's Law coefficient varies between organic solvents71–73), or the disappearance of the stationary point in the temporal decay of deuterated oleic acid is affecting the interpretation of the decay kinetics.
Oxidation of oleic acid in a mixed film of oleic acid and stearic acid does not appear to affect the stearic acid in the film. However, for the reaction of ozone with non-deuterated oleic acid and deuterated stearic acid,  is seen clearly to increase as shown in Fig. 5. The increase in neutron reflectivity was unexpected. The increase might be explained by formation of a possible reaction product with a larger neutron scattering length at the air–water interface, for example by addition of oxygen atoms. Note this explanation would require the hypothesised product to be present at the air–water interface in the presence of stearic acid, but lost to the sub-phase or gas-phase in the absence of stearic acid at the air–water interface. The eventual fate of such a product cannot be identified as the time for which there are experimental observations is limited. An alternative explanation is oleic acid could be ‘squeezed-out’ at larger surface pressures41 and so large-scale separation into regions with different composition is plausible. This alternative explanation for the increase is similar to that suggested by Skoda et al.74 who also studied the reaction between gas-phase ozone and mixed stearic acid–oleic acid films at the air–water interface with neutron reflectometry and infra-red reflection absorption spectroscopy. The relative contribution to the reflected neutron signal changes when domains of two components separate on a scale larger than the coherence length of the neutron beam, that is expected to be of the order of micrometers.75 Large islands of deuterated stearic acid or regions that are richer in that component would cause an increased signal. The suggestion that islands of stearic acid form as opposed to oleic acid simply forming lenses is different to previous studies41 and the idea that initially formed islands of stearic acid spread to form a uniform film.74
In related studies, Katrib et al.76 demonstrated that the bulk oxidation (i.e. not at an air–water interface) by gas-phase ozone of mixed stearic acid/oleic acid particles depended on the relative mole fractions of stearic (and oleic acid). Small mole fraction of oleic acid resulted in low uptake coefficients for ozone as the authors hypothesise the stearic acid forms a gel-phase with the oleic acid retarding oxidation by gas-phase ozone. Knopf et al. also studied the reaction by gas-phase ozone with mixed stearic acid/oleic acid particles77 and noted changing ozone uptake coefficients with bulk oxidation by gas-phase ozone of mixed lauric acid/oleic acid particles.
Whilst it would be useful to do further experiments on the mixed films the broad conclusion is that for those workers studying atmospheric process, as a first approximation it may be valid to assume the oxidation of material by gas-phase ozone containing CC double bond at the air–water interface of atmospheric water droplets does not depend on other inert organic materials present.
4.5 Bimolecular kinetics
Approximating the mixed decay kinetics shown in Fig. 2 and 3 to an exponential decay allows the data shown in Fig. 2 and 3 to be added to the determination of a bimolecular rate constant for reaction (1). Comparison of the value of the bimolecular rate constant using data from this work and our previous work3 gives a slightly revised bimolecular rate constant for reaction (1) of (7.8 ± 0.7) × 10−11 cm2 molecule−1 s−1 with the previous work,3 having a value of (7.3 ± 0.9) × 10−11 cm2 molecule−1 s−1. The current work recognises that: (a) the kinetics are not simple first-order losses and that further rationalisation by simple attempts to fit exponential decays to this system will not prove fruitful, (b) the statistical uncertainty for the rate constant may be an underestimation for the true uncertainty of the determination of this rate constant. However, the pseudo-bimolecular rate constant is useful for atmospheric science to allow estimation of the lifetime of an unsaturated film to atmospheric oxidation by ozone, to remain at ∼1.3 hours as calculated previously.3 The short lifetime is in keeping with the result that organic surface-active material extracted from aerosols in aged air masses is unreactive to gas-phase ozone as any unsaturated material was previously removed by atmospheric oxidation.78The oxidation of a monolayer of oleic acid at the air–water interface, reaction (1), is an important model reaction for oxidation of the organic matter at the interface of aqueous atmospheric aerosol. A source of organic coated aerosol particles79 is the sea surface micro-layer80 and the relationship between marine aerosols and sea surface micro-layer is described elsewhere.81 Others have studied the ozonolysis of oleic acid at interfaces to aid the management of the emission of cooking fumes.82 The reaction of oleic acid with other atmospheric oxidants has been studied at the air–water interface with nitrate radical,83 OH radical,84 nitrogen dioxide,49 sulfur dioxide85 and UV radiation via photosensitisation.86–88
4.6 Atmospheric implications
For atmospheric scientists studying the oxidation of aerosol particulate matter the results from the work allow two simplifications to be made when modelling the oxidation of unsaturated thin film material by the prevalent oxidising agent, gaseous ozone. First the kinetics (and thus the timescale) of the oxidation of model thin film material on atmospheric aerosol may, be considered as independent of the ionic strength and viscosity of a dilute aqueous aerosol. The assumption is the components increasing the ionic strength and viscosity of the aerosol are unreactive to ozone in relevant concentration and timescales as shown in Table 3. It should be noted that the range of ionic strength and viscosity considered is small compared to those found in real atmospheric aerosol.89 Secondly it may be inferred that the kinetics of reaction between oleic acid and ozone at the air–water interface do not require dissolution of ozone in the aqueous sub-phase. It has also been shown that the kinetics of the reaction of surface-active molecules with carbon–carbon double bonds with gaseous ozone may be considered independent of other compounds at the interface. Thus to estimate loss of a mixture of species independent determinations of reaction kinetics between the different gas-phase species and surface active materials may be used to determine a surface coverage weighted bimolecular rate constant, subject to any secondary chemical reaction being considered.The work presented here demonstrates the need for experimental atmospheric reaction kinetics to be measured where possible at the concentrations applicable in the atmosphere. The experiments presented here demonstrate the kinetics of reaction (1) at the air–water interface depend on the surface coverage of the oleic acid molecules. The behaviour only becomes apparent at lower ozone concentrations (where the sampling rate of the experiment can capture the change in kinetics) i.e. different reaction kinetics for surface coverages above and below ∼ 1 × 10¹⁸ molecule m−2. In the atmosphere it is hard to envisage a scenario where the film on an atmospheric droplet or particle would be pure oleic acid and not a complex mixture of surface active compounds.78 Thus the specific detailed kinetics of the oxidation of oleic acid with gas-phase ozone is unlikely to be important in the real atmosphere and a simple exponential decay will often suffice. In the previous work3 so-called Köhler curves for aqueous sodium chloride water particles were presented with an oleic acid coating, without any coating, and with a (now known to be erroneous) reaction product coating. Thus for an aqueous spherical particle with a monolayer of oleic acid upon oxidation the critical supersaturation point increases by ∼2.6%, potentially requiring larger updraft velocities for cloud formation after oxidation. However for an aqueous spherical particle with a multilayer of oleic acid the change in critical supersaturation with oxidation of the film is probably too small to be considered important. Wang et al.90 reported recently that the thickness of an oleic acid coating was important for cloud condensation nucleation activity of calcium carbonate mineral particles. Schwier et al.91 considered similar Köhler curves for mono- and multilayers of mixtures of oleic acid and sodium oleate. For pure particles the nucleation described by Broekhuizen et al.92 showed the activity of the oxidation of pure oleic particles and noted the reaction does promote Cloud Condensation Nuclei, CCN, formation, but that the degree of CCN activity depends on the chemical nature of the particle. Katrib et al.93 suggested that the oxidation of oleic acid by ozone increased the CCN activity.
5 Conclusions
The work presented here has demonstrated that the reaction between gas-phase ozone and a monolayer of oleic acid at the air–water interface is (1) independent of the ionic strength and viscosity of the aqueous sub-phase, (2) leaves little to no product at the air–water interface, is (3) broadly independent of an inert reaction partner, stearic acid, and has (4) complex reaction decay kinetics that are only approximated by first-order loss.Data
The binned neutron reflectivity data for the experiments presented here can be found at the following DOI: http://10.5281/zenodo.3950541, http://10.5281/zenodo.3955139, http://10.5281/zenodo.3955156, http://10.5281/zenodo.3955160 and http://10.5281/zenodo.3955164.Author contributions
All authors conducted at least one set of experiments at either the ISIS or ILL Neutron sources as detailed in the publicly available datasets listed in Section 7.Conflicts of interest
There are no conflicts to declare.Acknowledgements
We gratefully acknowledge the support of the STFC ISIS (RB1310383, RB920160) and ILL (9-10-1288, 9-10-1014, 9-10-1069). The majority of the experiments were undertaken at the ISIS Pulsed Neutron and Muon Source with other, preliminary, experiments undertaken at the Institut Laue-Langevin. SHJ and COML wish to express gratitude to NERC (NE/H019103/1, NE/F007116/1 & NE/T00732X/1 respectively) for studentship support. AAM wishes to thank Royal Holloway University of London for a Reid fellowship. CP wishes to thank Leverhulme foundation for support (F/07537/V). FNF expresses gratitude to EPSRC for studentship support. The open access fee was covered by FILL2030, a European Union project within the European Commission’s Horizon 2020 Research and Innovation programme under grant agreement No. 731096.References
- D. Donaldson and V. Vaida, Chem. Rev., 2006, 106, 1445–1461 CrossRef CAS.
- M. D. King, K. C. Thompson and A. D. Ward, J. Am. Chem. Soc., 2004, 126, 16710–16711 CrossRef CAS.
- M. D. King, A. R. Rennie, K. C. Thompson, F. N. Fisher, C. C. Dong, R. K. Thomas, C. Pfrang and A. V. Hughes, Phys. Chem. Chem. Phys., 2009, 11, 7699–7707 RSC.
- IPCC, in 2013: Climate Change 2013: The Physical Science Basis. Contribution of Working Group I to the Fifth Assessment Report of the Intergovern- mental Panel on Climate Change, ed. T. F. Stocker, D. Qin, G.-K. Plattner, M. Tignor, S. K. Allen, J. Boschung, A. Nauels, Y. Xia, V. Bex and P. M. Midgley, Cambridge University Press, Cambridge, UK and New York, NY, USA, 2013 Search PubMed.
- V. F. McNeill, N. Sareen and A. N. Schwier, in Atmospheric and Aerosol Chemistry, ed. V. F. McNeill and P. A. Ariya, Topics in Current Chemistry-Series, Springer, Berlin, Heidelberg, 2014, vol. 339, pp. 201–259 Search PubMed.
- J. Zahardis and G. A. Petrucci, Atmos. Chem. Phys., 2007, 7, 1237–1274 CrossRef CAS.
- R. C. Chapleski Jr, Y. Zhang, D. Troya and J. R. Morris, Chem. Soc. Rev., 2016, 45, 3731–3746 RSC.
- D. J. Donaldson and K. T. Valsaraj, Environ. Sci. Technol., 2010, 44, 865–873 CrossRef CAS.
- P. Jungwirth, B. J. Finlayson-Pitts and D. J. Tobias, Chem. Rev., 2006, 106, 1137–1139 CrossRef CAS.
- F. Karagulian, C. W. Dilbeck and B. J. Finlayson-Pitts, J. Am. Chem. Soc., 2008, 130, 11272–11273 CrossRef CAS.
- F. Karagulian, C. W. Dilbeck and B. J. Finlayson-Pitts, J. Phys. Chem. A, 2009, 113, 7205–7212 CrossRef CAS.
- R. Battino, T. Rettich and T. Tominaga, J. Phys. Chem. Ref. Data, 1983, 12, 163–178 CrossRef CAS.
- R. C. Reid, T. K. Sherwood and J. M. Prausnitz, Properties of Gases and Liquids, McGraw-Hill, 1977 Search PubMed.
- E. L. Cussler, Diffusion mass tranfer in fluid systems, Cambridge University Press, 1999 Search PubMed.
- W. Sutherland, London, Edinburgh Dublin Philos. Mag. J. Sci., 1905, 9, 781–785 CrossRef CAS.
- S. Glasstone, K. J. Laidler and H. Eyring, Theory of Rate Processes, McGraw-Hill, 1941 Search PubMed.
- E. G. Scheibel, Ind. Eng. Chem., 1954, 46, 2007–2008 CrossRef CAS.
- C. R. Wilke and P. Chang, AIChE J., 1955, 1, 264–270 CrossRef CAS.
- C. J. King, L. Hsueh and K.-W. Mao, J. Chem. Eng. Data, 1965, 10, 348–350 CrossRef CAS.
- T. G. Hiss and E. L. Cussler, AIChE J., 1973, 19, 698–703 CrossRef CAS.
- L. Renbaum-Wolff, J. W. Grayson, A. P. Bateman, M. Kuwata, M. Sellier, B. J. Murray, J. E. Shilling, S. T. Martin and A. K. Bertram, Proc. Natl. Acad. Sci. U. S. A., 2013, 110, 8014–8019 CrossRef CAS.
- E. Abramson, D. Imre, J. Beranek, J. Wilson and A. Zelenyuk, Phys. Chem. Chem. Phys., 2013, 15, 2983–2991 RSC.
- T. Koop, J. Bookhold, M. Shiraiwa and U. Poschl, Phys. Chem. Chem. Phys., 2011, 13, 19238–19255 RSC.
- E. Mikhailov, S. Vlasenko, S. T. Martin, T. Koop and U. Pöschl, Atmos. Chem. Phys., 2009, 9, 9491–9522 CrossRef CAS.
- H. M. Ali, M. Ledema, X. Y. Yu and J. P. Cowin, Atmos. Environ., 2014, 89, 731–738 CrossRef CAS.
- L. Giulianelli, S. Gilardoni, L. Tarozzi, M. Rinaldi, S. Decesari, C. Carbone, M. C. Facchini and S. Fuzzi, Atmos. Environ., 2014, 98, 394–401 CrossRef CAS.
- J. Penfold and R. K. Thomas, Curr. Opin. Colloid Interface Sci., 2014, 19, 198–206 CrossRef CAS.
- J. R. Lu, R. K. Thomas and J. Penfold, Adv. Colloid Interface Sci., 2000, 84, 143–304 CrossRef CAS.
- R. A. Campbell, Curr. Opin. Colloid Interface Sci., 2018, 37, 49–60 CrossRef CAS.
- J. Penfold, R. M. Richardson, A. Zarbakhsh, J. R. P. Webster, D. G. Bucknall, A. R. Rennie, R. A. L. Jones, T. Cosgrove, R. K. Thomas, J. S. Higgins, P. D. I. Fletcher, E. Dickinson, S. J. Roser, I. A. McLure, A. R. Hillman, R. W. Richards, E. J. Staples, A. N. Burgess, E. A. Simister and J. W. White, J. Chem. Soc., Faraday Trans., 1999, 93, 3899–3917 Search PubMed.
- R. A. Campbell, H. P. Wacklin, I. Sutton, R. Cubitt and G. Fragneto, Eur. Phys. J. Plus, 2011, 126, 107 CrossRef.
- F. Abelès, Ann. Phys., 1949, 12, 504–520 Search PubMed.
- F. Abelès, Ann. Phys., 1950, 12, 596–640 Search PubMed.
- F. Abelès, Ann. Phys., 1950, 12, 706–785 Search PubMed.
- L. G. Parratt, Phys. Rev., 1954, 95, 359–369 CrossRef.
- S. P. Sander, J. Abbatt, J. R. Barker, J. B. Burkholder, R. R. Friedl, D. M. Golden, R. E. Huie, C. E. Kolb, M. J. Kurylo, G. K. Moortgat, V. L. Orkin and P. H. Wine, Chemical Kinetics and Photochemical Data for Use in Atmospheric Studies Evaluation No. 17, Jet Propulsion Laboratory Technical Report JPL Publication 10-6, 2011 Search PubMed.
- L. H. Clark and G. L. Putnam, J. Am. Chem. Soc., 1949, 71, 3445–3447 CrossRef CAS.
- G. J. Janz, B. G. Oliver, G. R. Lakshminarayanan and G. E. Mayer, J. Phys. Chem., 1970, 74, 1285–1289 CrossRef CAS.
- A. K. Covington, M. Paabo, R. A. Robinson and R. G. Bates, Anal. Chem., 1968, 40, 700–706 CrossRef CAS.
- R. Florence and W. D. Harkins, J. Chem. Phys., 1938, 6, 856–860 CrossRef CAS.
- A. I. Feher, F. D. Collins and T. W. Healy, Aust. J. Chem., 1977, 30, 511–519 CrossRef CAS.
- V. F. Sears, Neutron News, 1992, 3(3), 26–37 CrossRef.
- J. R. Rumble Jr, D. R. Lide and J. J. Bruno, CRC Handbook of chemistry and Physics, CRC Press, Taylor and Francis, Boca Raton, Florida, USA, 90th edn, 2018 Search PubMed.
- L. Lee and K. Wilson, J. Phys. Chem. A, 2016, 120, 6800–6812 CrossRef CAS.
- T. Berkemeier, S. S. Steimer, U. K. Krieger, T. Peter, U. Pöschl, M. Ammann and M. Shiraiwa, Phys. Chem. Chem. Phys., 2016, 18, 12662–12674 RSC.
- M. Shiraiwa, C. Pfrang and U. Pöschl, Atmos. Chem. Phys., 2010, 10, 3673–3691 CrossRef CAS.
- M. D. King, K. C. Thompson, A. D. Ward, C. Pfrang and B. R. Hughes, Faraday Discuss., 2007, 137, 173–192 RSC.
- G. D. Smith, E. C. Woods, C. L. DeForest, T. Baer and R. Miller, J. Phys. Chem. A, 2002, 106, 8085–8095 CrossRef CAS.
- M. D. King, A. R. Rennie, C. Pfrang, A. V. Hughes and K. C. Thompson, Atmos. Environ., 2010, 44, 1822–1825 CrossRef CAS.
- A. Nelson, J. Appl. Crystallogr., 2006, 39, 273–276 CrossRef CAS.
- P. R. Bevington and D. K. Robinson, Data reduction and error analysis for the physical sciences, McGraw-Hill, Boston, 2003 Search PubMed.
- C. Pfrang, F. Sebastiani, C. O. M. Lucas, M. D. King, I. D. Hoare, D. Chang and R. A. Campbell, Phys. Chem. Chem. Phys., 2014, 16, 13220–13228 RSC.
- L. F. Voss, M. F. Bazerbashi, C. P. Beekman, C. M. Hadad and H. C. Allen, J. Geophys. Res.: Atmos., 2007, 112, D06209 Search PubMed.
- E. González-Labrada, R. Schmidt and C. E. DeWolf, Chem. Commun., 2006, 2471–2473 RSC.
- E. González-Labrada, R. Schmidt and C. E. DeWolf, Phys. Chem. Chem. Phys., 2007, 9, 5814–5821 RSC.
- J. Kleber, K. Lass and G. Friedrichs, J. Phys. Chem. A, 2013, 117, 7863–7875 CrossRef CAS.
- X. Gao, C. Leng, G. Zeng, D. Fu, Y. Zhang and Y. Liu, Spectrochim. Acta, Part A, 2019, 214, 177–183 CrossRef CAS.
- N. N. Sazhina, N. M. Evteeva and V. N. Titov, Bull. Exp. Biol. Med., 2018, 165, 356–359 CrossRef CAS.
- X. He, C. Leng, S. Pang and Y. Zhang, RSC Adv., 2017, 7, 3204–3213 RSC.
- Z. Zhou, S. Zhou and J. P. D. Abbatt, Environ. Sci. Technol., 2019, 53, 12467–12475 CrossRef CAS.
- K. C. Thompson, A. R. Rennie, M. D. King, S. J. O. Hardman, C. O. M. Lucas, C. Pfrang, B. R. Hughes and A. V. Hughes, Langmuir, 2010, 26, 17295–17303 CrossRef CAS.
- D. A. Thomas, L. Wang, B. Goh, E. S. Kim and J. L. Beauchamp, Anal. Chem., 2015, 87, 3336–3344 CrossRef CAS.
- W. A. Pryor, B. Das and D. F. Church, Chem. Res. Toxicol., 1991, 4, 341–348 Search PubMed.
- W. A. Pryor, M. Miki, B. Das and D. F. Church, Chem.-Biol. Interact., 1991, 79, 41–52 CrossRef CAS.
- W. A. Pryor and D. F. Church, Free Radical Biol. Med., 1991, 11, 41–46 CrossRef CAS.
- B. Malek, A. A. Ghogare, R. Choudhury and A. Greer, Tetrahedron Lett., 2015, 56, 4505–4508 CrossRef CAS.
- O. R. Hunt, A. D. Ward and M. D. King, RSC Adv., 2013, 3, 19448–19454 RSC.
- O. R. Hunt, A. D. Ward and M. D. King, Phys. Chem. Chem. Phys., 2015, 17, 2734–2741 RSC.
- A. D. Ward, M. Zhang and O. Hunt, Opt. Express, 2008, 16, 16390–16403 CrossRef CAS.
- K. C. Thompson, S. H. Jones, A. R. Rennie, M. D. King, A. D. Ward, B. R. Hughes, C. O. M. Lucas, R. A. Campbell and A. V. Hughes, Langmuir, 2013, 29, 4594–4602 CrossRef CAS.
- S. D. Razumovskii and G. E. Zaikov, Bull. Acad. Sci. USSR, Div. Chem. Sci., 1971, 20, 616–620 CrossRef.
- A. K. Biń, Ozone: Sci. Eng., 2006, 28, 67–75 CrossRef.
- N. M. Panich and B. G. Ershov, Russ. J. Gen. Chem., 2019, 89, 185–189 CrossRef CAS.
- M. W. A. Skoda, B. Thomas, M. Hagreen, F. Sebastiani and C. Pfrang, RSC Adv., 2017, 7, 34208–34214 RSC.
- C. F. Majkrzak, C. Metting, B. B. Maranville, J. A. Dura, S. Satija, T. Udovic and N. F. Berk, Phys. Rev. A: At., Mol., Opt. Phys., 2014, 89, 033851 CrossRef.
- Y. Katrib, G. Biskos, P. Buseck, P. Davidovits, J. Jayne, M. Mochida, M. Wise, D. Worsnop and S. Martin, J. Phys. Chem. A, 2005, 109, 10910–10919 CrossRef CAS.
- D. A. Knopf, L. M. Anthony and A. K. Bertram, J. Phys. Chem. A, 2005, 109, 5579–5589 CrossRef CAS.
- S. H. Jones, M. D. King, A. D. Ward, A. R. Rennie, A. C. Jones and T. Arnold, Atmos. Environ., 2017, 161, 274–287 CrossRef CAS.
- S. H. Jones, M. D. King and A. D. Ward, Chem. Commun., 2015, 51, 4914–4917 RSC.
- O. Wurl, W. Ekau, W. M. Landing and C. J. Zappa, Elem. Sci. Anth., 2017, 5, 1–11 CrossRef.
- J. C. Marty, A. Saliot, P. Buat-Ménard, R. Chesselet and K. A. Hunter, J. Geophys. Res.: Oceans, 1979, 84, 5707–5716 CrossRef CAS.
- F. M. T. Farrell, T. M. Fitch and M. K. Bicking, J. Air Waste Manage. Assoc., 2011, 61, 1005–1014 CrossRef CAS.
- F. Sebastiani, R. A. Campbell, K. Rastogi and C. Pfrang, Atmos. Chem. Phys., 2018, 18, 3249–3268 CrossRef CAS.
- X. Zhang, K. M. Barraza, K. T. Upton and J. L. Beauchamp, Chem. Phys. Lett., 2017, 683, 76–82 CrossRef CAS.
- J. Shang, M. Passananti, Y. Dupart, R. Ciuraru, L. Tinel, S. Rossignol, S. Perrie, T. Zhu and C. George, Environ. Sci. Technol., 2016, 3, 67–72 CAS.
- S. Li, X. Jiang, M. Roveretto, C. George, L. Liu, W. Jiang, Q. Zhang, W. Wang, M. Ge and L. Du, Atmos. Chem. Phys., 2019, 19, 9887–9902 CrossRef CAS.
- S. Rossignol, L. Tinel, A. Bianco, M. Passananti, M. Brigante, D. J. Donaldson and C. George, Science, 2016, 353, 699–702 CrossRef CAS.
- R. Ciuraru, L. Fine, M. van Pinxteren, B. D’Anna, H. Herrmann and C. George, Sci. Rep., 2015, 5, 12741 CrossRef CAS.
- J. P. Reid, A. K. Bertram, D. O. Topping, A. Laskin, S. T. Martin, M. D. Petters, F. D. Pope and G. Rovelli, Nat. Commun., 2018, 9, 956 CrossRef.
- M. Wang, T. Zhu, D. Zhao, F. Rubach, A. Wahner, A. Kiendler-Scharr and T. F. Mentel, Atmos. Chem. Phys., 2018, 18, 7345–7359 CrossRef CAS.
- A. N. Schwier, N. Sareen, T. L. Lathem, A. Nenes and V. F. McNeill, J. Geophys. Res.: Atmos., 2011, 116, D16202 CrossRef.
- K. Broekhuizen, T. Thornberry, P. Kumar and J. Abbatt, J. Geophys. Res.: Atmos., 2004, 109, D24206 CrossRef.
- Y. Katrib, S. Martin, H. Hung, Y. Rudich, H. Zhang, J. Slowik, P. Davidovits, J. Jayne and D. Worsnop, J. Phys. Chem. A, 2004, 108, 6686–6695 CrossRef CAS.
Footnote |
| † Electronic supplementary information (ESI) available. See DOI: 10.1039/d0cp03934a |
| This journal is © the Owner Societies 2020 |