 Open Access Article
An approach to calculate the free energy changes of surface reactions using free energy decomposition on ab initio brute-force molecular dynamics trajectories†
Jiayan
Xu
,
Hao
Huang
and
P.
Hu
 *
*
School of Chemistry and Chemical Engineering, Queen's University Belfast, Belfast BT9 5AG, UK. E-mail: p.hu@qub.ac.uk
First published on 25th August 2020
Abstract
To understand the mechanisms and kinetics of catalytic reactions in heterogeneous catalysis, ab initio molecular dynamics is one of the powerful methods used to explore the free energy surface (FES) of surface elementary steps. The most significant aspect of performing such calculations is to choose the specific collective variable (CV) of the reaction. Here, we take CO oxidation on Pt(111) at 300 K as an example to demonstrate the protocol of selecting CVs guided by the free energy decomposition which quantifies individual bond free energy contributions. The basic concept is to conduct the brute-force molecular dynamics initiated from the transition state on the FES, which is refined from the one on the potential energy surface, to generate the reaction path at a finite temperature. The validity of this reaction path is further demonstrated by a 2-D free energy landscape spanned by the path-CV. By choosing CVs including other bond distances, we find that CO oxidation cannot be well understood by umbrella sampling or constrained molecular dynamics (CMD) solely along the OC–O bond distance. The free energy decomposition analysis suggests that not only the OC–O bond but also two O–Pt bonds are responsible for the free energy change. The further CMD simulations along selected CVs based on the insights from our protocol capture different reaction stages and give solid estimations of free energy barriers.
1. Introduction
Understanding reaction mechanisms at the atomic level has always been one of the main tasks of computational heterogeneous catalysis. In the last few decades, the entire field has devoted itself to exploring a large number of reactions by searching for local minima and saddle points on the potential energy surface (PES). The transition-state theory bridges the gap between equilibrium properties and kinetics with the applicability of free energies (Gibbs and Helmholtz). For surface reaction calculations,1–3 a specific free energy is usually estimated as the potential energy plus the statistical mechanics correction.4 However, the most inviting heterogeneous catalytic reactions are carried out under situations far from the ideal conditions that we adopt in calculations. Some reactions such as oxidation and reduction can only happen at a relatively high temperature which leads to surface disorder from the 0 K lattice structure.5,6 Other reactions can take place at ambient temperature but have to occur at solute–solid interfaces especially electrocatalysis7,8 and photocatalysis.9,10 Moreover, the structures of nanoclusters change rapidly during reactions, which cannot be treated as frozen solids.11,12 In the studies related to the above reactions, ab initio molecular dynamics (AIMD) based on the density functional theory (DFT) is usually adopted, which offers novel understanding with acceptable accuracy. Not only new insights into reaction mechanisms but also free energy values with much better accuracy can be obtained from AIMD.13,14Since the difference between the Gibbs free energy and the Helmholtz free energy is very small for surface reactions, the latter is usually evaluated using AIMD. To explore the free energy surface (FES) using molecular dynamics simulations, plenty of strategies have been developed, namely constrained molecular dynamics (CMD),15 umbrella sampling (US),16,17 metadynamics18,19 and others.20–22 In the framework of the above methods, the free energy change is associated with a particular coordinate known as the collective variable (CV). The free energy at a given value of the CV ξ0 can be determined by
 | (1) |
Nowadays, the CV selection deeply relies on how we understand the reaction of interest based on chemical insights. Various methods have been proposed to efficiently extract suitable CVs for a given reaction. Most of them employ mathematical analysis of metastable state fluctuations26 or MD trajectories.27 When it comes to surface reactions, many bonds can be affected due to the interaction between the adsorbates and the surface. As a consequence, choosing bonds responsible for the free energy change is a non-trivial task. Haas et al. tried to understand biochemical reactions by calculating individual atom free energy contributions along the reaction path.28 As bond distances frequently serve as CVs, the bond free energy contribution is a better descriptor than the atomic one. Therefore, we suggest a protocol which analyses individual bond free energy contributions by utilizing the information of free energy gradients (FEGs) along the reaction path and further guides the CV selection in the current work. The elementary step of CO oxidation on the Pt(111) surface is chosen and tested for the following reasons. This reaction is perhaps the most typical model surface reaction. As one of the noxious pollutants resulting from power generation and automobiles, it is necessary to remove CO. Catalytic CO oxidation as an a posteriori process answers the demands for environmentally friendly technology in today's society.29–31 Among the steps in the overall process, the elementary step from the co-adsorbed CO and O to the adsorbed CO2 is arguably the most important one, the chemical equation for which is
| CO* + O* → CO2* | (2) |
2. Computational methods
2.1 Electronic structure calculation and molecular dynamics simulations
All electronic structure calculations were performed using the Vienna Ab initio Simulation Package (VASP)36 in the framework of DFT at the level of generalized gradient approximation (GGA) applying the Perdew–Burke–Ernzerhof (PBE)37 functional. The projector-augmented-wave (PAW)38 pseudopotential with a kinetic energy cut-off of 400 eV was adopted to describe core-electrons, which is the largest among the three elements in the system (400 eV for O). The first order Methfessel–Paxton39 scheme was used with a smearing width of 0.2 eV. The Brillouin zone was sampled using a 12 × 12 × 12 Gamma-centred k-points scheme40 for Pt bulk and 4 × 4 × 1 for the Pt(111) surface. The optimized lattice length of the FCC Pt bulk is 3.97 Å which is close to the experimental result of 3.91 Å.41 The Pt(111) surface model was constructed as a four-layer p(2 × 2) unit cell with a ∼12 Å vacuum slab along the Z direction. The bottom two layers were frozen during all ionic position updates. For geometric optimizations, all the forces on flexible atoms were minimized to less than 0.05 eV Å−1.The Born–Oppenheimer MD (BOMD) was used for AIMD simulations. Adsorbates and the top two layers were updated using the Verlet algorithm with a timestep of 1.0 fs, coupled with the Nosé–Hoover42 thermostat to maintain the target temperature of 300 K. Thus, the free energy mentioned below is the Helmholtz free energy corresponding to the NVT ensemble. The standard brute-force MD and enhanced sampling methods including the CMD and the US were realized using the code Bucko implemented in the VASP.43 For the CMD, each structure was first equilibrated for 0.5 ps and later 3 ps to average the FEG. The block average algorithm44 was used to assess the statistical uncertainty of the FEG, which is implemented by Spencer.45 The integration of FEGs was performed simply using the trapezoidal method. In the US, the Gaussian function was taken as the biasing potential with a height of −5.0 eV and a width of 0.5 Å. The samples were collected during a 3 ps simulation after a 0.5 ps equilibration. The code of the WHAM46 analysis used to reconstruct the PMF was developed by Grossfield.47 For free energy calculations along the path-CV, our homemade code was utilized to carry out the US along the path-CV according to velocities and forces given by the VASP. Two components of the bond referred path-CV s and z took the form of48
 | (3) |
 | (4) |
2.2 Protocol of the free energy decomposition
In order to understand the reaction from the free energy perspective, we put forward a protocol which decomposes the total free energy change into the free energy contribution of individual bonds. This method can be readily transferred to other surface reactions because it utilizes the advantage of the CMD and begins with the transition state (TS) on the PES. More details will be provided by applying it to the reaction of the CO oxidation on the Pt(111) surface below. The procedure is organized as follows:(i) Find the TS on the PES with frequently used search methods such as the constrained optimization49,50 or the nudged elastic band (NEB) method.51 Refine the above TS to the one at the target temperature according to the FEG given by the CMD.52 The FEG on this CV should be minimized to a threshold near zero.
(ii) Generate the reaction path by using the brute-force MD starting from the TS forwards and backwards to the final state (FS) and the initial state (IS), respectively. The outcome path intrinsically comprises the reaction environment change due to the finite temperature including the surface relaxation.
(iii) Carry out the CMD on selected equidistance structures along the reaction path to obtain individual bond free energy changes, which guides the selection of CVs for various stages of the reaction. Later, enhanced sampling methods can be performed to acquire better interpretable PMFs along selected CVs.
3. Results and discussion
3.1 Potential energy profile of the CO oxidation on the Pt(111) surface
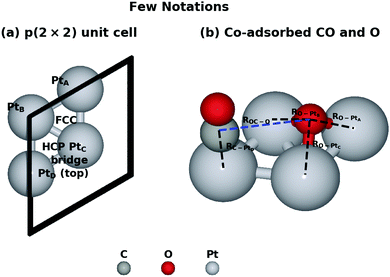
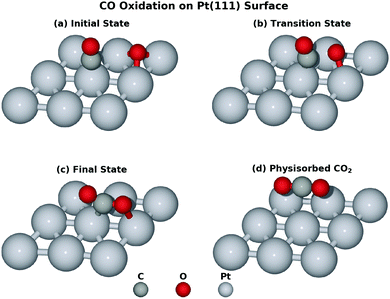
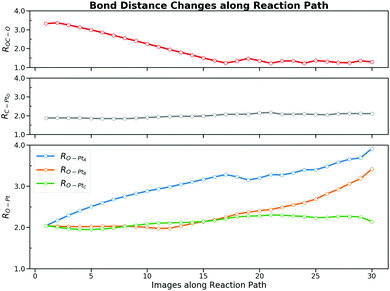
We started our investigation by calculating the potential energy profile of the CO oxidation on Pt(111). To better understand the reaction, here we recap the structure characteristics of the Pt(111) surface. Fig. 1 denotes a few adsorption states and key bond distances used in our work. There are four adsorption sites on the surface, namely the hexagonal close packed (HCP) site, the face centred cubic (FCC) site, the bridge site and the top site. The IS with the lowest potential energy is that CO is on the top site while O co-adsorbs on the FCC site in the p(2 × 2) unit cell.This reaction is driven by the interaction between the co-adsorbed CO and O and Fig. 2 shows four key structures during the reaction. Beginning from the co-adsorbed IS, O moves to the bridge site which provides the opportunity for CO to interact with O. The TS is located at the HCP site where CO weakly bonds to O. Finally, the formed CO2 will move from HCP site to the bridge site, which then desorbs into the gas phase. Intuitively, the distance of the forming OC–O bond (ROC–O) can serve as the CV. However, microscopically, several bonds are generated and cleaved consecutively due to the interaction between the adsorbates and the surface. It may be inappropriate to attribute all of the free energy change to the sole ROC–O change and the interpretation of this reaction may not be completely convincing without taking other bonds into consideration. Obviously, ROC–O changes explicitly but the other four bonds also vary during the whole reaction. RO–PtA and RO–PtB have to elongate until these two bonds break when O moves from the FCC site to the top site at PtC. If the CO2 finally desorbs, RO–PtC will also change. In addition, CO is restricted by the C–PtD bond around the top site, which varies to allow C to interact with O during the whole reaction.
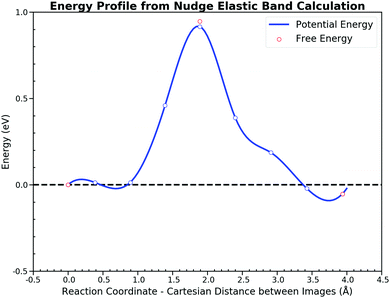
Then we calculated the potential energy changes along the path, starting with the co-adsorbed CO and O and ending with the adsorbed CO2. Fig. 3 illustrates the potential energy profile along the minimum energy path (MEP) via nudged elastic band (NEB)51 calculations. Direct thermo-corrections were applied to estimate the corresponding free energies at 300 K (the mathematical formula of which can be found in the ESI† S1). Since AIMD here does not retrieve the nuclear quantum effect, the zero point energy is excluded from the free energy correction for the further comparison. The potential energy barriers are similar to those reported in recent articles,34,53 which assures the accuracy of the electronic structure calculation setting in this study. The reaction process has a forward potential energy barrier of 0.92 eV and 0.97 eV for the backward step while free energy barriers are 0.95 eV and 1.00 eV, respectively. The energy profile is almost symmetrical except for the turning point located in the last half reaction, where the process of the CO2 rotation from the HCP site to the bridge site takes place.
3.2 Potential of mean force along the OC–O bond distance
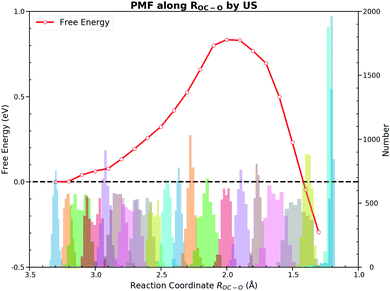
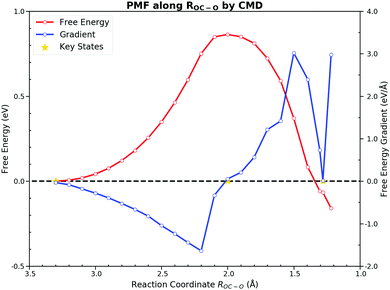
Towards the free energy calculation of this reaction, we accomplished the US and the CMD by taking ROC–O as the CV first. These two methods are most frequently used to calculate the PMF in the AIMD. Both methods sampled ROC–O from 3.3 Å to 1.2 Å with an interval of 0.1 Å. Detailed FEGs with their standard errors from the CMD and free energies with errors of the US are listed in ESI† S3.The US gives a forward free energy barrier of 0.83 eV, which is about 0.1 eV lower than the direct thermodynamically corrected results 0.95 eV. In the thermodynamic corrections the harmonic approximation is used, while the US actually samples all the dynamic motions at the finite temperature. The deviation between these two values can be attributed to the existence of anharmonicities in the system.54 Although the free energy curve seems smooth, the sampling along ROC–O from the TS to the FS appears to be peculiar. For the PMF from the US, the FS has a much lower free energy as shown in Fig. 4. Since the US estimates the free energy from the relative probability of sampled CV values, we cannot determine the stable states on the FES when unaware of the FEGs. The ROC–O in the optimized adsorbed CO2 on the PES is 1.290 Å, and the ROC–O in the FS on the FES is expected to be about 1.3 Å. However, the histogram of samples from the US illustrates that the number of samples at 1.3 Å is significantly lower than those in other regions. As its barrier is about 0.2 eV,55 the desorption of chemisorbed CO2 over the bridge site can be easily observed within few hundred MD steps at 300 K depending on the initial structure and velocities. Meanwhile, the restraining potential was only applied to the reacting OC–O bond while the C–PtD and O–PtC bonds that anchor the molecule on the surface are rather flexible in our simulations, and CO2 would form readily and fleet into the gas phase during the simulations initiated from the structure with the ROC–O between 1.2 Å and 1.4 Å. As a consequence, the most samples with ROC–O of about 1.3 Å are contributed by CO2 in the gas phase, which unlikely describe the behavior of the adsorbed CO2. The FS with the free energy of −0.42 eV is actually the gas CO2 ensemble. Moreover, the interpretation of the reaction based on ROC–O is ambiguous, which will be discussed below.
On the other hand, the CMD presents a similar PMF to the one obtained from the US by integrating FEGs at sample points with a little larger forward free energy barrier of 0.86 eV and the backward free energy barrier of 0.92 eV. The FEG decreases linearly with the decrease of ROC–O from 3.3 Å to 2.2 Å but suddenly drops to zero with only 0.2 Å reduction in ROC–O. Moreover, intermediate states on the FES should have zero FEG which is analogous to the case of the PES.56 The requirement of the zero FEG for intermediate states indicates that key states of the reaction can be located along ROC–O, which is 3.3 Å, 2.0 Å and 1.28 Å for the IS, the TS and the FS, respectively. Fig. 5 illustrates the PMF with the key states marked. The abnormally large FEG at 1.2 Å is the result of the large tension of the C–O bond in the gas CO2. From the structures sampled in the CMD simulations, we find that CO2 could feasibly rotate from the HCP site to the bridge site when ROC–O is smaller than 1.5 Å. Thus, the collected samples after the TS can be classified into two categories. When ROC–O is between 1.5 Å and 2.0 Å, most samples are the OC–O complex over the HCP site. For ROC–O being smaller than 1.5 Å, adsorbed CO2 on the bridge site constitutes the majority of samples. Although the CMD gives a better performance in describing the FS than the US, the samples collected in simulations from the two categories imply the deficiency of ROC–O in understanding this reaction.
3.3 Collective variable selection by the free energy decomposition
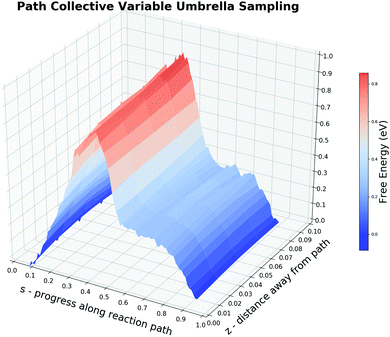
The incapability of describing the adsorbed CO2 state implies that ROC–O alone may not be the most suitable CV. But it is extremely time-consuming to test whether a structural parameter does contribute to the reaction free energy change rather than fluctuations caused by its periodic thermal vibration. To demonstrate the protocol of the CV selection by the free energy decomposition along the reaction path, we first tested the first two steps in Section 2.2. The MEP of the CO oxidation displays that there are two bonds (RO–PtA, RO–PtB) cleaved and one bond (ROC–O) formed during the reaction. Two additional bonds (RC–PtD, RO–PtC) are constantly being adjusted during the entire reaction. When O is close to CO, the O–PtD bond distance also becomes smaller. While the smallest distance during the reaction is always larger than 2.7 Å, we suggest that the change in this bond will not affect the free energy change. Besides, one may assume that the change in the triple bond of CO could also influence the reaction. Hence, we performed an on-the-fly FEG analysis on this bond which shows a synchronous change in the FEG and the bond distance (see the ESI† S4 for a discussion). Our result shows that the firstly mentioned five bonds could contribute to the free energy change in the current system.Before carrying out the free energy decomposition, we utilized the path-CV to evaluate the effectiveness of the reaction path generated above. With the difficulty in free energy calculations along multi-CVs by enhanced sampling methods due to the unaffordable computing time, it is easy for one to utilize the path-CV to comprise plentiful CVs. From the obtained brute-force MD trajectory, we selected 30 equidistant structures with a smoothing parameter λ of 100 Å−2 to form the path-CV including the above five bond distances as its components. To sample structures around the reaction path, harmonic potentials with the spring constant of 500 eV and 80 eV are used to restrain the path-CV s at certain values between 0 and 1 and z at 0.05, respectively. Fig. 6 shows the 2-D free energy landscape from the co-adsorbed CO and O to the adsorbed CO2 by the US and also the projected PMF along s. The PMF from the IS to the TS is really similar to ones from the US and the CMD along the sole ROC–O, which yields a forward free energy barrier of 0.87 eV and the backward energy of 0.92 eV. The obvious difference lies in the region s between 0.5 to 0.7. Unlike the monotonic lowering of the free energy in ROC–O from the US simulations, there is a plateau indicating the distinct behavior between the PES and the 300 K-FES. The reason for this is the rotation from the loosely bonded CO and O with a ROC–O of about 1.3 Å passing the TS to the stabilized bent CO2 as the FS. The outcome 2-D free energy landscape not only demonstrates the effectiveness of the brute-force MD trajectory but also captures the rotation process.
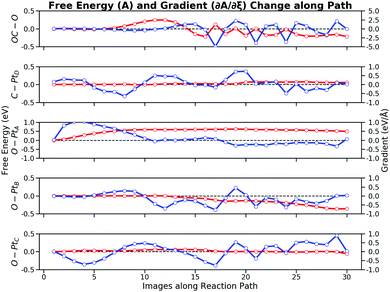
The free energy contribution of each bond is integrated from the FEG along the reaction path. Fig. 8 illustrates the free energy changes and the FEG, respectively. The free energy changes combine the information from both the bond distance changes and the FEG. These curves show that the entire reaction can be divided into four stages: (i) the O–PtA bond activation with the bond increase; (ii) the repulsive interaction between CO and O with the decrease of the OC–O bond; (iii) the attractive interaction between CO and O with the further decrease of the OC–O bond; and (iv) the second O–PtB activation with the just formed CO2 rotation. The individual bond contribution to the total free energy changes is apparent from the free energy changes along the bond by integrating the FEG. It can be seen from both the bond distance changes and the free energy contribution that the CO oxidation reaction is ignited by the first O–PtA activation. When the image number N ∈ [1, 8], O would crawl from the FCC site to the bridge site by overcoming a free energy barrier of 0.60 eV. After the O–Pt bond increases to 2.7 Å, O is close enough to interact with CO, which is reflected by the increasing free energy of 0.24 eV from ∂A/∂ROC–O for N ∈ [8, 12]. The second stage ends with the CO getting through the repulsive region to form a roughly bonded OC–O. These results demonstrate that the major difficulty in the CO oxidation is the O self-activation (0.60 eV). The total forward free energy barrier of 0.84 eV calculated by the path-CV US can be mostly attributed to the RO–PtA (0.60 eV) and the ROC–O (0.24 eV). After the TS, CO and O is getting closer which is in the region N ∈ [12, 15], during which the OC–O bond becomes attractive, thus lowering the free energy by 0.45 eV. At this stage, the ROC–O of about 1.3 Å indicates that CO2 can be considered to have been formed. Then the second activation of the O–PtB bond as in N∈ [15, 30] pushes CO2 to move from the HCP site to the bridge site. This activation is a relatively long process and lasts for almost 15 images, which lowers the free energy of 0.36 eV. During the long rotation process, the OC–O bond does not contribute considerably to the free energy changes because of its periodic stretching. As discussed above, the OC–O bond attraction lowers the free energy by 0.45 eV larger than that of the O–PtB activation (0.36 eV), which will dominate the reverse process of the CO oxidation i.e. the CO2 activation. In addition, the C–PtD bond and the O–PtC bond have no significant effect on the CO oxidation process: their free energy contributions are at a magnitude of 0.05 eV.
3.4 Further verification on the collective variable selection
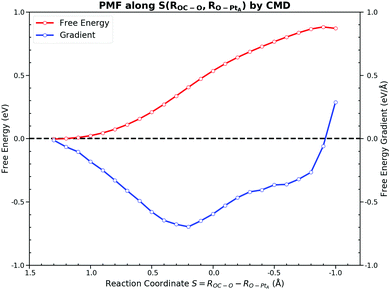
The free energy decomposition analysis guided us to include ROC–O and RO–PtA to describe the process before the TS while ROC–O and RO–PtB after the TS. The whole free energy decomposition pattern shows that only a few bonds contribute to the free energy changes at different stages of the reaction. The FEG of active bonds are evaluated under the conditions that other inactive bonds are constrained at the same time, which may underestimate the influence of the changes in those bonds. Although the four stages can be recognized from the free energy decomposition, it is difficult to accurately sample individual bonds for each stage. Recently, Hovan et al. suggested that this problem could be simplified by using the path-CV made up of weighted CVs.62 The method requires the weight coefficients of CV along the reaction progress to incorporate a multidimensional CV into one weighted path-CV. Despite its potential in capturing CV significance in driving the dynamics, it could be computationally intensive for obtaining these weights, and thus expensive for the AIMD. For simplicity, we only divided this elementary reaction into two parts which are separated by the TS, in which the CMD was performed along the CV by combining the indispensable bonds discussed above.For the process from the IS to the TS, we took the linear combination of two bond distances S(ROC–O, RO–PtA), which incorporates the influence of these two bonds. RO–PtA is used to describe the process of the O–PtA bond activation while ROC–O is used for the interaction between CO and O near the TS. Fig. 9 shows the PMF along the selected CV. In this PMF, the near zero FEGs indicate that the IS is at S = 1.3 Å and the TS is at S = −0.9 Å. It gives a forward free energy barrier of 0.87 eV, which is similar to the ones obtained for other CVs. The output FEG decreases gradually with the increase of S(ROC–O, RO–PtA) and reduces mildly to zero, which is much smoother than those generated along the sole ROC–O. Although the interaction between the adsorbates and the surface is reflected by samples implicitly no matter what CV is used, the CV should still be chosen carefully to better describe the surface relaxation, which is the major difference from gas reactions. In the CMD along the linear combination CV S(ROC–O, RO–PtA), there are no constraints applied on its components. Unlike the OC–O bond with a fixed length which will restrict the relaxation of the surface in the CMD along ROC–O, samples from the CMD along S(ROC–O, RO–PtA) on the much more flexible surface will be collected in the simulations.
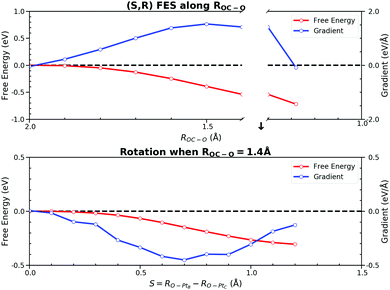
The process after the TS becomes a little complicated due to the rotation process of CO2 from the HCP site to the bridge site. We utilized two CVs, ROC–O and S(RO–PtB, RO–PtC). ROC–O was used to describe the attractive interaction between C and O after the TS and the changes in S(RO–PtB, RO–PtC) can capture the rotation process. The resulting PMF and the FEGs are shown in Fig. 10. Checked by the CMD in advance, there are two metastable states where FEGs equal zero on this 2-D (S,R) FES, namely the TS at (0.0, 2.0) and the FS at (1.20, 1.28). The FEG indicates that the rotation, i.e. the increase in S(RO–PtB, RO–PtC), may encounter a small energy barrier when ROC–O is larger than 1.4 Å (see ESI† S6). In addition, a few CMD simulations show that CO2 on the HCP site can desorb readily when RC–O is 1.3 Å. It is clear from our results that the OC–O complex is still bonded with the surface until ROC–O is 1.4 Å. Then it goes through the rotation which is represented by the changes in S(RO–PtB, RO–PtC) from 0.0 Å to 1.2 Å while maintaining ROC–O, and finally forms the adsorbed CO2 with ROC–O of 1.28 Å. The free energy changes of the above process were computed from the integral as
 | (5) |
The free energy change due to S(RO–PtB, RO–PtC) is −0.30 eV, which is similar to the C–PtB bond free energy contribution of −0.36 eV from the free energy decomposition analysis in Section 3.3. The total free energy contribution in ROC–O is −0.72 eV, which can be separated into −0.54 eV and −0.18 eV due to the change in ROC–O before and past the rotation. Thus, the backward free energy barrier is summed as 1.02 eV (0.30 eV + 0.72 eV). Although the value of the free energy is similar to above PMFs using other CVs, the 2-D FES is proved to be better at describing the rotation process. The standard errors of FEGs and information about other sampled points can be found in the ESI† S7.
Having thoroughly tested various choices of CVs and enhanced sampling methods, we are in the position to make general discussions. Since most free energy calculation methods are path-based and require a predefined collective variable, the protocol we devised above is able to guide the CV selection by quantifying the free energy contributions of various bonds especially for surface reactions. For the CO oxidation on the Pt(111) surface at 300 K, the free energy changes along various CVs are very similar. However, the interpretability of the reaction largely depends on the CV used in the free energy calculations. To determine free energy barriers of this reaction swiftly by the AIMD, we suggest to sample ROC–O with the CMD. This choice gives a fair estimation of free energy changes if the collected structures are taken care of when the simulation comes close to the FS. In addition, the CMD assures the existence of local minima and saddle points on the FES by checking the FEG. On the other hand, the US requires much care in determining the CV sampling range with a prior knowledge of the IS and the FS. To effectively obtain the reaction path, our results suggest the use of S(ROC–O, RO–PtA) before the TS and ROC–O in tandem with S(RO–PtB, RO–PtC) after the TS. These CVs will be much helpful for investigating the different reaction stages when the catalyst surface varies, which will provide fruitful insights into the tuning of the catalytic process. For the reaction with CVs entangled, our work shows that a path-CV is needed, which may be computationally intensive.
4. Conclusion
In this work, we have revisited the model catalytic reaction, CO oxidation on the Pt(111) surface, for heterogeneous catalysis at 300 K with enhanced sampling methods including the US and the CMD. Various choices of CVs for this reaction were tested, namely bond distances, their linear combinations and the path-CV. We found that the PMF along ROC–O is not enough for understanding the whole reaction although it generates similar free energy values to that of others. To further select essential CVs for the free energy calculations, we proposed a method to quantify bond contributions on the reaction path extracted from brute-force MD trajectories initiated from the TS on the FES at the finite temperature. Before carrying out the free energy decomposition, the path-CV was utilized to construct the free energy landscape of this reaction by taking five bonds (ROC–O, RC–PtD, RO–PtA, RO–PtB, RO–PtC) into consideration, which assesses the reaction path from a selected brute-force MD trajectory. As a significant step in the CV selection, the free energy decomposition analysis showed that ROC–O and RO–PtA are responsible for the forward free energy barrier while ROC–O and RO–PtB for the backward energy barrier. The further assessment on S(ROC–O, RO–PtA) for the first half reaction while ROC–O and S(RO–PtB, RO–PtC) for the second yields fair estimations of free energy barriers and captures the various reaction stages. Regarding the free energy contributions, the O–PtA bond is the determined step for the CO oxidation while the OC–O bond is for the reverse process. These new insights into the CO oxidation could also advance the free energy calculation of carbon oxides reactions on noble metal catalysts. Above all, this reaction path based on free energy decomposition for the CV selection is remarkably feasible for the field of heterogeneous catalysis because it all starts from the TS on the PES.Conflicts of interest
There are no conflicts to declare.Acknowledgements
We are grateful for the computational support from the UK national high performance computing service, ARCHER, for which access was obtained via the UKCP consortium and funded by EPSRC grant ref. EP/P022561/1. We are grateful to the UK Materials and Molecular Modelling Hub for computational resources, which is partially funded by EPSRC (EP/P020194/1). We thank Chenxi Guo, Peter Price and Chenggong Hui for fruitful discussions. Jiayan Xu and Hao Huang thanks the Queen's University Belfast and China Scholarship Council for financial support.Notes and references
- X.-M. Cao, R. Burch, C. Hardacre and P. Hu, An Understanding of Chemoselective Hydrogenation on Crotonaldehyde over Pt(111) in the Free Energy Landscape: The Microkinetics Study based on First-principles Calculations, Catal. Today, 2011, 165(1), 71–79 CrossRef CAS.
- Z. Wang, X. M. Cao, J. Zhu and P. Hu, Activity and Coke Formation of Nickel and Nickel Carbide in Dry Reforming: A Deactivation Scheme from Density Functional Theory, J. Catal., 2014, 311, 469–480 CrossRef CAS.
- X. Sun, P. Wang, Z. Shao, X. Cao and P. Hu, A First-principles Microkinetic Study on the Hydrogenation of Carbon Dioxide over Cu(211) in the Presence of Water, Sci. China: Chem., 2019, 62(12), 1686–1697 CrossRef CAS.
- C. J. Cramer, Essentials of Computational Chemistry: Theories and Models, John Wiley & Sons Ltd, 2nd edn, 2004 Search PubMed.
- L. Foppa, M. Iannuzzi, C. Copéret and A. Comas-Vives, CO Methanation on Ruthenium Flat and Stepped Surfaces: Key Role of H-transfers and Entropy Revealed by Ab Initio Molecular Dynamics, J. Catal., 2019, 371, 270–275 CrossRef CAS.
- X. Zeng, Z. Qiu, P. Li, Z. Li and J. Yang, Steric Hindrance Effect in High-Temperature Reactions, CCS Chem., 2020, 460–467 Search PubMed.
- T. Cheng, H. Xiao and W. A. Goddard III, Free-Energy Barriers and Reaction Mechanisms for the Electrochemical Reduction of CO on the Cu(100) Surface, Including Multiple Layers of Explicit Solvent at pH 0, J. Phys. Chem. Lett., 2015, 6(23), 4767–4773 CAS.
- T. Cheng, H. Xiao and W. A. Goddard III, Full Atomistic Reaction Mechanism with Kinetics for CO Reduction on Cu(100) from Ab Initio Molecular Dynamics Free-energy Calculations at 298 K, Proc. Natl. Acad. Sci. U. S. A., 2017, 114(8), 1795–1800 CrossRef CAS.
- K. Klyukin and V. Alexandrov, CO2 Adsorption and Reactivity on Rutile TiO2(110) in Water: An Ab Initio Molecular Dynamics Study, J. Phys. Chem. C, 2017, 121(19), 10476–10483 CrossRef CAS.
- D. Wang, T. Sheng, J. Chen, H.-F. Wang and P. Hu, Identifying the Key Obstacle in Photocatalytic Oxygen Evolution on Rutile TiO2, Nat. Catal., 2018, 1(4), 291–299 CAS.
- J. J. Sun and J. Cheng, Solid-to-liquid Phase Transitions of Sub-nanometer Clusters Enhance Chemical Transformation, Nat. Commun., 2019, 10(1), 5400 CrossRef.
- H. Guo, P. Sautet and A. N. Alexandrova, Reagent-Triggered Isomerization of Fluxional Cluster Catalyst via Dynamic Coupling, J. Phys. Chem. Lett., 2020, 11(8), 3089–3094 CrossRef CAS.
- C. Guo, Z. Wang, D. Wang, H.-F. Wang and P. Hu, First-Principles Determination of CO Adsorption and Desorption on Pt(111) in the Free Energy Landscape, J. Phys. Chem. C, 2018, 122(37), 21478–21483 CrossRef CAS.
- R. Réocreux, C. Michel, P. Fleurat-Lessard, P. Sautet and S. N. Steinmann, Evaluating Thermal Corrections for Adsorption Processes at the Metal/Gas Interface, J. Phys. Chem. C, 2019, 123(47), 28828–28835 CrossRef.
- E. A. Carter, G. Ciccotti, J. T. Hynes and R. Kapral, Constrained Reaction Coordinate Dynamics for the Simulation of Rare Events, Chem. Phys. Lett., 1989, 156(5), 472–477 CrossRef CAS.
- G. M. Torrie and J. P. Valleau, Nonphysical Sampling Distributions in Monte Carlo Free-Energy Estimation: Umbrella Sampling, J. Comput. Phys., 1977, 23(2), 187–199 CrossRef.
- J. Kästner, Umbrella Sampling, Wiley Interdiscip. Rev.: Comput. Mol. Sci., 2011, 1(6), 932–942 Search PubMed.
- A. Laio and M. Parrinello, Escaping Free-energy Minima, Proc. Natl. Acad. Sci. U. S. A., 2002, 99(20), 12562–12566 CrossRef CAS.
- A. Barducci, M. Bonomi and M. Parrinello, Metadynamics, Wiley Interdiscip. Rev.: Comput. Mol. Sci., 2011, 1(5), 826–843 CAS.
- E. Darve and A. Pohorille, Calculating Free Energies using Average Force, J. Chem. Phys., 2001, 115(20), 9169–9183 CrossRef CAS.
- C. Chipot and A. Pohorille, Free Energy Calculations: Theory and Applications in Chemistry and Biology, Springer-Verlag, Berlin Heidelberg, 2007 Search PubMed.
- E. Darve, D. Rodriguez-Gomez and A. Pohorille, Adaptive Biasing Force Method for Scalar and Vector Free Energy Calculations, J. Chem. Phys., 2008, 128(14), 144120 CrossRef.
- P. P. Kumar, A. G. Kalinichev and R. J. Kirkpatrick, Dissociation of Carbonic Acid: Gas Phase Energetics and Mechanism from Ab Initio Metadynamics Simulations, J. Chem. Phys., 2007, 126(20), 204315 CrossRef.
- D. Branduardi, F. L. Gervasio and M. Parrinello, From A to B in Free Energy Space, J. Chem. Phys., 2007, 126(5), 054103 CrossRef.
- D. Branduardi, M. De Vivo, N. Rega, V. Barone and A. Cavalli, Methyl Phosphate Dianion Hydrolysis in Solution Characterized by Path Collective Variables Coupled with DFT-Based Enhanced Sampling Simulations, J. Chem. Theory Comput., 2011, 7(3), 539–543 CrossRef CAS.
- D. Mendels, G. Piccini and M. Parrinello, Collective Variables from Local Fluctuations, J. Phys. Chem. Lett., 2018, 9(11), 2776–2781 CrossRef CAS.
- S. R. Hare, L. A. Bratholm, D. R. Glowacki and B. K. Carpenter, Low Dimensional Representations along Intrinsic Reaction Coordinates and Molecular Dynamics Trajectories using Interatomic Distance Matrices, Chem. Sci., 2019, 10(43), 9954–9968 RSC.
- K. Haas and J. W. Chu, Decomposition of Energy and Free Energy Changes by Following the Flow of Work along Reaction Path, J. Chem. Phys., 2009, 131(14), 144105 CrossRef.
- A. Alavi, P. Hu, T. Deutsch, P. L. Silvestrelli and J. Hutter, CO Oxidation on Pt(111): An Ab Initio Density Functional Theory Study, Phys. Rev. Lett., 1998, 80(16), 3650–3653 CrossRef CAS.
- I. Chorkendorff and J. W. Niemantsverdriet, Concepts of Modern Catalysis and Kinetics, Wiley-VCH Verlag GmbH & Co. KGaA, 2003 Search PubMed.
- Z. Wang and P. Hu, Identifying the General Trend of Activity of Non-stoichiometric Metal Oxide Phases for CO Oxidation on Pd(111), Sci. China Chem., 2019, 62(6), 784–789 CrossRef CAS.
- K. Bleakley and P. Hu, A Density Functional Theory Study of the Interaction between CO and O on a Pt Surface-: CO/Pt(111), O/Pt(111), and CO/O/Pt(111), J. Am. Chem. Soc., 1999, 121(33), 7644–7652 CrossRef CAS.
- C. J. Zhang and P. Hu, Why Must Oxygen Atoms Be Activated from Hollow Sites to Bridge Sites in Catalytic CO Oxidation?, J. Am. Chem. Soc., 2000, 122(9), 2134–2135 CrossRef CAS.
- L. Zhou, A. Kandratsenka, C. T. Campbell, A. M. Wodtke and H. Guo, Origin of Thermal and Hyperthermal CO2 from CO Oxidation on Pt Surfaces: The Role of Post-Transition-State Dynamics, Active Sites, and Chemisorbed CO2, Angew. Chem., Int. Ed., 2019, 58(21), 6916–6920 CrossRef CAS.
- Q. Wu, L. Zhou and H. Guo, Steric Effects in CO Oxidation on Pt(111) by Impinging Oxygen Atoms Lead to an Exclusive Hot Atom Mechanism, J. Phys. Chem. C, 2019, 123(16), 10509–10516 CrossRef CAS.
- G. Kresse and J. Furthmüller, Efficiency of Ab-initio Total Energy Calculations for Metals and Semiconductors using a Plane-wave Basis Set, Comput. Mater. Sci., 1996, 6(1), 5–50 CrossRef.
- J. P. Perdew, K. Burke and M. Ernzerhof, Generalized Gradient Approximation Made Simple, Phys. Rev. Lett., 1996, 77(18), 3865–3868 CrossRef CAS.
- G. Kresse and D. Joubert, From Ultrasoft Pseudopotentials to the Projector Augmented-wave Method, Phys. Rev. B: Condens. Matter Mater. Phys., 1999, 59(3), 1758–1775 CAS.
- M. Methfessel and A. T. Paxton, High-precision Sampling for Brillouin-zone Integration in Metals, Phys. Rev. B: Condens. Matter Mater. Phys., 1989, 40(6), 3616–3621 CrossRef CAS.
- H. J. Monkhorst and J. D. Pack, Special Points for Brillouin-zone Integrations, Phys. Rev. B: Solid State, 1976, 13(12), 5188–5192 CrossRef.
- W. P. Davey, Precision Measurements of the Lattice Constants of Twelve Common Metals, Phys. Rev., 1925, 25(6), 753–761 CrossRef CAS.
- H. A. Posch, W. G. Hoover and F. J. Vesely, Canonical Dynamics of the Nosé Oscillator: Stability, Order, and Chaos, Phys. Rev. A: At., Mol., Opt. Phys., 1986, 33(6), 4253–4265 CrossRef.
- T. Bucko, Ab Initio Calculations of Free-energy Reaction Barriers, J. Phys.: Condens. Matter, 2008, 20(6), 064211 CrossRef CAS.
- H. Flyvbjerg and H. G. Petersen, Error Estimates on Averages of Correlated Data, J. Chem. Phys., 1989, 91(1), 461–466 CrossRef CAS.
- Spencer, J. Pyblock, https://github.com/jsspencer/pyblock/blob/master/docs/index.rst, accessed Feburary 28.
- S. Kumar, D. Bouzida, R. H. Swendsen, P. A. Kollman and J. M. Rosenberg, The Weighted Histogram Analysis Method for Free-Energy Calculations on Biomolecules. I. The Method, J. Comput. Chem., 1992, 13(8), 1011–1021 CrossRef CAS.
- Grossfield, A. WHAM: the Weighted Histogram Analysis Method Version 2.0.9.1, http://membrane.urmc.rochester.edu/wordpress/?page_id=126, accessed Feburary 20.
- K. Zinovjev, S. Martí and I. Tuñón, A Collective Coordinate to Obtain Free Energy Profiles for Complex Reactions in Condensed Phases, J. Chem. Theory Comput., 2012, 8(5), 1795–1801 CrossRef CAS.
- A. Michaelides and P. Hu, Catalytic Water Formation on Platinum: A First-Principles Study, J. Am. Chem. Soc., 2001, 123(18), 4235–4242 CrossRef CAS.
- Z.-P. Liu and P. Hu, General Rules for Predicting Where a Catalytic Reaction Should Occur on Metal Surfaces: A Density Functional Theory Study of C-H and C-O Bond Breaking/Making on Flat, Stepped, and Kinked Metal Surfaces, J. Am. Chem. Soc., 2003, 125(7), 1958–1967 CAS.
- G. Henkelman and H. Jónsson, Improved Tangent Estimate in the Nudged Elastic Band Method for Finding Minimum Energy Paths and Saddle Points, J. Chem. Phys., 2000, 113(22), 9978 CrossRef CAS.
- S.-Y. Yang, I. Hristov, P. Fleurat-Lessard and T. Ziegler, Optimizing the Structures of Minimum and Transition State on the Free Energy Surface, J. Phys. Chem. A, 2005, 109(1), 197–204 CrossRef CAS.
- X.-M. Cao, Z.-J. Shao and P. Hu, A Fast Species Redistribution Approach to Accelerate the Kinetic Monte Carlo Simulation for Heterogeneous Catalysis, Phys. Chem. Chem. Phys., 2020, 22(14), 7348–7364 RSC.
- G. Collinge, S. F. Yuk, M.-T. Nguyen, M.-S. Lee, V.-A. Glezakou and R. Rousseau, Effect of Collective Dynamics and Anharmonicity on Entropy in Heterogenous Catalysis: Building the Case for Advanced Molecular Simulations, ACS Catal., 2020, 10, 9236–9260 CrossRef CAS.
- M. del Cueto, X. Zhou, L. Zhou, Y. Zhang, B. Jiang and H. Guo, New Perspectives on CO2–Pt(111) Interaction with a High-Dimensional Neural Network Potential Energy Surface, J. Phys. Chem. C, 2020, 124(9), 5174–5181 CrossRef CAS.
- P. Fleurat-Lessard and T. Ziegler, Tracing the Minimum-energy Path on the Free-energy Surface, J. Chem. Phys., 2005, 123(8), 084101 CrossRef.
- J. Xu, X.-M. Cao and P. Hu, Improved Prediction for the Methane Activation Mechanism on Rutile Metal Oxides by a Machine Learning Model with Geometrical Descriptors, J. Phys. Chem. C, 2019, 123(47), 28802–28810 CrossRef.
- L. Maragliano, A. Fischer, E. Vanden-Eijnden and G. Ciccotti, String Method in Collective Variables: Minimum Free Energy Paths and Isocommittor Surfaces, J. Chem. Phys., 2006, 125(2), 024106 CrossRef.
- A. C. Pan, D. Sezer and B. Roux, Finding Transition Pathways Using the String Method with Swarms of Trajectories, J. Phys. Chem. B, 2008, 112(11), 3432–3440 CrossRef CAS.
- C. Chen, Y. Huang and Y. Xiao, Free-energy Calculations along a High-dimensional Fragmented Path with Constrained Dynamics, Phys. Rev. E: Stat., Nonlinear, Soft Matter Phys., 2012, 86(3), 031901 CrossRef.
- C. Chen, Y. Huang, X. Ji and Y. Xiao, Efficiently Finding the Minimum Free Energy Path from Steepest Descent Path, J. Chem. Phys., 2013, 138(16), 164122 CrossRef.
- L. Hovan, F. Comitani and F. L. Gervasio, Defining an Optimal Metric for the Path Collective Variables, J. Chem. Theory Comput., 2019, 15(1), 25–32 CrossRef CAS.
Footnote |
| † Electronic supplementary information (ESI) available. See DOI: 10.1039/d0cp03852k |
| This journal is © the Owner Societies 2020 |

