 Open Access Article
Study of interactions between Brønsted acids and triethylphosphine oxide in solution by 31P NMR: evidence for 2![[thin space (1/6-em)]](https://www.rsc.org/images/entities/h2_char_2009.gif) :
:![[thin space (1/6-em)]](https://www.rsc.org/images/entities/h2_char_2009.gif) 1 species†
1 species†
Elisabet
Pires
 and
José M.
Fraile
 *
*
Instituto de Síntesis Química y Catálisis Homogénea (ISQCH), Facultad de Ciencias, CSIC-Universidad de Zaragoza, Pedro Cerbuna 12, E-50009 Zaragoza, Spain. E-mail: josem.fraile@csic.es
First published on 2nd October 2020
Abstract
The variation of the 31P chemical shift of triethylphosphine oxide in CDCl3 solution with a series of Brønsted acids at different molar ratios allows the determination of the value for the 1![[thin space (1/6-em)]](https://www.rsc.org/images/entities/char_2009.gif) :
:![[thin space (1/6-em)]](https://www.rsc.org/images/entities/char_2009.gif) 1 species (δ1
1 species (δ1![[thin space (1/6-em)]](https://www.rsc.org/images/entities/char_2009.gif) :
:![[thin space (1/6-em)]](https://www.rsc.org/images/entities/char_2009.gif) 1), which is much lower than the reported value at infinite dilution. This value correlates with the pKa of the acid in two zones, for acids stronger and weaker than TEPO–H+. The acid strength also controls the exchange rate in solution. The evolution of the chemical shift at high acid/TEPO molar ratios indicates the existence of a second TEPO–acid interaction, which is also dependent on the acid strength. This interaction is much more favorable in the case of a diacid, which shows chemical shift higher than expected for its pKa1 value.
1), which is much lower than the reported value at infinite dilution. This value correlates with the pKa of the acid in two zones, for acids stronger and weaker than TEPO–H+. The acid strength also controls the exchange rate in solution. The evolution of the chemical shift at high acid/TEPO molar ratios indicates the existence of a second TEPO–acid interaction, which is also dependent on the acid strength. This interaction is much more favorable in the case of a diacid, which shows chemical shift higher than expected for its pKa1 value.
Introduction
Triethylphosphine oxide (TEPO) was classically used as a probe molecule to characterize the electrophilic properties of solvents, taking advantage of its wide range of chemical shifts in 31P NMR spectroscopy due to the deshielding effect on phosphorus by inductive effect. This was the base of an empirical solvent parameter, known as Gutmann's acceptor number (AN),1 determined from the extrapolated chemical shift at infinite dilution of TEPO in the corresponding solvent. The phosphorus atom is not shielded by the positive charge, as it occurs in phosphines, making it highly sensitive to hydrogen bonding.2 Since then, this method has been employed to characterize liquids with acidic properties, such as boron compounds used as Lewis acid catalysts,3 and different types of ionic liquids with Brønsted4 or Lewis5,6 acidity, and phosphine oxides have been proposed as descriptors for halogen bonds.7 A similar methodology, taking the chemical shift at infinite dilution, has been applied for the determination of acidity by 13C NMR using mesityl oxide as the probe molecule.8The 31P NMR method with TEPO was soon adapted for the characterization of solids, creating a scale of global acidity.9 Although TEPO was initially used, in analogy with the AN determination, other trialkylphosphine oxides (PO), such as trimethylphosphine oxide (TMPO) or tributylphosphine oxide (TBPO), have also been utilized for this purpose, with the aim of getting information not only about acid strength, but also the acid type (Brønsted or Lewis), the location and the amount of acid sites.10,11
However, the deshielding effect on trialkylphosphine oxides is measured under very different conditions in both methods. In solution, the high dilution conditions and the extrapolation to calculate Gutmann's AN make the acid/PO ratio nearly ∞, considering the acid as a solvent, whereas on solids, the amount of PO used is close to or slightly below the stoichiometric 1![[thin space (1/6-em)]](https://www.rsc.org/images/entities/char_2009.gif) :
:![[thin space (1/6-em)]](https://www.rsc.org/images/entities/char_2009.gif) 1 ratio. Surprisingly, the studies of acids in solution under similar quasi-stoichiometric conditions are rather scarce.
1 ratio. Surprisingly, the studies of acids in solution under similar quasi-stoichiometric conditions are rather scarce.
Myers et al. characterized BF3, TMSOTf (trimethylsilyl triflate) and mixtures of both in CDCl3 by using TEPO in amounts from 0.25 equivalents to a slight excess over the Lewis acids.12 Several interesting features were observed, such as the presence of several species with different Lewis acidity and the rather slow exchange of TEPO, as the 31P signals for free and coordinated TEPO did not collapse into one single peak at room temperature.
Koito et al. have studied the acidity of different Lewis acids, mainly metal triflates and chlorides, in D2O with acid/TMPO molar ratios in the range of 0.5 to 8.13,14 Several catalysts did not show any important deshielding effect on TMPO, showing that most of the TMPO was not coordinated to the Lewis acid. On the contrary, Sc(OTf)3, In(OTf)3 and ScCl3 showed an important deshielding effect, which is in agreement with their higher catalytic activity in water. The number of signals and the line width at different acid/TMPO ratios were used to determine the rather slow exchange rates.
Very recently, Diemoz and Franz have used a TEPO 31P chemical shift to create a scale of the hydrogen-bond activating effect of different organocatalysts, including alcohols, phenols, silanols, carboxylic acids, ureas, phosphoric acids and boronic acids.15 In this case, a catalyst/TEPO molar ratio of 3 was consistently used to get the saturation 31P chemical shift value. However, this study was restricted to rather weak acids.
Thus, a fair comparison of the 31P chemical shifts of analogous homogeneous and heterogeneous catalysts is difficult. This is due to the very different conditions in which the 31P chemical shifts are measured. In this manuscript, we present our results of 31P NMR spectroscopy in solution with TEPO as a probe molecule and different Brønsted acids that can serve as homogeneous analogues of heterogeneous catalysts.
Experimental
Acetic acid (Acros, 99.8%), formic acid (Sigma-Aldrich, 98%), 2,2,2-trifluoroethanol (Fluorochem, 99%), phenylphosphonic acid (Acros, 98%), trifluoroacetic acid (Sigma-Aldrich, 99%), methanesulfonic acid (Sigma-Aldrich, 99.5%), p-toluenesulfonic acid (Sigma-Aldrich, 98.5%), trifluoromethanesulfonic acid (Fluka, 98%), dimethylmalonic acid (Aldrich, 98%) and α,α,α-trifluorotoluene (Alfa Aesar, 99%) were used without further purification. CDCl3 and methanol-d4 (Aldrich, 99.8% D) were kept at 4 °C and used as received. Triethylphosphine oxide (Aldrich, 99%) was kept and manipulated in a glove box under Ar.Preparation of the samples
In a 10 mL volumetric flask, a solution of 100 mg of TEPO in CDCl3 or MeOH-d4 was prepared and then treated with 4 Å molecular sieves for 24 h. For liquid acids, 1 mL of the TEPO solution was placed in an NMR tube, and the appropriate amount of acid was added using a micropipette. For solid acids, the exact amount of acid was weighed in a glass tube, and then 1 mL of the TEPO solution was added. The solution was then stirred until total acid dissolution. The solution was then placed in an NMR tube. In the case of triflic and trifluoroacetic acid samples, 31 μL of α,α,α-trifluorotoluene were also added as an internal standard. In all of the cases, the NMR tube was purged with Ar and the sample was allowed to equilibrate at room temperature before NMR recording.For the preparation of the adducts, a solution of 250 mg of TEPO in anhydrous CH2Cl2 or CH3OH was prepared in a 25 mL volumetric flask. Then, p-toluenesulfonic acid or phenylphosphonic acid was weighed in a 10 mL round bottom flask, and the adequate volume of TEPO solution was added. The solution was stirred under argon for 30 min, and the solvent was removed by vacuum distillation. Dried KBr was added to the viscous liquid, and the solid was placed in a 4 mm ZrO2 rotor.
NMR experiments
Solution NMR spectra were recorded at 300 K in a Bruker Avance 400 spectrometer equipped with a 5 mm QNP probe at resonance frequencies of 400.16, 161.99 and 376.49 MHz for 1H, 31P and 19F, respectively. 31P spectra (30° pulse 12 μs, 128 scans) were recorded under 1H decoupling, and referenced using the TEPO/CDCl3 solution as the external standard. 1H spectra (30° pulse 12.25 μs, 16 scans) were referenced with the residual CHCl3 signal (7.26 ppm) as the internal standard. 19F spectra (30° pulse 11 μs, 128 scans) were referenced with α,α,α-trifluorotoluene (−62.7 ppm) as the internal standard.Solid state NMR spectra were recorded in a Bruker Avance III WB400 spectrometer with 4 mm zirconia rotors spun at the magic angle in N2 at 10 kHz. 31P NMR spectra (64 scans) were recorded using a 31P π/2 pulse length of 4.3 μs, with a spinal-64 proton decoupling sequence of 5 μs pulse length, and 30 s recycle delay. Pulses and chemical shifts were calibrated with (NH4)H2PO4.
Results
Selection of acids, solvent and equilibration time
The objective of this study was to determine the chemical shift of the discrete isolated TEPO⋯H–A (1![[thin space (1/6-em)]](https://www.rsc.org/images/entities/char_2009.gif) :
:![[thin space (1/6-em)]](https://www.rsc.org/images/entities/char_2009.gif) 1) species in solution, and the possible existence of the species with other stoichiometries. A set of Brønsted acids (Table 1) was selected to cover a range of acidity as wide as possible, from acetic (AcOH) and formic acids as the weakest ones, phenylphosphonic (PhPO3H2) and trifluoroacetic (TFA) acids as moderately strong acids, and three sulfonic acids, methanesulfonic acid (MeSO3H), p-toluenesulfonic acid (pTosOH) and trifluoromethanesulfonic acid (triflic acid, TfOH) as the strongest ones. In fact, these strong acids would serve as models for different types of sulfonic solids used as heterogeneous catalysts, containing alkylsulfonic, arylsulfonic or perfluoroalkylsulfonic groups. 2,2,2-Trifluoroethanol (TFE) was also included as an example of an alcohol of high acidity.
1) species in solution, and the possible existence of the species with other stoichiometries. A set of Brønsted acids (Table 1) was selected to cover a range of acidity as wide as possible, from acetic (AcOH) and formic acids as the weakest ones, phenylphosphonic (PhPO3H2) and trifluoroacetic (TFA) acids as moderately strong acids, and three sulfonic acids, methanesulfonic acid (MeSO3H), p-toluenesulfonic acid (pTosOH) and trifluoromethanesulfonic acid (triflic acid, TfOH) as the strongest ones. In fact, these strong acids would serve as models for different types of sulfonic solids used as heterogeneous catalysts, containing alkylsulfonic, arylsulfonic or perfluoroalkylsulfonic groups. 2,2,2-Trifluoroethanol (TFE) was also included as an example of an alcohol of high acidity.
| Solvent | ANa | 31P δANa |
31P δ1![[thin space (1/6-em)]](https://www.rsc.org/images/entities/char_2009.gif) : :![[thin space (1/6-em)]](https://www.rsc.org/images/entities/char_2009.gif) 1b 1b |
pKac |
|---|---|---|---|---|
a Gutmann's acceptor number and the corresponding value of 31P chemical shift of dissolved TEPO.
b
![[thin space (1/6-em)]](https://www.rsc.org/images/entities/char_2009.gif) 31P chemical shift in CDCl3 for a TEPO–HA (1 31P chemical shift in CDCl3 for a TEPO–HA (1![[thin space (1/6-em)]](https://www.rsc.org/images/entities/char_2009.gif) : :![[thin space (1/6-em)]](https://www.rsc.org/images/entities/char_2009.gif) 1) species, calculated from the slope at low acid/TEPO molar ratio.
c Data from ref. 16 unless otherwise stated.
d From ref. 18.
e From ref. 19.
f Value for benzenesulfonic acid.
g From ref. 20. 1) species, calculated from the slope at low acid/TEPO molar ratio.
c Data from ref. 16 unless otherwise stated.
d From ref. 18.
e From ref. 19.
f Value for benzenesulfonic acid.
g From ref. 20.
|
||||
| CHCl3 | 23.1 | 52.5 | — | — |
| MeOH | 41.3 | 60.3 | — | — |
| TFE | 53.8 | 65.6 | 54.6 | 12.4 |
| AcOH | 52.9 | 65.2 | 56.5 | 4.76 |
| HCOOH | 83.6 | 78.3 | 57.9 | 3.77 |
| PhPO3H2 | — | — | 59.3 | 1.83d |
| TFA | 105.5 | 87.6 | 62.8 | 0.23e |
| MeSO3H | 126.1 | 96.4 | 74.3 | −1.92 |
| pTosOH | — | — | 76.1 | −2.8f |
| TfOH | 129.1 | 97.6 | 94.8 | −5.9 (−14.7g) |
Most of the pKa values (Table 1) are collected from the classical reference by Guthrie,16 with some exceptions, such as TFE,17 PhPO3H218 and TFA.19 A lower pKa value of TfOH (−14.7), based on more recent theoretical calculations20 has also been considered.
Methanol-d4 was first envisaged as a solvent due to the rather low solubility of some acids in CDCl3. However, the preliminary results obtained in methanol-d4 (Fig. S1, ESI†) indicated that this solvent was not suitable for this kind of measurement, as no shift was observed with weak acids, and no differences were observed among the strong acids, probably because the protonating species was [CD3ODH]+ in all of the cases. This effect is similar to that observed with Lewis acids and TMPO in D2O,14 with two general behaviors for highly active and poor catalysts. Thus, all of our studies were carried out in CDCl3, as a weakly polar medium, to simulate the acid–TEPO interaction on the solids in the absence of solvent.
In spite of the presumably fast acid–base equilibrium in solution, broad unsymmetrical 31P signals were obtained in some cases that became narrower single lines upon standing (some examples are collected in Fig. S2, ESI†). Hence, as a general procedure, the NMR samples were left to stand for a longer time (6–24 h) until a stable and reproducible 31P spectrum was obtained.
Results with weak acids (pKa > 0)
The 31P chemical shift of TEPO in CDCl3 was 52.5 ppm, in good agreement with the result at infinite dilution (50.8 ppm) used to determine AN.3 The values of δAN (Table 1) have been calculated from the experimental value, according to Δδ reported in the literature.1 With the different acids, the exact acid/TEPO molar ratio was determined by integration of the 1H NMR spectrum, using the CH2 signal of TEPO and some relevant signal of the acid, namely methyl groups of AcOH, MeSO3H and pTosOH, methylene group of TFE, phenyl group of PhPO3H2 and![[H with combining low line]](https://www.rsc.org/images/entities/char_0048_0332.gif) -COOH of formic acid. In the case of PhPO3H2, the ratio was confirmed by 31P NMR. Given the absence of suitable protons in the fluorinated acids (TFA and TfOH), α,α,α-trifluorotoluene was added as an internal standard and the acid/TEPO molar ratio was calculated from the integrations of both 1H and 19F NMR spectra.
-COOH of formic acid. In the case of PhPO3H2, the ratio was confirmed by 31P NMR. Given the absence of suitable protons in the fluorinated acids (TFA and TfOH), α,α,α-trifluorotoluene was added as an internal standard and the acid/TEPO molar ratio was calculated from the integrations of both 1H and 19F NMR spectra.
The evolution of the 31P chemical shift with the acid/TEPO molar ratio (spectra are collected in Fig. S3–S7, ESI†), in the case of weak acids, is represented in Fig. 1, showing a similar trend to the evolution of TMPO 31P δ in D2O with different M(OTf)x/TMPO molar ratios13 and TEPO with a different organocatalyst/TEPO ratio.15 The slope of the curve at low acid/TEPO molar ratios should be dependent on the acid strength (curve fits are collected in Fig. S8–S12, ESI†). Using that slope, the 31P δ values for a 1/1 molar ratio have been calculated (collected in Table 1, labeled as δ1![[thin space (1/6-em)]](https://www.rsc.org/images/entities/char_2009.gif) :
:![[thin space (1/6-em)]](https://www.rsc.org/images/entities/char_2009.gif) 1), and they can be considered as the estimated chemical shifts for the different TEPO–HA (1
1), and they can be considered as the estimated chemical shifts for the different TEPO–HA (1![[thin space (1/6-em)]](https://www.rsc.org/images/entities/char_2009.gif) :
:![[thin space (1/6-em)]](https://www.rsc.org/images/entities/char_2009.gif) 1) species. These values are in qualitative agreement with the pKa, but they are much lower than those obtained under the Gutmann's conditions for AN calculation (δAN). At increasing acid/TEPO molar ratios, the chemical shifts slowly increase linearly to converge with δAN. This result is in contrast with previous observations where the 31P chemical shift remained constant after the saturation of all of the TEPO.15 The slope of this second line is also higher for the stronger acids, although it was not determined for PhPO3H2 and TFE due to solubility problems in CDCl3. With this second straight line, it is possible to calculate a theoretical acid/TEPO ratio to get the 31P δAN. With both acetic and formic acids, molar ratios over 50 would be required to reach the 31P δAN, indicating that a very large excess of weak acid, that is a high dilution of TEPO, is necessary to reproduce the 31P δAN value. The molar ratio is significantly lower in the case of TFA (14.5), but a large excess is still required.
1) species. These values are in qualitative agreement with the pKa, but they are much lower than those obtained under the Gutmann's conditions for AN calculation (δAN). At increasing acid/TEPO molar ratios, the chemical shifts slowly increase linearly to converge with δAN. This result is in contrast with previous observations where the 31P chemical shift remained constant after the saturation of all of the TEPO.15 The slope of this second line is also higher for the stronger acids, although it was not determined for PhPO3H2 and TFE due to solubility problems in CDCl3. With this second straight line, it is possible to calculate a theoretical acid/TEPO ratio to get the 31P δAN. With both acetic and formic acids, molar ratios over 50 would be required to reach the 31P δAN, indicating that a very large excess of weak acid, that is a high dilution of TEPO, is necessary to reproduce the 31P δAN value. The molar ratio is significantly lower in the case of TFA (14.5), but a large excess is still required.
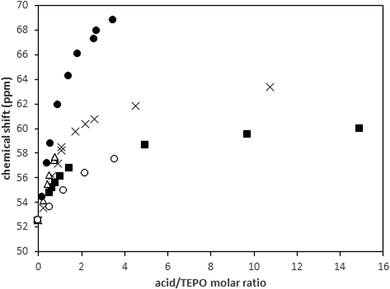 | ||
| Fig. 1 Variation of the 31P chemical shift (ppm) with the acid/TEPO molar ratio in CDCl3: (○) TFE, (■) AcOH, (×) HCOOH, (△) PhPO3H2, (●) TFA. | ||
Results with strong acids (pKa < 0)
Fig. 2A shows the evolution of the 31P chemical shift with the acid/TEPO molar ratio in the case of strong acids (spectra are collected in Fig. S13–S15, ESI†). The general trend is analogous to that observed with weak acids, with higher initial slopes and δ1![[thin space (1/6-em)]](https://www.rsc.org/images/entities/char_2009.gif) :
:![[thin space (1/6-em)]](https://www.rsc.org/images/entities/char_2009.gif) 1 values (Table 1). The chemical shifts for both MeSO3H and pTosOH are very similar, which is in agreement with their very close pKa values. The trend at the higher acid/TEPO molar ratio seems to also be similar, although the data for pTosOH were limited by its rather low solubility in CDCl3. In any case, the slope (curve fits are collected in Fig. S16–S18, ESI†) was higher than those observed for weak acids, and the theoretical acid/TEPO ratio to get the 31P δAN was only 4 in the case of MeSO3H.
1 values (Table 1). The chemical shifts for both MeSO3H and pTosOH are very similar, which is in agreement with their very close pKa values. The trend at the higher acid/TEPO molar ratio seems to also be similar, although the data for pTosOH were limited by its rather low solubility in CDCl3. In any case, the slope (curve fits are collected in Fig. S16–S18, ESI†) was higher than those observed for weak acids, and the theoretical acid/TEPO ratio to get the 31P δAN was only 4 in the case of MeSO3H.
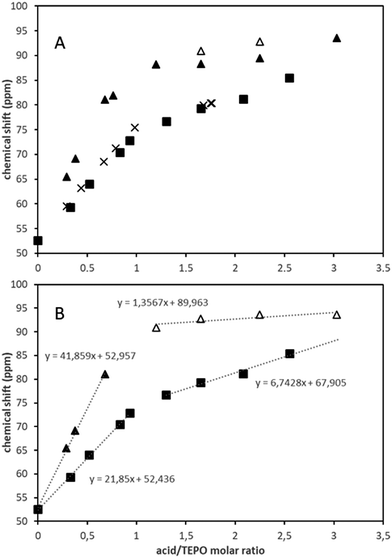 | ||
| Fig. 2 Variation of the 31P chemical shift (ppm) with the acid/TEPO molar ratio in CDCl3 (A) and linear fitting of the two straight parts of the curves (B): (■) MeSO3H, (×) pTosOH, (▲△) TfOH. | ||
On the contrary, the behavior of TfOH was significantly different. The δ1![[thin space (1/6-em)]](https://www.rsc.org/images/entities/char_2009.gif) :
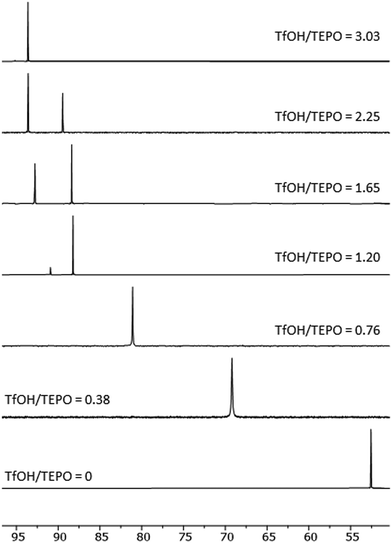
:![[thin space (1/6-em)]](https://www.rsc.org/images/entities/char_2009.gif) 1 value (94.8 ppm) was very close to the δAN (97.6 ppm). Hence, the second slope was much lower than that of MeSO3H (Fig. 2B). Moreover, at TfOH/TEPO molar ratios slightly higher than 1, two signals were clearly detected (open and filled symbols in Fig. 2A), until a single signal was again formed at a molar ratio of 3 (Fig. 3).
1 value (94.8 ppm) was very close to the δAN (97.6 ppm). Hence, the second slope was much lower than that of MeSO3H (Fig. 2B). Moreover, at TfOH/TEPO molar ratios slightly higher than 1, two signals were clearly detected (open and filled symbols in Fig. 2A), until a single signal was again formed at a molar ratio of 3 (Fig. 3).
1H and 19F spectra
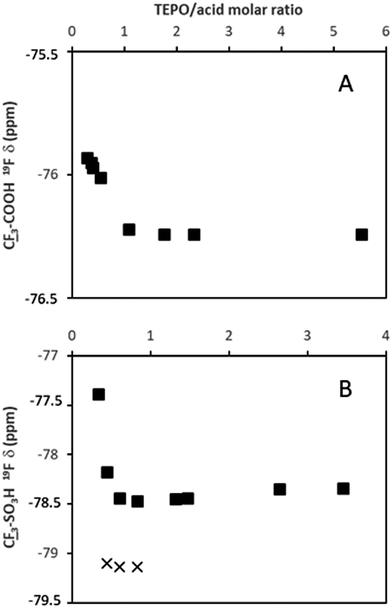
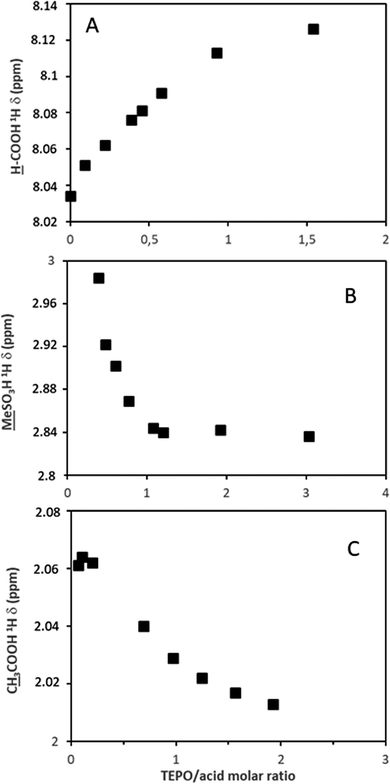
The deshielding effect on TEPO was also detectable in the 1H spectrum of the phosphorus neighbor methylene groups (Fig. S19, ESI†). In fact, 31P δ and 1H δ show a good correlation (Fig. S20, ESI†), although the 31P chemical shift is much more convenient2 due to its much wider range of variation.The evolution of the chemical shifts in the spectra of the acids has been represented against the TEPO/acid ratio to better understand the changes from pure acid to the saturation with TEPO. In this regard, the proton donation can also be followed by 1H NMR in the case of AcOH, HCOOH and MeSO3H. The formyl proton shows a deshielding effect (Fig. 4A and Fig. S21, ESI†) with a linear relationship with the TEPO/acid ratio, which is in agreement with the increase in the electron density in the carboxylic moiety. On the contrary, the methyl groups of the methanesulfonic (spectra in Fig. S22, ESI†) and acetic acids suffer a shielding effect (Fig. 4B and C, respectively) when the TEPO/acid molar ratio increases. This is in agreement with the development of a negative charge (an effect observed in the spectra of the sulfonate and acetate salts21), although the variation is much more important in the case of MeSO3H. This is probably due to its stronger acidity and hence a larger proton donation degree.
The acidic proton appears in the 5–12 ppm range with variable linewidth (two examples are collected in Fig. S23 and S24, ESI†). However, no clear relationship could be found between the TEPO/acid molar ratio and the chemical shift or linewidth of the signal.
Finally, the 19F chemical shift of the fluorine atoms in TFA (spectra in Fig. S25, ESI†) and TfOH follow the same trend (Fig. 5) as the protons in AcOH and MeSO3H with a shielding effect at increasing amounts of TEPO. This indicates the formation of a salt, and a more intense effect in the case of the stronger acid TfOH. Moreover, a second signal is clearly detected in the spectrum of TfOH at the same TfOH/TEPO ratios, in which the 31P spectrum also shows 2 signals. This is in agreement with the formation of two different species with slow exchange rate.
Discussion
TEPO·HA species in solution
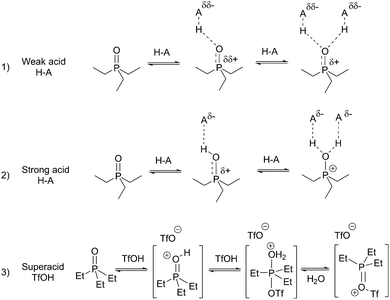
The results obtained with the set of acids at different acid/TEPO molar ratios seem to indicate a general behavior that can be summarized in Scheme 1. These equilibria are simplifications, as the presence of the acids in dimeric form22 or higher aggregates cannot be ruled out. This should affect mainly to kinetics,23 and it may be the reason for the required long equilibration time and the erratic chemical shift of the acidic proton. However, its role on the equilibrium position should only be marginal. At low acid/TEPO molar ratios, the major species must be free TEPO and TEPO·HA (1![[thin space (1/6-em)]](https://www.rsc.org/images/entities/char_2009.gif) :
:![[thin space (1/6-em)]](https://www.rsc.org/images/entities/char_2009.gif) 1) adduct. The 31P chemical shift (eqn (1)) would be dependent on the molar fractions of both species, xTEPO and x1
1) adduct. The 31P chemical shift (eqn (1)) would be dependent on the molar fractions of both species, xTEPO and x1![[thin space (1/6-em)]](https://www.rsc.org/images/entities/char_2009.gif) :
:![[thin space (1/6-em)]](https://www.rsc.org/images/entities/char_2009.gif) 1, which can ideally approach the acid/TEPO molar ratio r, and their chemical shifts δTEPO and δ1
1, which can ideally approach the acid/TEPO molar ratio r, and their chemical shifts δTEPO and δ1![[thin space (1/6-em)]](https://www.rsc.org/images/entities/char_2009.gif) :
:![[thin space (1/6-em)]](https://www.rsc.org/images/entities/char_2009.gif) 1:
1:δ = δ1![[thin space (1/6-em)]](https://www.rsc.org/images/entities/char_2009.gif) : :![[thin space (1/6-em)]](https://www.rsc.org/images/entities/char_2009.gif) 1x1 1x1![[thin space (1/6-em)]](https://www.rsc.org/images/entities/char_2009.gif) : :![[thin space (1/6-em)]](https://www.rsc.org/images/entities/char_2009.gif) 1 + δTEPOxTEPO = δ1 1 + δTEPOxTEPO = δ1![[thin space (1/6-em)]](https://www.rsc.org/images/entities/char_2009.gif) : :![[thin space (1/6-em)]](https://www.rsc.org/images/entities/char_2009.gif) 1r + δTEPO(1 − r) = δTEPO + r(δ1 1r + δTEPO(1 − r) = δTEPO + r(δ1![[thin space (1/6-em)]](https://www.rsc.org/images/entities/char_2009.gif) : :![[thin space (1/6-em)]](https://www.rsc.org/images/entities/char_2009.gif) 1 − δTEPO) 1 − δTEPO) | (1) |
![[thin space (1/6-em)]](https://www.rsc.org/images/entities/char_2009.gif) :
:![[thin space (1/6-em)]](https://www.rsc.org/images/entities/char_2009.gif) 1 values were calculated with the corresponding slopes (Table 1). Those values should be dependent on the strength of the acid. In fact, two different behaviors are apparent for weak and strong acids (Fig. 6). In the case of the weak acids, the increase of δ1
1 values were calculated with the corresponding slopes (Table 1). Those values should be dependent on the strength of the acid. In fact, two different behaviors are apparent for weak and strong acids (Fig. 6). In the case of the weak acids, the increase of δ1![[thin space (1/6-em)]](https://www.rsc.org/images/entities/char_2009.gif) :
:![[thin space (1/6-em)]](https://www.rsc.org/images/entities/char_2009.gif) 1 is very smooth with pKa. In contrast, it rises very rapidly with strong acids. In fact, the change in trend seems to be at a pKa value around that of TEPO (pKa ≈ −0.5),24 which is similar to that of TFA.
1 is very smooth with pKa. In contrast, it rises very rapidly with strong acids. In fact, the change in trend seems to be at a pKa value around that of TEPO (pKa ≈ −0.5),24 which is similar to that of TFA.
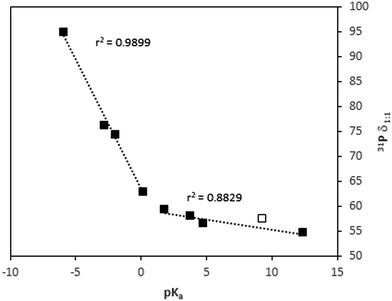 | ||
Fig. 6 Dependence of 31P δ1![[thin space (1/6-em)]](https://www.rsc.org/images/entities/char_2009.gif) : :![[thin space (1/6-em)]](https://www.rsc.org/images/entities/char_2009.gif) 1 with pKa (values in Table 1). Open symbol corresponds to data of HFIP from ref. 15. 1 with pKa (values in Table 1). Open symbol corresponds to data of HFIP from ref. 15. | ||
Thus, the weak acids are not strong enough to produce the protonation of TEPO. In addition, the nature of the TEPO·HA adduct can be envisaged as a hydrogen bond of different strengths, in the order TFE < AcOH < HCOOH < PhPO3H2 < TFA. In fact, from the data reported in the literature,15 the δ1![[thin space (1/6-em)]](https://www.rsc.org/images/entities/char_2009.gif) :
:![[thin space (1/6-em)]](https://www.rsc.org/images/entities/char_2009.gif) 1 for 1,1,1,3,3,3-hexafluoro-2-propanol (HFIP) can be calculated (open symbol in Fig. 6), and it fits well with the expected value. The hydrogen bonding must generate only a very small positive charge on phosphorus (Scheme 1, equilibrium 1), and hence a very low deshielding effect, demonstrated by a low 31P Δδ. The acids stronger than TFA are able to transfer the proton to TEPO, developing a larger positive charge on phosphorus, and hence a more intense deshielding effect. From the δ1
1 for 1,1,1,3,3,3-hexafluoro-2-propanol (HFIP) can be calculated (open symbol in Fig. 6), and it fits well with the expected value. The hydrogen bonding must generate only a very small positive charge on phosphorus (Scheme 1, equilibrium 1), and hence a very low deshielding effect, demonstrated by a low 31P Δδ. The acids stronger than TFA are able to transfer the proton to TEPO, developing a larger positive charge on phosphorus, and hence a more intense deshielding effect. From the δ1![[thin space (1/6-em)]](https://www.rsc.org/images/entities/char_2009.gif) :
:![[thin space (1/6-em)]](https://www.rsc.org/images/entities/char_2009.gif) 1 values, two types of behavior can be considered. The superacid TfOH produces the complete proton transfer, forming an ion-pair with TEPO (Scheme 1, equilibrium 3). In addition, a complete deshielding effect is observed on phosphorus in the 1
1 values, two types of behavior can be considered. The superacid TfOH produces the complete proton transfer, forming an ion-pair with TEPO (Scheme 1, equilibrium 3). In addition, a complete deshielding effect is observed on phosphorus in the 1![[thin space (1/6-em)]](https://www.rsc.org/images/entities/char_2009.gif) :
:![[thin space (1/6-em)]](https://www.rsc.org/images/entities/char_2009.gif) 1 species, as shown by a δ1
1 species, as shown by a δ1![[thin space (1/6-em)]](https://www.rsc.org/images/entities/char_2009.gif) :
:![[thin space (1/6-em)]](https://www.rsc.org/images/entities/char_2009.gif) 1 value that is very close to δAN. The strong acids MeSO3H and pTosOH produce a deshielding effect that is less intense than TfOH. This is due to an incomplete proton transfer (Scheme 1, equilibrium 2), but is much more intense than the weak acids.
1 value that is very close to δAN. The strong acids MeSO3H and pTosOH produce a deshielding effect that is less intense than TfOH. This is due to an incomplete proton transfer (Scheme 1, equilibrium 2), but is much more intense than the weak acids.
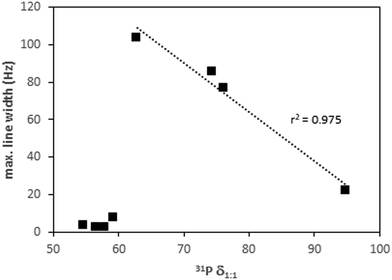
A second parameter that allows for distinguishing between different behaviors is the 31P line width. The maximum value is always observed at an acid/TEPO ratio around 0.5, and it varies depending on the acid strength. The values are low (<10 Hz) with weak acids, indicating a fast exchange between the free and hydrogen-bonded TEPO. The maximum line width abruptly increases to values around 100 Hz when the acid strength reaches the TEPO pKa. This is probably due to a slower exchange of the proton-transferred TEPO. The slow exchange has also been described in the case of neutralization of Lewis acids with TMPO in D2O.13 From the maximum value of the line width, it decreases in a linear way with δ1![[thin space (1/6-em)]](https://www.rsc.org/images/entities/char_2009.gif) :
:![[thin space (1/6-em)]](https://www.rsc.org/images/entities/char_2009.gif) 1 (Fig. 7), which is with increasing acid strength. This seems to allow a faster TEPO exchange, mainly in the case of the ion-paired [TEPO–H]+TfO−.
1 (Fig. 7), which is with increasing acid strength. This seems to allow a faster TEPO exchange, mainly in the case of the ion-paired [TEPO–H]+TfO−.
The evolution of the 31P δ at acid/TEPO molar ratios >1 (Fig. 1 and 2) seems to indicate the existence of a second reaction to form a TEPO–(HA)2 species (Scheme 1). In the case of weak acids, this reaction should be the formation of a second hydrogen bond (Scheme 1, equilibrium 1), leading to a minor increase in δ that requires a very high amount of acid to be detectable. On the other hand, MeSO3H and pTosOH are strong enough to produce a second proton transfer to TEPO (Scheme 1, equilibrium 2), which is able to reach the full deshielding effect at a rather low acid/TEPO ratio (4![[thin space (1/6-em)]](https://www.rsc.org/images/entities/char_2009.gif) :
:![[thin space (1/6-em)]](https://www.rsc.org/images/entities/char_2009.gif) 1). As TfOH already produces the full deshielding effect with the first protonation equilibrium, the second TfOH molecule might be added to the P
1). As TfOH already produces the full deshielding effect with the first protonation equilibrium, the second TfOH molecule might be added to the P![[double bond, length as m-dash]](https://www.rsc.org/images/entities/char_e001.gif) O bond, leading to a [Et3P
O bond, leading to a [Et3P![[double bond, length as m-dash]](https://www.rsc.org/images/entities/char_e001.gif) OTf]OTf species after water loss (Scheme 1, equilibrium 3). This species has only a minor deshielding effect on 31P with respect to [Et3P
OTf]OTf species after water loss (Scheme 1, equilibrium 3). This species has only a minor deshielding effect on 31P with respect to [Et3P![[double bond, length as m-dash]](https://www.rsc.org/images/entities/char_e001.gif) OH]OTf, and it would also explain the slow exchange, as shown by the two signals of the 31P spectrum at high acid/TEPO molar ratio (Fig. 3), as well as the two signals in the 19F spectrum (Fig. 5B).
OH]OTf, and it would also explain the slow exchange, as shown by the two signals of the 31P spectrum at high acid/TEPO molar ratio (Fig. 3), as well as the two signals in the 19F spectrum (Fig. 5B).
Attempts to detect isolated TEPO·HA species by 31P MAS NMR
In an attempt to detect the isolated 1![[thin space (1/6-em)]](https://www.rsc.org/images/entities/char_2009.gif) :
:![[thin space (1/6-em)]](https://www.rsc.org/images/entities/char_2009.gif) 1 and 1
1 and 1![[thin space (1/6-em)]](https://www.rsc.org/images/entities/char_2009.gif) :
:![[thin space (1/6-em)]](https://www.rsc.org/images/entities/char_2009.gif) 2 TEPO–HA species in the solid phase, the TEPO–HA adducts with the two solid acids, PhPO3H2 and pTosOH, were prepared with different acid/TEPO molar ratios to prevent the exchange process. Unfortunately, all of the mixtures, irrespective of their molar ratios, were viscous liquids at room temperature. In any case, they were imbibed with solid KBr and the spectra of the solids were recorded using MAS technique with direct polarization and proton decoupling (Fig. S26 and S27, ESI†).
2 TEPO–HA species in the solid phase, the TEPO–HA adducts with the two solid acids, PhPO3H2 and pTosOH, were prepared with different acid/TEPO molar ratios to prevent the exchange process. Unfortunately, all of the mixtures, irrespective of their molar ratios, were viscous liquids at room temperature. In any case, they were imbibed with solid KBr and the spectra of the solids were recorded using MAS technique with direct polarization and proton decoupling (Fig. S26 and S27, ESI†).
A single quite narrow TEPO 31P signal was obtained in all of the cases, with very low chemical shift anisotropy, as shown in the spectra at low spinning speed (up to 0.8 kHz, Fig. S28, ESI†). Then, the first conclusion was that the adducts were still present in the liquid phase on the solid surface. Even in the absence of solvent, a fast exchange of TEPO took place, averaging the signal. The obtained chemical shifts were compared with those observed in the solution phase (Fig. 8).
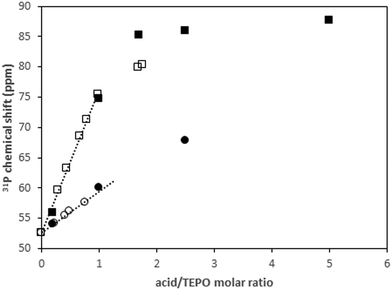 | ||
| Fig. 8 Evolution of 31P chemical shift in solution (open symbols) and in solid phase (filled symbols) with acid/TEPO molar ratio: (■) pTosOH; (●) PhPO3H2. | ||
As can be seen, the chemical shifts at low molar ratio perfectly fit with the initial slopes of the curves in solution, showing the negligible effect of CDCl3 on the chemical shift under those conditions. On the contrary, the effect is significant at molar ratios higher than 1. Conversely, the second slope (molar ratio >1) is much lower than the first one in solution. In the solvent-free liquid phase on the solid, the evolution of the chemical shift is nearly linear up to higher molar ratios. The concentration of the sample after evaporation of the solvent seems to greatly favor the formation of the TEPO–(HA)2 species, irrespective from the acid strength.
31P NMR spectra of TEPO in solution with mixtures of acids
In principle, the observed behavior of TEPO in the presence of pure acids should be useful to predict the chemical shift of TEPO in solution in the presence of a mixture of acids. One strong acid (MeSO3H) and one weak acid (HCOOH) were tested with MeSO3H/TEPO molar ratios that were always under 1, and different HCOOH/TEPO molar ratios. In a simple approach, the 31P δ value should be a contribution of the TEPO·HO3SMe species and another one of TEPO·HOOCH that is calculated using the respective δ1![[thin space (1/6-em)]](https://www.rsc.org/images/entities/char_2009.gif) :
:![[thin space (1/6-em)]](https://www.rsc.org/images/entities/char_2009.gif) 1 and molar fractions. There would be an additional effect of the excess of acid over the acid/TEPO ratio of 1, which should be estimated with the slope of the second straight line in the δ vs. acid/TEPO ratio.
1 and molar fractions. There would be an additional effect of the excess of acid over the acid/TEPO ratio of 1, which should be estimated with the slope of the second straight line in the δ vs. acid/TEPO ratio.
As an example, the predicted value for a MeSO3H/HCOOH/TEPO ratio of 0.53![[thin space (1/6-em)]](https://www.rsc.org/images/entities/char_2009.gif) :
:![[thin space (1/6-em)]](https://www.rsc.org/images/entities/char_2009.gif) 0.62
0.62![[thin space (1/6-em)]](https://www.rsc.org/images/entities/char_2009.gif) :
:![[thin space (1/6-em)]](https://www.rsc.org/images/entities/char_2009.gif) 1 would be 66.6 ppm (0.53 × 74.3 + 0.47 × 57.9 + 0.15 × 0.33, where 0.33 is the slope of the second straight line in the HCOOH graphic), whereas the experimental value is 66.9 ppm.
1 would be 66.6 ppm (0.53 × 74.3 + 0.47 × 57.9 + 0.15 × 0.33, where 0.33 is the slope of the second straight line in the HCOOH graphic), whereas the experimental value is 66.9 ppm.
However, the effect of a large excess of weak acid on the 1![[thin space (1/6-em)]](https://www.rsc.org/images/entities/char_2009.gif) :
:![[thin space (1/6-em)]](https://www.rsc.org/images/entities/char_2009.gif) 1 species of the strong acid cannot be precisely predicted by the behavior of the pure weak acid. Thus, for a MeSO3H/HCOOH/TEPO ratio of 0.83
1 species of the strong acid cannot be precisely predicted by the behavior of the pure weak acid. Thus, for a MeSO3H/HCOOH/TEPO ratio of 0.83![[thin space (1/6-em)]](https://www.rsc.org/images/entities/char_2009.gif) :
:![[thin space (1/6-em)]](https://www.rsc.org/images/entities/char_2009.gif) 1.03
1.03![[thin space (1/6-em)]](https://www.rsc.org/images/entities/char_2009.gif) :
:![[thin space (1/6-em)]](https://www.rsc.org/images/entities/char_2009.gif) 1, the predicted value is 71.8 ppm, whereas the experimental one is 73.7 ppm. Even more difference is observed at larger HCOOH excess (molar ratio of 0.55
1, the predicted value is 71.8 ppm, whereas the experimental one is 73.7 ppm. Even more difference is observed at larger HCOOH excess (molar ratio of 0.55![[thin space (1/6-em)]](https://www.rsc.org/images/entities/char_2009.gif) :
:![[thin space (1/6-em)]](https://www.rsc.org/images/entities/char_2009.gif) 11.1
11.1![[thin space (1/6-em)]](https://www.rsc.org/images/entities/char_2009.gif) :
:![[thin space (1/6-em)]](https://www.rsc.org/images/entities/char_2009.gif) 1) between the predicted δ (70.4 ppm) and the experimental value (74.0 ppm). This seems to indicate that the effect of a second molecule of the weak acid is higher when it participates in a mixed 1
1) between the predicted δ (70.4 ppm) and the experimental value (74.0 ppm). This seems to indicate that the effect of a second molecule of the weak acid is higher when it participates in a mixed 1![[thin space (1/6-em)]](https://www.rsc.org/images/entities/char_2009.gif) :
:![[thin space (1/6-em)]](https://www.rsc.org/images/entities/char_2009.gif) 2 species with the strong acid, although this point deserves further investigation.
2 species with the strong acid, although this point deserves further investigation.
Cooperative effect in diacids
If our hypothesis of the formation of the TEPO·(HA)2 species is true, the effect of the second acid should be clearly observable in the case of diacids, able to form that kind of species in an intramolecular way. Thus, dimethylmalonic acid (DMMA) was tested as an example of a carboxylic acid with a first dissociation constant higher than that of HCOOH (pKa1 = 3.15).17 The solubility limitations restricted the maximum acid/TEPO molar ratio to 0.68. In that range, it was possible to calculate the δ1![[thin space (1/6-em)]](https://www.rsc.org/images/entities/char_2009.gif) :
:![[thin space (1/6-em)]](https://www.rsc.org/images/entities/char_2009.gif) 1, which was 60.6 ppm. This was significantly higher than the value for HCOOH (57.9 ppm) and even PhPO3H2 (59.3), which is a stronger acid (pKa = 1.83). This result indicates that the deshielding effect of DMMA on TEPO is larger than expected by only its pKa1, which may be related to the presence of a second carboxylic acid that is able to donate a second hydrogen in an intramolecular manner (Fig. 9). This is entropically more favored than the donation from a second molecule of a simple monoacid. This result opens the way to the search for the close proximity of acid sites on heterogeneous catalysts.
1, which was 60.6 ppm. This was significantly higher than the value for HCOOH (57.9 ppm) and even PhPO3H2 (59.3), which is a stronger acid (pKa = 1.83). This result indicates that the deshielding effect of DMMA on TEPO is larger than expected by only its pKa1, which may be related to the presence of a second carboxylic acid that is able to donate a second hydrogen in an intramolecular manner (Fig. 9). This is entropically more favored than the donation from a second molecule of a simple monoacid. This result opens the way to the search for the close proximity of acid sites on heterogeneous catalysts.
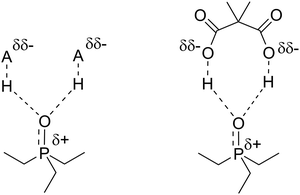 | ||
| Fig. 9 Proposed structure for the TEPO·DMMA adduct and the analogous TEPO–(HA)2 species with weak acids. | ||
Conclusions
The proportionality of the 31P chemical shift of TEPO with the acid/TEPO molar ratio allows the calculation of the value for a true TEPO·acid species (δ1![[thin space (1/6-em)]](https://www.rsc.org/images/entities/char_2009.gif) :
:![[thin space (1/6-em)]](https://www.rsc.org/images/entities/char_2009.gif) 1). In a large range of acidity, from trifluoroethanol to triflic acid (pKa range from 12.4 to −5.9), δ1
1). In a large range of acidity, from trifluoroethanol to triflic acid (pKa range from 12.4 to −5.9), δ1![[thin space (1/6-em)]](https://www.rsc.org/images/entities/char_2009.gif) :
:![[thin space (1/6-em)]](https://www.rsc.org/images/entities/char_2009.gif) 1 correlates with the pKa of the acid with different slopes for strong and weak acids. This is considered in comparison with the TEPO–H+ pKa. The difference between δ1
1 correlates with the pKa of the acid with different slopes for strong and weak acids. This is considered in comparison with the TEPO–H+ pKa. The difference between δ1![[thin space (1/6-em)]](https://www.rsc.org/images/entities/char_2009.gif) :
:![[thin space (1/6-em)]](https://www.rsc.org/images/entities/char_2009.gif) 1 and the value at infinite dilution in the acid (used as a solvent, δAN), as well as the behavior of the chemical shift at acid/TEPO molar ratios >1, indicates the existence of an interaction of a second acid molecule with TEPO. This second interaction is also dependent on the acid strength, up to a limit at around 95 ppm, which seems to be the chemical shift of the TEPO–H+ species, in the form of an ion-pair. The second interaction seems to be entropically highly favored in a diacid, such as dimethylmalonic acid, whose effect on the 31P δ of TEPO is much more important than expected by its pKa value.
1 and the value at infinite dilution in the acid (used as a solvent, δAN), as well as the behavior of the chemical shift at acid/TEPO molar ratios >1, indicates the existence of an interaction of a second acid molecule with TEPO. This second interaction is also dependent on the acid strength, up to a limit at around 95 ppm, which seems to be the chemical shift of the TEPO–H+ species, in the form of an ion-pair. The second interaction seems to be entropically highly favored in a diacid, such as dimethylmalonic acid, whose effect on the 31P δ of TEPO is much more important than expected by its pKa value.
In solids with isolated acid sites, such as in the case of zeolite HZSM-5, the formation of the (TMPO)2–HA species has been proposed on the basis of 1H–31P HETCOR experiments and DFT calculations.25 However, on solids with high density of acid sites, the presence of neighbor acid sites may produce an effect similar to that observed with DMMA in solution, with the formation of the TEPO–(HA)2 species. This might explain the high dispersion of the 31P chemical shifts observed with the sulfonated carbons,26 leading to an uncertain assignment of the signals,27 a subject that requires further investigation according to these findings in solution.
Conflicts of interest
There are no conflicts to declare.Acknowledgements
This work was financially supported by the Spanish Ministerio de Ciencia, Innovación y Universidades (project number RTI2018-093431-B-I00), the Gobierno de Aragón (E37_20R group) and co-financed with Feder 2014-2020 “Construyendo Europa desde Aragón”. We acknowledge support of the publication fee by the CSIC Open Access Publication Support Initiative through its Unit of Information Resources for Research (URICI).Notes and references
- V. Gutmann, Coord. Chem. Rev., 1976, 18, 225–255 CrossRef CAS.
- I. Alkorta and J. Elguero, J. Phys. Org. Chem., 2017, 30, 1–7 CrossRef.
- M. A. Beckett, G. C. Strickland, J. R. Holland and K. Sukumar Varma, Polymer, 1996, 37, 4629–4631 CrossRef CAS.
- J. A. McCune, P. He, M. Petkovic, F. Coleman, J. Estager, J. D. Holbrey, K. R. Seddon and M. Swadźba-Kwasny, Phys. Chem. Chem. Phys., 2014, 16, 23233–23243 RSC.
- R. A. Mantz, P. C. Trulove, R. T. Carlin, T. L. Theim and R. A. Osteryoung, Inorg. Chem., 1997, 36, 1227–1232 CrossRef CAS.
- S. Coffie, J. M. Hogg, L. Cailler, A. Ferrer-Ugalde, R. W. Murphy, J. D. Holbrey, F. Coleman and M. Swadźba-Kwasny, Angew. Chem., Int. Ed., 2015, 54, 14970–14973 CrossRef CAS.
- A. S. Ostras, D. M. Ivanov, A. S. Novikov and P. M. Tolstoy, Molecules, 2020, 25, 1406 CrossRef CAS.
- D. Farcaşiu, A. Ghenciu and G. Miller, J. Catal., 1992, 134, 118–125 CrossRef.
- J. P. Osegovic and R. S. Drago, J. Phys. Chem. B, 2000, 104, 147–154 CrossRef CAS.
- A. Zheng, S. Bin Liu and F. Deng, Chem. Rev., 2017, 117, 12475–12531 CrossRef CAS.
- A. Zheng, S.-J. Huang, S.-B. Liu and F. Deng, Phys. Chem. Chem. Phys., 2011, 13, 14889–14901 RSC.
- E. L. Myers, C. P. Butts and V. K. Aggarwal, Chem. Commun., 2006, 4434–4436 RSC.
- Y. Koito, K. Nakajima, H. Kobayashi, R. Hasegawa, M. Kitano and M. Hara, Chem. – Eur. J., 2014, 20, 8068–8075 CrossRef CAS.
- Y. Koito, K. Nakajima, R. Hasegawa, H. Kobayashi, M. Kitano and M. Hara, Catal. Today, 2014, 226, 198–203 CrossRef CAS.
- K. M. Diemoz and A. K. Franz, J. Org. Chem., 2019, 84, 1126–1138 CrossRef CAS.
- J. P. Guthrie, Can. J. Chem., 1978, 56, 2342–2353 CrossRef CAS.
- CRC Handbook of Chemistry and Physics, ed. W. M. Haynes and D. R. Lide, CRC Press, Boca Raton, 92th edn, 2011 Search PubMed.
- H. H. Jaffé, L. D. Freedman and G. O. Doak, J. Am. Chem. Soc., 1953, 75, 2209–2211 CrossRef.
- M. Norris, Synlett, 2015, 418–419 CAS.
- A. Trummal, L. Lipping, I. Kaljurand, I. A. Koppel and I. Leito, J. Phys. Chem. A, 2016, 120, 3663–3669 CrossRef CAS.
- The Sadtler Handbook of Proton NMR Spectra, ed. W. W. Simons, Sadtler Research Laboratories, Philadelphia, 1978 Search PubMed.
- J. R. Durig, L. Zhou, T. Schwartz and T. Gounev, J. Raman Spectrosc., 2000, 31, 193–202 CrossRef CAS.
- N. B. Chapman, M. R. J. Dack, D. J. Newman, J. Shorter and R. Wilkinson, J. Chem. Soc., Perkin Trans. 2, 1974, 971–976 RSC.
- E. M. Arnett, E. J. Mitchell and T. S. S. R. Murty, J. Am. Chem. Soc., 1974, 96, 3875–3891 CrossRef CAS.
- C. Bornes, M. Sardo, Z. Lin, J. Amelse, A. Fernandes, M. F. Ribeiro, C. Geraldes, J. Rocha and L. Mafra, Chem. Commun., 2019, 55, 12635–12638 RSC.
- P. A. Russo, M. M. Antunes, P. Neves, P. V. Wiper, E. Fazio, F. Neri, F. Barreca, L. Mafra, M. Pillinger, N. Pinna and A. A. Valente, J. Mater. Chem. A, 2014, 2, 11813–11824 RSC.
- P. Fernández, J. M. Fraile, E. García-Bordejé and E. Pires, Catalysts, 2019, 9, 804 CrossRef.
Footnote |
| † Electronic supplementary information (ESI) available: NMR spectra and fitted graphs for all the acids. See DOI: 10.1039/d0cp03812a |
| This journal is © the Owner Societies 2020 |

![[M with combining low line]](https://www.rsc.org/images/entities/char_004d_0332.gif)
![[e with combining low line]](https://www.rsc.org/images/entities/char_0065_0332.gif) SO3H; (C)
SO3H; (C) 