 Open Access Article
Ether functionalisation, ion conformation and the optimisation of macroscopic properties in ionic liquids†‡
Frederik
Philippi
 a,
Daniel
Rauber
 b,
Björn
Kuttich
 c,
Tobias
Kraus
 cd,
Christopher W. M.
Kay
 be,
Rolf
Hempelmann
 b,
Patricia A.
Hunt
 af and
Tom
Welton
 *a
*a
aDepartment of Chemistry, Molecular Sciences Research Hub, Imperial College London, White City Campus, London W12 0BZ, UK. E-mail: t.welton@ic.ac.uk
bDepartment of Chemistry, Saarland University, 66123, Saarbrücken, Germany
cINM-Leibniz Institute for New Materials, 66123, Saarbrücken, Germany
dColloid and Interface Chemistry, Saarland University, 66123 Saarbrücken, Germany
eLondon Centre for Nanotechnology, University College London, 17-19 Gordon Street, London WC1H 0AH, UK
fSchool of Chemical and Physical Sciences, Victoria University of Wellington, New Zealand
First published on 29th September 2020
Abstract
Ionic liquids are an attractive material class due to their wide liquid range, intrinsic ionic conductivity, and high chemical as well as electrochemical stability. However, the widespread use of ionic liquids is hindered by significantly higher viscosities compared to conventional molecular solvents. In this work, we show how the transport properties of ionic liquids can be altered significantly, even for isostructural ions that have the same backbone. To this end, structure–property relationships have been determined for a set of 16 systematically varied representative ionic liquids. Variations in molecular structure include ammonium vs. phosphonium, ether vs. alkyl side chains, and rigid vs. flexible anions. Ab initio calculations are used to relate molecular structures to the thermal, structural and transport properties of the ionic liquids. We find that the differences in properties of ether and alkyl functionalised ionic liquids are primarily dependent on minimum energy geometries, with the conformational flexibility of ether side chains appearing to be of secondary importance. We also show unprecedented correlations between anion conformational flexibility and transport properties. Critically, increasing fluidity upon consecutive introduction of ether side chains and phosphonium centres into the cation is found to be dependent on whether the anion is flexible or rigid. We demonstrate that targeted design of functional groups based on structure–property relationships can yield ionic liquids of exceptionally high fluidity.
Introduction
Ionic liquids are attracting increasing attention for electrochemical applications, for example as electrolytes in batteries and supercapacitors.1–3 The interest in (some) ILs has arisen due to their inherent electrical conductivity, large liquid range and wide electrochemical window allowing for the design of safer battery systems with higher operating voltages.1,4–6 The limitations of conventional solvents can be overcome by the variability inherent within ionic liquids, as a class. ILs can be tuned through modification of the constituent ions, leading the way for development of a new generation of electrochemical devices. However, viscosity remains a crucial issue for ionic liquids. ILs often exhibit a relatively high viscosity leading to practical handling issues, with the corollary that other transport properties are limited.7 Thus, optimising an ionic liquid for a particular application often revolves around optimising the ionic liquid's transport properties.The practical use of ionic liquids requires sound knowledge of structure–property relationships. The aim is to be able to choose a particular ion (chemical structure) which yields the desired (transport) properties. Ions typically contain a range of functional groups. In many cases it is possible to isolate the effect of a particular functional group on the macroscopic properties of ionic liquids by comparison with the non-functionalised analogue.
Design elements, such as the degree of fluorination, choice of functional groups, size, mass and shape of the ions determine the properties and need to be taken into account.7–11 The task of tailoring an ionic liquid for a certain application is further complicated by inherent structuring on different length scales12–14 and cooperative effects,15 which also influence the macroscopic properties. Thus, the wide variety and complexity of cation–anion combinations forming ionic liquids represents both a significant challenge as well as an opportunity.16,17 Structure–property relationships based on a common chemical rationale (such as ‘conformational flexibility’ or ‘coordination tendency’) are then collected in design elements (such as ‘choice of functional groups’ or ‘degree of fluorination’) which can then be more generally applied.
A recurring concept relevant to almost all properties of ionic liquids is conformational flexibility.10,18 ILs are typically composed of at least one organic ion, which usually exist in more than one conformer. If the energy barrier for interconversion between these conformers is small compared to the thermal energy available at the temperature of the liquid, then the ion has a high conformational flexibility. A correlation between high conformational flexibility and high ion mobility has been established for a number of structural motifs, such as silyl or ether groups.19–21 For example, Suarez et al. reported that translational and conformational relaxation in the bis(trifluoromethanesulfonyl)imide [NTf2]− (Tf = triflyl group, –SO2CF3) anion are coupled for 1-ethyl-3-methylimidazolium bis(trifluoromethanesulfonyl)imide [C2C1im][NTf2].22
A single functional group can impact macroscopic properties in complex ways. For example, increases in conformational (i.e., torsional) flexibility of alkyl chains in the cation can increase ion mobility.23 Conformational flexibility dominates the ionic liquid properties for shorter side chains,19e.g. when replacing a methyl with an ethyl group.24 However, dispersion interactions between the side chains increases with alkyl chain length and these can eventually lead to aggregation and a decrease of ion mobility.19 The competing and cooperative effects from a single functional group are difficult to disentangle; hence investigated model systems must be carefully chosen so as to change as few parameters at a time as possible.
In the present study, the physicochemical properties of ionic liquids have been investigated by systematically varying the constituent ions. The choice of cations enabled us to distinguish between the effects of ether vs. alkyl functionalisation and the effects of phosphonium vs. ammonium centres. The anions were chosen to exhibit a range of conformational flexibility. The combined set of ILs allows us to demonstrate the impact of molecular structure on specific bulk properties. To rationalise the structure–property relationships, we combine a broad range of experimental and computational techniques. Computational methods were used to disentangle the effects of the most stable geometry versus ion conformational flexibility; in addition we probed the cross-interactions between geometry and conformational flexibility.
Materials and methods
Details of the syntheses of ionic liquids are given in the ESI,‡ Section 1. All ionic liquids were dried in high vacuum (10−3 mbar) at 30–40 °C for at least two days prior to their use. This procedure led to a water content around or below 100 ppm as determined by coulometric Karl–Fischer titration. Ether functionalised ionic liquids require longer drying times of up to a week to reach comparable water levels. Dry ionic liquids were handled in a glovebox or under Schlenk conditions to avoid uptake of ambient moisture. Samples were checked for purity using multinuclear NMR spectroscopy and for the absence of halides using silver nitrate solution. The tetracyanoborate anion behaves as pseudohalide with limited solubility of the corresponding silver salt. Thus, [B(CN)4]− ionic liquids were checked for the absence of halides by ion chromatography. No halides could be detected in the final ionic liquids. Tris(2-ethoxyethyl)phosphine and tris(2-ethoxyethyl)methylphosphonium iodide were prepared as described previously.24 Water in direct contact with the samples was purified using an Arium® advance EDI Type 2 water purification system (Sartorius, Göttingen, Germany). Thermal transitions, densities, viscosities, ionic conductivities and self-diffusion coefficients were measured as described previously.24 Self-diffusion coefficients were calibrated against water. To improve the fitting procedure, viscosities and ionic conductivities were measured in steps of 5 °C.Small Angle X-ray Scattering (SAXS) was performed on a Xenocs Xeuss 2.0 laboratory instrument. A Genix 3D source provided X-rays at the copper Kα-line with a wavelength of λ = 1.54 Å. Scattered intensity was detected by two Dectris detectors, a Pilatus 3R 1M and a Pilatus 100 K. Sample detector distances were 575 mm and 158 mm, respectively. Scattering vectors q = 4π![[thin space (1/6-em)]](https://www.rsc.org/images/entities/char_2009.gif) sin(θ)λ−1 between 0.02 Å−1 and 3.02 Å−1 were recorded, with the scattering angle 2θ. Samples were filled into borosilicate capillaries and flame sealed. Since scattering of all samples was isotropic, intensities were radially averaged.
sin(θ)λ−1 between 0.02 Å−1 and 3.02 Å−1 were recorded, with the scattering angle 2θ. Samples were filled into borosilicate capillaries and flame sealed. Since scattering of all samples was isotropic, intensities were radially averaged.
Theoretical calculations were performed using the Gaussian 09 software package, revision D.01.25 All calculations were performed without symmetry constraints and with a pruned integration grid with 99 radial and 590 angular points per shell. Geometry optimisations including the 1D and 2D scans and molecular dynamics simulation were performed at the B3LYP/6-311+G(d,p) level of theory with the Grimme D3 dispersion correction and Becke–Johnson damping.26
Ab initio molecular dynamics trajectories of the isolated ions were generated using the implementation of the ADMP approach in Gaussian, with a fully converged SCF at each step.27–29 Molecular dynamics simulations were started from the geometry of the minimum conformer with an initial nuclear kinetic energy corresponding to a temperature of 600 K. This initial kinetic energy is rapidly redistributed into potential energy, leading to an approximate target temperature of 400 K. To ensure the target temperature was maintained, velocity rescaling (to 400 K) was implemented every 500 steps. Trajectories were recorded for 20 ps ([CHTf2]− and [NTf2]−) or 30 ps ([P111(2O1)]+ and [P1114]+) with a step size of 1 fs.
Ion volumes were obtained from optimised and verified (by checking for the absence of imaginary frequencies) minimum geometries. The formatted Gaussian checkpoint file containing the wavefunction was analysed using the quantitative molecular surface analysis tool in the Multiwfn software package as described in our preceding publication.24,30,31 For the ion volume calculations, convergence criteria were tightened to 10−11 Hartree for the RMS change in the density matrix.
1D and 2D dihedral scans were generated by varying a carefully constructed master z-matrix. Dihedrals were varied from 0° to 360° in steps of 10° (2D scans) or 5° (1D scans). The z-matrices for [P111(2O1)]+ and [P1114]+ are given in the ESI.‡ A tightened convergence criterion of 10−10 Hartree for the RMS change in the density matrix was employed during the geometry optimisation. After optimisation with partly frozen dihedral coordinates, single point calculations were performed at the full MP2/cc-pVTZ level of theory with convergence criteria tightened to 10−11 Hartree for the RMS change in the density matrix. Thus the PES presented are those evaluated at the full MP2/cc-pVTZ//B3LYP-GD3BJ/6-311+G(d,p) level of theory.
Results and discussion
This section is divided into subsections as follows. First, we begin by describing the strategy and the choice of ions we investigated in this work. We then present the experimental results and their interpretation grouped by methods into five subsections. To further ease understanding for readers only interested in a particular aspect, we provide brief introductions at the beginning of each subsection. The key results regarding the connections between macroscopic properties, cation functionalisation and anion flexibility are presented in the rheology subsection and are further substantiated with ionic conductivity and self-diffusion data. Finally, we use theoretical methods to underpin our understanding of how the molecular structures of the cations and anions direct the resulting macroscopic properties.Choice of model system
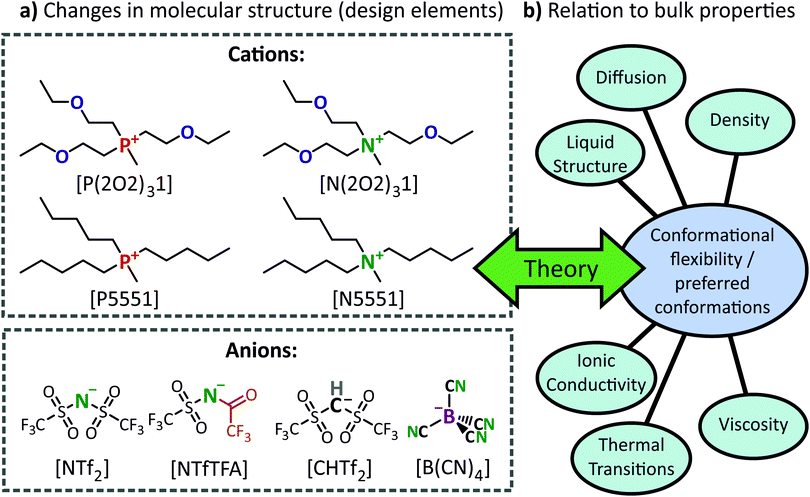
Combinations of 4 cations and 4 anions, see Fig. 1a, were used to give 16 unique ionic liquids. Of these, [P5551][NTf2] and [P(2O2)31][NTf2] are already known and our results are in good agreement with previous data.24 This particular set of ionic liquids was chosen to specifically highlight how changes in molecular structure (i.e., design elements) lead to changes in IL bulk properties, Fig. 1b. The observed structure–property relationships were then rationalised using insights obtained from computational studies of the IL ions.Ionic liquids based on phosphonium cations have properties distinctly different from those based on ammonium cations.32–35 Since the only difference is the central atom, such ionic liquids can be designed to be structurally as close as possible. Phosphonium ionic liquids are valuable beyond basic research because they have good thermal, electrochemical and chemical stability, in addition to a relatively low viscosity.34,36–42 Understanding of ionic liquid behaviour has been improved by comparing the properties of phosphonium and ammonium ionic liquids. In particular, the different properties of these structurally similar ionic liquids have been attributed to the flexibility of the phosphonium cations and the more effective charge screening therein.32–34 A disadvantage of phosphonium ionic liquids is the anaerobic conditions required during the quaternisation reaction. In contrast, amines (the precursors for ammonium ionic liquids) can be handled under air and a wide variety is readily available.
Ether side chains provide an excellent means of changing the physicochemical behaviour of ionic liquids.43 By replacing methylene groups with ether groups, the primary structure of the ionic liquid remains the same (with only a minor mass change). Side chains containing ether groups usually lead to a higher fluidity compared to their alkyl counterparts.7,24,42,44–46 Ether groups are generally introduced into the cation, but the effect is also evident when used in anions.47 Closely connected to the increase in fluidity is an increase in other transport properties, because of the accelerated dynamics.48 It has been proposed that the movement of the flexible chain creates free volume, which increases the dynamics.49 Nevertheless, employing ether side chains as a design element also adds considerable complexity, since the properties of the resulting ionic liquid are strongly influenced by the number of ether groups and the position of the ether group in the side chain.44,50
The cations in this work ([P5551]+, [N5551]+, [P(2O2)31]+ and [N(2O2)31]+) are isostructural and have similar molecular weights. Hence, changes in the thermal and transport properties can be assigned to either ether functionalisation or the difference between ammonium or phosphonium centres, and the relative contributions from each functionality can be assessed.
Anions of different conformational flexibility were chosen for this study based upon a preceding theoretical study.18 Ionic liquids with the 2,2,2-trifluoro-N-(trifluoromethanesulfonyl)acetamide, [NTfTFA]−, anion are known to have high fluidities and low melting points, similar to those with the [NTf2]− anion.51 Both [NTfTFA]− and [NTf2]− are of comparable flexibility, however their potential energy surfaces exhibit qualitatively different minima.18
The [CHTf2]− anion is formally obtained from [NTf2]− by replacing the imide group with a methanide group. Thus, the two anions have almost the same molecular weight, the same degree of fluorination, and a comparable acidity for their conjugate acids.52,53 The only significant difference between [CHTf2]− and [NTf2]− is their conformational flexibility.18 Both [CHTf2]− and [NTf2]− exist as cis or trans conformers, but the energy barrier for conversion between the conformers is significantly higher for [CHTf2]−.18 Thus, a comparison of ionic liquids containing these two anions gives insight into how macroscopic properties of the ionic liquid are influenced by the conformational flexibility of the constituent anions.
Similar to the pair [NTfTFA]−/[NTf2]−, the tetracyanoborate [B(CN)4]− anion was included to complement [CHTf2]− as a rigid anion. The [B(CN)4]− anion is weakly coordinating and, although significantly lower in mass, of a comparable size to the other ions. The volume of the [B(CN)4]− anion is 74% of the volume of [NTf2]−. To further illustrate this point, the volume obtained from the integrated electron density of the tetramethylphosphonium [P1111]+ cation and the (bis(fluorosulfonyl)imide) [NFs2]− anion are both lower than that of [B(CN)4]−, see ESI,‡ Section 3.1. Furthermore, [B(CN)4]− serves as ideal, rigid anion due to its high symmetry and lack of pronounced interaction sites.
Rheological properties
Usually it is desirable for the viscosity of ionic liquids to be as low as possible. However, ionic liquids are in general less fluid than molecular organic solvents. The viscosity is often an important consideration when working with ionic liquids because high viscosity complicates handling and impedes mass transport.Viscous flow occurs due to impeded transitions between a large number of thermally accessible minima on a potential energy surface, the description of which is the purpose of basin theory.54,55 Usually, several minima separated by small barriers cluster together, forming metabasins.56 The minima and separating barriers can arise from preferred mutual orientations of the ions,57–59 but also from electrostatic constraints or different conformations.23 The height of the barriers impacts on the transport properties.54,60,61 If the barriers separating the conformers are too high, even ions that can exist in many different conformations can be expected to have high viscosities and high glass transition temperatures.
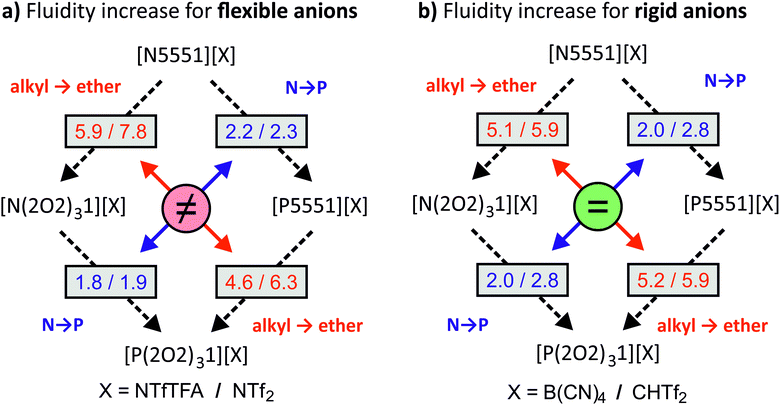
The variation of cations and anions in this study was found to have a significant impact on the viscosity of the ionic liquids. In this subsection we will first discuss the absolute viscosity values, followed by ratios between viscosities of structurally similar systems. The connections between ammonium vs. phosphonium, ether vs. alkyl side chains, and rigid vs. flexible anions are shown schematically in Fig. 2. The numbers given in the boxes are the factors by which fluidity is increased/viscosity is decreased when introducing a phosphonium centre (blue) or ether side chain (red). For any given rigid anion, the relative effect of changing one design element remains the same regardless of the other design element (i.e. the relative effect of adding ether functionalities is the same for both N and P centres, and the relative effect of changing from a N to a P centre is the same for both ether and alkyl substituted ions). However, no such behaviour is seen for ionic liquids with flexible anions. Thus, we hypothesise that there must exist at least two distinct mechanisms of structural relaxation for the ionic liquids in investigated this work.
The viscosity values at room temperature are shown in Table 1. Experimental viscosity data and the corresponding Vogel–Fulcher–Tammann fits can be found in the ESI,‡ Section 2.3.
| Cation | Anion | |||
|---|---|---|---|---|
| [B(CN)4]− | [NTfTFA]− | [NTf2]− | [CHTf2]− | |
| [P(2O2)31]+ | 28.2 | 30.6 | 32.8 | 65.7 |
| [N(2O2)31]+ | 56.8 | 54.0 | 61.2 | 181 |
| [P5551]+ | 148 | 141 | 206 | 390 |
| [N5551]+ | 290 | 316 | 480 | 1074 |
The viscosities of ionic liquids with the same anion, but different cations followed the trend [P(2O2)31]+ < [N(2O2)31]+ < [P5551]+ < [N5551]+ for all four anions. Regardless of the anion, the viscosities at room temperature were an order of magnitude lower when comparing [P(2O2)31]+ with [N5551]+ based ILs. For comparison, the widely used ionic liquid 1-butyl-3-methylimidazolium bis(trifluoromethanesulfonyl)imide [C4C1im][NTf2] has a viscosity of 52 mPa s at 25 °C,62 which is intermediate between the viscosities of the [N(2O2)31][NTf2] and [P(2O2)31][NTf2], despite a much lower mass of the [C4C1im]+ cation.
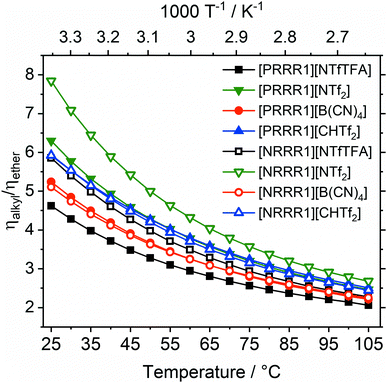
The liquefying effect of the ether side chains becomes apparent in direct comparison of structural analogues with and without ether side chains. A viscosity ratio ηalkyl/ηether > 1 indicates an increase in fluidity upon introduction of the three ether side chains, Fig. 3. The substituents ‘R’ of the pairs are the ether side chain (R = 2O2) and the alkyl chain (R = 5).
The factor ηalkyl/ηether by which fluidity was increased at room temperature was between 4.6 (for [PRRR1][NTfTFA]) and 7.8 (for [NRRR1][NTf2]). The viscosity ratio for [NRRR1][NTf2] was the highest of the set of ionic liquids studied at 7.8, followed by [PRRR1][NTf2] at 6.3. A viscosity ratio of 5.9 was found for [NRRR1][NTfTFA], whereas [PRRR1][NTfTFA], a pair which already has very low absolute values of viscosity, showed the lowest decrease in viscosity (i.e., increase in fluidity) of 4.6.
The viscosity ratio ηalkyl/ηether can be used to group flexible and rigid anions together, despite the different absolute viscosity values of the ionic liquids. The impact of ether functionalisation was comparable between phosphonium and ammonium centres for the rigid [B(CN)4]− and [CHTf2]− anions, with viscosity ratios of approximately 5 and 6, respectively. This was not the case for the [NTf2]− and [NTfTFA]− anions. The ηalkyl/ηether ratios are significantly different to each other when comparing the [PRRR1]+ and [NRRR1]+ pairs, for the ILs formed from flexible anions as opposed to the rigid anions.
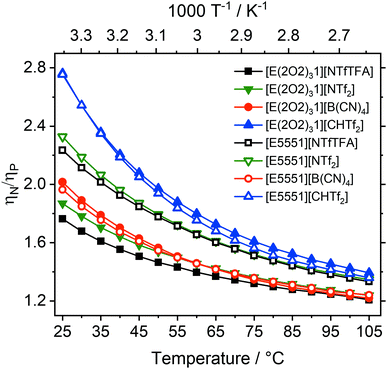
The viscosity ratio can be calculated for ionic liquids which only differ in the central atom (ηN/ηP), Fig. 4. These ratios quantify the increase in fluidity/decrease in viscosity when the quaternary ammonium atom (E = N) is replaced with phosphonium (E = P).
The influence of the central atom species on the viscosity ratios is comparable to the effect of introducing a single ether group on a single side chain, and hence is much smaller, spanning a range from 1.8 to 2.8 at room temperature, than the effect of adding three ether side chains.24,42
The smallest decrease in relative viscosity was again found for [E(2O2)31][NTfTFA] which already has a very low absolute viscosity value (1.8), compared to a ratio of 2.2 for [E5551][NTfTFA]. A similar trend was found for the [NTf2]− anion, with the ratio being much higher for [E5551][NTf2] (2.3) than for [E(2O2)31][NTf2] (1.9).
Similar to ηalkyl/ηether, the differences of the ratios ηN/ηP between the [E(2O2)31] and [E5551] pairs show a behaviour dependent on whether the corresponding anion is flexible or not. A significant difference between ηN/ηP was found within pairs with the flexible [NTfTFA]− and [NTf2]− anions, respectively. Specifically, the ratio ηN/ηP increases from 1.8 for [E(2O2)31][NTfTFA] to 2.2 for [E5551][NTfTFA] and from 1.9 for [E(2O2)31][NTf2] to 2.3 for [E5551][NTf2]. In contrast, the increase of fluidity when replacing ammonium by phosphonium was the largest for the rigid [CHTf2]− anion, regardless of whether ether functionalisation was already present or not. The ratio ηN/ηP was 2.8 for both [E(2O2)31][CHTf2] and [E5551][CHTf2]. Similarly, for the rigid [B(CN)4]− anion, the same increase in fluidity was found for the ionic liquids both with and without ether side chains (2.0 for both [E(2O2)31][B(CN)4] and [E5551][B(CN)4]).
All entries in Fig. 3 and 4 are larger than one. Thus, exchanging ammonium with phosphonium and/or introducing ether groups always decreased the viscosity in the set of ionic liquids. Fig. 3 and 4 show relative values; the absolute viscosities followed the trends shown in Table 4. Both the absolute viscosity and the influence of ether or phosphonium functionalisation decreased with increasing temperature. This parallels the observations above that the influence of these changes is weaker for ionic liquids that already have relatively low viscosities at room temperature.
The thermal transitions, TGA traces and rheological data clearly showed that ether-functionalised phosphonium ionic liquids are most suited for applications that require high fluidity around or even significantly below room temperature, where large effects can be achieved.
Viscous flow can be understood in terms of transitions between metabasins.55,60 Metabasins are separated by higher energy barriers than the small barriers between the local minima within a single metabasin. At elevated temperatures, sufficient energy becomes available for the ions to overcome the higher metabasin barriers, whereas at lower temperatures these barriers can be significant. Thus, at higher temperatures even relatively inflexible ions can interchange between conformations, while the conformational flexibility of both cation and anions gains significance as a limiting factor for structural relaxation at low temperatures.
The anion trends of the absolute viscosities were less clear than the cation trends. The viscosities increased in the order [B(CN)4]− ≈ [NTfTFA]− < [NTf2]− < [CHTf2]− for all ionic liquids in this work. The low viscosity of [B(CN)4]− containing ionic liquids is anticipated, given the lower mass and volume of [B(CN)4]− in comparison to the other anions. Both [B(CN)4]− and [CHTf2]− show closely overlapping curves (of the same colour) in Fig. 3 and 4, despite the different absolute viscosity values of these ionic liquids.
The lowest viscosity values at 25 °C within our set of ionic liquids barely fall below 30 mPa s, in agreement with values for other ionic liquids with similar cations.24 This lower boundary is likely due to other limiting factors such as the mass of the ions or electrostatic restrictions.23 Even for ionic liquids composed of small ions, viscosities of less than 15–20 mPa s (at ambient temperature) are very rare. Lower viscosity values in pertinent data bases7,63,64 often arise from flaws in the employed methodology, such as impurities in the ionic liquids (especially water). The decrease in viscosity achieved by additional flexible groups becomes smaller the more elements with high flexibility that are already incorporated in the ionic liquid. Hence, there appears to be a lower boundary for viscosity, beyond which further enhancements to conformational flexibility will not reduce the viscosity any further. In order to go below this boundary, it is necessary to reduce the mass of the ions or to change the ion type (e.g., by changing from imide to borate).11
The relative viscosity trends with respect to the choice of anion reveal two different groups of anions. For [B(CN)4]− and [CHTf2]−, there was little mutual influence between the viscosity changes upon introduction of ether side chains or phosphorus into the cation. The viscosity ratio curve belonging to [NRRR1][B(CN)4] almost coincides with that of [PRRR1][B(CN)4], as does that of [NRRR1][CHTf2] with [PRRR1][CHTf2] in Fig. 3. Similar behaviour is seen in Fig. 4 for [E5551][B(CN)4] together with [E(2O2)31][B(CN)4] and also for [E5551][CHTf2] with [E(2O2)31][CHTf2]. In contrast to [NTf2]− and [NTfTFA]−, [B(CN)4]− and [CHTf2]− can be considered rigid in the sense that they tend to remain in a given conformation. It appears that the conformational flexibility in the anion is connected to the cooperative behaviour between ether functionalisation and changing to phosphonium centres. Different mechanisms such as charge screening and conformational flexibility have been reported to be at the root of the beneficial properties of phosphonium ionic liquids.32–34 It appears that the choice of the counter anion determines which mechanism is prevalent. The dependence of the mechanism of structural relaxation on the type of counterion can be further investigated with the help of molecular dynamics simulations, which will be the subject of future studies.
Thermal properties and density
Ionic liquids are a diverse class of materials, and this is reflected in their thermal behaviour. In contrast to inorganic molten salts, the low liquidus temperatures of many ionic liquids facilitate handling under laboratory conditions and enable work with organic solutes. For many applications it is desirable that the liquid range be as wide as possible, with both low melting points and high decomposition temperatures. The cations and anions investigated in this work have shown that appropriate ion selection provides an excellent means of tuning thermal transitions, Table 2.| System | T G | T CC | T M |
|---|---|---|---|
| a T S–S (solid–solid transition) at −12 °C. b T C (crystallisation) at 8 °C. | |||
| [P(2O2)31][NTfTFA] | −91 | −50 | −21 |
| [P(2O2)31][NTf2] | −91 | −52 | −30 |
| [P(2O2)31][B(CN)4] | −83 | — | — |
| [P(2O2)31][CHTf2] | −76 | — | — |
| [P5551][NTfTFA] | −84 | −43 | 9 |
| [P5551][NTf2] | −81 | −47 | 20 |
| [P5551][B(CN)4] | −84 | — | — |
| [P5551][CHTf2] | −71 | −28 | 24 |
| [N(2O2)31][NTfTFA] | −81 | — | — |
| [N(2O2)31][NTf2] | −80 | — | — |
| [N(2O2)31][B(CN)4] | −71 | — | — |
| [N(2O2)31][CHTf2] | −66 | — | — |
| [N5551][NTfTFA]a | −77 | −35 | 3 |
| [N5551][NTf2] | −72 | −48 | 37 |
| [N5551][B(CN)4] | −73 | −21 | 8 |
| [N5551][CHTf2]b | — | — | 46 |
Ionic liquids can be classified by their thermal transitions, and the ionic liquids in this set, with the exception of [N5551][CHTf2], which crystallised upon cooling, belonged to one of two types:65 (Type 1) exhibited only a glass transition TG; (Type 2) exhibited, in addition to a glass transition, cold crystallisation TCC and subsequent melting TM upon heating.
Changing the side chain from purely alkyl to ether functionalised, in general, decreased the glass transition temperature. The melting points of ether analogues were also either considerably lowered or no longer observed when compared with their alkylated counterparts. The most marked decrease in melting point was obtained for [P5551][NTf2]/[P(2O2)31][NTf2], for which TM was reduced by 50 °C from 20 °C to −30 °C. All ionic liquids with the [N5551] cation showed melting points (Type 2), whereas only glass transitions were found for ionic liquids with the [N(2O2)31]+ cation (Type 1). The effect of alkyl/ether substitution was less pronounced for the [B(CN)4]− anion compared to the other three anions.
The same desirable reduction in melting point and glass transition temperature was observed when changing from the ammonium to phosphonium based ionic liquids. An exception was the pair [N5551][NTfTFA]/[P5551][NTfTFA], where the melting point of the phosphonium was 6 °C higher than the ammonium analogue. For all seven combinations with TG points, where only the central atom is changed, the TG of the phosphonium was 7–12 °C lower than the ammonium analogue.
The glass transition temperatures of ionic liquids with a common cation, but different anions followed the general trend [NTf2]− ≈ [NTfTFA]− < [B(CN)4]− < [CHTf2]−. The melting points followed the same trend. An exception was [N5551][NTfTFA], for which a considerably lower TM value was found compared to [N5551][NTf2]. The difference between [N5551][NTfTFA] and [N5551][NTf2] is possibly due to these exhibiting different crystal structures, which would also explain the additional solid–solid transition at −12 °C for [N5551][NTfTFA]. Ionic liquids are well known to often exhibit different polymorphs and considerable disorder in the crystalline state. The polymorph obtained can also vary with the crystallisation conditions.66
The trends observed here can be consistently rationalised by considering the conformational flexibility of the ions. Both ether side chains and phosphonium centres are known to lead to lowered barriers for rotations around key bonds when compared to alkyl side chains and ammonium centres, respectively. Conformational flexibility entropically favours the liquid phase, and the crystalline phase is destabilised. In terms of potential energy surfaces, conformational flexibility arises from the presence of a large number of minima separated by small barriers.54 The influence of anion conformational flexibility can be seen when comparing [NTf2]− and [CHTf2]− ionic liquids. The two anions are isostructural, have the same degree of fluorination, and a similar mass. The main difference between [NTf2]− and [CHTf2]− is the barrier for rotation around the C–S–X–S dihedral, with X = C or N. The barrier for rotation is much higher for [CHTf2]− than for [NTf2]−, as will be shown shortly in the Theory section.18
[P(2O2)31][NTf2] is analogous to [N5551][CHTf2] in structure, size, and degree of fluorination. However, [N5551][CHTf2] exhibits the least conformational flexibility for each of the three possible functional variations (alkyl/ether, P/N, [CHTf2]−/[NTf2]−). Thus, the rigid [N5551][CHTf2] was the only one of the investigated systems which crystallised upon cooling. In contrast, [P(2O2)31][NTf2] is the most flexible. The practical value of these three simple design elements is clearly visible in the melting points of the two ionic liquids, which were 76 °C apart. [N5551][CHTf2] was found to melt at 46 °C and crystallise at 8 °C, whereas the melting point of [P(2O2)31][NTf2] was −30 °C.
If an increase in flexibility and free volume was the only mechanism to determine the properties of ether functionalised ionic liquids, then the density of ionic liquids with ether side chains should be lower than their alkylated counterparts. However, contrary to this hypothesis, the densities of ether-functionalised analogues are higher than those of their alkylated counterparts, Table 3. All experimental densities and fit parameters are provided in the ESI,‡ Section 2.2.
| Cation | Anion | |||
|---|---|---|---|---|
| [B(CN)4]− | [NTfTFA]− | [NTf2]− | [CHTf2]− | |
| [P(2O2)31]+ | 0.995 | 1.245 | 1.293 | 1.284 |
| [N(2O2)31]+ | 0.989 | 1.246 | 1.297 | 1.286 |
| [P5551]+ | 0.915 | 1.152 | 1.202 | 1.191 |
| [N5551]+ | 0.907 | 1.156 | 1.206 | 1.193 |
All ether functionalised ionic liquids exhibited a density approximately 8% higher than that of their alkylated counterpart. The higher density indicates that structural changes must have occurred at a molecular level. For instance, Kashyap et al. associated the differences between alkyl and ether functionalised ionic liquids with the coiling of the ether side chains.67
A larger free volume should also result in a decrease of density for the flexible phosphonium ionic liquids, compared to the more rigid ammonium analogues. This expected behaviour was observed for the fluorinated anions, despite the higher mass of phosphorus. However, differences were marginal.
The upper liquid range of ionic liquids is usually limited by thermal decomposition, even for applications under reduced pressure, due to the extremely low volatility of ionic liquids. Decomposition is a chemical rather than a physical process. The relative thermal stability can be judged from dynamic TGA carried out with moderate heating rate (+10 °C min−1), which also allows for a comparison with the literature values of other ionic liquids. The onset temperatures obtained for the investigated samples are shown in Table 4. The TGA traces are given in the ESI,‡ Section 2.1.
| Cation | Anion | |||
|---|---|---|---|---|
| [B(CN)4]− | [NTfTFA]− | [NTf2]− | [CHTf2]− | |
| [P(2O2)31]+ | 353 | 328 | 346 | 288 |
| [N(2O2)31]+ | 313 | 306 | 331 | 302 |
| [P5551]+ | 409 | 393 | 400 | 374 |
| [N5551]+ | 352 | 339 | 388 | 339 |
In the pairs where only the central atom was changed, the phosphonium were generally more stable than the ammonium ionic liquids. The only exception was [P(2O2)31][CHTf2], which had the lowest decomposition onset of 288 °C. The order of stability with changing anion was [B(CN)4]− > [NTf2]− > [NTfTFA]− > [CHTf2]− for phosphonium ionic liquids and [NTf2]− > [B(CN)4]− > [NTfTFA]− > [CHTf2]− for ammonium ionic liquids. Furthermore, the alkyl functionalised ionic liquids were in all cases more stable than those with an ether functionality.
The lower stability of [CHTf2]− based ionic liquids compared to [NTf2]− is likely due to a decomposition pathway specific to the [CHTf2]− anion, however an investigation of this pathway is beyond the scope of this work.
Ionic conductivity and hole theory
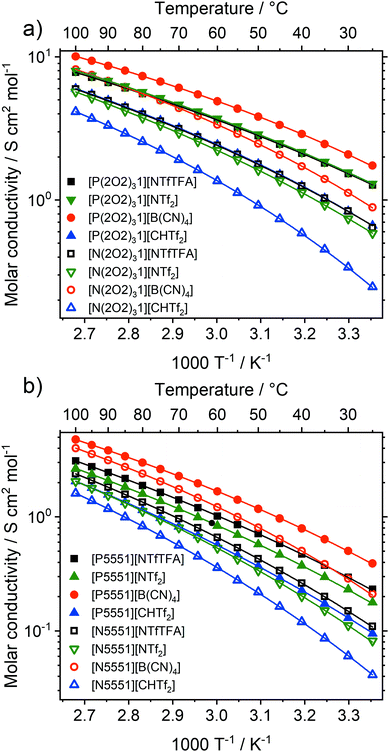
Ionic liquids have great potential in electrochemical applications, and molar ionic conductivity as a measure for ion transport plays a central role among transport properties.1,2,68Fig. 5 shows the molar conductivities of the ionic liquids in this work as a function of temperature. Experimental data for the specific and molar conductivity as well as fit parameters are given in the ESI,‡ Section 2.4.The molar conductivities at room temperature ranged from 0.04 S cm2 mol−1 for [N5551][CHTf2] to 1.74 S cm2 mol−1 for [P(2O2)31][B(CN)4]. For comparison, the molar conductivity of the widely used ionic liquid [C4C1im][NTf2] at room temperature is 1.10 S cm2 mol−1.69 All of the ionic liquids with the [P(2O2)31]+ cation (except [P(2O2)31][CHTf2]) exceeded the molar conductivity of [C4C1im][NTf2]. The molar conductivity of [P(2O2)31][CHTf2] was slightly lower at 0.66 S cm2 mol−1. The electrical conductivity scales with the inverse of the viscosity, and thus increased in the order [N5551]+ < [P5551]+ < [N(2O2)31]+ < [P(2O2)31]+ for all anions. The molar conductivities of the tetracyanoborate ionic liquids were remarkably high. For example, [P(2O2)31][B(CN)4] has a molar conductivity of 1.74 S cm2 mol−1 at room temperature, which even exceeds the molar conductivity of tris(2-ethoxyethyl)methylphosphonium bis(fluorosulfonyl)imide [P(2O2)31][NFs2] (1.48 S cm2 mol−1).24 The high electrical conductivity and low viscosity make [P(2O2)31][B(CN)4] an interesting IL for practical applications in electrochemical devices such as batteries.
Hole theory provides a useful framework to describe the properties of ionic liquids, including the relationship between viscosity and electrical conductivity.70,71 Hole theory states that, for an ion to move through the bulk ionic liquid, a nearby void of suitable size must be available. Since the voids are at low concentration, the Stokes–Einstein equation can be used, which gives eqn (1) for the molar conductivity Λ. Eqn (1) is a variation of the Walden relation.72
 | (1) |
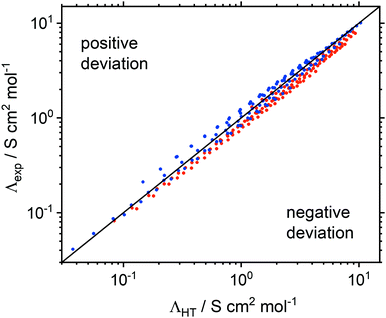
Ion volumes have been obtained from ab initio calculations (on isolated ions in a vacuum) and, using the volume formula for a sphere, the ion radii have been derived. This approach was chosen over more accurate methods11,74,75 for simplicity and because experimental parameters are not required. Despite this crude approximation, the correlation between measured and predicted values is good. Moreover, deviations can be readily explained by shortcomings of the hole model. The absolute values for experimental and molar conductivity at room temperature can be found in the ESI‡ in Section 2.5 and Table S9, together with the relative deviation of the experimental molar conductivity Λexp from ΛHT at 25 °C and 100 °C.
The ion radii were obtained from a sphere with the same volume as that obtained from the integrated electron density of the ions in the gas phase. Deviations represent corrections for free volume in the liquid and the impact of non-spherical ion shapes. A negative deviation (Λexp < ΛHT) suggests that the effective radii in eqn (1) are too small, i.e. that hydrodynamic radii were underestimated by the gas phase calculation. The deviations of Λexp from ΛHT decreased with increasing temperature, Table S9 (ESI). Eqn (1) has no temperature dependence outside of the viscosity, i.e. the hydrodynamic radii are constants. Thus, the hydrodynamic radii of cations and/or anions appear to increase with temperature.
Hole theory qualitatively groups ionic liquids with rigid ([CHTf2]− and [B(CN)4]−) and flexible ([NTfTFA]− and [NTf2]−) anions together, Fig. 6. For the ionic liquids with tetracyanoborate anions, pronounced positive deviations of Λexp from ΛHT were found, Table S9 (ESI). The [CHTf2]− anion led to a behaviour similar to tetracyanoborate, albeit with less pronounced positive deviations. In contrast, ionic liquids with the [NTfTFA]− and [NTf2]− anions showed negative deviations from the calculated conductivity. The only exception was [P(2O2)31][NTf2] at room temperature. [NTf2]− and anions of similar shape move by dihedral reorientation, i.e. the creation of free volume, which is consistent with the negative deviations, suggesting that the hydrodynamic radii are larger than the gas phase radii.22 In addition to conformational flexibility, the pronounced positive deviations of the [B(CN)4]− anion might also be a result of the higher sphericity of this (tetrahedral) anion.
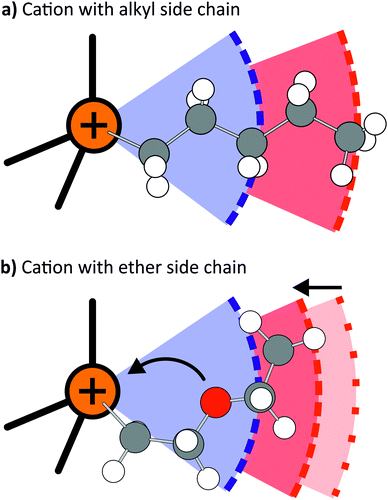
Ether functionalised cations showed a tendency towards more positive deviations of Λexp from ΛHT than the alkyl counterparts. Thus, the hydrodynamic radii of either cation or anion must be larger for systems with an alkyl side chain in the cation, whereas the hydrodynamic radii of systems with ether functionalised cations were overestimated. The dominant effect of the ether side chains within the framework of hole theory is thus not the increase in conformational flexibility, but rather a preference for a different, more compact conformation. As will be shown in the theoretical section, this more compact conformation arises from coiling of the ether side chains, Fig. 7. The oxygen atom points towards the central nitrogen or phosphorus atom, which significantly decreases the hydrodynamic radius, but has only a negligible influence on the gas phase derived volume (and thus the radius). The compact nature of the ether substituted cations is also manifest in the higher densities of the ether-functionalised ionic liquids.
Self-diffusion
In contrast to other transport properties, self-diffusion coefficients can be determined individually for cations and anions. The self-diffusion coefficients for cations and anions in the ionic liquids in this work are presented in Tables 5 and 6, respectively. The average error was 3% of the measured value. A table collecting the self-diffusion coefficients, Haven ratios, and the ratio of cation to anion diffusion is given in the ESI,‡ Section 2.7.| Cation | Anion | |||
|---|---|---|---|---|
| [B(CN)4]− | [NTfTFA]− | [NTf2]− | [CHTf2]− | |
| [P(2O2)31]+ | 33 | 28 | 26 | 13 |
| [N(2O2)31]+ | 17 | 17 | 13 | 5.2 |
| [P5551]+ | 6.3 | 5.9 | 4.2 | 2.1 |
| [N5551]+ | 3.3 | 2.8 | 1.9 | 0.85 |
| Cation | Anion | |||
|---|---|---|---|---|
| [B(CN)4]− | [NTfTFA]− | [NTf2]− | [CHTf2]− | |
| [P(2O2)31]+ | — | 35 | 32 | 17 |
| [N(2O2)31]+ | — | 20 | 16 | 6.6 |
| [P5551]+ | — | 7.5 | 5.3 | 2.8 |
| [N5551]+ | — | 3.4 | 2.3 | 1.1 |
The cation diffusion coefficients strictly followed the trend [P(2O2)31]+ > [N(2O2)31]+ > [P5551]+ > [N5551]+ for all of the anions within the set of ionic liquids. An approximately twofold increase in cation diffusivity was observed for phosphonium compared with ammonium cations with the same chains. The increase in diffusivity was 5–6 fold when the three ether side chains were introduced to ions with the same central element, thus the gain per additional chain is comparable to the effect of the phosphonium centre. This is consistent with the increase in D+ by a factor of 2.5 that has been reported when introducing a single ether side chain into [P1115][NTf2], leading to [P111(2O2)][NTf2].24 For all anions, the cation diffusion increased by an order of magnitude from [N5551]+ to [P(2O2)31]+.
For comparison, the cation in [C4C1im][NTf2] has a self-diffusion coefficient of 28 × 10−8 cm2 s−1 at room temperature,62 which is comparable to [P(2O2)31]+ in the respective [NTf2]− ionic liquid. This is remarkable, as the molecular weight of [P(2O2)31]+ is almost twice that of [C4C1im]+. The higher mobility of phosphonium cations has been attributed to the enhanced rotation around the P–C bonds compared to the N–C bonds in ammonium analogues.32 Furthermore, it has been argued that the strongly localised positive charge on the phosphonium centre effectively reduces cation–anion interactions.33 In contrast to ammonium ionic liquids, the charge on phosphonium ionic liquids is less accessible to the anions due to better screening of the charge by the alkyl chains.32
The anion diffusion coefficients followed the same trend as for the cations, i.e. the diffusivity decreased with the paired cation in the order [P(2O2)31]+ > [N(2O2)31]+ > [P5551]+ > [N5551]+. The diffusivity of [NTf2]− in [P(2O2)31][NTf2] was found to be ≈50% higher than in [C4C1im][NTf2] (21 × 10−8 cm2 s−1).62
For both cations and anions, diffusion followed the trend ([B(CN)4]−) > [NTfTFA]− > [NTf2]− > [CHTf2]−. Unfortunately, the diffusion of the [B(CN)4]− anion was not accessible with our instrumentation. However, information on the diffusion of the [B(CN)4]− anion can be obtained from comparing the cation diffusion values. Cations in ionic liquids with [B(CN)4]− had the highest diffusion coefficients. The [NFs2]− anion is 8% smaller in terms of volume, which could be expected to give rise to higher values of cation diffusion than the [B(CN)4]− anion,76 however, the reverse was found. For example, the self-diffusion coefficient of the cation in [P(2O2)31][NFs2]24 is 26 × 10−8 cm2 s−1 while that for [P(2O2)31][B(CN)4] is 33 × 10−8 cm2 s−1. This result further supports a distinct mechanism of ion mobility for ionic liquids with rigid anions.
For the three anions (other than tetracyanoborate) the ratio D−/D+ is shown in Table 7. All D−/D+ ratios are larger than one, i.e. all anions diffused faster than the cations. For comparison, the D−/D+ ratio is about 0.8 for [C4C1im][NTf2], i.e. the cation diffuses faster than the anion.62 The higher relative anion diffusion for the ionic liquids in this work can be attributed to the more bulky cations compared to [C4C1im]+. The fluorinated anions examined in this work also all have higher mass than the cations, however, the anion mass is due to the high degree of fluorination and the anion volumes are considerably smaller than those of the cations. Self-diffusion ratios should thus be compared between ions with similar mass, such as the ones shown in Table 7.
| Cation | Anion | |||
|---|---|---|---|---|
| [B(CN)4]− | [NTfTFA]− | [NTf2]− | [CHTf2]− | |
| [P(2O2)31]+ | — | 1.24 | 1.21 | 1.30 |
| [N(2O2)31]+ | — | 1.20 | 1.19 | 1.26 |
| [P5551]+ | — | 1.26 | 1.25 | 1.33 |
| [N5551]+ | — | 1.21 | 1.22 | 1.29 |
For all ionic liquids in this work, the D−/D+ ratio was higher for the phosphonium ionic liquids. A possible rationalisation is that reduced cation–anion interactions have led to decoupling of the cation and anion motions, which has enabled an increase of the difference between the diffusion coefficients.
In contrast, the diffusivity D−/D+ ratio decreased when ether side chains were introduced into the cation, i.e. the movement of both ions is more closely coupled. The mechanism by which the dynamics of the cation are accelerated (see also Table 5) appears to be different to that engendered by substitution of nitrogen with phosphorus. One rationalisation for the increase in D+ is based on predominant conformation of the cation. Pronounced coiling of the ether side chain has been reported for diether substituted ammonium and phosphonium ionic liquids compared to the alkyl analogues.67 The coiling depends on the length of the side chain, an all-trans conformation was reported for pyrrolidinium cations with only one methylene spacer between ammonium centre and ether oxygen.77 Cations with ether side chains adopt a more spherical shape, reducing the hydrodynamic radius rh which reduces D (through the Stokes–Einstein relation D ∼ rh−1).
A second rationalisation for the increase in D+ is related to the preferred solvation environment of the ether, compared to the alkylated, side chain in cations. For alkyl side chains of sufficient length, the charge-rich and charge-poor regions of the cation form distinct nanoscale domains.14,78,79 This segregation is disrupted by the presence of ether groups, which have a higher tendency to interact with the charge-rich regions of the IL, including the anion.67 Thus, the cation is no longer slowed by dispersive cation–cation interactions.
The [CHTf2]− anions showed the highest diffusion relative to the diffusion of the cations, albeit its absolute diffusion values were consistently the lowest in this set. The high values of relative diffusion indicate that the dynamics of the cation and anion are more independent. One rationalisation for this behaviour is that the rigidity of the [CHTf2]− anion reduces coupling between the conformational and translational motions of the ions. Overall dynamics are slowed down, but the effect is more pronounced for the cation. This finding supports the hypothesis that more than one distinct mechanism dominates structural relaxation. One of these mechanisms requires conformational flexibility of at least the anion, and leads to higher mobility of both cation of anion. The second mechanism is unspecific (with regard to anion flexibility), but less efficient in the case of ionic liquids with the [CHTf2]− anion.
For comparison with the viscosity ratios in Fig. 3 and 4, the corresponding cation diffusion coefficient ratios are shown in Table 8.
| Cations | Anion | |||
|---|---|---|---|---|
| [B(CN)4]− | [NTfTFA]− | [NTf2]− | [CHTf2]− | |
| [PRRR1] | 5.2 | 4.7 | 6.2 | 5.9 |
| [NRRR1] | 5.2 | 5.8 | 6.9 | 6.1 |
| [E5551] | 1.9 | 2.1 | 2.2 | 2.5 |
| [E(2O2)31] | 1.9 | 1.7 | 2.0 | 2.4 |
In general, a reciprocal influence between phosphonium/ammonium and ether/alkyl functionalisation is evident. If a phosphonium centre is already present, then the gain in mobility is lower when ether side chains are introduced. Similarly, if ether side chains are already present, the gain in mobility is lower when a phosphonium centre is introduced. This effect was less pronounced for the rigid [CHTf2]− and [B(CN)4]− anions. The decreased coupling between the effects of ether and phosphonium functionalisation for ionic liquids with the [CHTf2]− and especially the [B(CN)4]− anion is consistent with the earlier viscosity data.
Liquid structure
The internal liquid structure of ionic liquids can be probed by Small Angle X-ray Scattering (SAXS). Many ionic liquids show three distinct peaks in the scattering vector q below 2 Å−1, Fig. 8b.80 The ‘adjacency peak’ at highest q values results from both inter- and intramolecular correlations between neighbouring atoms (Fig. 8a, green arrows) and is also found for molecular liquids.80,81 For ionic liquids, inherent charge ordering (Fig. 8a, red arrows) usually gives rise to a ‘charge peak’ at intermediate q values, which can be absent in some cases due to cancellation.80,81 For ionic liquids with extended alkyl chains, a third peak at a very low q value (around 0.5 Å−1) can be observed, often termed the ‘prepeak’ or ‘polarity peak’. The polarity peak is a signature of long-range correlations between polar groups, caused by aggregation of the alkyl chains (Fig. 8a, blue arrows).80,82 The prepeak is thus usually attributed to structural heterogeneity, i.e. the alternation of polar and apolar regions due to the aggregation of nonpolar alkyl side chains.67,80,82 For imidazolium ionic liquids, the packing of alkyl chains can be disrupted by interactions between ether groups and hydrogen atoms of the imidazolium ring.83,84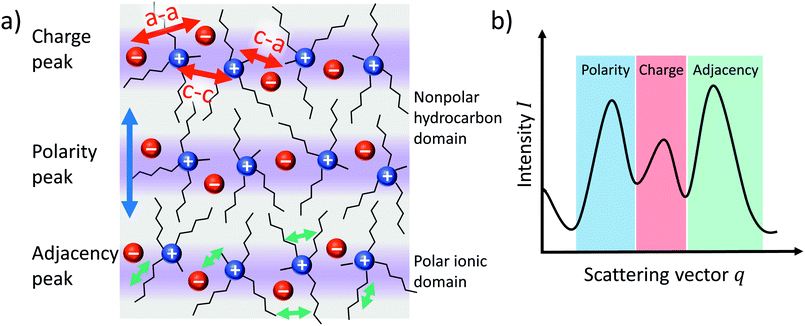 | ||
| Fig. 8 Simplified illustration of (a) the bulk structure of ionic liquids and (b) its manifestation as peaks in the SAXS scattering intensity. | ||
Small Angle X-ray Scattering experiments were performed on all samples. The total scattering intensity for the [NTf2]− ionic liquids is shown in Fig. 9. Radially averaged SAXS scattering data of ionic liquids with the [CHTf2]− and [NTfTFA]− anions are given in the ESI,‡ Section 2.8. A summary of peak positions and experimental uncertainty in peak positions in both reciprocal and real space is also given in the ESI,‡ Section 2.8. Ionic liquids composed from the tetracyanoborate anion will be discussed separately, because the geometry of the [B(CN)4]− anion causes qualitative differences.
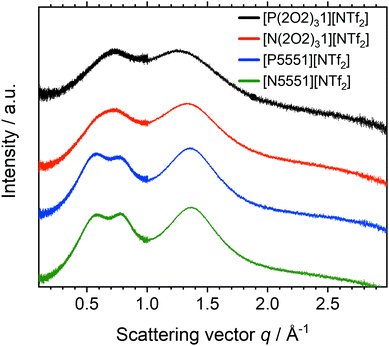 | ||
| Fig. 9 Radially averaged SAXS data for the ionic liquids based on the [NTf2]− anion. The curves are shifted vertically and include error bars for the (small) experimental error. | ||
For [P5551][NTf2] and [N5551][NTf2] three peaks were observed at 0.57, 0.80 and 1.36 Å−1. The values correspond to approximately 11.0, 7.9, and 4.6 Å in real space, respectively. The peaks can be assigned to the underlying structures (intra- and intermolecular) by comparison with similar systems from the literature. All of the ionic liquids based on the [NTf2]− anion in this work show charge (q = 0.80 Å−1) and adjacency (q = 1.36 Å−1) peaks. However, the prepeak at 0.57 Å−1 is only visible for the alkyl analogues. The cation pentyl side chains are just long enough to induce such an ordering. For [N4441][NTf2], such a prepeak is not observed, or at most is just hinted at as a shoulder.81
Incorporating ether side chains into the cations had a pronounced effect on the SAXS profiles of the ionic liquids examined. The prepeak is absent for the ether functionalized ionic liquids. Hence, the structural heterogeneity induced by segregation of apolar regions is lost. These findings match the conclusions drawn from the transport properties discussed above and agree with the behaviour of related systems reported in the literature.67,84 The adjacency and charge peaks are shifted towards lower q values for all of the ionic liquids with fluorinated anions. The shift towards lower q values, and thus longer inter-ion distances, can be interpreted as a signature of pronounced coiling of the ether chains. Ether side chains lead to a contraction of the cation to form a ball, excluding the anion from the region immediately surrounding the positive charge. The average cation–anion distance increases (as does the bulk density).
The changes in the scattering intensity for different anions, with the same cation are shown for the example of the [P5551]+ cation, Fig. 10. The data for the other cations are given in the ESI,‡ Section 2.8.
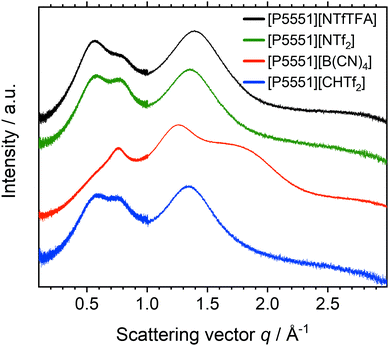 | ||
| Fig. 10 Radially averaged SAXS data for the ionic liquids with the [P5551]+ cation. The curves are shifted vertically and include error bars of the (small) experimental error. | ||
The scattering intensity profiles for [NTfTFA]−, [CHTf2]− and [NTf2]− anions paired with a given cation are qualitatively similar. Thus, despite a pronounced impact on the dynamics, replacing imide with methanide has little effect on the bulk liquid structure, as is apparent from the SAXS profiles. In contrast, the scattering intensity profiles for [B(CN)4]− ionic liquids are markedly different, due to the very different topology of the [B(CN)4]− anion.
Fig. 11 shows the SAXS scattering intensity for the [B(CN)4]− based ionic liquids in this work. One could interpret the presence of three peaks using the conventional assumptions outlined above in terms of polarity, charge, and adjacency relations. This interpretation would imply that all ionic liquids based on the tetracyanoborate anion, with or without ether functionalisation, experience nanoscale segregation. However, the q values would then become unreasonably high (compared to commonly observed q values for polarity, charge, and adjacency relations).
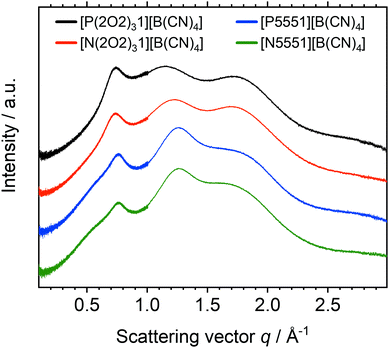 | ||
| Fig. 11 Radially averaged SAXS data for the ionic liquids with the [B(CN)4]− anion. The curves are shifted vertically and include error bars of the (small) experimental error. | ||
It is apparent that the first peak in the tetracyanoborate ionic liquids coincides with the charge peak of the other ionic liquids, Fig. 10. The tetracyanoborate anion is comparable in size to the other anions, despite having only 9 atoms. The volume enclosed by the 0.001 isodensity surface of [B(CN)4]− is even larger than those of [P1111]+ or [N(Fs)2]−. Thus, both peaks at higher q values likely arise due to adjacency correlations. Indeed, a shoulder around 0.5 Å−1 was discernible for [N5551][B(CN)4] and [P5551][B(CN)4], which is presumably the signature of domain formation. The splitting of the adjacency peak into two distinct peaks has been reported previously for [C4C1im][B(CN)4].85 For [C4C1im][B(CN)4] (as opposed to [C4C1im][NTf2]), splitting of the adjacency peak86 into two distinct peaks85 has been attributed to the tetracyanoborate anion interrupting the π-stacking of cations. This argument cannot be used for the anions in this work, since the cations they are paired with do not contain aromatic rings. However, the adjacency region can be considered as a fingerprint region for the ionic liquid.
The absence of the prepeak for the [B(CN)4]− based ILs could be rooted in the increased dynamics of these ionic liquids. However, the viscosity of [N5551][B(CN)4] is higher than that of [P5551][NTf2], which in turn shows the same features in its SAXS profile as [N5551][NTf2]. Thus, the absence of a prepeak is more likely to be due to the poor scattering properties of the (fluorine-free) [B(CN)4]− anion.87
Conformational flexibility from theoretical methods
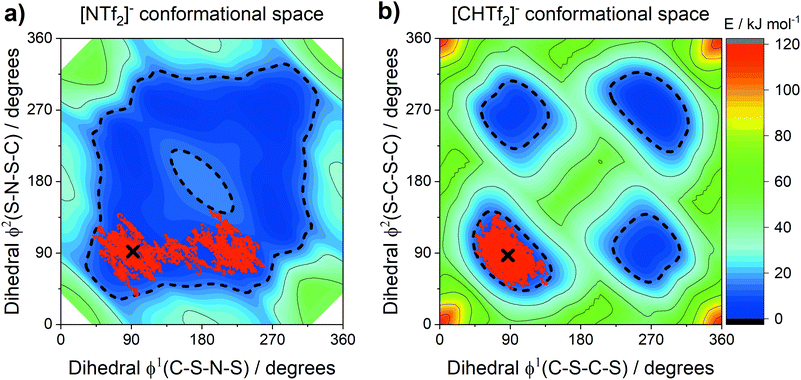
The conformational flexibility of anions similar in structure to [NTf2]− has been extensively investigated by theoretical methods.18,88,89 The relevance of such conformational flexibility for the dynamics in ionic liquids has been established.22,89–91 The anions [NTf2]− and [CHTf2]− exist as two interconvertible conformers, with CF3 groups that can be cis or trans.89 The [CHTf2]− anion has significantly decreased conformational flexibility compared to [NTf2]−.18Fig. 12 shows potential energy surface contour plots (full MP2/cc-pVTZ//B3LYP-GD3BJ/6-311+G(d,p) level of theory) for the two dihedral angles relevant for characterising the cis–trans conversion of [NTf2]− and [CHTf2]−.18 To further evaluate the motion of the ions on the potential energy surface, we computed ab initio (B3LYP-GD3BJ/6-311+G(d,p)) trajectories for the [NTf2]− and [CHTf2]− anions. The pathway of the ab initio molecular dynamics trajectory is indicated by red dots. All trajectories started at the minimum energy conformer, further simulation details are provided in the Materials and methods section.A threshold of 15 kJ mol−1 (dashed line in the potential energy surfaces) has been arbitrarily introduced to indicate which conformations are preferably adopted by the ions. This 15 kJ mol−1 (ca. 6 kT at room temperature) threshold encompasses both the lowest energy transition state between cis and trans for [NTf2]− and the transition state separating two cis conformers.
The [NTf2]− anion, Fig. 12a, sampled a relatively large region around the optimum conformation, including the cis conformer. However, conversion between the mirror images of two cis conformations was not observed, i.e. the top right half of the potential energy surface was not explored in this case. Crossing of the cis-to-cis transition state being rare, is in line with observations from classical molecular dynamics simulations.89 In contrast to [NTf2]−, the [CHTf2]− anion, Fig. 12b, remained close to the starting conformation for the entire trajectory (20 ps), consistent with the ionic liquids containing [CHTf2]− exhibiting significantly slowed transport properties. These trajectories and our empirical results strongly support the ‘slithering’ hypothesis by Suarez et al., that translational relaxation in the [NTf2]− anion is coupled to cis-to-trans conformational relaxation.22
The sampled regions in Fig. 12 were well contained within the 15 kJ mol−1 line. The threshold is thus valuable for the comparison of systems with very different potential energy surfaces. Using the 15 kJ mol−1 threshold, two separate regions for the cis and the trans conformers emerge for [CHTf2]−. In these ionic liquids, the [CHTf2]− anion seems to behave like a mixture of two rigid anions, rather than one flexible anion. The apparent rigidity of the [CHTf2]− anion agrees well with the rheological data, where [CHTf2]− and [B(CN)4]− showed a similar relative behaviour (Fig. 3 and 4), despite having different absolute viscosity values.
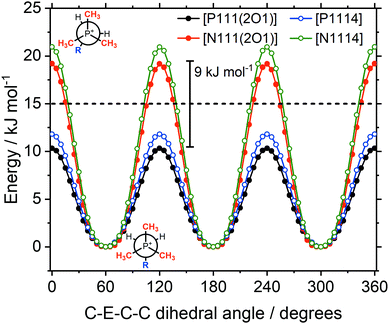
Similarly, the side chain flexibility of the cation plays an important role in the fluidity and dynamics of ionic liquids.23,32,34,89,90,92 The conformational flexibility can be understood in terms of energy barriers for the rotation around bonds. The cations [E111R], with R being 2O1 (ethyl-2-methoxy group) or 4 (butyl group), and E being N (ammonium) or P (phosphonium) have been used as simple model systems for the ionic liquids in this work. In these examples, three dihedral angles define the backbone of the cation: C–E–C–C, E–C–C–X, and C–C–X–C. The general structure of the model systems as well as the nomenclature used to describe conformations is shown in Fig. 13.
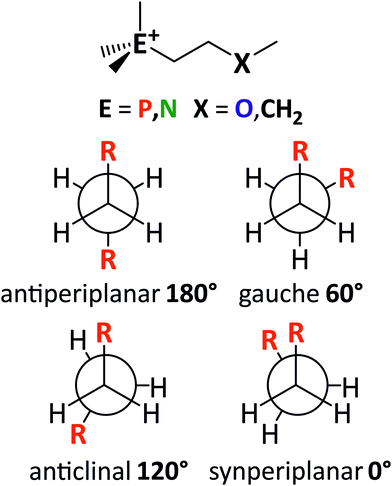 | ||
| Fig. 13 The structure of the model cations [P111(2O1)]+, [P1114]+, [N111(2O1)]+, and [N1114]+ (top). Low-energy conformers (middle) and high-energy conformers (bottom) are shown as Newman-projection. | ||
The cations [P111(2O1)]+ and [N111(2O1)]+ were chosen as they represent the smallest model system that still incorporates all the design elements used in this work. Using an ethyl instead of a methyl group to terminate the ether oxygen is expected to not change the obtained results qualitatively.34 In addition, if the orientation of the side chains that are not part of the scan is not chosen carefully, then the resulting steric clash from an ethyl group biases the results. Furthermore, the (two-dimensional) PES scans at the MP2/cc-pVTZ//B3LYP-GD3BJ/6-311+g(d,p) level of theory become prohibitively expensive for larger cations.
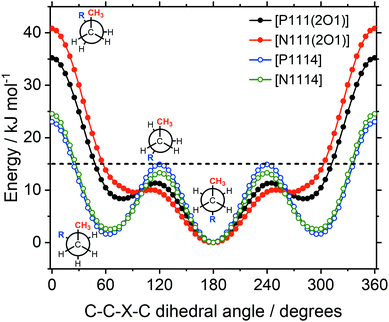
Potential energy surface scans for rotation about the torsion angles for the ‘long’ substituent have been carried out. Rotation about the C–P or C–N bonds, Fig. 14, can be compared to rotations around the CH2–CH2 bond, Fig. 16, and the CH2–X bond, Fig. 15.
The symmetry in Fig. 14 is due to the three equivalent methyl groups. For both the ether and alkyl functionalised cations, the barrier is approximately twice as high for C–N–C–C compared to C–P–C–C. The barriers differ by approximately 9 kJ mol−1 in both cases, consistent with previous literature values.32 Using the rate constant ratio as an estimate,24 a difference of 9 kJ mol−1 corresponds to a 40-fold increase of the conformational reorganisation dynamics, see the ESI,‡ Section 4. The barriers for the phosphonium ionic liquids are below the 15 kJ mol−1 threshold, thus the conformational flexibility of the rotations is comparable to the flexibility of the [NTf2]− anion.
The energy as a function of the C–C–X–C dihedral is shown in Fig. 15. The higher energies of the ether functionalised analogues in the synperiplanar structures may seem surprising at first, since the ether side chain is expected to increase the flexibility. However, the conversion between two gauche structures via the synperiplanar geometry is found to be significantly higher in energy for both alkyl and ether analogues (compared to the conversion between antiperiplanar and gauche via the anticlinal geometry). Hence, the rate determining barrier for conformational reorganisation corresponds to the anticlinal geometry, which was lower in energy for the ether side chains. Thus, based on the energy of the rotation around the C–X bond, the ether side chain can be considered more flexible.
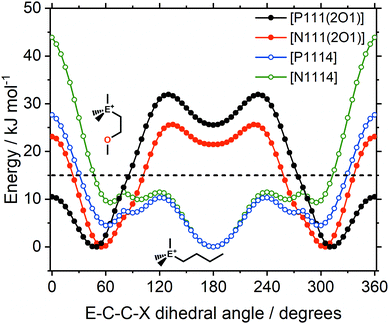
In the design of the ionic liquids for this work, two different cation structural elements were employed; ether/alkyl functionalisation and ammonium/phosphonium as central atomic species. Of central importance is the E–C–C–X dihedral angle, in which both elements are combined and which is expected to have a significant impact on the macroscopic properties. There are pronounced differences in the qualitative nature of the E–C–C–X dihedral potential energy surfaces, Fig. 16.
For the alkyl functionalised cations, the antiperiplanar conformer has the lowest energy. In contrast, the ether functionalised cations prefer the gauche conformation. The gauche preference is a driving force for ‘curling’ of the ether chains identified in the literature.67 Thus, ether functionalisation can be used to design the preferred conformation of a cation. Furthermore, shielding of the cationic charge is much more effective when ether groups physically block access to the cation. The shielding of cationic charge can be rationalised by a decrease of the electrostatic potential on the surface of the molecule, as shown in Fig. S11 in the ESI,‡ and Section 3.2.
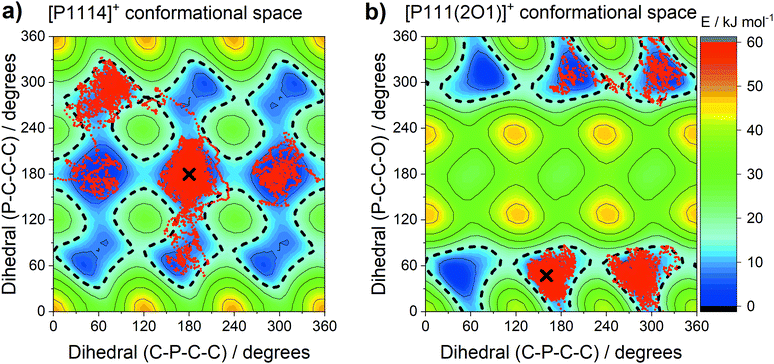
The central atom (P or N) has a pronounced impact on the barrier heights for rotation about the E–C–C–X dihedral angle, in particular the synperiplanar transition structure. The energy of the synperiplanar structure lies below the 15 kJ mol−1 threshold only for the [P111(2O1)]+ cation. Thus, for this cation the structure fluctuates between the two gauche structures. The sampled geometries are visible in the ab initio (B3LYP-GD3BJ/6-311+G(d,p)) trajectories of the isolated [P1114]+ and [P111(2O1)]+ cations, Fig. 17. All trajectories started at the minimum energy conformer, further simulation details are provided in the Materials and methods section.
During each trajectory, rotation around the C–P bond occurred in both [P1114]+ and [P111(2O1)]+, with the rotation being more restricted for [P111(2O1)]+. Similarly, the C–P–C–C dihedral angles in the alkyl analogue [P1114]+ fluctuated between the two symmetrically distinguishable minima. In contrast, the alkyl functionalised cation only explored the gauche conformers, interconverting via the synperiplanar structures. The trajectories and two-dimensional subsets of the potential energy surface provide a clear rationalisation for the experimental results.
Finally, the mutual influence of ether and phosphonium functionalisation is clearly visible in Fig. 16. This result provides an explanation for the experimentally observed coupling between ether and phosphonium functionalisation, Fig. 2. Thus, we can further develop the hypothesis of a distinct mechanism of structural relaxation for ionic liquids with flexible anions. All comparisons in Fig. 2 involve the [P(2O2)31]+ cation, which is the equivalent of the [P111(2O1)]+ model used for the theoretical calculations. Thus, from Fig. 2 and 16, it can be concluded that the distinct mechanism of structural relaxation for the ions in this work involves the E–C–C–X dihedral angle.
Conclusions
In this work, a set of 16 systematically varied ionic liquids was prepared and characterised to reveal structure–property relationships. Ammonium and phosphonium cations were used, both with and without ether functionalisation. The widely used [NTf2]− anion was selected as an anion with high conformational flexibility. The [NTfTFA]− anion was selected for its flexibility and to complement [NTf2]−. Furthermore, two rigid anions, [B(CN)4]− and [CHTf2]−, were used to demonstrate the influence of anion conformational flexibility on the ionic liquid properties. Each possible 1![[thin space (1/6-em)]](https://www.rsc.org/images/entities/char_2009.gif) :
:![[thin space (1/6-em)]](https://www.rsc.org/images/entities/char_2009.gif) 1 combination of the four cations with the four anions was prepared.
1 combination of the four cations with the four anions was prepared.
Ether side chains in the cation were found to have a pronounced impact on the macroscopic properties of the ionic liquids in this work. Glass transition and melting temperatures were significantly decreased compared to the purely alkyl functionalised cations. The ether side chains led to accelerated dynamics, visible in increased ionic conductivity, increased diffusivity, and decreased viscosity. Ionic liquids with ether side chains are thus promising fluids for applications at or below room temperature.
The thermal and transport properties of ether functionalised cations were interpreted as a signature of pronounced coiling. Instead of the side chain extending away from the quaternary centre as is the case for pure alkyl side chains, the ether groups point inwards and produce a smaller cation. Furthermore, the ether functionalisation was found to prevent or at least suppress nanoscale segregation. The structural heterogeneity of ionic liquids with alkylphosphonium or alkylammonium cations was lost when ether side chains were introduced. The curling up of the side chains is consistent with the experimental data and appears to dominate over conformational flexibility.
The use of phosphonium as opposed to ammonium cations led to changes in the thermal and transport properties; liquidus temperatures and viscosities were reduced, whereas self-diffusion and ionic conductivity were increased. The changes in the thermal and transport properties have been rationalised as based on the higher conformational flexibility of the phosphonium cations compared to their ammonium counterparts. In contrast, the ether side chains change the geometry of the minimum energy conformer, rather than lowering the barriers between different conformers. Both the high flexibility and coiled geometry of multiply ether functionalised phosphonium cations lead to an effective shielding of the positive charge.
We identified an unprecedented coupling between the flexibility of the anion and the viscosity of the ionic liquid. The rheology data showed a synergistic influence of ether and phosphonium design elements within the cations if they were paired with the flexible anions [NTfTFA]− and [NTf2]−. However, this was not the case for the ionic liquids based on the two rigid anions [CHTf2]− and [B(CN)4]−. For cations in combination with one of these rigid anions, ether side chains still led to a decrease in fluidity, but the relative decrease did not depend on whether a phosphonium centre was already present. Similarly, the presence of a phosphonium centre led to decreased fluidity compared to an ammonium centre, which did not depend on the presence of the ether side chains, when paired with rigid anions. The synergistic effect of phosphorus and ether functionalisation of the cation thus appeared to be dependent on the flexibility of the anion. Hence, to fully understand an ionic liquid, the conformational flexibility of both the cation and anion must be considered together. Despite the large absolute differences in transport quantities, [CHTf2]− and [B(CN)4]− can be grouped together based on the two viscosity ratios ηalkyl/ηether and ηN/ηP and the deviation from hole theory. These results show that both cations and anions and their coupling need to be considered in the process of optimising transport properties in novel ionic liquids. For example, a cation such as [P(2O2)31]+ may not reach its full potential in an ionic liquid when paired with a rigid anion such as [CHTf2]−.
The [CHTf2]− and [NTfTFA]− anions are structural variations of the [NTf2]− anion, with the same degree of fluorination and similar acidities for the corresponding acids.52 However, the conformational reorientation in the [CHTf2]− anion is severely restricted, whereas the barrier for interconversion between conformers is comparable for [NTf2]− and [NTfTFA]−.18 The difference in conformational flexibility was clearly visible in the high viscosities, low ionic conductivities and slow diffusion in all of the ionic liquids that incorporated [CHTf2]− (compared to [NTf2]− and [NTfTFA]−). The [CHTf2]− anion behaves like a mixture of two rigid conformers. This finding also supports the ‘slithering’ mechanism as a dominant pathway for translational relaxation.22 In addition, the liquid phase structuring probed by small angle X-ray scattering did not change between ionic liquids based on the [CHTf2]− or [NTf2]− anions. Thus, the [CHTf2]− anion is an excellent ‘rigid’ model system to be used in experimental studies as a contrast for the ‘flexible’ [NTf2]− anion. Such comparative studies promise insight into how cations and anions interact, and how conformational relaxation is coupled to translational relaxation.
Conflicts of interest
There are no conflicts to declare.Acknowledgements
This work is funded by the Imperial President's PhD Scholarship. Computational resources provided by the Imperial College Research Computing Service are gratefully acknowledged. DOI: http://10.14469/hpc/2232.Notes and references
- D. R. MacFarlane, M. Forsyth, P. C. Howlett, M. Kar, S. Passerini, J. M. Pringle, H. Ohno, M. Watanabe, F. Yan, W. Zheng, S. Zhang and J. Zhang, Nat. Rev. Mater., 2016, 1, 15005 CrossRef CAS.
- M. Watanabe, M. L. Thomas, S. Zhang, K. Ueno, T. Yasuda and K. Dokko, Chem. Rev., 2017, 117, 7190–7239 CrossRef CAS.
- T. Welton, Biophys. Rev., 2018, 10, 691–706 CrossRef CAS.
- E. I. Rogers, B. Šljukić, C. Hardacre and R. G. Compton, J. Chem. Eng. Data, 2009, 54, 2049–2053 CrossRef CAS.
- C. Lian, H. Liu, C. Li and J. Wu, AIChE J., 2019, 65, 804–810 CrossRef CAS.
- J. Kalhoff, G. G. Eshetu, D. Bresser and S. Passerini, ChemSusChem, 2015, 8, 2154–2175 CrossRef CAS.
- G. Yu, D. Zhao, L. Wen, S. Yang and X. Chen, AIChE J., 2012, 58, 2885–2899 CrossRef CAS.
- N. V. Ignat’ev, A. Kucheryna, G. Bissky and H. Willner, ACS Symposium Series, 2007, vol. 975, pp. 320–334 Search PubMed.
- P. Barthen, W. Frank and N. Ignatiev, Ionics, 2015, 21, 149–159 CrossRef CAS.
- I. Krossing, J. M. Slattery, C. Daguenet, P. J. Dyson, A. Oleinikova and H. Weingärtner, J. Am. Chem. Soc., 2006, 128, 13427–13434 CrossRef CAS.
- J. M. Slattery, C. Daguenet, P. J. Dyson, T. J. S. Schubert and I. Krossing, Angew. Chem., Int. Ed., 2007, 46, 5384–5388 CrossRef CAS.
- H. Weingärtner, Angew. Chem., Int. Ed., 2008, 47, 654–670 CrossRef.
- J. G. McDaniel and A. Yethiraj, J. Phys. Chem. B, 2019, 123, 3499–3512 CrossRef CAS.
- R. Hayes, G. G. Warr and R. Atkin, Chem. Rev., 2015, 115, 6357–6426 CrossRef CAS.
- S. Koßmann, J. Thar, B. Kirchner, P. A. Hunt and T. Welton, J. Chem. Phys., 2006, 124, 174506 CrossRef.
- N. V. Plechkova and K. R. Seddon, Chem. Soc. Rev., 2008, 37, 123–150 RSC.
- K. Dong, X. Liu, H. Dong, X. Zhang and S. Zhang, Chem. Rev., 2017, 117, 6636–6695 CrossRef CAS.
- F. Philippi, D. Pugh, D. Rauber, T. Welton and P. A. Hunt, Chem. Sci., 2020, 11, 6405–6422 RSC.
- S. Tsuzuki, ChemPhysChem, 2012, 13, 1664–1670 CrossRef CAS.
- E. W. Castner, J. F. Wishart and H. Shirota, Acc. Chem. Res., 2007, 40, 1217–1227 CrossRef CAS.
- S. N. Chavan and D. Mandal, RSC Adv., 2015, 5, 64821–64831 RSC.
- S. N. Suarez, A. Rúa, D. Cuffari, K. Pilar, J. L. Hatcher, S. Ramati and J. F. Wishart, J. Phys. Chem. B, 2015, 119, 14756–14765 CrossRef CAS.
- S. Tsuzuki, H. Matsumoto, W. Shinoda and M. Mikami, Phys. Chem. Chem. Phys., 2011, 13, 5987 RSC.
- F. Philippi, D. Rauber, J. Zapp, C. Präsang, D. Scheschkewitz and R. Hempelmann, ChemPhysChem, 2019, 20, 443–455 CrossRef CAS.
- M. J. Frisch, G. W. Trucks, H. B. Schlegel, G. E. Scuseria, M. A. Robb, J. R. Cheeseman, G. Scalmani, V. Barone, B. Mennucci, G. A. Petersson, H. Nakatsuji, M. Caricato, X. Li, H. P. Hratchian, A. F. Izmaylov, J. Bloino, G. Zheng, J. L. Sonnenberg, M. Hada, M. Ehara, K. Toyota, R. Fukuda, J. Hasegawa, M. Ishida, T. Nakajima, Y. Honda, O. Kitao, H. Nakai, T. Vreven, J. J. A. Montgomery, J. E. Peralta, F. Ogliaro, M. Bearpark, J. J. Heyd, E. Brothers, K. N. Kudin, V. N. Staroverov, R. Kobayashi, J. Normand, K. Raghavachari, A. Rendell, J. C. Burant, S. S. Iyengar, J. Tomasi, M. Cossi, N. Rega, J. M. Millam, M. Klene, J. E. Knox, J. B. Cross, V. Bakken, C. Adamo, J. Jaramillo, R. Gomperts, R. E. Stratmann, O. Yazyev, A. J. Austin, R. Cammi, C. Pomelli, J. W. Ochterski, R. L. Martin, K. Morokuma, V. G. Zakrzewski, G. A. Voth, P. Salvador, J. J. Dannenberg, S. Dapprich, A. D. Daniels, Ö. Farkas, J. B. Foresman, J. V. Ortiz, J. Cioslowski and D. J. Fox, Gaussian 09, Revision D.01, Gaussian, Inc., Wallingford CT, 2009 Search PubMed.
- S. Grimme, S. Ehrlich and L. Goerigk, J. Comput. Chem., 2011, 32, 1456–1465 CrossRef CAS.
- S. S. Iyengar, H. B. Schlegel, J. M. Millam, G. A. Voth, G. E. Scuseria and M. J. Frisch, J. Chem. Phys., 2001, 115, 10291 CrossRef CAS.
- H. B. Schlegel, S. S. Iyengar, X. Li, J. M. Millam, G. A. Voth, G. E. Scuseria and M. J. Frisch, J. Chem. Phys., 2002, 117, 8694–8704 CrossRef CAS.
- H. B. Schlegel, J. M. Millam, S. S. Iyengar, G. A. Voth, A. D. Daniels, G. E. Scuseria and M. J. Frisch, J. Chem. Phys., 2001, 114, 9758–9763 CrossRef CAS.
- T. Lu and F. Chen, J. Comput. Chem., 2012, 33, 580–592 CrossRef CAS.
- T. Lu and F. Chen, J. Mol. Graphics Modell., 2012, 38, 314–323 CrossRef CAS.
- L. K. Scarbath-Evers, P. A. Hunt, B. Kirchner, D. R. MacFarlane and S. Zahn, Phys. Chem. Chem. Phys., 2015, 17, 20205–20216 RSC.
- P. J. Carvalho, S. P. M. Ventura, M. L. S. Batista, B. Schröder, F. Gonçalves, J. Esperança, F. Mutelet and J. A. P. Coutinho, J. Chem. Phys., 2014, 140, 064505 CrossRef.
- M. H. Ghatee and M. Bahrami, Chem. Phys., 2017, 490, 92–105 CrossRef CAS.
- U. A. Rana, R. Vijayaraghavan, M. Walther, J. Sun, A. A. J. Torriero, M. Forsyth and D. R. MacFarlane, Chem. Commun., 2011, 47, 11612–11614 RSC.
- M. D. Green, C. Schreiner and T. E. Long, J. Phys. Chem. A, 2011, 115, 13829–13835 CrossRef CAS.
- K. J. Fraser and D. R. MacFarlane, Aust. J. Chem., 2009, 62, 309–321 CrossRef CAS.
- M. Hilder, G. M. A. Girard, K. Whitbread, S. Zavorine, M. Moser, D. Nucciarone, M. Forsyth, D. R. MacFarlane and P. C. Howlett, Electrochim. Acta, 2016, 202, 100–109 CrossRef CAS.
- R. Kerr, N. Singh, T. S. Arthur, T. Pathirana, F. Mizuno, K. Takechi, M. Forsyth and P. C. Howlett, Sustainable Energy Fuels, 2018, 2, 2276–2283 RSC.
- A. Mondal and A. P. Sunda, Phys. Chem. Chem. Phys., 2018, 20, 19268–19275 RSC.
- S. Seki, K. Hayamizu, S. Tsuzuki, K. Fujii, Y. Umebayashi, T. Mitsugi, T. Kobayashi, Y. Ohno, Y. Kobayashi, Y. Mita, H. Miyashiro and S. Ishiguro, Phys. Chem. Chem. Phys., 2009, 11, 3509–3514 RSC.
- K. Tsunashima and M. Sugiya, Electrochem. Commun., 2007, 9, 2353–2358 CrossRef CAS.
- S. Tang, G. A. Baker and H. Zhao, Chem. Soc. Rev., 2012, 41, 4030 RSC.
- T. Nokami, T. Yamashita, T. Komura, N. Handa, M. Shimizu, K. Yamaguchi, Y. Domi, H. Usui, H. Sakaguchi and T. Itoh, Faraday Discuss., 2018, 206, 523–534 RSC.
- A. R. Neale, S. Murphy, P. Goodrich, C. Hardacre and J. Jacquemin, ChemPhysChem, 2017, 18, 2040–2057 CrossRef CAS.
- K. Tsunashima, A. Kawabata, M. Matsumiya, S. Kodama, R. Enomoto, M. Sugiya and Y. Kunugi, Electrochem. Commun., 2011, 13, 178–181 CrossRef CAS.
- N. Terasawa, S. Tsuzuki, T. Umecky, Y. Saito and H. Matsumoto, Chem. Commun., 2010, 46, 1730 RSC.
- K. R. Harris, T. Makino and M. Kanakubo, Phys. Chem. Chem. Phys., 2014, 16, 9161–9170 RSC.
- Z. J. Chen, T. Xue and J.-M. Lee, RSC Adv., 2012, 2, 10564 RSC.
- Z. Chen, Y. Huo, J. Cao, L. Xu and S. Zhang, Ind. Eng. Chem. Res., 2016, 55, 11589–11596 CrossRef CAS.
- H. Matsumoto, H. Kageyama and Y. Miyazaki, Chem. Commun., 2002, 1726–1727 RSC.
- P. Burk, I. A. Koppel, I. Koppel, L. M. Yagupolskii and R. W. Taft, J. Comput. Chem., 1996, 17, 30–41 CrossRef CAS.
- I. A. Koppel, R. W. Taft, F. Anvia, S.-Z. Zhu, L.-Q. Hu, K.-S. Sung, D. D. DesMarteau, L. M. Yagupolskii and Y. L. Yagupolskii, J. Am. Chem. Soc., 1994, 116, 3047–3057 CrossRef CAS.
- M. Goldstein, J. Chem. Phys., 1969, 51, 3728–3739 CrossRef CAS.
- A. Heuer, J. Phys.: Condens. Matter, 2008, 20, 373101 CrossRef.
- Z. Raza, B. Alling and I. A. Abrikosov, J. Phys.: Condens. Matter, 2015, 27, 293201 CrossRef.
- Z. Meng, A. Dölle and W. Robert Carper, THEOCHEM, 2002, 585, 119–128 CrossRef CAS.
- P. A. Hunt, I. R. Gould and B. Kirchner, Aust. J. Chem., 2007, 60, 9 CrossRef CAS.
- P. A. Hunt, B. Kirchner and T. Welton, Chem. – Eur. J., 2006, 12, 6762–6775 CrossRef CAS.
- P. K. Gupta and W. Kob, J. Non-Cryst. Solids X, 2019, 3, 100031 Search PubMed.
- E. I. Izgorodina, Phys. Chem. Chem. Phys., 2011, 13, 4189 RSC.
- K. R. Harris and M. Kanakubo, J. Chem. Eng. Data, 2016, 61, 2399–2411 CrossRef CAS.
- K. Paduszyński, Ind. Eng. Chem. Res., 2019, 58, 17049–17066 CrossRef.
- K. Paduszyński and U. Domańska, J. Chem. Inf. Model., 2014, 54, 1311–1324 CrossRef.
- E. Gómez, N. Calvar and Á. Domínguez, Ionic Liquids - Current State of the Art, InTech, 2015 Search PubMed.
- T. A. Lima, V. H. Paschoal, L. F. O. Faria, M. C. C. Ribeiro, F. F. Ferreira, F. N. Costa and C. Giles, J. Chem. Phys., 2016, 144, 224505 CrossRef.
- H. K. Kashyap, C. S. Santos, R. P. Daly, J. J. Hettige, N. S. Murthy, H. Shirota, E. W. Castner and C. J. Margulis, J. Phys. Chem. B, 2013, 117, 1130–1135 CrossRef CAS.
- M. Watanabe, K. Dokko, K. Ueno and M. L. Thomas, Bull. Chem. Soc. Jpn., 2018, 91, 1660–1682 CrossRef CAS.
- H. Tokuda, K. Hayamizu, K. Ishii, M. A. B. H. Susan and M. Watanabe, J. Phys. Chem. B, 2004, 108, 16593–16600 CrossRef CAS.
- A. P. Abbott, ChemPhysChem, 2005, 6, 2502–2505 CrossRef CAS.
- A. P. Abbott, ChemPhysChem, 2004, 5, 1242–1246 CrossRef CAS.
- C. Schreiner, S. Zugmann, R. Hartl and H. J. Gores, J. Chem. Eng. Data, 2010, 55, 1784–1788 CrossRef CAS.
- Y.-F. Hu, Z.-C. Liu, C.-M. Xu and X.-M. Zhang, Chem. Soc. Rev., 2011, 40, 3802 RSC.
- W. Beichel, P. Eiden and I. Krossing, ChemPhysChem, 2013, 14, 3221–3226 CrossRef CAS.
- U. P. R. M. Preiss, J. M. Slattery and I. Krossing, Ind. Eng. Chem. Res., 2009, 48, 2290–2296 CrossRef CAS.
- F. Philippi, A. Quinten, D. Rauber, M. Springborg and R. Hempelmann, J. Phys. Chem. A, 2019, 123, 4188–4200 CrossRef CAS.
- K. Yoshii, T. Uto, N. Tachikawa and Y. Katayama, Phys. Chem. Chem. Phys., 2020, 22, 19480–19491 RSC.
- K. Shimizu, M. F. Costa Gomes, A. A. H. Pádua, L. P. N. Rebelo and J. N. Canongia Lopes, THEOCHEM, 2010, 946, 70–76 CrossRef CAS.
- J. N. a. Canongia Lopes and A. a. H. Pádua, J. Phys. Chem. B, 2006, 110, 3330–3335 CrossRef CAS.
- J. C. Araque, J. J. Hettige and C. J. Margulis, J. Phys. Chem. B, 2015, 119, 12727–12740 CrossRef CAS.
- C. S. Santos, H. V. R. Annapureddy, N. S. Murthy, H. K. Kashyap, E. W. Castner and C. J. Margulis, J. Chem. Phys., 2011, 134, 064501 CrossRef.
- H. V. R. Annapureddy, H. K. Kashyap, P. M. De Biase and C. J. Margulis, J. Phys. Chem. B, 2010, 114, 16838–16846 CrossRef CAS.
- G. D. Smith, O. Borodin, L. Li, H. Kim, Q. Liu, J. E. Bara, D. L. Gin and R. Nobel, Phys. Chem. Chem. Phys., 2008, 10, 6301 RSC.
- L. J. A. Siqueira and M. C. C. Ribeiro, J. Phys. Chem. B, 2009, 113, 1074–1079 CrossRef CAS.
- K. B. Dhungana, L. F. O. Faria, B. Wu, M. Liang, M. C. C. Ribeiro, C. J. Margulis and E. W. Castner, J. Chem. Phys., 2016, 145, 024503 CrossRef.
- A. Martinelli, M. Maréchal, Å. Östlund and J. Cambedouzou, Phys. Chem. Chem. Phys., 2013, 15, 5510 RSC.
- J. J. Hettige, H. K. Kashyap, H. V. R. Annapureddy and C. J. Margulis, J. Phys. Chem. Lett., 2013, 4, 105–110 CrossRef CAS.
- K. Fujii, T. Fujimori, T. Takamuku, R. Kanzaki, Y. Umebayashi and S. Ishiguro, J. Phys. Chem. B, 2006, 110, 8179–8183 CrossRef CAS.
- J. N. Canongia Lopes, K. Shimizu, A. A. H. Pádua, Y. Umebayashi, S. Fukuda, K. Fujii and S. Ishiguro, J. Phys. Chem. B, 2008, 112, 1465–1472 CrossRef CAS.
- J. Qi, Y. Hu, Y. Zhao and J. Li, Chin. J. Chem. Eng., 2015, 23, 1565–1571 CrossRef CAS.
- O. Borodin, W. Gorecki, G. D. Smith and M. Armand, J. Phys. Chem. B, 2010, 114, 6786–6798 CrossRef CAS.
- R. K. Blundell and P. Licence, Chem. Commun., 2014, 50, 12080–12083 RSC.
Footnotes |
| † Dedicated to the memory of Harald Natter – colleague, mentor, teacher and friend. |
| ‡ Electronic supplementary information (ESI) available: Details on the syntheses and characterisation of ionic liquids and precursors; experimental data from thermogravimetric analysis, densitometry, rheology, ionic conductivity measurements, NMR diffusometry and small angle X-ray scattering; hole theory analysis and Walden plot for the data; fit parameters for experimental data; ion volumes and electrostatic surface potential from ab initio calculations, relative reaction rates. (.pdf) Gaussian input files for 2D scans, volume calculations, and the ADMP simulations. (.gjf/POSIX text file), input for Multiwfn to obtain ion volumes, (.inp/POSIX text file) and results from the 2D potential energy surface scans. (.dat/POSIX text file). See DOI: 10.1039/d0cp03751f |
| This journal is © the Owner Societies 2020 |

