 Open Access Article
Towards standard electrolytes for sodium-ion batteries: physical properties, ion solvation and ion-pairing in alkyl carbonate solvents†
Damien
Monti
 *abc,
Erlendur
Jónsson
 ad,
Andrea
Boschin
a,
M. Rosa
Palacín
 bc,
Alexandre
Ponrouch
 bc and
Patrik
Johansson
 ac
ac
aDepartment of Physics, Chalmers University of Technology, SE-412 96 Göteborg, Sweden
bInstitut de Ciència de Materials de Barcelona (ICMAB-CSIC) Campus UAB, E-08193 Bellaterra, Catalonia, Spain. E-mail: d.monti@csic.es
cAlistore-ERI European Research Institute, CNRS FR 3104, Hub de l’Energie, Rue Baudelocque, 80039 Amiens Cedex, France
dDepartment of Chemistry, University of Cambridge, Lensfield Road, Cambridge CB2 1EW, UK
First published on 6th October 2020
Abstract
The currently emerging sodium-ion battery technology is in need of an optimized standard organic solvent electrolyte based on solid and directly comparable data. With this aim we have made a systematic study of “simple” electrolyte systems consisting of two sodium salts (NaTFSI and NaPF6) dissolved in three different alkyl carbonate solvents (EC, PC, DMC) within a wide range of salt concentrations and investigated: (i) their more macroscopic physico-chemical properties such as ionic conductivity, viscosity, thermal stability, and (ii) the molecular level properties such as ion-pairing and solvation. From this all electrolytes were found to have useful thermal operational windows and electrochemical stability windows, allowing for large scale energy storage technologies focused on load levelling or (to a less extent) electric vehicles, and ionic conductivities on par with analogous lithium-ion battery electrolytes, giving promise to also be power performant. Furthermore, at the molecular level the NaPF6-based electrolytes are more dissociated than the NaTFSI-based ones because of the higher ionic association strength of TFSI compared to PF6− while two different conformers of DMC participate in the Na+ first solvation shells – a Na+ affected conformational equilibrium and induced polarity of DMC. The non-negligible presence of DMC in the Na+ first solvation shells increases as a function of salt concentration. Overall, these results should both have a general impact on the design of more performant Na-conducting electrolytes and provide useful insight on the very details of the importance of DMC conformers in any cation solvation studies.
1 Introduction
The interest in rechargeable batteries, originating in prospects of better electrochemical storage and handling of green energy, is today larger than ever. To date, lithium-ion batteries (LIBs) are the leading electrochemical energy storage technology; they are omnipresent in the portable electronic field1–4 and electrical vehicles (EV), implemented also for large-scale grid applications, and even awarded the 2019 Nobel Prize in Chemistry.5 There is, however, an on-going debate on the availability of lithium from the Earth's crust and the supply vulnerability owing to geopolitical development.6 Replacing lithium by sodium, both being alkali metals, is an attractive alternative particularly given its high abundance, hence its low cost.6 Thus society at large as well as the overall battery market would greatly benefit from the sodium-ion battery (SIB) technology becoming competitive and thus a complement to LIBs. However, although the SIB development has been rapid since about 2010, the commercial impact remains small, especially as compared to LIBs. This is as much due to a lack of electrode materials matching the electrochemical performance of LIBs – in terms of specific capacities and realized cell potential, but also stable and highly conductive electrolytes – reflected in the commercial skepticism towards SIBs until very recently.7–9Investigations of SIB electrode materials are plentiful in the literature,10–15 while there are much fewer electrolyte studies made, especially such that take a broader perspective.16–18 SIB electrolytes more or less follow suit of LIB electrolytes. They are composed of cyclic carbonates e.g. ethylene and propylene carbonate (EC and PC), and linear carbonates e.g. dimethyl, ethyl methyl, and diethyl carbonate (DMC, EMC and DEC) as solvents17,19 and are also combined with salts of similar nature and concentration – often 1 M NaPF6. In contrast to studies directed to LIBs, the bis(trifluoromethanesulfonyl)imide (TFSI) anion, here as NaTFSI salt, has received less attention20,21 due to its aluminium corrosion issues, as SIBs use aluminium current collectors at both the negative and positive electrodes. The TFSI anion is, however, both chemically and thermally more stable than the PF6− anion and does not lead to the formation of hazardous hydrogen fluoride (HF) to the same extent.22
While some attention has been given to the solid electrolyte interphase (SEI)23–25 formation and the electrochemical stability windows (ESWs) obtainable for SIBs,19,26,27 the basic electrolyte physico-chemical properties and their origins at the molecular level are still not well-studied. Yet, these properties profoundly affect both thermal and electrochemical stability windows, the insertion rates possible and the associated charge transfer resistance, ion transport, charge carrier speciation, etc. The nature of the charge carrying species in turn largely originates in the balance between ion–solvent and ion–ion interactions affecting most properties listed above. The charge carriers and the speciation in general, such as the extent of ion-pairing, can for example be evaluated using the Walden rule28 as used extensively for LIB electrolytes,29–32 or more directly by infrared, Raman, and nuclear magnetic resonance (NMR) spectroscopy,16,33–35 as well as by computational modelling approaches e.g. molecular dynamics (MD), Monte-Carlo (MC), and density functional theory (DFT).16,21,36–38
Here a systematic experimental and computational study of physico-chemical properties and speciation is reported for “close to standard” SIB electrolytes over a broad range of salt concentrations. As their compositions are mimicking the standard LIB electrolytes – same anions and solvents, and the same practical macro-level properties are targeted, this paves the way for ample comparisons and to elucidate similarities and differences.
2 Experimental
2.1 Materials
Electrolytes were prepared by first mixing the solvents EC (anhydrous 99.0%, Aldrich), DMC (battery grade, Merck), and PC (anhydrous 99.7%, Aldrich) to result in EC![[thin space (1/6-em)]](https://www.rsc.org/images/entities/char_2009.gif) :
:![[thin space (1/6-em)]](https://www.rsc.org/images/entities/char_2009.gif) DMC (1
DMC (1![[thin space (1/6-em)]](https://www.rsc.org/images/entities/char_2009.gif) :
:![[thin space (1/6-em)]](https://www.rsc.org/images/entities/char_2009.gif) 1) and EC
1) and EC![[thin space (1/6-em)]](https://www.rsc.org/images/entities/char_2009.gif) :
:![[thin space (1/6-em)]](https://www.rsc.org/images/entities/char_2009.gif) DMC
DMC![[thin space (1/6-em)]](https://www.rsc.org/images/entities/char_2009.gif) :
:![[thin space (1/6-em)]](https://www.rsc.org/images/entities/char_2009.gif) PC (45
PC (45![[thin space (1/6-em)]](https://www.rsc.org/images/entities/char_2009.gif) :
:![[thin space (1/6-em)]](https://www.rsc.org/images/entities/char_2009.gif) 45
45![[thin space (1/6-em)]](https://www.rsc.org/images/entities/char_2009.gif) :
:![[thin space (1/6-em)]](https://www.rsc.org/images/entities/char_2009.gif) 10) by weight (wt%). The salts NaTFSI (99%, Solvionic) and NaPF6 (99%, Strem Chemicals) were then used to create electrolytes of NaX (X = PF6 or TFSI) in EC
10) by weight (wt%). The salts NaTFSI (99%, Solvionic) and NaPF6 (99%, Strem Chemicals) were then used to create electrolytes of NaX (X = PF6 or TFSI) in EC![[thin space (1/6-em)]](https://www.rsc.org/images/entities/char_2009.gif) :
:![[thin space (1/6-em)]](https://www.rsc.org/images/entities/char_2009.gif) DMC (1
DMC (1![[thin space (1/6-em)]](https://www.rsc.org/images/entities/char_2009.gif) :
:![[thin space (1/6-em)]](https://www.rsc.org/images/entities/char_2009.gif) 1) or EC
1) or EC![[thin space (1/6-em)]](https://www.rsc.org/images/entities/char_2009.gif) :
:![[thin space (1/6-em)]](https://www.rsc.org/images/entities/char_2009.gif) DMC
DMC![[thin space (1/6-em)]](https://www.rsc.org/images/entities/char_2009.gif) :
:![[thin space (1/6-em)]](https://www.rsc.org/images/entities/char_2009.gif) PC (45
PC (45![[thin space (1/6-em)]](https://www.rsc.org/images/entities/char_2009.gif) :
:![[thin space (1/6-em)]](https://www.rsc.org/images/entities/char_2009.gif) 45
45![[thin space (1/6-em)]](https://www.rsc.org/images/entities/char_2009.gif) :
:![[thin space (1/6-em)]](https://www.rsc.org/images/entities/char_2009.gif) 10) by direct addition of the proper amount of salt NaX to the solvent mixtures and stirring for 24 h at room temperature (RT). The resulting electrolytes are presented as x M NaX in EC:DMC or EC0.45:PC0.45:DMC0.10 with x ranging from 0.3–2.0 and 0.3–1.4 for the NaPF6 and NaTFSI based electrolytes, respectively. All samples were prepared inside an argon filled glove box with <1 ppm H2O and 0–5 ppm O2 and their water contents were <30 ppm H2O by Karl-Fischer titration (899 Coulometer/Metrohm).
10) by direct addition of the proper amount of salt NaX to the solvent mixtures and stirring for 24 h at room temperature (RT). The resulting electrolytes are presented as x M NaX in EC:DMC or EC0.45:PC0.45:DMC0.10 with x ranging from 0.3–2.0 and 0.3–1.4 for the NaPF6 and NaTFSI based electrolytes, respectively. All samples were prepared inside an argon filled glove box with <1 ppm H2O and 0–5 ppm O2 and their water contents were <30 ppm H2O by Karl-Fischer titration (899 Coulometer/Metrohm).
2.2 Methods
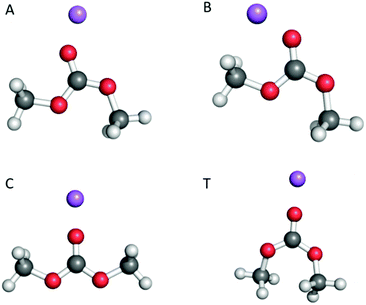 | ||
| Fig. 1 The three different conformers of DMC and the four associated coordination sites as shown by [Na(DMC)]+: A (cis–trans), B (cis–trans), C (cis–cis) and T (trans–trans). | ||
A common way to define the cation solvation energy is:
| ΔE{solv} = E{Na(EC)x(DMC)y}+ − (ENa+ + x × EEC + y × EDMC) |
| ΔEbind = E{Na(EC)x(DMC)y}+ − (ENa+ + E{(EC)x(DMC)y}) |
All structures were optimized at both the B3LYP/6-311+G* and M06-2X levels of theory and verified to be minima by calculating the second derivatives with respect to nuclear displacements. The vibrational frequencies and IR/Raman intensities/activities were obtained by analytic derivatives. Furthermore, single-point calculations M06-2X/6-311+G*//B3LYP/6-311+G* were made for the x + y = 4 systems. The ultrafine grid option was used in all cases and all calculations were made using Gaussian 09.39
3 Results and discussion
As our goal was to observe how physico-chemical properties and molecular interactions are correlated we first evaluate the thermal and phase stability and how the salt concentration and interactions affect for example dynamic crosslinking. Second, we connect ionic conductivity and viscosity to the speciation via both experimental and computational studies of the Na+ first solvation shells. Finally, we create a synergetic picture of the electrolytes stretching from the molecular level to the macroscopic performance. In all of the above ample comparisons with standard LIB electrolytes are made.3.1 Thermal stability and glass transition temperature
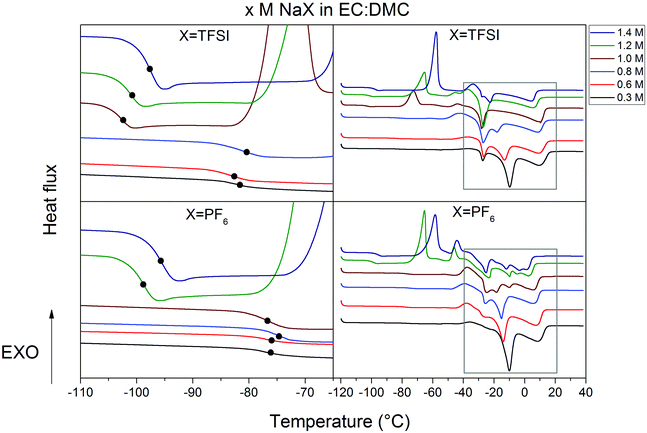
A wide window of thermal stability of the electrolyte is important as it broadens the application range of the SIBs. The nature of salts and solvents as well as the salt concentration all influence the molecular interactions and thus speciation40,41 and by this also phase transition temperatures.The most important parameter is the crystallization temperature (Tc) as it sets the absolutely lowest operating and storage limit. The DSC heating traces of x M NaPF6 and NaTFSI in EC:DMC (x = 0.3–1.4) have very similar behaviour (Fig. 2) with liquid ranges from −30 °C to at least 40 °C for the highest salt concentration. For low salt concentrations three features are observed. While the feature at 10 °C is only slightly affected by the salt concentration, the feature at −10 °C clearly moves to lower temperatures as function of salt concentration, to eventually merge with the third feature at −25 °C. All the electrolytes follow a similar trend; the formation of complexes increases as function of salt concentration and this also decreases Tc.
In order to further interpret the DSC data, heating traces of pure DMC and EC were used. The EC trace has a melting peak at 40 °C, while the DMC trace, and a fortiori the EC:DMC mixture, has features consistent with the electrolytes, albeit at slightly different temperatures (Fig. 3). Furthermore, as DMC-based species have been reported for LIB electrolytes to crystallize at −23 °C ± 10 °C,42,43 we conclude that all features between −30° and 20 °C likely are due to phase transitions coupled to DMC. In order to confirm this further, we used two different strategies: we either replaced EC:DMC by PC (Fig. S1, ESI†) or replaced a large proportion of the DMC by PC to formulate EC0.45:PC0.45:DMC0.10 (Fig. 3). As none of these systems have any features in this region, we conclude that DMC is the part of the electrolyte initiating the nucleation and subsequent crystallization.
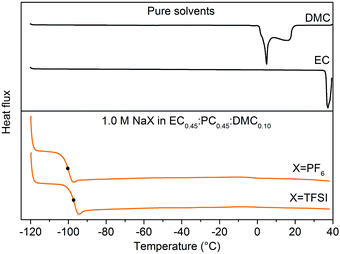 | ||
| Fig. 3 DSC heating traces for (top) pure DMC and EC solvents, and (bottom) 1.0 M NaX in EC0.45:PC0.45:DMC0.10 (X = TFSI, PF6) electrolytes between −120 °C to +40 °C. | ||
Second in importance for thermal stability is the Tg as it reflects the overall dynamics of the electrolytes, including the dynamic cross-linking caused by ions and ionic complexes,44,45 which in turn affect macroscopic properties such as ionic conductivity or viscosity. There are discontinuities in the Tgs for both Na-salt based electrolyte systems above ca. 1.0 M and these are also accompanied by exothermic peaks at −65 °C ± 10 °C (Fig. 2) from cold crystallization.46 Hence there is supercooling occurring which complicates the analysis. The corresponding PC-based electrolytes (Fig. S1, ESI†), that also are supercooled, do not show any cold crystallizations and for those the Tgs increase linearly as functions of the salt concentration – as expected due to more dynamic cross-linking, ion-pairing, and overall reduced dynamics.43
We can therefore assume that without any super-cooling effects, both our x M NaX EC:DMC electrolyte systems would follow the same trend as function of salt concentration—as we already observed for IL-based Na-conducting electrolytes.47
In conclusion, the thermal behaviour of the electrolytes is very similar regardless of the salt used and the binary electrolytes undergo phase transitions only in the presence of a large proportion of DMC in the solvent formulation. The common useful operating temperature window for these SIB electrolytes is ca. −20 °C to 40 °C, quite similar to the corresponding LIB electrolytes.48,49
3.2 Ionic conductivity, viscosity, and density
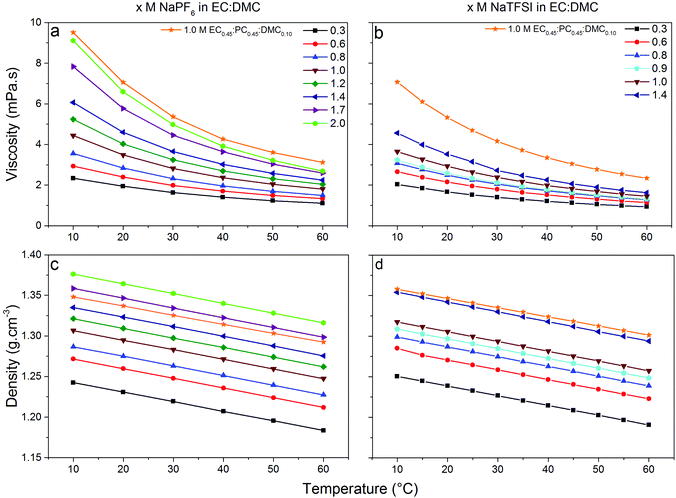
Low viscosity foremost promotes fast ion transport, but is also important for proper wetting of porous electrodes and separators—although specific surface interaction affects wetting properties to a lower extend. The viscosities of our electrolytes increase as function of salt concentration and decrease with temperature (Fig. 4) following a Vogel–Tammann–Fulcher (VTF) behaviour,50–52 in accordance with the literature.53–55 The NaPF6-based electrolytes are in general slightly more viscous, but at lower temperatures (10 °C) the difference is only 0.8 mPa s vs. the NaTFSI-based electrolytes. Thus the changed speciation affects the viscosities similarly and this is also in accordance with the analogous LiB electrolytes; LiPF6 in EC:DMC is more viscous than LiTFSI in EC:DMC56 and with a very similar difference at 10 °C (ca. 0.9 mPa s). That our SIB electrolytes have slightly higher viscosities may indicate larger complexes being formed.37 The addition of PC, as in EC0.45:PC0.45:DMC0.10, increases the viscosities and again the NaPF6-based electrolytes are both more viscous and have a larger change in viscosity.Turning to the electrolyte densities, they matter very little for battery performance by their own, except when calculating the added weight of the electrolyte to the cell. It is re-assuring, however, that there are no discontinuities in the density data and these data are also needed for a proper Walden analysis of the electrolytes’ ionicity.
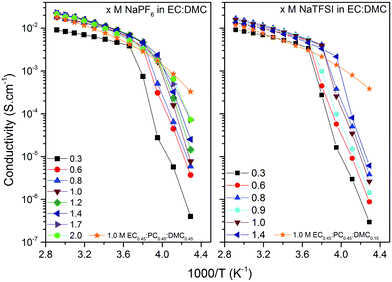
As high enough ionic conductivities are ultimately needed for adequate battery performance, conductivity data should also be used to reveal operational temperature limits (Fig. 5). The discontinuities at low temperatures are consistent with the DSC analysis. Moving to RT, the x M NaTFSI and NaPF6 in EC:DMC electrolytes reach their maximum ionic conductivities of 8.5 and 11.2 mS cm−1 for x = 1.0 M and x = 1.2 M, respectively. This is similar to the analogous LIB electrolytes; at RT 1.0 M LiTFSI and LiPF6 in EC:DMC provide 9.4 and 10.7 mS cm−1, respectively.53,57,58 In fact, these similarities extend over the whole temperature range. Furthermore, even the lowest salt concentration, 0.3 M, is acceptable for SIB application in terms of ionic conductivity (>5 mS cm−1 for both salts). Finally, as expected due to the increased viscosity by the addition of PC, the EC0.45:PC0.45:DMC0.10 electrolytes have lower ionic conductivities; 5.0 and 7.6 mS cm−1 at RT, respectively. At the same time, however, the operating temperature window is extended as there are no discontinuities in the conductivity data – in accordance with the DSC data.
3.3 Molecular level interactions and speciation
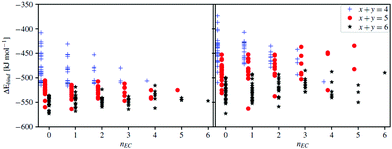
Starting with the very basic DFT computed cation–DMC solvent interactions, the conformational equilibrium of DMC is clearly affected by the presence of Na+ (Table 1) as the addition of either Na+ or Li+ changes the favoured conformer from the cis–cis (C) to the cis–trans conformer (A/B). For the molecule by itself, the enthalpic barrier of going from C to A/B is calculated to be ca. 12 kJ mol−1, which is close to the experimental values (Table 1). The enthalpic difference is 17 kJ mol−1 in favour of A/B. The highly polar EC molecule should easily solvate the alkali cations, unlike the less polar DMC. However, the conformational equilibrium of DMC changes upon addition of Na+/Li+, and so will the induced polarity, shown as a change in dipole moment. Thus, any in-depth analysis of the cation solvation must take into account DMC and its conformers. Furthermore, as the conformers have slightly different vibrational spectra, they will also affect the Raman analysis – and for proper comparisons we construct solvation complexes to reveal likely components of the Na+ first solvation shell.Moving to the complexes and starting with a Na+ coordination number (CN) = 4, i.e. the x + y = 4 systems (Fig. 6), the B3LYP calculations (Table S1, ESI†) predict a number of complexes to be more stable than the [Na(EC)4]+; [Na(EC)1(DMC)3TTT]+, [Na(DMC)4BBTT]+, and [Na(EC)1(DMC)3ATT]+, while the M06-2X calculations predict only one complex to be more stable: [Na(DMC)4BTTT]+. Hence, the two different functionals show similar results, i.e. a mixture of EC and DMC in the Na+ first solvation shell, but the details differ. For B3LYP there are many complexes having energies close to that with the lowest ΔEbind and taking into account the assumptions and limitations of the DFT calculations – the energetics are not sufficient to reveal the preferred solvation. The extra set of single point calculations, M06-2X calculations on the B3LYP geometries (Table S1, ESI†), however, show that the main differences are due to geometry differences.
While a CN = 4 is rather well-founded for Li+ in carbonate-based solvents, there is more of an uncertainty for Na+ with respect to the preferred CN.59,60 Moving to higher CNs, but only with EC as solvent in the models, both [Na(EC)5]+ and [Na(EC)6]+ are significantly more stable than [Na(EC)1(DMC)3TTT]+.
The collection of data for [Na(EC)x(DMC)y]+ (x + y = 4, 5 and 6) strongly implies that a CN of 5 or 6 is preferred (Fig. 6). Furthermore, there is a large probability of DMC in the complexes, as many containing DMC have lower energies than [Na(EC)6]+; the most stable is [Na(DMC)6BTTTTT]+, with a few similar complexes with different DMC conformers within a narrow energy range, and other that differ in composition close in energy: [Na(EC)(DMC)5BBTTT]+ and [Na(EC)3(DMC)3TTT]+. This preference of Na+, in contrast to Li+, for a larger solvation shell has also been shown previously both for electrolytes64 and other solvents.65 While the energetics of complex formation is laden with several assumptions, these results form a base for the elucidation of different speciation and charge carriers present in the different electrolytes, and especially together with the experimental Raman data.
From a structural view-point, we observed large differences between the resulting complex geometries for the two functionals used. In general, the B3LYP functional resulted in more symmetric structures closer to what would be expected from “chemical intuition”. To promote a further understanding of these differences and vs. the Li+ analogues a few, selected amongst the more stable, complexes were analysed in more detail.
For example [Na(EC)4]+ has a close to tetrahedral symmetry (Td) with a larger Na–O–C angle, in contrast to the S4 symmetry computationally predicted and verified by Raman spectroscopy for [Li(EC)4]+.66 This is likely due to the smaller charge/radius ratio resulting in longer Na–O distances and a reduced role of the carbonyl lone-pairs in controlling the coordination geometry. For [Na(EC)3(DMC)1T]+ the coordination of DMC clearly differs between the B3LYP and M06-2X results, the latter deviates from any resemblance of a Td symmetry due to bidentate coordination of the Na+ by the DMC, and thus the CN is rather 5 than 4. Also for CN = 5 and CN = 6 there are many small but notable differences between the results from the two different functionals, which also agrees well with that the variance of the first solvation shell should be larger for the SIB electrolytes than for the analogous LIB electrolytes.38 More data on all the stable complexes obtained are found in the ESI.†
Before moving from the computational predictions of the complexes present to the experimental verification – it is useful to use a few model systems and see what they imply for the spectroscopy data analysis. The ring breathing mode of EC, a common mode to analyse for cation coordination,66–68 a blue-shift from 889 to 917 cm−1 is computed for Na+ interaction. Likewise, for DMC (C) from 930 to 953 cm−1 and for DMC(A/B) from 867 to 880 cm−1. However, as the pure DMC conformational equilibrium is also affected by Na-salt addition, there is also a superposition of spectral changes arising due to different pure DMC conformers being present – not only the effect of Na+ complexation – and this will affect the data in a non-trivial manner – as also seen by 13C NMR spectroscopy.33 Notably, the cation-induced shifts are considerably reduced for the larger complexes; for Na(EC)6+ to 909 cm−1 (thus the induced shift is reduced by 8 cm−1) and for [Na(DMC)4CCCC]+, [Na(DMC)6AAAAAA]+, and [Na(DMC)6BBBBBB]+ 944 cm−1, 876 cm−1 and 877 cm−1, respectively.
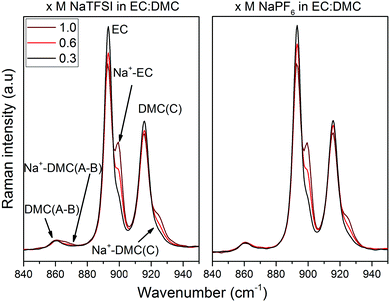
Armed with the DFT computed relative energies and vibrational spectra data, we now turn to the Raman spectroscopy and the region 880–940 cm−1, which, as outlined above, contains bands originating from both EC and DMC (Fig. 7). The EC ring-breathing mode at 893 cm−1![[thin space (1/6-em)]](https://www.rsc.org/images/entities/char_2009.gif) 67, 68 shifts to 900 cm−1 upon Na+ coordination, 4 cm−1 less than upon Li+ coordination.66,69 The C
67, 68 shifts to 900 cm−1 upon Na+ coordination, 4 cm−1 less than upon Li+ coordination.66,69 The C![[double bond, length as m-dash]](https://www.rsc.org/images/entities/char_e001.gif) O stretching mode of DMC(C) shifts slightly more, from 915 to 925 cm−1,63,70 which again is markedly less than for Li+ (933 cm−1).68,70,71 In addition, and as expected from the DFT calculations, DMC(A/B) contributes to the Na+ coordination, with bands at 860 cm−1 and 868 cm−1. That all shifts are smaller for Na+vs. Li+ is a direct effect of a smaller charge/radius ratio and concomitant weaker cation–solvent interactions. While not handled by the present DFT calculations, we also analyse the cation–anion interactions using the region 730–765 cm−1 containing the ν(SNS)/expansion and contraction band of the TFSI anion, “free” at 740 cm−1 and Na+ coordinated at 744 cm−1 (Fig. 8a).47,72–75 For the NaPF6-based electrolytes we use infrared rather than Raman spectroscopy in the region of 800–900 cm−1 with the free PF6− asymmetrical stretching vibrational mode located at 844 cm−1,76 while upon formation of contact ion-pairs (CIP) and aggregates (AGG) the PF6− symmetry is modified and altered into three bands: 833 cm−1, 878 cm−1,33,77,78 but also 853 cm−1. This has already been observed in LiPF6 in EC:DMC by Aroca et al.77 and Seo et al.33 as these bands are the result of altered anion symmetry.
O stretching mode of DMC(C) shifts slightly more, from 915 to 925 cm−1,63,70 which again is markedly less than for Li+ (933 cm−1).68,70,71 In addition, and as expected from the DFT calculations, DMC(A/B) contributes to the Na+ coordination, with bands at 860 cm−1 and 868 cm−1. That all shifts are smaller for Na+vs. Li+ is a direct effect of a smaller charge/radius ratio and concomitant weaker cation–solvent interactions. While not handled by the present DFT calculations, we also analyse the cation–anion interactions using the region 730–765 cm−1 containing the ν(SNS)/expansion and contraction band of the TFSI anion, “free” at 740 cm−1 and Na+ coordinated at 744 cm−1 (Fig. 8a).47,72–75 For the NaPF6-based electrolytes we use infrared rather than Raman spectroscopy in the region of 800–900 cm−1 with the free PF6− asymmetrical stretching vibrational mode located at 844 cm−1,76 while upon formation of contact ion-pairs (CIP) and aggregates (AGG) the PF6− symmetry is modified and altered into three bands: 833 cm−1, 878 cm−1,33,77,78 but also 853 cm−1. This has already been observed in LiPF6 in EC:DMC by Aroca et al.77 and Seo et al.33 as these bands are the result of altered anion symmetry.
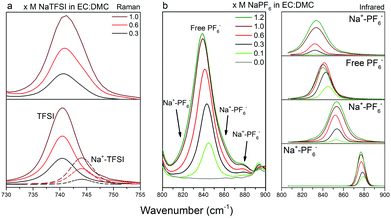 | ||
| Fig. 8 Raman spectra of (a) x M NaTFSI in EC:DMC (x = 0.3, 0.6, 1.0) in the spectral range 730–755 cm−1, and IR spectra of (b, left) x M NaPF6 in EC:DMC (x = 0, 0.1, 0.3, 0.6, 1.0, 1.2) in the spectral range 800–900 cm−1 with (b, right) the respective fitting peaks used for the deconvolution. The full range of IR spectra are shown in Fig. S2 (ESI†). | ||
From all of the above combined, we extract positions of the (fitted) Raman bands and their associated Raman activities, and from this we calculate the relative contributions of EC, DMC(C), DMC(A/B), and TFSI to the total solvation number (SN) of Na+ (Table 2). For the PF6-based electrolytes the anion contribution could only be studied qualitatively as the vibrational modes associated to Na+–PF6− CIPs are not unambiguously defined. Each SN is determined as:
| ν EC | ν DMC(C) | ν DMC(A/B) | ν TFSI | ν Na-EC | ν Na-DMC(C) | ν Na-DMC(A/B) | ν Na-TFSI |
|---|---|---|---|---|---|---|---|
| a For NaPF6, SN(EC+DMC) and SN(total) are identical as SN(anion) for PF6− could not be extracted. | |||||||
| Fitted band position [cm−1] | |||||||
| 893.0 | 915.6 | 860.4 | 740.4 | 899.7 | 924.8 | 867.9 | 744.1 |
| Raman activities (R.A.) [amu Å−4] | |||||||
| 13.7 | 13.3 | 13 | 20 | 18.3 | 12.6 | 12 | 19.2 |
EC![[thin space (1/6-em)]](https://www.rsc.org/images/entities/char_2009.gif) : :![[thin space (1/6-em)]](https://www.rsc.org/images/entities/char_2009.gif) DMC (1 DMC (1![[thin space (1/6-em)]](https://www.rsc.org/images/entities/char_2009.gif) : :![[thin space (1/6-em)]](https://www.rsc.org/images/entities/char_2009.gif) 1) 1) |
SN(EC) | SN(DMC(C)) | SN(DMC(A–B)) | SN(DMC(total)) | SN(Anion) | SN(EC+DMC) | SN(total) |
|---|---|---|---|---|---|---|---|
| NaTFSI | |||||||
| 1.0 M | 1.39 | 1.23 | 0.16 | 1.39 | 0.21 | 2.79 | 2.99 |
| 0.6 M | 1.73 | 1.27 | 0.18 | 1.45 | 0.19 | 3.18 | 3.37 |
| 0.3 M | 1.77 | 1.34 | 0.21 | 1.55 | 0.11 | 3.32 | 3.43 |
| NaPF6 | |||||||
| 1.0 M | 1.49 | 1.23 | 0.17 | 1.40 | — | 2.89 | 2.89a |
| 0.6 M | 1.84 | 1.34 | 0.17 | 1.51 | — | 3.35 | 3.35a |
| 0.3 M | 1.89 | 1.41 | 0.19 | 1.60 | — | 3.49 | 3.49a |
Furthermore, SNEC decreases approximately twice as fast as SNDMC(total). Overall, EC predominantly solvates Na+ at 0.3 M, while DMC contribute equally much at 1.0 M. SN(total) decreases, as both SNEC and SNDMC decrease, which may be attributed to the increasing formation of CIPs and AGGs as they reduce the amount of solvation sites.79,80 In contrast, solvent separated ion-pairs (SSIPs) have a similar amount of solvent in their first solvation shells as complexed cations.81 Therefore, this may indicate that EC is preferentially removed from the Na+ first solvation shell upon CIP/AGG formation – which agrees with the many stable complexes with several DMC included from the DFT calculations.
Moving to the ion-pair formation, CIPs/AGGs are present in both electrolytes and increase as a function of salt concentration (Fig. 8). However, the band at 740 cm−1 associated with TFSI increases constantly while the band annotated as “free” PF6− seems to decrease after reaching a maximum between 0.6 M and 1 M. For the latter system, this might indicate that the ratio between SSIPs and CIPs/AGGs changes in favour of CIP/AGG, while the total amount of ion-pairs constantly increases – a behaviour seen for LiPF6 in EC:DMC within the concentration range.33 This is further supported by changes in the spectra also for the “free” PF6− anion as the salt concentration increases.
For the same salt concentration the NaPF6-based electrolytes in average have 5% larger SN(total) and this may, again, indicates that the NaTFSI-based electrolytes have proportionally more CIPs/AGGs, hence being less dissociated. This is, for example, in agreement with the detailed studies of LiPF6 and LiTFSI in acetonitrile,36 and thus agrees qualitatively across Na+ to Li+. In the following part, we use the Walden rule to discuss and compare qualitatively the ionicity – degree of dissociation – in both electrolytes.
3.4 Ionicity by Walden analysis
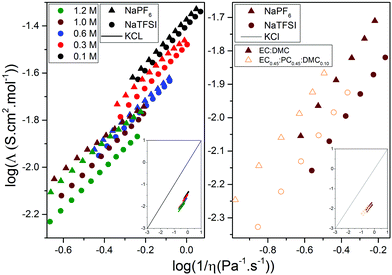
While we above reported on molecular interactions and speciation in detail, the dissociation of the ions can also be studied using more macroscopic data by Walden analysis of the ionicity. The empirical Walden rule28 states that the product of the limiting molar ionic conductivity and pure solvent's viscosity η is a constant (≈0.6) as expressed in (1). In (2) the logarithmic form of the equation used in Walden plots is provided.29,30
 | (1) |
 | (2) |
 | (3) |
From a Walden analysis perspective changing from EC:DMC to EC0.45:PC0.45:DMC0.10 based electrolytes, primarily changes the dielectric constant (ε) and can thereby affect the ionicity. Indeed, while maintaining the order of the Na-salts the degree of dissociation seems to increase. In contrast, increasing the temperature is supposed to decrease ε,84,85 and while the temperature is not explicitly found in a Walden plot both the molar conductivities and the viscosities are temperature dependent, why a temperature increase can basically be followed diagonally from left to right. With α extracted for each of the electrolytes, α is ca. 0.7–0.9, which indicates that increasing the temperature also decreases the degree of dissociation.
4 Conclusions
In conclusion, NaTFSI and NaPF6 in EC:DMC and EC0.45:PC0.45:DMC0.10 exhibit similarities to conventional LIB electrolytes both in terms of physico-chemical and molecular properties. In more detail, the EC:DMC based electrolytes display acceptable thermal stability windows of −30 °C to +40 °C, while the ionic conductivities can be as high as 10 mS cm−1 at room temperature for 1 M electrolytes and a fortiori viscosities low. The exchange of DMC for PC greatly inhibits the crystallization processes at the cost of a lower conductivity (6 mS cm−1 at room temperature for 1 M electrolytes) and higher viscosities. From a molecular viewpoint, every studied electrolyte presents a high level of ion dissociation, even if the NaPF6-based electrolytes remain more dissociated regardless of the solvents used. The combination of DFT calculations and Raman spectroscopy reveals the importance of several conformers of DMC in the Na+ first solvation shells. While both EC and DMC are found in the solvation shells, there is a faster depletion of EC in the shells with increasing salt concentration why a higher proportion of free EC is found. Furthermore, the use of the fractional Walden rule indicates that 1 M NaPF6 in EC:DMC is more dissociated than 1 M NaTFSI in EC:DMC and furthermore that the addition of PC improves the dissociation. Overall, these data for a wide range of salt concentrations in the most common electrolyte solvents should pave the way for further electrochemical studies, not the least owing to the results on “ultralow” concentrated SIB electrolytes.86Conflicts of interest
There are no conflicts to declare.Acknowledgements
We acknowledge funding received from the European Union's Horizon 2020 research and innovation programme under grant agreement no. 646433 (NAIADES), the ALISTORE-ERI members for many fruitful discussions, and also the funding received from the Swedish Research Council the Swedish Energy Agency (#37671-1), the Swedish Research Council for Environment, Agricultural Sciences and Spatial Planning, the Severo Ochoa Programme for Centres of Excellence in R&D (SEV-2015-0496). DM especially acknowledges the European Union for a H2020 MSCA-IF grant no. 74343. PJ is grateful for the continuous financial support from several of Chalmers Areas of Advance: Materials Science, Energy, and Transport. We also acknowledge the computational resources provided by the Swedish National Infrastructure for Computing (SNIC) at Chalmers Centre for Computational Science and Engineering (C3SE).Notes and references
- B. Scrosati and J. Garche, J. Power Sources, 2010, 195, 2419–2430 CrossRef CAS.
- J. B. Goodenough and Y. Kim, Chem. Mater., 2010, 22, 587–603 CrossRef CAS.
- B. Dunn, H. Kamath and J. M. Tarascon, Science, 2011, 334, 928–935 CrossRef CAS.
- V. Etacheri, R. Marom, R. Elazari, G. Salitra and D. Aurbach, Energy Environ. Sci., 2011, 4, 3243–3262 RSC.
- https://www.nobelprize.org/prizes/chemistry/2019/summary/, verified 2020.
- D. Larcher and J. M. Tarascon, Nat. Chem., 2015, 7, 19–29 CrossRef CAS.
- http://www.tiamat-energy.com/, verified 18-08-2020.
- https://www.altris.se/, verified 18-08-2020.
- https://www.faradion.co.uk/, verified 18-08-2020.
- G. Yan, S. Mariyappan, G. Rousse, Q. Jacquet, M. Deschamps, R. David, B. Mirvaux, J. W. Freeland and J.-M. Tarascon, Nat. Commun., 2019, 10, 585 CrossRef CAS.
- K. Kubota and S. Komaba, J. Electrochem. Soc., 2015, 162, A2538–A2550 CrossRef CAS.
- L. Li, Y. Zheng, S. Zhang, J. Yang, Z. Shao and Z. Guo, Energy Environ. Sci., 2018, 11, 2310–2340 RSC.
- H. Kim, H. Kim, Z. Ding, M. H. Lee, K. Lim, G. Yoon and K. Kang, Adv. Energy Mater., 2016, 6, 1600943 CrossRef.
- E. Irisarri, A. Ponrouch and M. R. Palacin, J. Electrochem. Soc., 2015, 162, A2476–A2482 CrossRef CAS.
- J.-Y. Hwang, S.-T. Myung and Y.-K. Sun, Chem. Soc. Rev., 2017, 46, 3529–3614 RSC.
- D. Monti, A. Ponrouch, M. R. Palacin and P. Johansson, J. Power Sources, 2016, 324, 712–721 CrossRef CAS.
- A. Ponrouch, D. Monti, A. Boschin, B. Steen, P. Johansson and M. R. Palacin, J. Mater. Chem. A, 2015, 3, 22–42 RSC.
- G. G. Eshetu, G. A. Elia, M. Armand, M. Forsyth, S. Komaba, T. Rojo and S. Passerini, Adv. Energy Mater., 2020, 2000093 CrossRef CAS.
- M. Á. Muñoz-Márquez, D. Saurel, J. L. Gómez-Cámer, M. Casas-Cabanas, E. Castillo-Martínez and T. Rojo, Adv. Energy Mater., 2017, 7, 1700463 CrossRef.
- A. Ponrouch, E. Marchante, M. Courty, J. M. Tarascon and M. R. Palacin, Energy Environ. Sci., 2012, 5, 8572–8583 RSC.
- A. Ponrouch, R. Dedryvere, D. Monti, A. E. Demet, J. M. A. Mba, L. Croguennec, C. Masquelier, P. Johansson and M. R. Palacin, Energy Environ. Sci., 2013, 6, 2361–2369 RSC.
- K. Xu, Chem. Rev., 2014, 114, 11503–11618 CrossRef CAS.
- R. Mogensen, D. Brandell and R. Younesi, ACS Energy Lett., 2016, 1, 1173–1178 CrossRef CAS.
- J. Fondard, E. Irisarri, C. Courrèges, M. R. Palacin, A. Ponrouch and R. Dedryvère, J. Electrochem. Soc., 2020, 167, 070526 CrossRef CAS.
- D. I. Iermakova, R. Dugas, M. R. Palacín and A. Ponrouch, J. Electrochem. Soc., 2015, 162, A7060–A7066 CrossRef CAS.
- P. K. Nayak, L. Yang, W. Brehm and P. Adelhelm, Angew. Chem., Int. Ed., 2018, 57, 102–120 CrossRef CAS.
- A. Bhide, J. Hofmann, A. Katharina Durr, J. Janek and P. Adelhelm, Phys. Chem. Chem. Phys., 2014, 16, 1987–1998 RSC.
- P. Walden, Z. Phys. Chem., 1906, 55, 207–249 CAS.
- D. R. MacFarlane, M. Forsyth, E. I. Izgorodina, A. P. Abbott, G. Annat and K. Fraser, Phys. Chem. Chem. Phys., 2009, 11, 4962–4967 RSC.
- C. Schreiner, S. Zugmann, R. Hartl and H. J. Gores, J. Chem. Eng. Data, 2010, 55, 1784–1788 CrossRef CAS.
- W. Xu and C. A. Angell, Science, 2003, 302, 422–425 CrossRef CAS.
- C. L. Berhaut, D. Lemordant, P. Porion, L. Timperman, G. Schmidt and M. Anouti, RSC Adv., 2019, 9, 4599–4608 RSC.
- D. M. Seo, S. Reininger, M. Kutcher, K. Redmond, W. B. Euler and B. L. Lucht, J. Phys. Chem. C, 2015, 119, 14038–14046 CrossRef CAS.
- K. Matsubara, R. Kaneuchi and N. Maekita, J. Chem. Soc., Faraday Trans., 1998, 94, 3601–3605 RSC.
- L. Yang, A. Xiao and B. L. Lucht, J. Mol. Liq., 2010, 154, 131–133 CrossRef CAS.
- O. Borodin, S.-D. Han, J. Daubert, D. Seo, S.-H. Yun and W. A. Henderson, J. Electrochem. Soc., 2015, 162, A501–A510 CrossRef CAS.
- A. V. Cresce, S. M. Russell, O. Borodin, J. A. Allen, M. A. Schroeder, M. Dai, J. Peng, M. P. Gobet, S. G. Greenbaum, R. E. Rogers and K. Xu, Phys. Chem. Chem. Phys., 2017, 19, 574–586 RSC.
- E. Flores, G. Åvall, S. Jeschke and P. Johansson, Electrochim. Acta, 2017, 233, 134–141 CrossRef CAS.
- M. J. Frisch, G. W. Trucks, H. B. Schlegel, G. E. Scuseria, M. A. Robb, J. R. Cheeseman, G. Scalmani, V. Barone, B. Mennucci, G. A. Petersson, H. Nakatsuji, M. Caricato, X. Li, H. P. Hratchian, A. F. Izmaylov, J. Bloino, G. Zheng, J. L. Sonnenberg, M. Hada, M. Ehara, K. Toyota, R. Fukuda, J. Hasegawa, M. Ishida, T. Nakajima, Y. Honda, O. Kitao, H. Nakai, T. Vreven, J. J. A. Montgomery, J. E. Peralta, F. Ogliaro, M. Bearpark, J. J. Heyd, E. Brothers, K. N. Kudin, V. N. Staroverov, R. Kobayashi, J. Normand, K. Raghavachari, A. Rendell, J. C. Burant, S. S. Iyengar, J. Tomasi, M. Cossi, N. Rega, J. M. Millam, M. Klene, J. E. Knox, J. B. Cross, V. Bakken, C. Adamo, J. Jaramillo, R. Gomperts, R. E. Stratmann, O. Yazyev, A. J. Austin, R. Cammi, C. Pomelli, J. W. Ochterski, R. L. Martin, K. Morokuma, V. G. Zakrzewski, G. A. Voth, P. Salvador, J. J. Dannenberg, S. Dapprich, A. D. Daniels, Ö. Farkas, J. B. Foresman, J. V. Ortiz, J. Cioslowski and D. J. Fox, Gaussian 09, Gaussian, Inc., Wallingford CT, 2009 Search PubMed.
- X. Bogle, R. Vazquez, S. Greenbaum, A. V. W. Cresce and K. Xu, J. Phys. Chem. Lett., 2013, 4, 1664–1668 CrossRef CAS.
- A. S. Thomas and A. H. Elcock, J. Am. Chem. Soc., 2006, 128, 7796–7806 CrossRef CAS.
- P. E. Stallworth, J. J. Fontanella, M. C. Wintersgill, C. D. Scheidler, J. J. Immel, S. G. Greenbaum and A. S. Gozdz, J. Power Sources, 1999, 81, 739–747 CrossRef.
- P. E. Stallworth, J. J. Fontanella, M. C. Wintersgill, C. D. Scheidler, J. J. Immel, S. G. Greenbaum and A. S. Gozdz, J. Power Sources, 1999, 81-82, 739–747 CrossRef CAS.
- Y. Zhang, P. Batys, J. T. O’Neal, F. Li, M. Sammalkorpi and J. L. Lutkenhaus, ACS Cent. Sci., 2018, 4, 638–644 CrossRef CAS.
- J. A. Jaber and J. B. Schlenoff, Macromolecules, 2005, 38, 1300–1306 CrossRef CAS.
- B. Wunderlich, J. Chem. Phys., 1958, 29, 1395–1404 CrossRef CAS.
- D. Monti, E. Jonsson, M. R. Palacin and P. Johansson, J. Power Sources, 2014, 245, 630–636 CrossRef CAS.
- F. Leng, C. M. Tan and M. Pecht, Sci. Rep., 2015, 5, 12967 CrossRef CAS.
- N. Yang, X. Zhang, B. Shang and G. Li, J. Power Sources, 2016, 306, 733–741 CrossRef CAS.
- H. Vogel, Phys. Z., 1921, 22, 645–646 CAS.
- G. Tammann and W. Hesse, Z. Anorg. Allg. Chem., 1926, 156, 245–257 CrossRef CAS.
- G. S. Fulcher, J. Am. Ceram. Soc., 1925, 8, 789–794 CrossRef CAS.
- M. Dahbi, F. Ghamouss, F. Tran-Van, D. Lemordant and M. Anouti, J. Power Sources, 2011, 196, 9743–9750 CrossRef CAS.
- Y. Sasaki, M. Takehara, S. Watanabe, N. Nanbu and M. Ue, J. Fluorine Chem., 2004, 125, 1205–1209 CrossRef CAS.
- S. I. Lee, U. H. Jung, Y. S. Kim, M. H. Kim, D. J. Ahn and H. S. Chun, Korean J. Chem. Eng., 2002, 19, 638–644 CrossRef CAS.
- Y. R. Dougassa, J. Jacquemin, L. El Ouatani, C. Tessier and M. Anouti, J. Phys. Chem. B, 2014, 118, 3973–3980 CrossRef CAS.
- K. Hayashi, Y. Nemoto, S. Tobishima and J. Yamaki, Electrochim. Acta, 1999, 44, 2337–2344 CrossRef CAS.
- C. W. Walker, J. D. Cox and M. Salomon, J. Electrochem. Soc., 1996, 143, L80–L82 CrossRef CAS.
- A. Bankura, V. Carnevale and M. L. Klein, J. Chem. Phys., 2013, 138, 014501 CrossRef.
- Y. Zeng, J. Hu, Y. Yuan, X. Zhang and S. Ju, Chem. Phys. Lett., 2012, 538, 60–66 CrossRef CAS.
- J.-M. Thiebaut, J.-L. Rivail and J.-L. Greffe, J. Chem. Soc., Faraday Trans. 2, 1976, 72, 2024–2034 RSC.
- J. E. Katon and M. D. Cohen, Can. J. Chem., 1974, 52, 1994–1996 CrossRef CAS.
- J. E. Katon and M. D. Cohen, Can. J. Chem., 1975, 53, 1378–1386 CrossRef CAS.
- T. A. Pham, K. E. Kweon, A. Samanta, V. Lordi and J. E. Pask, J. Phys. Chem. C, 2017, 121, 21913–21920 CrossRef CAS.
- D. Spångberg and K. Hermansson, Chem. Phys., 2004, 300, 165–176 CrossRef.
- P. Johansson, M. Edvardsson, J. Adebahr and P. Jacobsson, J. Phys. Chem. B, 2003, 107, 12622–12627 CrossRef CAS.
- B. Fortunato, P. Mirone and G. Fini, Spectrochim. Acta, Part A, 1971, 27, 1917–1927 CrossRef CAS.
- B. Klassen, R. Aroca, M. Nazri and G. A. Nazri, J. Phys. Chem. B, 1998, 102, 4795–4801 CrossRef CAS.
- S. A. Hyodo and K. Okabayashi, Electrochim. Acta, 1989, 34, 1557–1561 CrossRef CAS.
- L. Aguilera, J. Scheers and A. Matic, Phys. Chem. Chem. Phys., 2016, 18, 25458–25464 RSC.
- M. Morita, Y. Asai, N. Yoshimoto and M. Ishikawa, J. Chem. Soc., Faraday Trans., 1998, 94, 3451–3456 RSC.
- J. C. Lassegues, J. Grondin and D. Talaga, Phys. Chem. Chem. Phys., 2006, 8, 5629–5632 RSC.
- D. Brouillette, D. E. Irish, N. J. Taylor, G. Perron, M. Odziemkowski and J. E. Desnoyers, Phys. Chem. Chem. Phys., 2002, 4, 6063–6071 RSC.
- A. Bakker, S. Gejji, J. Lindgren, K. Hermansson and M. M. Probst, Polymer, 1995, 36, 4371–4378 CrossRef CAS.
- M. Herstedt, M. Smirnov, P. Johansson, M. Chami, J. Grondin, L. Servant and J. C. Lassegues, J. Raman Spectrosc., 2005, 36, 762–770 CrossRef CAS.
- X. Xuan, J. Wang and H. Wang, Electrochim. Acta, 2005, 50, 4196–4201 CrossRef CAS.
- R. Aroca, M. Nazri, G. A. Nazri, A. J. Camargo and M. Trsic, J. Solution Chem., 2000, 29, 1047–1060 CrossRef CAS.
- M. Nie, D. P. Abraham, D. M. Seo, Y. Chen, A. Bose and B. L. Lucht, J. Phys. Chem. C, 2013, 117, 25381–25389 CrossRef CAS.
- M. Morita, Y. Asai, N. Yoshimoto and M. Ishikawa, J. Chem. Soc., Faraday Trans., 1998, 94, 3451–3456 RSC.
- J. Arai, K. Nishimura, Y. Muranaka and Y. Ito, J. Power Sources, 1997, 68, 304–306 CrossRef CAS.
- Y. Marcus and G. Hefter, Chem. Rev., 2006, 106, 4585–4621 CrossRef CAS.
- I. Geoffroy, P. Willmann, K. Mesfar, B. Carre and D. Lemordant, Electrochim. Acta, 2000, 45, 2019–2027 CrossRef CAS.
- A. Webber, J. Electrochem. Soc., 1991, 138, 2586–2590 CrossRef CAS.
- E. W. Greene and J. W. Williams, Phys. Rev., 1932, 42, 119–140 CrossRef CAS.
- G. P. Srivastava and Y. P. Varshni, Physica, 1956, 22, 584–586 CrossRef CAS.
- Y. Li, Y. Yang, Y. Lu, Q. Zhou, X. Qi, Q. Meng, X. Rong, L. Chen and Y.-S. Hu, ACS Energy Lett., 2020, 5, 1156–1158 CrossRef CAS.
Footnote |
| † Electronic supplementary information (ESI) available. See DOI: 10.1039/d0cp03639k |
| This journal is © the Owner Societies 2020 |

