 Open Access Article
Creative Commons Attribution 3.0 Unported Licence
Acetylation of graphite oxide†
Andreas
Nordenström
 a,
Artem
Iakunkov
a,
Igor
Baburin
b and
Alexandr
Talyzin
a,
Artem
Iakunkov
a,
Igor
Baburin
b and
Alexandr
Talyzin
 *a
*a
aUmeå University, Department of Physics, Linnaeus väg 24, Umeå, SE 901 87, Sweden. E-mail: alexandr.talyzin@umu.se
bTechnische Universitat Dresden, Physical Chemistry, Bergstrasse 66b, Dresden, Sachsen, DE 01062, Germany
First published on 26th August 2020
Abstract
Unlike many methods of chemical modification of Graphite Oxide (GO) reported during 1930–1960 and re-studied in much detail over the last decade, acetylation somehow escaped attention and remained almost completely unexplored. Acetylated Graphite Oxide (AcGO) was prepared using a reaction with acetic anhydride. Successful acetylation is evidenced by an increase in the average interlayer distance from d(001) = 7.8 Å in the precursor GO to 10 Å in AcGO. The amount of oxygen in AcGO significantly decreased compared to the precursor GO (C/O = 2.2), reflecting partial reduction of GO in the process of acetylation and resulting in a scarcely functionalized material with C/O = 6.2. A theoretical model of the complete acetylation of GO results in a non-porous close packed molecular structure with an interlayer distance of ∼10 Å, in good agreement with experiment. Remarkably, AcGO shows significant swelling despite the oxidation degree being comparable to that of reduced GO, which does not swell in polar solvents. Moreover, AcGO shows swelling in acetonitrile similar to that of the precursor GO but not in water, thus providing an example of selectivity in the sorption of common polar solvents. The low oxidation degree combined with selective swelling properties makes AcGO a promising material for membrane applications.
I. Introduction
Graphite oxides (GOs) are materials produced by strong oxidation of graphite. The layered structure of graphite is preserved after oxidation but the interlayer distance increases from ∼3.4 Å to ∼7 Å due to the addition of oxygen functional groups on the basal planes.1 The exact structure of GO is not exactly defined since the material is non-stoichiometric and shows strong variation of properties depending on the degree of oxidation and particular oxidation methods.2,3 For example, GOs prepared using the most common Hummers (with many variations and “improvements”) and Brodie oxidation methods are known to be remarkably different with respect to thermal stability, swelling and sorption properties.4–6 In fact, GO needs to be considered as a family of materials. Nevertheless, there are some general properties of GO, regardless of the synthesis details and variations in composition. It is generally assumed that the most abundant functional groups on the basal planes are epoxy and hydroxyl groups whereas carbonyls, phenols and carboxyls terminate the flake edges (including the edges of holes) or occupy defect points.3,7,8Unlike the precursor graphite, GO is a hydrophilic material and exhibits swelling in polar solvents.1,9,10 Swelling can be considered as intercalation of solvent molecules between the basal planes of GO, which results in significant expansion of the interlayer distance. Swelling of GO can be characterized by diffraction methods using the increase of averaged interlayer distance provided by d(001),11,12 or by the quantitative evaluation of solvent sorption using neutron scattering,13 DSC or direct weight change measurements.14–16 Swelling is of great importance for most applications of GO, e.g., the preparation of GO dispersions, solution-based chemical functionalization and the preparation of multilayered graphene oxide membranes.10,17–20
As already demonstrated much earlier in the 1960s, targeting specific oxygen functional groups (e.g., hydroxyl or carboxyls) provides many possibilities for the chemical functionalization of GO. Hundreds of different chemically modified GO materials have been reported in the last decade.8,21 Numerous studies in this field in recent years have aimed to prepare porous GO materials with a “pillared” structure. Pillared GO (PGO) materials with a high surface area could be useful for many possible applications, e.g., gas storage,22 supercapacitors23 and membranes.24 The synthesis of PGO involves swelling (expansion) of the GO structure in a solution of pillared molecules, insertion and attachment of the molecules to GO sheets (usually at elevated conditions) and removing the solvent by evaporation while the pillaring molecules keep the GO lattice in an expanded state thus creating a porous structure. Many kinds of molecular pillars have been tested, for example 1,4-benzene diboronic acid (DBA),22,25 various amines,26–28 and many other linker molecules.24,28–30 Some intercalated GO materials (e.g., siloxane derivative) were also converted into pillared carbons using chemical reduction or thermal deoxygenation.31–36
The experimental specific surface area (SSA) reported for some PGO materials (∼400–1000 m2 g−1) is significantly higher compared to pristine graphite oxide. However, in other cases, it is not clear if the expanded lattice is indeed porous (demonstrating a high surface area) or the expansion is related to intercalation rather than to pillaring. Here, we define true pillared GO as a material with the lattice expanded by pillaring molecules and an interconnected pore network accessible for the penetration of gases or liquid solvents.30 The interconnected pore network is most easily detectable by the analysis of nitrogen sorption isotherms, which need to demonstrate a sizable value of SSA.22,37
Acetylation of GO using reaction with acetic anhydride was reported much earlier in the 1950s.38,39 Remarkably, acetylation has been reported to result in the expansion of GO interlayer distance by ∼4 Å up to 10.9 Å.39 This is similar to the interlayer distance of several PGO materials reported in modern times, e.g., “graphene oxide framework” materials based on pillaring with DBA molecules.22 Assuming that the acetyl groups are covalently bound to the basal planes of the GO perpendicular to the orientation of the planes, one could suggest that acetylated GO (AcGO) could be a true pillared GO material.38 However, the short report of AcGO synthesis published about 50 years ago did not provide any estimation of the material's surface area, chemical composition or spectroscopic characterization.39 Unlike many chemical modification methods of GO reported during the 1930–60s and re-studied in much detail over the last decade, acetylation somehow escaped attention and remains almost completely unexplored. The only modern study of GO acetylation was mostly focused on the chemical modification of AcGO, involved different synthesis methods and also did not report any data on the surface area of AcGO.40 Acetylation of GO specifically targets –OH groups, which is expected to result in the modification of swelling properties. Indeed, the old study from 1966 reports less pronounced swelling of AcGO as compared to the precursor GO, which makes AcGO interesting for membrane applications.39 Multilayered GO membranes recently attracted great attention due to suggestions to use them in many applications including, e.g., water desalination.41 Many chemically modified GO membrane materials were tested for desalination.42 In this respect, it is interesting to note that the first commercially important desalination membranes were based on acetylated cellulose.43,44 Both cellulose and GO can be acetylated using similar methods related to reaction with –OH groups. Therefore, there is strong motivation to perform study of GO acetylation using a variety of modern methods not available back in the 1950–60s and to verify if AcGO has a porous pillared structure. Here, we provide a systematic study of acetylated GO with characterization of surface area and swelling properties. A detailed analysis of the material's structure and composition was performed XPS, XRD, TGA and FTIR spectroscopy.
II. Experimental
2.1 Materials
The acetylated GO was synthesized according to the originally reported method,45 with some modifications as described by Van Doorn et al.38 Typically, 1000 mg of Hummers GO (commercial Abalonyx, Oslo, Norway) was mixed with 25 ml of dry acetic anhydride and 60 ml of dry pyridine in an autoclave, sealed under nitrogen flow and heated at 60 °C for 1 week. The mixture was filtered with diethyl ether followed by several cycles of washing with warm methanol and centrifugation (10 min at 4400 rpm) and dried to produce powder samples. Because GO swells in pyridine, the synthesis procedure did not involve dispersion of GO but started from GO in powder form. A reference experiment was performed without adding acetic anhydride using only pure pyridine to exclude the possibility of pyridine-functionalization of GO (Fig. S9, ESI†). Commercially reduced Graphene Oxide (Abalonyx, Oslo) was used as a reference in some analyses. The precursor GO showed peaks of carbon, oxygen and small impurities of sulphur and nitrogen. C/O = 2.2 was found using XPS and excluding oxygen from sulphate groups. No sulphur was detected in the acetylated material (AcGO). About 3.3% nitrogen was detected in AcGO, which was assigned to pyridine impurities. A C/O ration of 7.8 was calculated for AcGO by comparing the total atomic percentage of carbon and oxygen. Assuming that all nitrogen originates from trapped pyridine, there is some excess carbon not related to functionalized graphene sheets. Excluding the carbon from pyridine impurities, the C/O was corrected to 6.3.2.2. Characterization techniques
The as-synthesized acetylated GO was characterized using X-ray photoelectron spectroscopy (XPS), thermogravimetric analysis (TGA), BET analysis, X-ray diffraction (XRD), and Fourier-transform infrared (FTIR) spectroscopy. The nitrogen sorption isotherms were measured using a Quantachrome Nova 1200e Surface area & Pore size analyzer at liquid nitrogen temperature. The relative pressure interval P/P0 for the BET plot was selected using a procedure optimized for microporous materials.46 A slit-pore QSDFT equilibrium model was applied to evaluate pore volume and pore size distribution. A Panalytical X'pert X-ray diffractometer with Cu-Kα radiation (λ = 1.5418 Å) was used to record the diffraction patterns. XPS spectra were recorded using a Kratos Axis Ultra electron spectrometer equipped with a delay line detector. A monochromatic Al-Kα source operated at 150 W, a hybrid lens system with a magnetic lens, providing an analysis area of 0.3 × 0.7 mm, and a charge neutralizer were used for the measurements. The binding energy scale was adjusted with respect to the C1s line of aliphatic carbon, set at 285.0 eV. All spectra were processed with the Kratos software. TGA was done by using a Mettler Toledo TGA/DSC1 STARe system. Experiments were performed from room temperature up to 800 °C at a heating rate of 5 °C min−1 under nitrogen flow (50 mL min−1).III. Results and discussion
The reaction of HGO with acetic anhydride was reported in earlier studies to result in the formation of acetylated GO.39 The reaction occurs due to the presence of hydroxyl groups on the planes of graphene oxide and can be described as GO–OH +CH3–COO–CH3![[double bond, length as m-dash]](https://www.rsc.org/images/entities/char_e001.gif) GO–OOC–CH3. Swelling of GO in pyridine leads to an increase in the interlayer distance sufficient for the penetration of acetic anhydride between graphene oxide sheets. Following original synthesis procedures,38 the synthesis was performed using a powdered material without a dispersion step. This procedure allows maintaining a better crystallinity of the material, which is important for XRD characterization. It also allows to avoid possible modification of the material's properties due to dispersion and re-stacking of individual graphene oxide sheets, which was reported in some cases to result in multilayered graphene oxide materials with distinctly different properties.10 The orientation of acetyl groups perpendicular to GO planes is expected to result in an increased interlayer distance. The averaged interlayer distance can be evaluated using the position of the d(001) reflection in the XRD patterns (Fig. 1). As expected, d(001) increased from ∼7.8 Å (recorded at ∼15% humidity) in the precursor HGO to 10.0 Å in AcGO, as a result of acetylation. This is in good agreement with the earlier report by F. A. Delacruz and H. Castro (10.9 Å)39 and a more recent study by M. Rosaria Acocella et al.40 (8.9 Å), confirming the successful synthesis of AcGO. In addition to the d(001) peak, AcGO exhibits a broad peak of unclear origin at ∼3.7 Å, in agreement with other reports.40 This peak could originate from disordered graphitic carbon, indicating partial deoxygenation of the material.
GO–OOC–CH3. Swelling of GO in pyridine leads to an increase in the interlayer distance sufficient for the penetration of acetic anhydride between graphene oxide sheets. Following original synthesis procedures,38 the synthesis was performed using a powdered material without a dispersion step. This procedure allows maintaining a better crystallinity of the material, which is important for XRD characterization. It also allows to avoid possible modification of the material's properties due to dispersion and re-stacking of individual graphene oxide sheets, which was reported in some cases to result in multilayered graphene oxide materials with distinctly different properties.10 The orientation of acetyl groups perpendicular to GO planes is expected to result in an increased interlayer distance. The averaged interlayer distance can be evaluated using the position of the d(001) reflection in the XRD patterns (Fig. 1). As expected, d(001) increased from ∼7.8 Å (recorded at ∼15% humidity) in the precursor HGO to 10.0 Å in AcGO, as a result of acetylation. This is in good agreement with the earlier report by F. A. Delacruz and H. Castro (10.9 Å)39 and a more recent study by M. Rosaria Acocella et al.40 (8.9 Å), confirming the successful synthesis of AcGO. In addition to the d(001) peak, AcGO exhibits a broad peak of unclear origin at ∼3.7 Å, in agreement with other reports.40 This peak could originate from disordered graphitic carbon, indicating partial deoxygenation of the material.
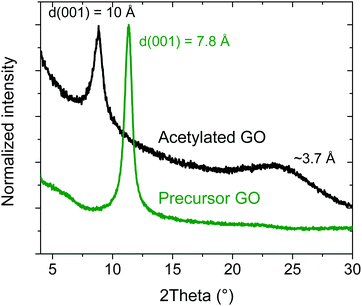 | ||
| Fig. 1 XRD patterns of the acetylated GO and precursor GO in the angle region around the d(001) reflection. | ||
To be sure that the GO was in fact acetylated, and not simply functionalized by pyridine, a reference experiment was performed under the same conditions with GO heated in pure pyridine (no acetic anhydride). Pyridine functionalized GO reported in some studies47 as not observed after the treatment used in our experiments, no degradation of GO was observed due to the prolonged heat treatment. The sample of GO treated in pyridine at 60 °C for one week showed d(001) = 7.8 Å, which is slightly lower compared to the precursor GO (Fig. S9, ESI†). A very small change in d(001) shows that simple heating of GO in pyridine did not result in the significant reduction of GO due to heat treatment and did not result in a reaction with the solvent. Therefore, the increase of d(001) value after reaction with acetic anhydride can confidently be assigned to acetylation.
The interlayer distance of AcGO in the pristine and swollen state was the only characterization presented in the early study by F. A. Delacruz and H. Castro.39 On the other hand, the only modern study of GO acetylation was mostly focused on a rather different procedure and using a non-standard GO precursor.40 C/O = 1.4 reported in this study for the precursor GO is much lower compared to the standard range of C/O = 2.2–2.67 and indicates strong over-oxidation and a high defect state of the studied material.40
The chemical composition of AcGO prepared in our experiments was evaluated using XPS (Fig. 2). The addition of acetyl groups to GO is expected to result in an almost unchanged oxygen content (one oxygen and two carbons added). However, the relative amount of oxygen determined for the acetylated material appeared to be smaller (C/O = 7.8) compared to the precursor HGO (C/O = 2.2). We found that AcGO contained 3.3 at% nitrogen. Judging by the peak positions of the N 1s spectra (Fig. S5, ESI†), the nitrogen most likely originates from pyridine and/or pyrrolic functional groups.48,49 Assuming all nitrogen to be in the form of pyridine and excluding carbon from these molecules, C/O = 6.3 was calculated for AcGO.
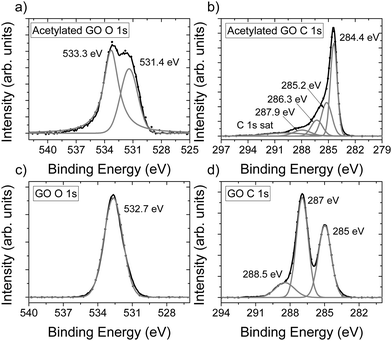 | ||
| Fig. 2 XPS spectra of precursor GO and acetylated GO (AcGO). (a) O 1s spectra for AcGO, (b) C 1s spectra for AcGO, (c) O 1s spectra for GO and (d) C 1s spectra for GO. | ||
Since the amount of oxygen decreased for AcGO, the reaction with acetic anhydride results not only in acetylation but also in the partial deoxygenation of GO. The O 1s part of the XPS spectra recorded for GO and AcGO also shows a strong difference, providing evidence for chemical modification (Fig. 2a and c). Two oxygen peaks are observed for AcGO, with the peak at 531.5 eV originating from C![[double bond, length as m-dash]](https://www.rsc.org/images/entities/char_e001.gif) O in acetyl groups. The second oxygen peak at 533.3 eV is likely due to the remaining C–O–C.50 The C 1s spectra of AcGO (Fig. 2b) is different compared to the C 1s spectra of the precursor GO (Fig. 2d), reflecting partial deoxygenation in the process of acetylation. The C1s XPS spectra of GO show three major components, which are typically assigned to C–C (285 eV, this peak is likely to also include unresolved C–OH), C–O–C (287 eV) and C
O in acetyl groups. The second oxygen peak at 533.3 eV is likely due to the remaining C–O–C.50 The C 1s spectra of AcGO (Fig. 2b) is different compared to the C 1s spectra of the precursor GO (Fig. 2d), reflecting partial deoxygenation in the process of acetylation. The C1s XPS spectra of GO show three major components, which are typically assigned to C–C (285 eV, this peak is likely to also include unresolved C–OH), C–O–C (287 eV) and C![[double bond, length as m-dash]](https://www.rsc.org/images/entities/char_e001.gif) O (288.5 eV).51 The XPS spectrum of AcGO shows a much sharper peak at 284.4 eV from unoxidized carbon.6 This peak also includes the unresolved component due to C–H groups. Several components in the C 1S spectra of AcGO are not well resolved and difficult for non-ambiguous interpretation. The peak at 285.2 eV in AcGO is likely to originate from carbon in acetyl groups, but could also overlap with peaks for hydroxyls and peaks at 286.3 eV from epoxy groups.52 The peak at 287.9 eV originates from C
O (288.5 eV).51 The XPS spectrum of AcGO shows a much sharper peak at 284.4 eV from unoxidized carbon.6 This peak also includes the unresolved component due to C–H groups. Several components in the C 1S spectra of AcGO are not well resolved and difficult for non-ambiguous interpretation. The peak at 285.2 eV in AcGO is likely to originate from carbon in acetyl groups, but could also overlap with peaks for hydroxyls and peaks at 286.3 eV from epoxy groups.52 The peak at 287.9 eV originates from C![[double bond, length as m-dash]](https://www.rsc.org/images/entities/char_e001.gif) O. The survey scans of precursor GO and AcGO are available in the ESI† (Fig. S8). It should be noted that XPS data need to be considered with some caution since it is a surface sensitive method. The composition of outer layers might be different compared to the bulk due to, e.g., air exposure.12
O. The survey scans of precursor GO and AcGO are available in the ESI† (Fig. S8). It should be noted that XPS data need to be considered with some caution since it is a surface sensitive method. The composition of outer layers might be different compared to the bulk due to, e.g., air exposure.12
FTIR spectroscopy is an example of a method that can provide information about the bulk of materials, with a typical penetration depth of ∼5 μm. The spectrum of acetylated GO is distinctly different compared to the spectra of precursor GO and reference rGO, see Fig. 3. However, analysis of the spectra is complicated by the unfortunate overlap of the main vibrational signatures of acetylation with other peaks of GO that are typically rather broad. For example, the peak of GO at ∼1730 cm−1, typically considered as a vibrational signature of C![[double bond, length as m-dash]](https://www.rsc.org/images/entities/char_e001.gif) O of acetyl groups, is also found in precursor GO. Peaks that can be assigned to acetyl group vibrations are also found at 1250 cm−1 (νC–O) and 1365 cm−1 (νC–H).53,54 Note that the peak at 1250 cm−1 is quite weak, and is more like a shoulder on the more intense peak centred around 1174 cm−1. Another typical feature of acetylated material is the broad flat peak in the region of 1350–1580 cm−1, which has been observed in other reports as well.53,54 The same broad region also overlaps with pyridine-like groups,55 which further complicates detailed analysis.
O of acetyl groups, is also found in precursor GO. Peaks that can be assigned to acetyl group vibrations are also found at 1250 cm−1 (νC–O) and 1365 cm−1 (νC–H).53,54 Note that the peak at 1250 cm−1 is quite weak, and is more like a shoulder on the more intense peak centred around 1174 cm−1. Another typical feature of acetylated material is the broad flat peak in the region of 1350–1580 cm−1, which has been observed in other reports as well.53,54 The same broad region also overlaps with pyridine-like groups,55 which further complicates detailed analysis.
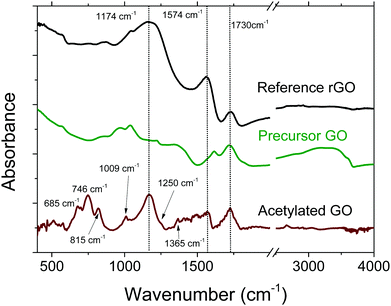 | ||
| Fig. 3 FTIR spectra of acetylated GO, precursor GO and reference rGO. The spectrum of acetylated GO was magnified by a factor of ×4 and background corrected. | ||
Raman spectroscopy is another method that gives information about the bulk properties of a material (Fig. 4). Compared to the precursor GO, there were some additional peaks for AcGO located at 1025 cm−1, 1208 cm−1 and 1525 cm−1, which are likely related to pyridine impurities trapped in the GO lattice. The change in peak position (e.g., the downshift from 1574 cm−1 to 1525 cm−1) is an indication of covalent bonding of pyridine to GO sheets. Notably, the strong peak due to pyridine C–H vibrations is not observed in the Raman spectra of AcGO, possibly due to effects of confinement.
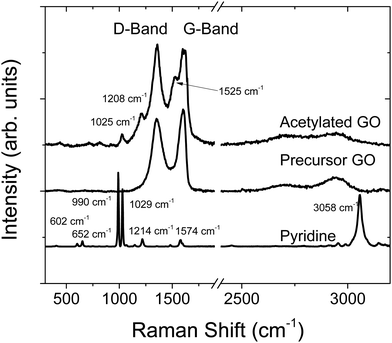 | ||
| Fig. 4 Raman spectra of acetylated GO, precursor GO and liquid pyridine. Note that the spectrum for pyridine has been scaled down for easier comparison. | ||
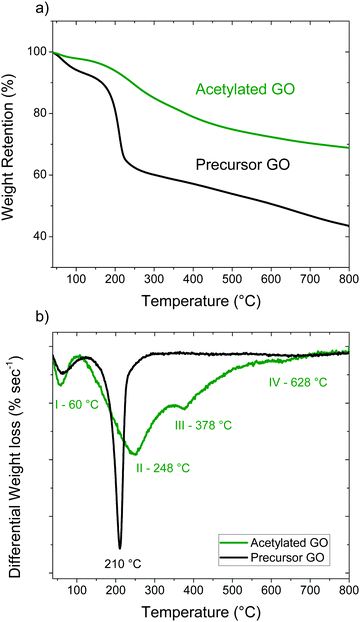
The partial reduction of GO in the process of acetylation was confirmed by the analysis of TGA data. The precursor GO has two clear weight loss steps; the first one below 120 °C (∼7%) corresponds to water evaporation, the second one around 150–230 °C (∼30%) is due to deflagration and removal of oxygen-containing functional groups (Fig. 5). Decomposition of the AcGO material starts at a somewhat lower temperature of ∼110 °C while the precursor GO is stable up to ∼130 °C. Unlike the precursor GO, the TGA trace of AcGO shows some continuous weight loss over the broad region of 300–800 °C (Fig. 5b). Three weight steps can be identified for AcGO using the derivative of the TGA trace, the first one at 60 °C, the second at 248 °C and the third around 378 °C. The low temperature step (∼2%) is assigned to the loss of water and other solvents used in the process of material preparation and washing. Excluding water evaporation from the analysis, the total weight drop due to loss of functional groups in the region of 110–600 °C is approximately 25% for AcGO and 41% for the precursor GO. The strongest weight loss is observed for AcGO at 248 °C and it corresponds to deflagration and removal of oxygen groups from the planar surface of GO sheets. The small step around 628 °C likely originates from breaking C–H bonds. The weight loss step III at 378 °C has no analogue in the precursor GO trace and its origin is less clear. It may also originate from the evaporation of covalently bound pyridine-related impurities revealed in the AcGO material by FTIR spectroscopy, Raman spectroscopy and XPS.
To verify this hypothesis, we heated AcGO to 800 °C under an air free condition using TGA and checked the sample composition with XPS. The results can be seen in Fig. S5 (ESI†) (N 1s spectra) and Fig. S6 (ESI†) (C 1s and O 1s spectra along with precursor GO). Survey scans of the samples can be seen in Fig. S8 (ESI†). Indeed, about one third of the nitrogen was removed by annealing (2.54 at% after heating compared to 3.3 at%). The reference sample of precursor GO heated under identical conditions showed the absence of nitrogen in detectable amounts.
The amount of oxygen revealed in AcGO by XPS (C/O = 6.3) is comparable or even smaller than that in thermally reduced GO (rGO), which typically shows C/O = 5–6. As a result of low oxidation, rGO materials are hydrophobic rGO does not show any swelling in polar solvents for C/O as low as 4.1 In contrast, AcGO demonstrated an interlayer distance of ∼10 Å under ambient air conditions and surprising swelling properties. Acetylated GO immersed in acetonitrile shows an increase in the interlayer spacing from 10 Å to 15 Å, thus demonstrating significant swelling (Fig. 6). The difference of 5 Å is similar to the swelling of standard GO (∼7.5 Å to 13.5 Å at ambient temperature). Note that the insertion of one layer of acetonitrile into the GO structure results in an increase of d(001) by 3.5 Å as verified using temperature dependent phase transitions in Brodie graphite oxide.56 However, in Hummers GO, intercalation of acetonitrile does not occur layer by layer due to the effects of interstratification and intrastratification.56 Therefore, the increase of d(001) by 5 Å observed for AcGO in acetonitrile corresponds to the formation of one- and two-layered solvate structures complicated by interstratification. AcGO exhibits no swelling in hexane similarly to standard GOs, which do not swell in non-polar solvents.
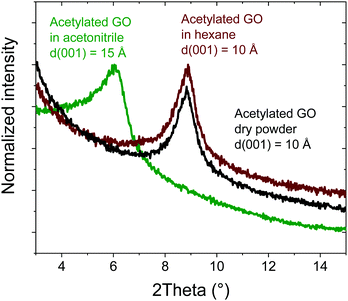 | ||
| Fig. 6 In situ XRD pattern recorded of acetylated GO in an excess of liquid acetonitrile and hexane. | ||
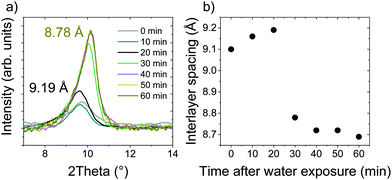
In situ XRD observations of AcGO immersed in an excess of water showed no swelling even over long periods of time, demonstrating only a relatively small shift of d(001) from 9.19 Å to 8.78 Å after one hour of immersion, see Fig. 7.
The precursor GO immersed in water shows an increase of d(001) up to ∼13 Å. d(001) = 8.78 Å found for AcGO immersed in water is higher than the value for precursor GO (7.8 Å) but smaller compared to solvent free AcGO (10 Å). It is expected that at least some acetyl groups will be converted back to hydroxyl groups when AcGO is exposed to water. The data shown in Fig. 7 demonstrate that the immersion of AcGO in water does not result in the complete degradation of AcGO or recovery of original GO. Note that the synthesis and handling of AcGO was performed here under moisture-free conditions, which was likely not the case in the only other modern study of GO acetylation, as indicated by a similar d(001) = 8.9 Å, and the absence of information about avoiding moisture in the description of experimental details.40
The unusual swelling properties of AcGO (Fig. 6 and 7) are distinctly different compared to the swelling of the standard precursor GO. GO is known to swell in most polar solvents including both water and acetonitrile. It should be noted that the exact degree of GO swelling depends on the synthesis method but standard GO always shows rather strong swelling in water. Strong interaction with water also makes GO suitable for the preparation of aqueous dispersions. It is interesting to note that swelling of acetylated GO was reported for the first time back in 1966 and d(001) values were reported for several alcohols (e.g., 11.78 Å for methanol and 13.59 Å for propanol), ketones (∼12–14 Å) and acetic acid (14.72 Å). However, no data for water swelling, stability in water or analysis of sample composition were reported in this very short communication.39 The only modern study of acetylated GO known to us did not report any swelling data.40
One of the initial motivations to study acetylated GO was the possibility that an expanded lattice in combination with a scarce population of oxygen groups on oxidized graphene planes could provide an opportunity for a porous pillared structure. According to the definition of pillared graphene or pillared GO structures adopted in our studies,30 the pillaring must be distinguished from simple intercalation using the analysis of gas-accessible specific surface area (SSA). An interconnected pore network provided by unoxidized areas of GO and supported by some pillaring molecules must be accessible for nitrogen sorption. Analysis of nitrogen sorption isotherms allows evaluation of the SSA and pore size distribution analysis. A true pillared GO structure must provide not only a relatively high SSA value but also a narrow pore size distribution with a pore size in agreement with the expected slit pores provided by the length of pillaring molecules or particles. Only very few examples of true pillared GO structures that satisfy these requirements (a high SSA and slit pore size matching the size of pillaring units) are known to date.22,25,37
The surface area of AcGO was evaluated using analysis of nitrogen sorption isotherms to verify if the structure can be considered as truely “pillared”. Taking into account the lower thermal stability of AcGO compared to the standard GO, the degassing procedure required for the exact evaluation of SSA is not trivial. Heating using too low a temperature will result in incomplete degassing while too high a temperature may result in degradation of the material. An incorrect choice of degassing temperature may result in either a decrease of surface area (e.g., due to the collapse of pores) or an increase of surface area, e.g., due to the formation of rGO. Therefore, four different outgassing procedures were used: room temperature (RT) under vacuum for 24 h; 110 °C under vacuum for 16 h; 130 °C under vacuum for 16 h and 130 °C under vacuum for 16 h. Nitrogen sorption isotherms and pore size distributions are available in the ESI† (Fig. S1 and S2). XRD patterns recorded of AcGO samples degassed using a progressively higher temperature showed that the structure was preserved after annealing at least partly. A slight decrease in the interlayer spacing, from 9.5 Å to 8.8 Å, and an increase of relative intensity of the broad feature at around 3.7 Å indicate that heating above 110 °C is not desirable for degassing.
The results of the N2 sorption isotherm analysis are summarized in Fig. 8. Outgassing at room temperature results in a neglible SSA (BET SSA ∼10 m2 g−1). Increasing the degassing temperature up to 110 °C results in a higher SSA of ∼166 m2 g−1 (cumulative DFT SSA = 77 m2 g−1). A further increase of temperature up to 150 °C does not increase the SSA. However, the surface area of ∼170 m2 g−1 cannot be confidently assigned to the formation of a pillared AcGO structure.
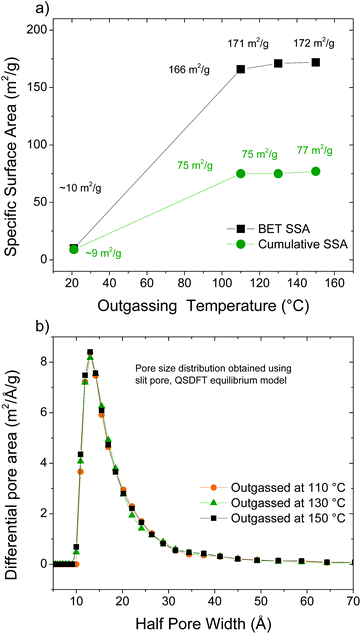 | ||
| Fig. 8 (a) BET SSA measured for the acetylated GO using nitrogen isotherms as a function of temperature and (b) pore size distribution calculated using the QSDFT model. | ||
Considering an interlayer distance of 10 Å and a van der Waals distance in graphite of ∼3.5 Å, the pillared structure had to provide a rather narrow pore size distribution with slit pores of maximum ∼6 Å. Considering the difference between interlayer distances of precursor GO (∼7.5 Å under dry conditions) and AcGO (10 Å), the minimal size of the slit pores can be estimated as 2.5 Å. However, the pore size distribution found in our experiments for AcGO degassed at elevated temperature is rather broad and originates from pores with diameter over ∼15 Å. This type of pore size distribution is more typical of finely dispersed materials with only the outer surface available for gas sorption, e.g., for various rGO materials. Note that the pore size distribution cannot be accurately determined when the surface area is small. It can be concluded that AcGO has no interconnected pore network and cannot be considered as a true pillared structure depsite significant expansion of the interlayer distance compared to GO and relatively low oxidation degree. The absence of an interconnected pore network possibly contributes to the difficulty in removing the residual pyridine, which gets trapped in the AcGO lattice, as evidenced by Raman and FTIR spectroscopy.
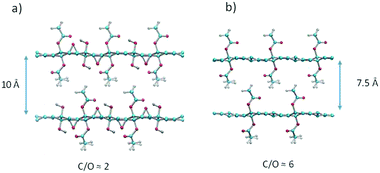
The structure of the precursor GO is non-stoichiometric with disordered oxygen containing functional groups. Therefore, all chemically modified GO materials are also strongly disordered and impossible to model precisely. The same also applies to AcGO, which shows only peaks from the 00![[small script l]](https://www.rsc.org/images/entities/i_char_e146.gif) - set, from the in-plane lattice of the graphene skeleton, but no reflections providing information about oxygen functionalities (Fig. 1). Nevertheless, structural models of an idealized structure of AcGO could help to understand the main properties of this material. The models were constructed to respect usual stereochemical constraints (on bond distances, angles, etc.) without any energy minimization involved. A structural model consistent with the observed inter-planar distance of 10 Å suggests a close packing of acetyl-groups that is reminiscent of a molecular crystal (Fig. 9a). The close packed structure of AcGO with a negligible intra-lattice surface area and interlayer distance of 10 Å is in very good agreement with the experimental results. The model assumes that the precursor GO structure has equal numbers of epoxy and hydroxyl groups and all hydroxyl groups are acetylated in AcGO. This model structure shows C/O = 2 and the absence of a porous network between GO layers.
- set, from the in-plane lattice of the graphene skeleton, but no reflections providing information about oxygen functionalities (Fig. 1). Nevertheless, structural models of an idealized structure of AcGO could help to understand the main properties of this material. The models were constructed to respect usual stereochemical constraints (on bond distances, angles, etc.) without any energy minimization involved. A structural model consistent with the observed inter-planar distance of 10 Å suggests a close packing of acetyl-groups that is reminiscent of a molecular crystal (Fig. 9a). The close packed structure of AcGO with a negligible intra-lattice surface area and interlayer distance of 10 Å is in very good agreement with the experimental results. The model assumes that the precursor GO structure has equal numbers of epoxy and hydroxyl groups and all hydroxyl groups are acetylated in AcGO. This model structure shows C/O = 2 and the absence of a porous network between GO layers.
The model with C/O = 6 (Fig. 9b) is closer to the experimental composition of AcGO found in our study by XPS. This model is constructed by removing all epoxy groups and demonstrates an interlayer distance of ∼7.5 Å, which is smaller compared to the experimental value. It should be noted here that XPS provides only information about composition of the surface layer, which can be chemically altered in both GO and AcGO when exposed to air and moisture.12 On the other hand, the partial reduction of GO in the process of acetylation is also evident from bulk analysis by TGA. The weight loss due to thermal deflagration is about two times smaller in AcGO as compared to the precursor GO. We believe that the AcGO material obtained in our experiments is not homogeneous and might include both strongly acetylated material (as evidenced by XRD with d(001) = 10 Å and some reduced GO (the broad peak around 3.7 Å)).
IV. Conclusions
In summary, reacting graphite oxide with acetic anhydride results in the expansion of interlayer distance up to 10 Å and partial reduction of graphene oxide sheets. Despite a surprisingly low oxidation degree more similar to rGO (C/O = 6), AcGO shows significant swelling in polar solvents. AcGO swelling in acetonitrile results in expansion of the lattice by ∼5 Å, which is similar to the precursor GO. However, no swelling in water was found for AcGO. The remarkable example of selectivity in sorption of common polar solvents and stability of AcGO under ambient conditions provide the possibility to use it for the preparation of multilayered membrane materials with potentially selective permeation of solvents. The thermal decomposition of AcGO results in the formation of rGO with a rather low amount of oxygen (C/O = 60). The expanded interlayer distance of AcGO in combination with a low oxidation degree does not result in the formation of a structure with an interconnected pore network, as evidenced by the negligibly small (∼10 m2 g−1) nitrogen BET surface area.Conflicts of interest
There are no conflicts to declare.Acknowledgements
The authors acknowledge funding from the European Union's Horizon 2020 research and innovation program under grant agreement No. 785219 and 881603. Support from the Swedish Research Council grant (no. 2017-04173) is also acknowledged.We acknowledge the Vibrational Spectroscopy Platform of Umeå University and A. Shchukarev for support with the XPS test.
Notes and references
- U. Hofmann, A. Frenzel and E. Csalán, Justus Liebigs Ann. Chem., 1934, 510, 1–41 CrossRef CAS.
- T. Szabo, O. Berkesi, P. Forgo, K. Josepovits, Y. Sanakis, D. Petridis and I. Dekany, Chem. Mater., 2006, 18, 2740–2749 CrossRef CAS.
- H. Y. He, J. Klinowski, M. Forster and A. Lerf, Chem. Phys. Lett., 1998, 287, 53–56 CAS.
- H. P. Boehm and W. Scholz, Z. Anorg. Allg. Chem., 1965, 335, 74–79 CrossRef CAS.
- A. V. Talyzin, G. Mercier, A. Klechikov, M. Hedenstrom, D. Johnels, D. Wei, D. Cotton, A. Opitz and E. Moons, Carbon, 2017, 115, 430–440 CrossRef CAS.
- S. J. You, S. M. Luzan, T. Szabo and A. V. Talyzin, Carbon, 2013, 52, 171–180 CrossRef CAS.
- A. Lerf, H. Y. He, M. Forster and J. Klinowski, J. Phys. Chem. B, 1998, 102, 4477–4482 CrossRef CAS.
- D. R. Dreyer, S. Park, C. W. Bielawski and R. S. Ruoff, Chem. Soc. Rev., 2010, 39, 228–240 RSC.
- H. P. Boehm, A. Clauss and U. Hofmann, J. Chim. Phys. Phys.-Chim. Biol., 1961, 58, 141–147 CrossRef CAS.
- A. V. Talyzin, T. Hausmaninger, S. J. You and T. Szabo, Nanoscale, 2014, 6, 272–281 RSC.
- A. V. Talyzin, B. Sundqvist, T. Szabo and V. Dmitriev, J. Phys. Chem. Lett., 2011, 2, 309–313 CrossRef CAS.
- A. Iakunkov, J. H. Sun, A. Rebrikova, M. Korobov, A. Klechikov, A. Vorobiev, N. Boulanger and A. V. Talyzin, J. Mater. Chem. A, 2019, 7, 11331–11337 RSC.
- A. Klechikov, J. H. Sun, A. Vorobiev and A. V. Talyzin, J. Phys. Chem. C, 2018, 122, 13106–13116 CrossRef CAS.
- M. V. Korobov, A. V. Talyzin, A. T. Rebrikova, E. A. Shilayeva, N. V. Avramenko, A. N. Gagarin and N. B. Ferapontov, Carbon, 2016, 102, 297–303 CrossRef CAS.
- Y. H. Cho, H. W. Kim, H. D. Lee, J. E. Shin, B. M. Yoo and H. B. Park, J. Membr. Sci., 2017, 544, 425–435 CrossRef CAS.
- F. Barroso-Bujans, S. Cerveny, A. Alegria and J. Colmenero, Carbon, 2010, 48, 3277–3286 CrossRef CAS.
- J. C. Derksen and J. R. Katz, Recl. Trav. Chim., 1934, 53, 652–669 CrossRef CAS.
- J. C. Ruiz and D. M. C. Macewan, Nature, 1955, 176, 1222–1223 CrossRef CAS.
- A. Lerf, A. Buchsteiner, J. Pieper, S. Schottl, I. Dekany, T. Szabo and H. P. Boehm, J. Phys. Chem. Solids, 2006, 67, 1106–1110 CAS.
- A. Klechikov, J. C. Yu, D. Thomas, T. Sharifi and A. V. Talyzin, Nanoscale, 2015, 7, 15374–15384 RSC.
- D. Chen, H. B. Feng and J. H. Li, Chem. Rev., 2012, 112, 6027–6053 CrossRef CAS.
- G. Mercier, A. Klechikov, M. Hedenstrom, D. Johnels, I. A. Baburin, G. Seifert, R. Mysyk and A. V. Talyzin, J. Phys. Chem. C, 2015, 119, 27179–27191 CrossRef CAS.
- L. Li, J. J. Qiu and S. R. Wang, Soft Mater., 2013, 11, 503–509 CrossRef CAS.
- W. S. Hung, C. H. Tsou, M. De Guzman, Q. F. An, Y. L. Liu, Y. M. Zhang, C. C. Hu, K. R. Lee and J. Y. Lai, Chem. Mater., 2014, 26, 2983–2990 CrossRef CAS.
- J. W. Burress, S. Gadipelli, J. Ford, J. M. Simmons, W. Zhou and T. Yildirim, Angew. Chem., Int. Ed., 2010, 49, 8902–8904 CAS.
- A. Gupta and S. K. Saha, AIP Conf. Proc., 2014, 1620, 10–14 CrossRef CAS.
- A. Gupta, B. K. Shaw and S. K. Saha, RSC Adv., 2014, 4, 50542–50548 RSC.
- T. Tsoufis, F. Katsaros, Z. Sideratou, G. Romanos, O. Ivashenko, P. Rudolf, B. J. Kooi, S. Papageorgiou and M. A. Karakassides, Chem. Commun., 2014, 50, 10967–10970 RSC.
- R. Kumar, V. M. Suresh, T. K. Maji and C. N. R. Rao, Chem. Commun., 2014, 50, 2015–2017 RSC.
- A. Klechikov, J. H. Sun, G. Z. Hu, M. B. Zheng, T. Wagberg and A. V. Talyzin, Microporous Mesoporous Mater., 2017, 250, 27–34 CrossRef CAS.
- Y. Matsuo, T. Komiya and Y. Sugie, Carbon, 2009, 47, 2782–2788 CrossRef CAS.
- Y. Matsuo, A. Hayashida and K. Konishi, Front Mater., 2015, 2, 21 Search PubMed.
- Y. Matsuo, Y. Sakai, T. Fukutsuka and Y. Sugie, Chem. Lett., 2007, 36, 1050–1051 CrossRef CAS.
- Y. Matsuo, T. Komiya and Y. Sugie, J. Phys. Chem. Solids, 2012, 73, 1424–1427 CrossRef CAS.
- A. B. Bourlinos, D. Gournis, D. Petridis, T. Szabo, A. Szeri and I. Dekany, Langmuir, 2003, 19, 6050–6055 CrossRef CAS.
- Y. Matsuo, T. Tabata, T. Fukunaga, T. Fukutsuka and Y. Sugie, Carbon, 2005, 43, 2875–2882 CrossRef CAS.
- G. Srinivas, J. W. Burress, J. Ford and T. Yildirim, J. Mater. Chem., 2011, 21, 11323–11329 RSC.
- J. De Boer and A. Van Doorn, Proc. K. Ned. Akad. Wet., Ser. B: Phys. Sci., 1958, 61, 160–169 CAS.
- F. A. Delacruz and H. Castro, Naturwissenschaften, 1966, 53, 155 Search PubMed.
- M. R. Acocella, L. D'Urso, M. Maggio, R. Avolio, M. E. Errico and G. Guerra, Langmuir, 2017, 33, 6819–6825 CrossRef CAS.
- Y. You, V. Sahajwalla, M. Yoshimura and R. K. Joshi, Nanoscale, 2016, 8, 117–119 RSC.
- Y. L. Qian, C. Zhou and A. S. Huang, Carbon, 2018, 136, 28–37 CrossRef CAS.
- A. Sagle and B. Freeman, The future of desalination in Texas, 2004, 2, 137.
- S. Loeb and S. Sourirajan, in Saline Water Conversion—II, ACS, 1963, vol. 38, ch. 9, pp. 117–132 Search PubMed.
- G. Ruess, Kolloid-Z., 1945, 110, 17–26 CrossRef CAS.
- P. Llewellyn, F. R. Reinoso, J. Rouqerol and N. Seaton, Characterization of porous solids VII: Proceedings of the 7th International Symposium on the Characterization of Porous Solids (Cops-VII) 2006, 160, 49–56.
- A. A. Ensafi, M. Jafari-Asl and B. Rezaei, Electrochim. Acta, 2016, 194, 95–103 CrossRef CAS.
- R. J. J. Jansen and H. Vanbekkum, Carbon, 1995, 33, 1021–1027 CrossRef CAS.
- J. R. Pels, F. Kapteijn, J. A. Moulijn, Q. Zhu and K. M. Thomas, Carbon, 1995, 33, 1641–1653 CrossRef CAS.
- D. Yang, A. Velamakanni, G. Bozoklu, S. Park, M. Stoller, R. D. Piner, S. Stankovich, I. Jung, D. A. Field, C. A. Ventrice and R. S. Ruoff, Carbon, 2009, 47, 145–152 CrossRef CAS.
- C. A. Amadei and C. D. Vecitis, J. Phys. Chem. Lett., 2016, 7, 3791–3797 CrossRef CAS.
- T. Nakajima and M. Koh, Carbon, 1997, 35, 203–208 CrossRef CAS.
- P. F. Fei, L. Liao, B. W. Cheng and J. Song, Anal. Methods, 2017, 9, 6194–6201 RSC.
- B. Stefke, E. Windeisen, M. Schwanninger and B. Hinterstoisser, Anal. Chem., 2008, 80, 1272–1279 CrossRef CAS.
- S. Biniak, G. Szymanski, J. Siedlewski and A. Swiatkowski, Carbon, 1997, 35, 1799–1810 CrossRef CAS.
- A. V. Talyzin, A. Klechikov, M. Korobov, A. T. Rebrikova, N. V. Avramenko, M. F. Gholami, N. Severin and J. P. Rabe, Nanoscale, 2015, 7, 12625–12630 RSC.
Footnote |
| † Electronic supplementary information (ESI) available. See DOI: 10.1039/d0cp03573d |
| This journal is © the Owner Societies 2020 |

