
 Open Access Article
 This Open Access Article is licensed under a
 Creative Commons Attribution 3.0 Unported Licence
A hydrogen-bonding structure in self-formed nanodroplets of water adsorbed on amorphous silica revealed via surface-selective vibrational spectroscopy†
Shu-hei
Urashima‡
 ab,
Taku
Uchida‡
a and
Hiroharu
Yui
*ab
ab,
Taku
Uchida‡
a and
Hiroharu
Yui
*ab
aDepartment of Chemistry, Faculty of Science, Tokyo University of Science, 1-3 Kagurazaka, Shinjuku, Tokyo 162–8601, Japan. E-mail: yui@rs.tus.ac.jp
bWater Frontier Science & Technology Research Center, Research Institute for Science & Technology, Tokyo University of Science, 1-3 Kagurazaka, Shinjuku, Tokyo 162–8601, Japan
First published on 23rd September 2020
Abstract
Water adsorption onto a material surface is known to change macroscopic surface properties such as wettability and friction coefficient. While the role of the adsorbed water has been discussed for a long time, the interfacial structure of the adsorbed water has not been fully recognized in many cases. In this study, the hydration structure of water adsorbed on a vapor/silica interface at room temperature was studied via heterodyne-detected vibrational sum-frequency generation spectroscopy. The vibrational spectra of the interfacial molecules obtained here were different from those estimated via conventional sum-frequency generation spectroscopy. Interestingly, our results suggest that, at low humidity, the adsorbed water on silica forms nanodroplets instead of a uniform film. Because no silanol group was found to be hydrogen-bonding free, it was concluded that water molecules gather around the silanol group to form strongly hydrogen-bonded droplets. At high humidity, while the adsorbed water partially behaves like a bulk liquid, deprotonation of the silanol was not observed, unlike the case of silica surfaces in contact with bulk liquid water.
Introduction
Macroscopic surface properties, such as wettability and friction coefficient, are known to depend on the humidity of the environment.1,2 This dependence originates from water adsorption onto the material surfaces. While the mechanism of how the adsorbed molecules change the macroscopic properties has not been fully understood yet, several groups have tried to rationalize the humidity-dependence from the viewpoint of the hydration structure of the adsorbed water. For example, attenuated total reflection infrared (ATR-IR) spectra of silica/air interface suggested that the adsorbed water undergoes a phase transition from ice-like to liquid-like depending on its thickness, and the humidity dependence of the friction force in a silica/silica system was discussed on the basis of the transition.2–4 Molecular dynamics (MD) simulation implied that adsorbed water affects the tribochemical formation of covalent bonds between two surfaces of α-SiO2 and oxidized Si.5Despite such efforts, water structure on a solid substrate is still far from well understood even at solid/air interfaces. For example, it is unclear whether the adsorbate forms a uniform “film” growing layer-by-layer upon an increase of humidity or forms “nanodroplets” without covering the whole surface. Because physical theories on wettability and friction forces generally assume that the surfaces are flat and chemically homogeneous, it must be clarified whether the surface water uniformly spreads or forms multiple domains. For the mica surface, scanning polarization force microscopy and vibrational sum-frequency generation spectroscopy revealed that the adsorbed water forms a uniform film with an ice-like hydration structure.6–8 The first coverage of a full-monolayer of water was first thought to be achieved at a relative humidity (RH) of around 20%, but it was revisited and changed to 90%.8 In contrast to the quite thin water layer on mica, Asay and Kim reported that silica possesses about two monolayers of water even at ∼20% and the water layer further grows at higher RH.4 This thickness was determined by the signal intensity of the water bending mode of ATR-IR spectra observed for the native oxide layer on a silicon prism, and hence the thickness evaluated in the study was only “average thickness” with an assumption of a uniform film model. Because silicon oxide (silica) is one of the most abundant materials and often used as a model substrate for examining surface properties such as wettability,9,10 understanding the manner in which hydration takes place on silica is especially important. However, despite such importance, the homogeneity of the adsorbed layer on the silica surface is very rarely discussed. A rare study is one performed by Isaienko and Borguet.11 They observed the vibrational spectra of adsorbed water on silica via vibrational sum-frequency generation (VSFG) spectroscopy. According to this report, some fraction of the surface silanol (SiOH) groups remains water-free even at RH higher than 90%, indicating that water does not cover the whole surface. They also observed water molecules that weakly interact with the oxygen atom of the siloxane (Si–O–Si) group. These results let them conclude that silica is microscopically hydrophobic, presumably due to the absence of charged silanol (SiO−) groups at the vapor/silica interface. However, this model has serious unnaturalness that water prefers siloxane to silanol. As clarified for the silica/acidic aqueous solution interface by Myalitsin et al., hydrogen-bonding between water and a protonated silanol (SiOH) group is stronger than that between water and the siloxane bridge.12
Furthermore, the hydrogen-bonding structure inside the film (or domains) is not consistently understood. ATR-IR spectra indicated that the adsorbed water forms an anisotropically oriented ice-like structure at RH below 50% while a randomly oriented liquid-like structure dominates at higher RH.4,13 VSFG spectra were significantly different from those obtained via ATR-IR spectroscopy and a noticeable molecular alignment was observed even at ideally saturated humidity.11,14–16 VSFG spectra also suggested that very weakly and moderately hydrogen-bonded water species exist at low RH. This is clearly inconsistent with the model proposed using ATR-IR, in which water forms an ice-like structure. While the spectral discrepancy can be attributed to the different surface selectivity of these spectroscopies as previously mentioned,11,17,18 it does not explain why the models proposed via ATR-IR and VSFG techniques remain totally different.
What is making a comprehensive discussion difficult is spectral distortion, which is generally found in conventionally obtained VSFG spectra.12,19 The spectral distortion arises because only the intensity (i.e., magnitude square of the electric field; |E|2) of the signal light is probed via conventional VSFG spectroscopy although the spectroscopic information is in fact included in the complex electric field itself (E). The complexity of the electric field physically corresponds to the phase of the light, and hence it is lost if only the intensity is probed. The spectra obtained using the conventional VSFG technique are sometimes analyzed by fitting with a theoretical equation in order to obtain the phase information,11,20 but such an analysis should be done with special care especially for the water system. This is because the fitting analysis needs to assume that the spectra consist of a couple of Lorentzian peaks while the vibrational spectra of water are often composed of multiple and/or asymmetric peaks mainly due to complicated vibrational coupling and inhomogeneous broadening.19,21,22
In the present study, we applied heterodyne-detected (HD-) VSFG spectroscopy to the vapor/silica interface at several RH levels. HD-VSFG spectroscopy simultaneously probes the intensity and phase of the signal light, and hence vibrational spectra with no spectral distortion can be experimentally obtained as the imaginary part of the second-order nonlinear susceptibility (Im![[thin space (1/6-em)]](https://www.rsc.org/images/entities/char_2009.gif) χ(2)).23 The spectra obtained here were different from those previously estimated by fitting of conventional (homodyne-detected) VSFG data,11 allowing us to propose a consistent model of the manner in which hydration occurs on the silica surface in an ambient environment.
χ(2)).23 The spectra obtained here were different from those previously estimated by fitting of conventional (homodyne-detected) VSFG data,11 allowing us to propose a consistent model of the manner in which hydration occurs on the silica surface in an ambient environment.
Experimental
Sample
The sample substrate (IR-grade fused silica purchased from Pier-optics) was immersed in sulfuric acid overnight prior to the measurements. After thoroughly rinsing with copious amounts of water, it was dried in a clean-bench (AIRTECH, L-VS-1001L; class 100) without using gas blow as suggested in the literature.11 A UV/ozone cleaner (SEN Lights Corporation, PL10-110) was then used for 30 minutes. Note that the UV/ozone cleaner was also used in the ATR-IR studies4,13 so that surface properties (such as surface silanol density) was expected to be essentially the same.HD-VSFG apparatus
The experimental setup for HD-VSFG measurement was built according to the literature.12,19,22,23 Briefly, the output of regenerative amplified femtosecond laser (Coherent, Astrella; average power: 7 W, pulse duration: 30 fs, and repetition rate: 1 kHz) was split into two. One (∼2.5 W) was passed through a bandpass filter (bandwidth: 1.5 nm (∼25 cm−1) of full width of half maximum, center wavelength: 795 nm) and a neutral density filter to make a narrow band pulse having a frequency of ω1 with an energy of ∼5 μJ per pulse. The other was used to pump an OPA/DFG system (Coherent, OPerA solo) to generate broadband IR having a frequency of ω2 (2800–3800 cm−1, ∼4–8 μJ per pulse). The two lasers were first focused onto y-cut quartz to generate sum-frequency (SF) light, which was used as a local oscillator (LO) for heterodyne detection. Then, the three beams of ω1, ω2, and LO were again focused onto the sample substrate with LO passing a thin glass plate to cause an optical delay. The SF lights generated from the sample and delayed LO were interfered and detected by a charge coupled device (Princeton Instruments, Spec10-400BR-M) combined with a polychromator (Princeton Instruments, Acton SP 2300). Incident angles of the two lasers of ω1 and ω2 are ca. 45 and 50 degrees from the surface normal, respectively. Polarizations of the detected and incident lights were set to s-, s-, and p-polarization for SF, ω1, and ω2, respectively (ssp polarization). Focus size at the sample was 200–300 μm. Intensity and phase of the SF light were normalized by those obtained with SF from z-cut quartz. The sample substrate was covered with a half-open cell to control humidity from 20 to 90% RH. The humidity was controlled by introducing dry or hot water-bubbled air into the cell. Fluctuation in the humidity was mostly less than ±5% RH. While sometimes the humidity suddenly changed by more than 5% RH, we did not observe any spectral change due to this spike-like fluctuation. Temperature inside the cell was kept at 22.0–23.0 degree. Note that it typically takes about 20 minutes to stabilize humidity inside the cell and the sample had been exposed to lab air until the humidity was stable.Results and discussion
Fig. 1 shows Imχ(2) spectra of the vapor/silica interface at 20, 50 and 90% RH. As shown in Fig. S1 in the ESI,† a potential phase error of ±15° did not alter the essential feature of the spectra. Note that the relative intensity of each spectrum sometimes changed while spectral shape was unchanged. Therefore, in Fig. 1, we show the set of spectra that were most frequently observed. While the spectral intensity has some uncertainty, the change in spectral shape upon increasing RH can be attributed to additional water adsorption onto the silica surface. The sharp negative bands appearing at around 2900 cm−1 in all spectra are assignable to the CH stretching mode, which is due to organic contamination from the lab air onto the sample surface. While we could not completely remove the contamination in our experimental setup, we believe that the contaminant is subtle and the water structure was little affected. In fact, |χ(2)|2 spectra reconstructed from the complex χ(2) spectra, which can be directly compared with those obtained via traditional VSFG spectroscopy, were similar to those obtained in previous reports that were measured using ppp-polarization11 and ssp-polarization15,16 (see Fig. S2 in the ESI†). Observation of the so-called free-OH band at high frequency (ca. 3700 cm−1) also indicates that our substrate was not heavily contaminated. This is because free-OH is known to be absent if a silica surface densely collects organic molecules.11 The cleanliness of the silica surface was further confirmed by measuring its contact angle. While the hydrophilicity of silica does not directly relate to its cleanness, it may be used as a qualitative indicator of contamination. It was about 13° even four hours after the cleaning (Fig. S3 in the ESI†), suggesting that the silica remained hydrophilic in our measurement duration.
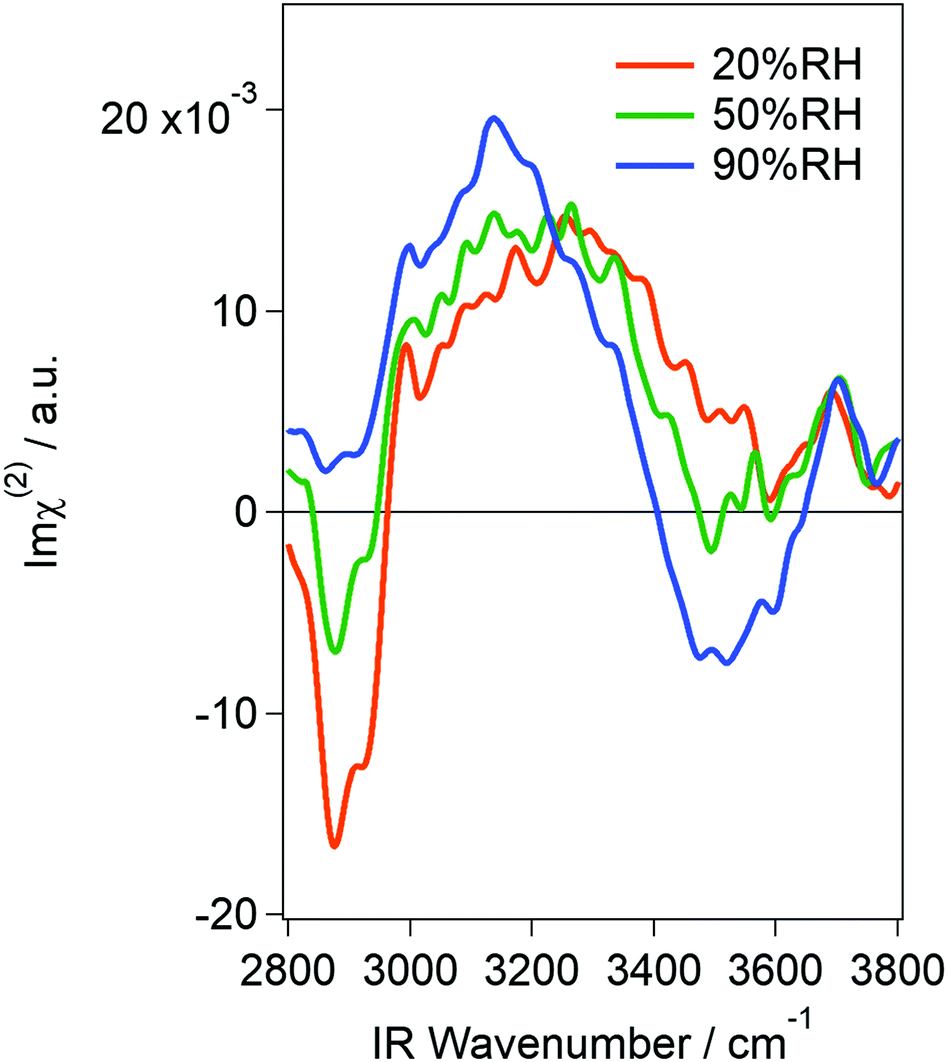 | ||
| Fig. 1 Imχ(2) spectra of a vapor/silica interface measured at 20, 50, and 90% RH. | ||
In the hydrogen-bonded OH stretching region (3000–3650 cm−1), both positive and negative peaks appear in the low and high frequency regions, respectively. Since Imχ(2) spectra consist of information of the intensity and phase of the SF light, the sign of the band is directly related to the surface molecular orientation: a positive band corresponds to water molecules that orient their hydrogen atoms toward air (hereafter called “air-oriented” for short) and a negative band corresponds to those orienting their hydrogen atoms toward the silica substrate (“silica-oriented”). The fact that both positive and negative bands grew with increasing RH indicates that at least two types of water (having different orientation) coexist at the silica surface. The “air-oriented” water should form hydrogen bonds between water O and the silica substrate. Because surface silanol (SiOH) is the only candidate hydrogen-bond donor, the “air-oriented” water is considered to be trapped at surface-silanol sites of silica. This is consistent with the fact that no free silanol groups were observed in our spectra. Note that the high frequency band in our spectra appeared at 3700 cm−1, and hence it should be assigned to the free-OH of water,22,24 and not of silanol (3750 cm−1).14,16 As for the air-oriented water, its peak frequency (around 3250 cm−1 at 20% RH) indicates that the OH moieties of these water molecules also form a hydrogen bond with something. Because this water is “air-oriented”, the only candidate for the hydrogen acceptor is other water molecules. This is consistent with a previous study that reported that the water layer at 20% RH is as thick as two monolayers on average. Structural assignment of the negative band is more difficult, but the fact that the negative band appears only at higher RH (>50% RH) implies that the “silica-oriented” water is interacting with other water molecules below it. Very roughly speaking, the “air-oriented” water is attributable to water molecules at the water/silica interface while “silica-oriented” water mainly corresponds to molecules at the air/water interface. The details will be discussed later. One might worry about a phase shift between the water/silica interface and the air/water interface, but it is negligible. This is because the water layer is not thicker than 3 nm even at 99% RH,4 so the phase shift is expected to be <2.5°. In our spectra, it is noteworthy that no negative band appears at around 3650 cm−1 at any RH, which was estimated by fitting the conventional VSFG spectra measured using ppp-polarization (note that the sign of Imχ(2) in ref. 11 is opposite compared to ours because they irradiated lasers onto the surface through the silica whereas we focused them from the air).11 Polarization in our measurement is different from the previous study (at RH of 20%), but we cannot reasonably explain the reason for the absence of the negative peak in ssp polarization if such species do exist. We observed a negative band at 90% RH, but its frequency is at around 3500 cm−1 and not 3650 cm−1. It might be possible that a weak, negative band at 3650 cm−1 overlaps with the 3500 cm−1 band at high RH, but no negative feature appeared at <50% RH. Our results, thus, do not support the existence of water molecules that very weakly interact with siloxane bridge (Si–O–Si) oxygen of the silica surface, at least at low RH and under our experimental conditions. Furthermore, we did not observe any free silanol groups as written above. This is also an important difference from the results obtained from the fitting of conventional VSFG spectra.11 Note that this discrepancy cannot be assigned to spectral distortion owing to the Fresnel factor (see Fig. S4 in the ESI†).
The spectra obtained here at 20% RH were essentially the same as those obtained using ATR-IR in the literature.3,4,13 While they are different at higher humidity, this discrepancy is attributable to the difference of surface selectivity between ATR-IR and VSFG techniques as mentioned in the early VSFG study.11 In fact, while the signal intensity of the ATR-IR spectra in the literature monotonically grew upon an increase in RH, the HD-VSFG spectra obtained here did not drastically get stronger. This is because ATR-IR probes all adsorbed molecules and hence the growth of the hydration layer is sensitively detected while HD-VSFG only probes the interfaces regardless of the presence of the thick “bulk” region in-between the two interfaces (i.e., air/water and water/silica interfaces). The agreement between HD-VSFG and ATR-IR at 20% RH indicates that the water layer is thin enough for VSFG to probe all molecules. Because the VSFG technique generally probes molecules in 2–3 layers of the interfacial region and the ATR-IR study estimated the hydration layer to be as thick as 2 monolayers at 20% RH, there is no contradiction. However, the 2 monolayer-thick film model is not able to fully interpret the origin of the positive peak. This is because the positive band slowly but clearly grew with humidity. While the relative intensity of each spectrum sometimes fluctuates as written above, this trend never changed. Because the intensity increase is not as drastic as that of ATR-IR, it is unlikely that the thickness of the adsorbate directly contributed to the signal intensity. Besides the contribution of thickness, there are two possibilities left for the mechanism of a signal increase: (1) the molecular orientation of the interfacial water changed, or (2) the area of the water/silica interface increased. The former is possible because not only the number of probed molecules but also their orientation affects the signal intensity of VSFG spectra. However, polarization-dependent ATR-IR spectra revealed that the molecular anisotropy of water on silica does not increase from 50 to 85% RH.13 The orientational change may somewhat contribute to the signal increase from 20 to 50% RH, but it cannot explain the general trend that the positive peak gradually grows with a humidity increase. Therefore, we concluded that the area of the water/silica interface increased at higher RH. In other words, the interfacial water was concluded to form nanodroplets instead of covering the whole surface of the substrate, at least at <50% RH. It is noteworthy that a multi-domain model was previously proposed,11 but the hydrogen-bonding sites of silica were totally updated. In the previous assignment, water molecules were estimated to interact with siloxane bridges with some portion of silanol groups remaining bare. In our model, water–siloxane interaction has a negligible contribution and silanol groups are the most favored interaction sites. Because siloxane bridges are weaker hydrogen-bonding sites than silanol groups, our model is more natural. From the facts that (1) the free silanol group was absent even at 20% RH, (2) water molecules are net “air-oriented”, and (3) no “silica-oriented” water that interacts with the siloxane bridge was observed, we concluded that the water droplet formed around silanol groups (Fig. 2). It is possible that some of the silanol groups were consumed by the contaminants, but this slight consumption cannot rationalize the absence of the “silica-oriented” water if water molecules indeed prefer siloxane bridges. Therefore, the model depicted in Fig. 2 is considered to be essentially unaffected by the contamination.
 | ||
| Fig. 2 Schematic model of the nanodroplet formed around silanol groups of the silica substrate. Broken lines represent hydrogen bonding. | ||
The agreement between HD-VSFG and ATR-IR spectra at 20% RH suggests that water molecules in the nanodroplet are anisotropically oriented when each droplet is thicker than 2 monolayers. This low-frequency band was traditionally assigned to “ice-like” water, but currently the term “ice-like” should be more carefully used. This is because vibrational spectra of water are generally distorted by intra/intermolecular vibrational couplings12,19,25,26 so that the low frequency does not always mean strong hydrogen-bonding. Furthermore, even if the hydrogen-bonding is indeed strong, it does not mean that water forms a tetrahedral structure. To unambiguously interpret the spectra, it is necessary to measure the spectra by using isotopically diluted water (H2O–D2O mixture). However, because the signal from diluted water is very weak, here, we interpret the H2O spectra by comparing them with those obtained for silica/liquid water,12 air/ice,27 and silica/ice28 interfaces. First of all, band widths of the H2O ice surface are about 250 cm−1 and 50 cm−1 for silica/ice and air/ice interfaces, respectively.27,28 Because the positive band obtained in the present study is as broad as 350 cm−1, it is unlikely that the water molecules form an ice-like tetrahedral structure. A broad low-frequency band similar to that of the present study was also observed at silica/acidic solution interfaces.12 For this interface, the peak frequency was still around 3200 cm−1 even for the isotopically diluted solution, suggesting that the interfacial water forms a strongly hydrogen-bonded (but not tetrahedral) structure. Because this band was assigned to water molecules that interact with hydrogen atoms of silanol groups, the origin of this band is essentially the same as that of the “air-oriented” positive band observed in the present study. Therefore, while the direct comparison of silica/liquid water and silica/adsorbed water is difficult, the positive peak obtained here is also assignable to water molecules that form a strongly hydrogen-bonded (but not tetrahedral) structure. Note that this band is “air-oriented”, i.e., the strong hydrogen-bond is formed between water molecules and not between water and silanol groups.
At higher RH, the HD-VSFG spectra exhibited a negative band at around 3500 cm−1 (Fig. 1). While the assignment of this band to a specific structure is difficult, this band is mainly assignable to bulk liquid-like water on the basis of three reasons as follows. First, the negative peak (“silica-oriented” water) only appeared at high RH, which suggests that this species is at the air/water interface as written above. Second, the previous ATR-IR studies also found liquid-like water at high RH. And third, the HD-VSFG spectrum obtained at air/bulk liquid water also exhibited a negative band at around 3400 cm−1.22,24,29 This implies that water molecules at the air/water interface of largely grown nanodroplets behave like a liquid. At this stage, some portion of water molecules at the silica/water interface may also contribute to the negative band by interaction between water hydrogen and silanol oxygen as well as water hydrogen and the siloxane bridge as suggested for the silica/aqueous interface.12
Finally, we discuss the protonation state of the surface silanol groups because surface charge is also an important property. While the deprotonation behavior of silanol groups is complicated due to them having multiple pKas,30 there is no doubt that the silica surface in contact with an aqueous solution has a negative charge at pH > 2 due to the deprotonation of the surface silanol groups (SiOH → SiO− + H+).30–32 Because the adsorbed water partially behaves like a liquid, it is possible for the hydration layer to accept the proton released from the silanol groups. However, while it is expected that the surface negative charge makes water molecules “silica-oriented” (hydrogen atoms toward the silica) owing to electrostatic interaction, our spectra indicate that water molecules are mainly air-oriented even at 90% RH. Furthermore, the spectrum measured at 90% RH is more like that obtained for the silica/acidic (pH ∼ 2) aqueous interface12 than that of the silica/basic (pH 12) solution interface19 (note that the complex phase of the spectra in these references should be inverted for comparison with ours because optical configuration around the sample was upside-down). These comparisons clearly indicate that the surface silanol groups are protonated and no negative charge was induced. This is presumably because the hydration layer is too thin (∼6 monolayers at 90% RH)4 for protons to escape into the “bulk”.
We summarize the model for water adsorption onto the silica surface. At very low RH, water in the gas phase starts to adsorb around silanol groups (Fig. 3a). When RH increases to ∼20% RH, additional water molecules gather around the “nucleus” composed of water and silanol groups to form the nanodroplets (Fig. 2 and 3b). The size of the nanodroplets grows upon an increase of RH, and liquid-like water starts to appear at vapor/water interfaces at around 50% RH (Fig. 3c). The nanodroplets may finally get together to form a hydration “film”, presumably at ∼90% RH. Once the whole surface is covered by the water film, the uniform film may accept additional water molecules without changing the surface energy, which rationalizes the previous observation that water adsorption suddenly increased at RH higher than 90% RH.4
 | ||
| Fig. 3 Proposed model of the adsorbed water structure on silica at RH from <20% (a) to ∼90% (d). | ||
Conclusions
In this study, we measured the vibrational spectra of a vapor/silica interface via HD-VSFG spectroscopy. The observed spectra were different from those estimated via conventional VSFG spectroscopy. The results suggest the existence of “nanodroplets” around silanol groups on the surface at RH lower than about 90% RH. The innermost water at the droplet/silica interface was found to form strong hydrogen-bonds with other water molecules, but the formation of an ice-like (or tetrahedral) structure was not supported. Weak hydrogen bonding between the innermost water and siloxane, which was estimated via conventional VSFG spectroscopy, was not observed at least at low RH. At RH higher than about 50%, the nanodroplets grow to have bulk liquid-like water at the vapor/droplet interface as previously proposed from ATR-IR results. Despite the existence of liquid-like water, the surface silanol groups are not deprotonated in the whole RH range studied. This study will help to further clarify how adsorbed water perturbs macroscopic surface properties.Conflicts of interest
There are no conflicts of interest to declare.Acknowledgements
This work was supported by JSPS KAKENHI, Grant Numbers JP19K05200 and JP20K15234.Notes and references
- Z. Chen, X. He, C. Xiao and S. Kim, Lubricants, 2018, 6, 74 CrossRef.
- T. Arif, G. Colas and T. Filleter, ACS Appl. Mater. Interfaces, 2018, 10, 22537–22544 CrossRef CAS.
- L. Chen, C. Xiao, B. Yu, S. H. Kim and L. Qian, Langmuir, 2017, 33, 9673–9679 CrossRef CAS.
- D. B. Asay and S. H. Kim, J. Phys. Chem. B, 2005, 109, 16760–16763 CrossRef CAS.
- J. Yeon, A. C. van Duin and S. H. Kim, Langmuir, 2016, 32, 1018–1026 CrossRef CAS.
- J. Hu, X. D. Xiao, D. F. Ogletree and M. Salmeron, Science, 1995, 268, 267–269 CrossRef CAS.
- L. Xu, A. Lio, J. Hu, D. F. Ogletree and M. Salmeron, J. Phys. Chem. B, 1998, 102, 540–548 CrossRef CAS.
- P. B. Miranda, L. Xu, Y. R. Shen and M. Salmeron, Phys. Rev. Lett., 1998, 81, 5876–5879 CrossRef CAS.
- T. Konisho and I. Ueno, Ann. N. Y. Acad. Sci., 2009, 1161, 292–303 CrossRef.
- L. Hołysz, M. Mirosław, K. Terpiłowski and A. Szcześ, Ann. UMCS, Chem., 2008, 63, 223–239 Search PubMed.
- O. Isaienko and E. Borguet, Langmuir, 2013, 29, 7885–7895 CrossRef CAS.
- A. Myalitsin, S. Urashima, S. Nihonyanagi, S. Yamaguchi and T. Tahara, J. Phys. Chem. C, 2016, 120, 9357–9363 CrossRef CAS.
- A. L. Barnette, D. B. Asay and S. H. Kim, Phys. Chem. Chem. Phys., 2008, 10, 4981–4986 RSC.
- L. Dalstein, E. Potapova and E. Tyrode, Phys. Chem. Chem. Phys., 2017, 19, 10343–10349 RSC.
- N. Sheth, D. Ngo, J. Banerjee, Y. Zhou, C. G. Pantano and S. H. Kim, J. Phys. Chem. C, 2018, 122, 17792–17801 CrossRef CAS.
- D. Liu, M. A. Gang, M. Xu and H. C. Allen, Environ. Sci. Technol., 2005, 39, 206–212 CrossRef CAS.
- J. H. Hunt, P. Guyot-Sionnest and Y. R. Shen, Chem. Phys. Lett., 1987, 133, 189–192 CrossRef CAS.
- A. Morita and T. Ishiyama, Phys. Chem. Chem. Phys., 2008, 10, 5801–5816 RSC.
- S. Urashima, A. Myalitsin, S. Nihonyanagi and T. Tahara, J. Phys. Chem. Lett., 2018, 9, 4109–4114 CrossRef CAS.
- K. C. Jena and D. K. Hore, J. Phys. Chem. C, 2009, 113, 15364–15372 CrossRef CAS.
- F. Perakis and P. Hamm, Phys. Chem. Chem. Phys., 2012, 14, 6250–6256 RSC.
- S. Nihonyanagi, R. Kusaka, K. Inoue, A. Adhikari, S. Yamaguchi and T. Tahara, J. Chem. Phys., 2015, 143, 124707 CrossRef.
- S. Nihonyanagi, S. Yamaguchi and T. Tahara, J. Chem. Phys., 2009, 130, 204704 CrossRef.
- S. Yamaguchi, J. Chem. Phys., 2015, 143, 034202 CrossRef.
- V. Buch, J. Phys. Chem. B, 2005, 109, 17771–17774 CrossRef CAS.
- H. Torii, J. Phys. Chem. A, 2006, 110, 9469–9477 CrossRef CAS.
- Y. Nojima, Y. Shioya, H. Torii and S. Yamaguchi, Chem. Commun., 2020, 56, 4563–4566 RSC.
- Q. Du, E. Freysz and Y. R. Shen, Phys. Rev. Lett., 1994, 72, 238–241 CrossRef CAS.
- X. Xu, Y. R. Shen and C. Tian, J. Chem. Phys., 2019, 150, 144701 CrossRef.
- A. M. Darlington and J. M. Gibbs-Davis, J. Phys. Chem. C, 2015, 119, 16560–16567 CrossRef CAS.
- B. Rehl, M. Rashwan, E. L. DeWalt-Kerian, T. A. Jarisz, A. M. Darlington, D. K. Hore and J. M. Gibbs, J. Phys. Chem. C, 2019, 123, 10991–11000 CrossRef CAS.
- S. H. Behrens and D. G. Grier, J. Chem. Phys., 2001, 115, 6716 CrossRef CAS.
Footnotes |
| † Electronic supplementary information (ESI) available: 1. Phase-rotated Imχ(2) spectra, 2. |χ(2)|2spectra reconstructed from complex χ(2), 3. results of contact angle measurements, and 4. Fresnel analysis are shown. See DOI: 10.1039/d0cp03207g |
| ‡ S. U. and T. U. contributed equally to this work. |
| This journal is © the Owner Societies 2020 |