 Open Access Article
Mechanistic studies of atomic layer deposition on oxidation catalysts – AlOx and POx deposition†
Kristian
Knemeyer
 a,
Mar
Piernavieja Hermida
a,
Piyush
Ingale
a,
Mar
Piernavieja Hermida
a,
Piyush
Ingale
 a,
Johannes
Schmidt
b,
Jutta
Kröhnert
c,
Raoul
Naumann d’Alnoncourt
 *a,
Matthias
Driess
 ab and
Frank
Rosowski
ad
aBasCat—UniCat BASF JointLab, Technische Universität Berlin, Hardenbergstraße 36, 10623 Berlin, Germany. E-mail: r.naumann@bascat.tu-berlin.de
bInstitut für Chemie, Technische Universität Berlin, Straße des 17, Juni 135, 10623 Berlin, Germany
cDepartment of Inorganic Chemistry, Fritz-Haber-Institut der Max-Planck-Gesellschaft, Faradayweg 4-6, 14195 Berlin, Germany
dBASF SE, Process Research and Chemical Engineering, Carl-Bosch-Straße 38, 67056 Ludwigshafen, Germany
First published on 15th July 2020
Abstract
Atomic layer deposition is a rising technique for catalyst synthesis and modification. Typically, the focus of ALD in catalysis is on supported metal nanoparticles. Here, the authors give mechanistic insights into the ALD of oxides on redox active catalysts by a combination of in situ analytics, such as XPS, DRIFTS and gravimetric measurements. Phosphorus oxide and aluminum oxide were deposited on divanadium pentoxide powder in a fixed bed reactor. In contrast to the generally accepted concepts, the first half cycle does not proceed over surface hydroxyl groups but involves redox chemistry between the precursor and the vanadium atoms, as shown by 31P-SSNMR and XPS. For POx deposition, a temperature step from 150 °C in the first half cycle to 450 °C in the second half cycle is needed to obtain linear mass gain per cycle as the remaining ligands are combusted and reduced vanadium atoms are reoxidized. Homogeneous deposition was confirmed by STEM-EDX and XRD showing no additional phases, despite performing up to 10 ALD cycles. Even the well-known process of alumina ALD confirms the involvement of reduction–oxidation reactions between the ALD precursor and the substrate V2O5. However, redox chemistry can be suppressed for alumina ALD at low temperatures of 50 °C. Therefore, this study shows that ALD on oxidation catalysts is complex and thus the developed ALD processes are unusual compared to ALD on typical supports, such as SiO2 or Al2O3.
Introduction
Atomic layer deposition (ALD) is a sequential thin film deposition technique with high dispersion, uniform coating, precise thickness control and high degree of reproducibility. ALD is capable of depositing nearly any element of the periodic table on flat substrates and numerous processes are already industrially applied, e.g. in the field of microelectronics. In recent years, ALD received huge attention in different fields such as battery or catalyst synthesis due to the aforementioned beneficial characteristics. Besides flat substrates it is possible to deposit functional materials on powders, such as VPO41 or Li3PO42 for battery applications or enhance the lifetime of batteries by Al2O3 coatings.3Furthermore, catalytically active elements can be deposited on almost every typical catalyst support, such as SiO2, Al2O3, TiO2 or ZrO2.4,5 Typically, bottom up catalyst synthesis via ALD aims at supported noble metals6–8 or metal oxides.9–11 Modifications of conventionally prepared catalysts are conducted e.g. by alumina overcoating to prevent sintering12 or leaching.13 However, additional challenges for ALD on powders have to be overcome. Reactor geometries are changed from overflow type reactors to fluidized or fixed bed reactors to overcome diffusion limitations. In situ process monitoring and growth determination on flat substrates is easy via spectroscopic ellipsometry14 or with a quartz crystal microbalance15 but neither of these methods can be directly used for powders and therefore need to be substituted with mass spectrometry or a magnetic suspension balance.16 Additionally, one big difference between catalyst synthesis and microelectronics by ALD is the desired film thickness which is adjusted by the number of ALD cycles. ALD for microelectronics often aims for relative thick films in the range of nanometers up to micrometres which is realised by thousands of ALD cycles.8,17 Whereas, in catalysis sub-monolayers,18,19 single sites20 or nanoparticles21 are required and achieved by several ALD cycles. Despite non-ideal growth behaviour in the first cycles, such as nucleation delay,22,23 mechanistic investigations on these phenomena are rarely made. In fact, the first several ALD cycles are highly important to understand and control the deposition process and therefore the synthesized material. So far, the mechanistic consensus is that ALD proceeds over the reaction of, most often, a metalorganic precursor with the surface OH groups of the substrate forming a metal–oxygen bond by releasing a gaseous by-product in the first half cycle. The second half cycle proceeds by adding an oxidizing reactant to generate new hydroxyl groups.5,24–26 However, these mechanistic insights are almost always given with respect to non-reducible supports on which the catalytic active species are being deposited. Depositing catalytic active layers on typical catalyst supports is not always straightforward as there is either no known process to obtain the desired catalytic active layer or the process is not applicable to porous powders. For example, T. Dobbelaere et al. developed an ALD process for vanadium phosphate on flat substrates involving O2 plasma.1 In fact, plasma has the drawback of surface recombination and might not be suitable for ALD on powders, especially in fixed bed geometry or with porous powders.27,28 Therefore, surface modification of existing bulk catalysts is in some cases the only option to obtain the desired surface layer. However, bulk catalysts may contain additional reactive surface sites besides hydroxyl groups, leading to untypical ALD behaviour, especially for redox active oxidation catalysts as shown in this paper.
Here, we investigate an unusual ALD process of phosphorus oxide on divanadium pentoxide by investigating the reaction mechanism with multiple in situ analytics. In addition, the same methods were applied for alumina ALD on V2O5 and led to the conclusion that both processes undergo unexpected growth behaviour which needs to and can be controlled.
Experimental
Chemicals
Divanadium pentoxide (V2O5, 99.9%, Sigma Aldrich) was sieved to the fraction of 100–200 μm prior to use as substrate. Trimethyl aluminum (Al(CH3)3, TMA, electronic grade, >99.99%, Sigma-Aldrich) and water (H2O, CHROMASOLV®, for HPLC, Riedel-de Haën) served as precursor for aluminum oxide ALD and were used without further purification. Trimethoxy phosphine (P(O(CH3)3), TMPT, 99.99%, Sigma-Aldrich) and high purity oxygen (O2, 99.999%) served as precursor for phosphorous oxide ALD and were used without further purification. High purity nitrogen, argon and helium (99.999%) acted as carrier and purging gas.Atomic layer deposition
ALD was performed in a fixed bed geometry at atmospheric pressure in either a magnetic suspension balance or in a quartz tube on divanadium pentoxide. The setup is described in more detail elsewhere.16 Phosphorus oxide ALD was performed by saturating a constant N2 stream of 25 mL min−1 with trimethoxy phosphine at 60 °C, diluting it in additional 25 mL min−1 of N2 and then depositing it at 150 °C in the first half cycle until saturation. Oxygen served as the reactant in the second half cycle with a flow of 10 mL min−1 diluted in 40 mL min−1 of He at 150 °C or at 450 °C until saturation. Up to ten ALD cycles of POx were performed. Up to six cycles of aluminum oxide ALD were performed by saturating a constant N2 stream of 25 mL min−1 with trimethyl aluminum heated to 50 °C, diluting it in additional 25 mL min−1 of N2 followed by deposition at 150 °C or 50 °C. Water was introduced in the second half cycle by constant saturation of 50 mL min−1 He at room temperature. The second half cycle followed thermal treatment in 10 mL min−1 oxygen diluted in 40 mL min−1 He at 450 °C. Between all half cycles, the reactor was purged with 50 mL min−1 of Ar.Characterization
Results and discussion
ALD of POx on V2O5
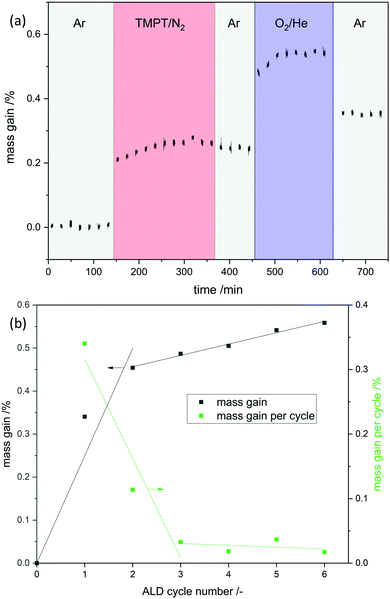
Phosphorous oxide ALD was performed with trimethoxy phosphine and oxygen as reactants at 150 °C. In a magnetic suspension balance the mass gain was tracked in situ to obtain the growth per cycle (gpc) and determine the ALD window (shown as an example for the first cycle in Fig. 1a). In the first six ALD cycles self-limiting mass gain was observed in each half cycle but the gpc decreased with the cycle number from 0.34 wt% in the first cycle to 0.02 wt% in the sixth cycle (Fig. 1b). In the first cycle 0.12 wt% of P is deposited, which makes up 35% of the deposited overall mass. This is comparable to the mass fraction of phosphorus in phosphoric acid (M(P)/M(H3PO4) = 32%). ICP-OES confirmed the increase of P with increasing cycle numbers.After evaluating the process parameters in the magnetic suspension balance, the experimental conditions were transferred from the balance (1 mL) to a quartz tube reactor (30 mL). Scaling up the sample amount results in longer precursor dosing times based on higher total surface area. The scale up was successful as ICP-OES shows identical P loadings for each respective cycle in balance and quartz reactor (Table 1).
| #cycle | P(MSB) wt% | P(FB) wt% | BET (m2 g−1) |
|---|---|---|---|
| 1 | 0.12 | 0.12 | 4.0 |
| 2 | 0.16 | 0.17 | 4.2 |
| 3 | 0.18 | 0.19 | 3.9 |
| 4 | 0.20 | 0.21 | 4.0 |
| 6 | 0.24 | 0.23 | 4.3 |
In addition, N2 sorption measurements show no change the in surface area during ALD. In contrast to ALD on porous material on which the surface area drastically decreases due to the blocking of micropores29 or even mesopores,30 no change is expected for V2O5 as it contains no micro- or meso-pores and already has a relatively low surface area. Possible reason for the decrease in gpc is incomplete removal of ligands on phosphorus, which prevent further reaction or the previously reactive surface sites were not regenerated in the second half cycle. As the process does not lead to further significant deposition after the 3rd cycle it might not be called atomic layer deposition anymore. To remove residue ligands on the surface and recreate reactive surface sites, the procedure was performed at higher temperatures in the second half cycle (450 °C). Ten ALD cycles were performed and a linear gpc was achieved as shown by XRF measurements (Fig. 2). In addition, coverage by phosphorus was calculated by assuming primarily Frank–van-der-Merwe growth31 and correlating the deposited amount of P to either surface hydroxyl group density or surface vanadium atom density (Fig. 2). Correlating P uptake in the very first cycle to the surface hydroxyl group density of 1.4 OH nm−2![[thin space (1/6-em)]](https://www.rsc.org/images/entities/char_2009.gif) 18 shows a P/OH ratio of 3.5. In contrast to the often in literature proposed ALD mechanism over surface OH-groups, POx-ALD has to undergo a different and/or additional mechanism as the amount of P exceeds the number of OH groups resulting in more than one monolayer coverage in one cycle. Physisorption of the precursor is excluded by the balance experiment as tailing would occur during purging with Ar. In addition, P is stable during post treatment at 450 °C in dry and wet synthetic air indicating covalent bonds on the surface and not just physisorption. Therefore, additional reactive surface sites must be considered, such as surface vanadium atoms. Instead of determining the P/OH ratio, P/V was determined. The number of vanadium atoms per nm2 on the surface was calculated based on the ideal crystal structure of the (010) plane in V2O5 and found to be 9.76 V nm−2.32 Based on these assumptions, the first monolayer forms after the 3rd cycle, the second layer after the 7th and the third layer after the 10th cycle. The formation of additional phases was investigated on the prepared 1 cycle and 10 cycle samples by XRD (ESI,† Fig. S1) and STEM-EDX (Fig. 3 and ESI,† Fig. S2). However, XRD reflexes only show phase pure divanadium pentoxide which means that either no additional crystalline phases are formed or the formed crystallites are smaller than the detection limit of typically <3 nm.33 STEM-EDX shows highly dispersed phosphorus on divanadium pentoxide for the 1 cycle and 10 cycle samples. This indicates layer-by-layer growth, as big islands of POx would most likely be visible in STEM-EDX mapping, also revealing uncovered V2O5. Furthermore, island growth is likely to be excluded based on the observed linear growth per cycle. For island growth, the growth per cycle would exponentially increase in the first ALD cycles until a closed layer forms because of which the gpc remains constant.34–38
18 shows a P/OH ratio of 3.5. In contrast to the often in literature proposed ALD mechanism over surface OH-groups, POx-ALD has to undergo a different and/or additional mechanism as the amount of P exceeds the number of OH groups resulting in more than one monolayer coverage in one cycle. Physisorption of the precursor is excluded by the balance experiment as tailing would occur during purging with Ar. In addition, P is stable during post treatment at 450 °C in dry and wet synthetic air indicating covalent bonds on the surface and not just physisorption. Therefore, additional reactive surface sites must be considered, such as surface vanadium atoms. Instead of determining the P/OH ratio, P/V was determined. The number of vanadium atoms per nm2 on the surface was calculated based on the ideal crystal structure of the (010) plane in V2O5 and found to be 9.76 V nm−2.32 Based on these assumptions, the first monolayer forms after the 3rd cycle, the second layer after the 7th and the third layer after the 10th cycle. The formation of additional phases was investigated on the prepared 1 cycle and 10 cycle samples by XRD (ESI,† Fig. S1) and STEM-EDX (Fig. 3 and ESI,† Fig. S2). However, XRD reflexes only show phase pure divanadium pentoxide which means that either no additional crystalline phases are formed or the formed crystallites are smaller than the detection limit of typically <3 nm.33 STEM-EDX shows highly dispersed phosphorus on divanadium pentoxide for the 1 cycle and 10 cycle samples. This indicates layer-by-layer growth, as big islands of POx would most likely be visible in STEM-EDX mapping, also revealing uncovered V2O5. Furthermore, island growth is likely to be excluded based on the observed linear growth per cycle. For island growth, the growth per cycle would exponentially increase in the first ALD cycles until a closed layer forms because of which the gpc remains constant.34–38
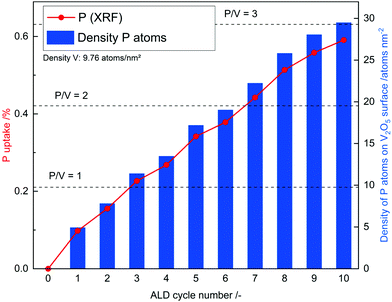 | ||
| Fig. 2 Phosphorus uptake during ALD determined by XRF and the calculated density of P atoms on the surface of POx/V2O5. | ||
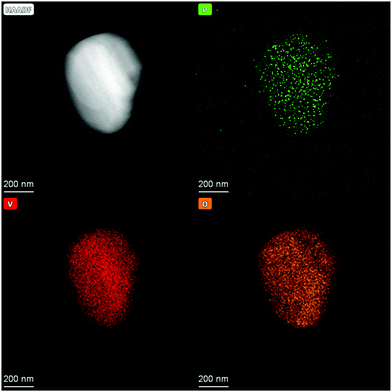 | ||
| Fig. 3 HAADF image of POx/V2O5 prepared by 10 cycles of POx-ALD and STEM-EDX mappings of P, V and O. | ||
ALD – investigations of the mechanism
ALD mechanisms are not fully understood, as detailed physical and chemical analysis in the first few cycles are challenging due to sensitivity and resolution restrictions. In the very first ALD cycle, less than a monolayer is deposited which shows the need for highly sensitive analytics.In situ DRIFTS experiments were conducted to understand the difference between applying reactor temperatures of 150 °C and 450 °C in the second half cycle (Fig. 4). Therefore, one sample was prepared by performing one half cycle of TMPT on V2O5 and then transferred under inert conditions to the DRIFTS cell. After the first half cycle the phosphorus precursor was chemisorbed on the vanadium surface as indicated by C–H vibrations (2964 cm−1). Heating up to 150 °C in 20% oxygen does not lead to a loss of these C–H fragments, meaning the surface is still partially covered with ligands of the precursor. Additionally, the condensation of OH groups (3365 cm−1) on the surface occurs, showing that hydroxyl groups do not contribute to further ALD cycles. However, heating up to 450 °C leads to formation of CO2 (2345 cm−1) and the C–H vibrations (2960 cm−1 and 2858 cm−1) diminish. This leads to the conclusion that at 450 °C the organic ligands on the surface are combusted and new anchoring sites for the following ALD cycle are created. Therefore, linear gpc can only be achieved by combusting remaining ligands in the second half cycle.
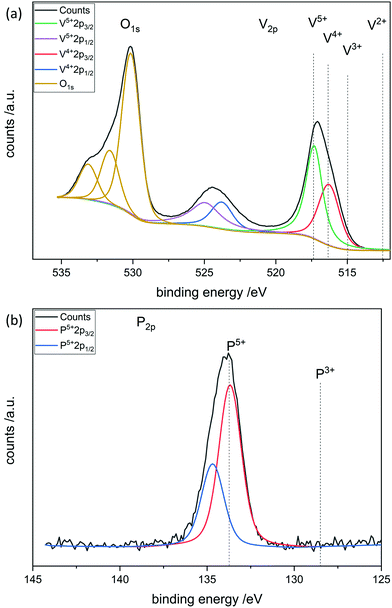
To further investigate the surface species during POx-ALD solid-state magic angle spinning 31P-NMR experiments were conducted at each step during ALD synthesis. After the first and second half cycle at 150 °C no 31P-NMR signals are obtained (ESI,† Fig. S3 and S4), but once the sample was exposed to oxygen at 450 °C clear P signals are visible (Fig. 5). This suggests that the P-precursor is anchored via a redox reaction with V2O5 with the formation of V4+ in the first half cycle, as vanadium atoms in lower oxidation states than V5+ are paramagnetic. Once a 31P-nucleus is in close proximity to paramagnetic vanadium species the line width increases drastically and signals cannot be observed anymore.39 After the oxygen treatment at 450 °C a 31P-NMR signal is observed due to reoxidation of the former paramagnetic vanadia species into diamagnetic V5+. In addition, a hint for redox chemistry is already given by the color change of the catalyst. Before ALD, divanadium pentoxide appears to be bright orange which then turns dark green after exposure to trimethoxy phosphine, which is comparable to the color of VO2 (ESI,† Fig. S5). Dosing oxygen at 150 °C does not reverse the color change but heating in O2 at 450 °C does. Further studies of the oxidation states were performed by XPS experiments under inert conditions to investigate each step of the first cycle (Fig. 6). Overall, only vanadium atoms in the oxidation states of V5+ and V4+ were detected and a ratio R was calculated to describe the relative amount of reduced vanadium species in each synthesis step (Table 2).
| P3+ + 2V5+ → P5+ + 2V4+ |
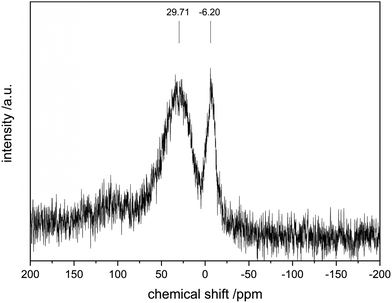 | ||
| Fig. 5 31P-SSNMR of POx/V2O5 after 1 cycle POx-ALD. Note: the low signal to noise ratio is due to the low P loading (0.1%). | ||
| R | |
|---|---|
| V2O5 fresh | 0.16 |
| V2O5 calcined (450 °C) | 0.11 |
| POx/V2O5 1 half cycle | 0.41 |
| POx/V2O5 1 cycle (150 °C) | 0.22 |
| POx/V2O5 1 cycle (450 °C) | 0.10 |
After the first half cycle a surface ratio of P/V = 0.50 is obtained, confirming that one P atom is located near two vanadium atoms, assuming deposition exclusively on the surface.
ALD of AlOx on V2O5
Aluminum oxide ALD is the most prominent process in ALD history and therefore well investigated. The reaction mechanism is understood as a reaction between surface hydroxyl groups and trimethyl aluminum forming an oxygen aluminum bond while releasing methane in the first half cycle.5,16 In the second half cycle, water regenerates hydroxyl groups by formation of more aluminum oxygen bonds and formation of methane. These ligand exchange reactions with surface hydroxyl groups typically do not cause changes in oxidation states, as aluminum remains in its maximum oxidation state.First, deposition experiments of aluminum oxide on divanadium pentoxide were conducted in the magnetic suspension balance to investigate the growth behavior in situ for up to six cycles. The ALD sequence consists of addition of TMA followed by water with purging inbetween. In addition, a thermal treatment at 450 °C in O2 is added after each cycle:
| TMA–Ar–H2O–Ar–O2(450 °C) |
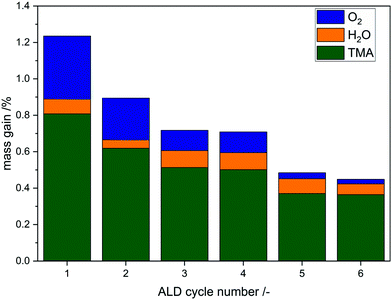 | ||
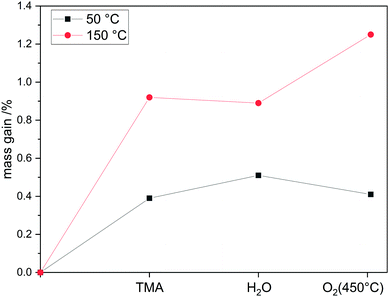
| Fig. 7 Mass uptake distribution of each step during the first 6 cycles for the reaction sequence TMA–H2O–O2(450 °C). | ||
Here, the limiting factor most likely is not the initial amount of reactive surface sites but rather the diffusion of bulk oxygen to the surface. The literature shows that after surface vanadyl groups are consumed they can be regenerated to a certain degree by bulk vanadyl groups due to oxygen diffusion.42 This fact might explain the high Al loading, as reactive oxygen species are provided during the reaction not only from the surface but also from the bulk, still leading to self-limitation at one point. As in the phosphorus system, the color changes from orange to green in the first half cycle and back to orange at 450 °C in oxygen which indicates redox chemistry (ESI,† Fig. S10). In addition, a high mass uptake during the oxygen cycle results due to the filling of defect sites in the vanadia structure.
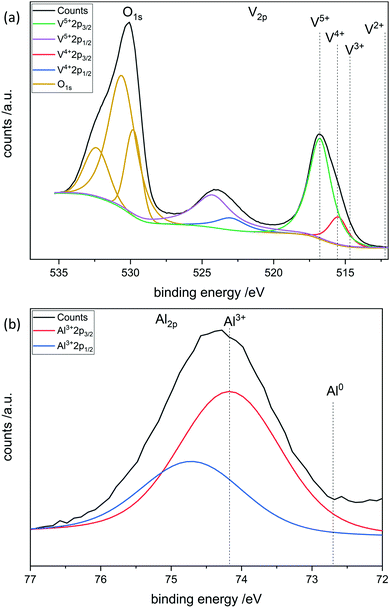
XPS was performed at each step during the synthesis in the first complete cycle (Fig. 8). It can be seen that adding TMA leads to the reduction of divanadium pentoxide as indicated by the ratio R (Table 3). Dosing water barely changes the oxidation states of the vanadium species. However, heating in oxygen to 450 °C leads to complete oxidation of the vanadium oxide. Aluminum always remains in its maximum oxidation state Al3+. This leads to the conclusion that the carbons of the ligand are oxidized while the vanadium is reduced from V5+ to V4+. Mass spectrometry reveals that TMA reacts with vanadium oxide to form methane most likely over the surface hydroxyl groups. In addition, electron transfer from the methyl group to vanadium occurs, as ethane is evolving, in which the carbon in Al–CH3 transitions from C4− to C3− in ethane (ESI,† Fig. S11).
| R | |
|---|---|
| V2O5 fresh | 0.16 |
| V2O5 calcined (450 °C) | 0.11 |
| AlOx/V2O5 1 half cycle | 0.40 |
| AlOx/V2O5 1 cycle (150 °C) | 0.17 |
| AlOx/V2O5 1 cycle (450 °C) | 0.20 |
This is in contrast to the phosphorus system in which the central atom is oxidized whereas in the aluminum system the ligands are oxidized. The mass uptake during the thermal treatment at 450 °C is therefore an indicator of redox chemistry on divanadium pentoxide, as the mass change is the sum of oxygen incorporation into vanadium oxide (mass uptake) and the loss of ligands due to combustion (mass loss). If there is a mass uptake in this step, redox chemistry occurs. Performing the aluminum oxide ALD at lower temperatures, such as 50 °C, thermal treatment at 450 °C in oxygen does not result in mass uptake, indicating that redox chemistry can be suppressed by lowering the temperature (Fig. 9). In addition, the reaction time until saturation decreased by 80% from 21.3 h g−1 to 4.2 h g−1.
Conclusions
We successfully developed an ALD process to deposit phosphorus oxide on divanadium pentoxide by investigating the reaction mechanism with combined in situ analytics. XRF showed P loadings exceeding the surface hydroxyl group density, leading to the conclusion of additional reactive surface sites being present. During the deposition process redox reaction takes place, in which the P3+ precursor oxidized to P5+ and V5+ is reduced to V4+ as revealed by XPS. High temperatures of 450 °C in the oxygen cycle are needed to obtain linear growth per cycle because remaining ligands need to be combusted and reduced vanadium atoms need to be reoxidized. STEM-EDX mappings show homogeneously distributed phosphorus on the surface and XRD could not detect additional phases.Further investigations were made by depositing TMA/H2O on divanadium pentoxide by the literature known process. Again, XPS confirms the presence of redox chemistry for alumina ALD at 150 °C. This reaction can be controlled by lowering the deposition temperature to 50 °C. Performing ALD on an oxidation catalyst is clearly different from ALD on inert supports. Unusual growth behaviour occurred during both processes and they were successfully controlled by adjusting the deposition parameters accordingly. The knowledge about possible reaction mechanisms and how to control them allows the development of further ALD processes on additional bulk catalysts in future.
Conflicts of interest
There are no conflicts to declare.Acknowledgements
The work was conducted in the framework of the BasCat – UniCat BASF JointLab at the Technical University of Berlin. The work was partially funded by the Deutsche Forschungsgemeinschaft (DFG, German Research Foundation) under Germany's Excellence Strategy – EXC 2008 – 390540038 – UniSysCat. The authors thank Stephen Lohr (BASF), Jan Dirk Epping (TU Berlin) and the colleagues from FHI (Maike Hashagen, Olaf Timpe, Jasmin Allan, Frank Girgsdies and Annette Trunschke).Notes and references
- T. Dobbelaere, F. Mattelaer, P. M. Vereecken and C. Detavernier, J. Vac. Sci. Technol., A, 2017, 35, 041513 CrossRef.
- X. Meng, X. Q. Yang and X. Sun, Adv. Mater., 2012, 24, 3589–3615 CrossRef CAS PubMed.
- Y. Zhao, K. Zheng and X. Sun, Joule, 2018, 2, 2583–2604 CrossRef CAS.
- J. Lu, J. W. Elam and P. C. Stair, Surf. Sci. Rep., 2016, 71, 410–472 CrossRef CAS.
- R. L. Puurunen, J. Appl. Phys., 2005, 97, 121301 CrossRef.
- W. J. Lee, S. Bera, H. C. Shin, W. P. Hong, S. J. Oh, Z. Wan and S. H. Kwon, Adv. Mater. Interfaces, 2019, 6, 1–9 Search PubMed.
- V. R. Anderson, N. Leick, J. W. Clancey, K. E. Hurst, K. M. Jones, A. C. Dillon and S. M. George, J. Phys. Chem. C, 2014, 118, 8960–8970 CrossRef CAS.
- A. J. M. Mackus, M. J. Weber, N. F. W. Thissen, D. Garcia-Alonso, R. H. J. Vervuurt, S. Assali, A. A. Bol, M. A. Verheijen and W. M. M. Kessels, Nanotechnology, 2015, 27, 34001 CrossRef PubMed.
- H. Feng, J. W. Elam, J. A. Libera, M. J. Pellin and P. C. Stair, J. Catal., 2010, 269, 421–431 CrossRef CAS.
- N. Yan, L. Qin, J. Li, F. Zhao and H. Feng, Appl. Surf. Sci., 2018, 451, 155–161 CrossRef CAS.
- S. Haschke, D. Pankin, Y. Petrov, S. Bochmann, A. Manshina and J. Bachmann, ChemSusChem, 2017, 10, 3644–3651 CrossRef CAS PubMed.
- N. Cheng, M. N. Banis, J. Liu, A. Riese, X. Li, R. Li, S. Ye, S. Knights and X. Sun, Adv. Mater., 2015, 27, 277–281 CrossRef CAS PubMed.
- W. Yang, Z. Lu, B. Vogler, T. Wu and Y. Lei, ACS Appl. Mater. Interfaces, 2018, 10, 43323–43326 CrossRef CAS PubMed.
- E. Langereis, S. B. S. Heil, H. C. M. Knoops, W. Keuning, M. C. M. van de Sanden and W. M. M. Kessels, J. Phys. D: Appl. Phys., 2009, 42, 073001 CrossRef.
- K. Knapas and M. Ritala, Crit. Rev. Solid State Mater. Sci., 2013, 38, 167–202 CrossRef CAS.
- V. E. Strempel, R. Naumann D’Alnoncourt, M. Driess and F. Rosowski, Rev. Sci. Instrum., 2017, 88, 074102 CrossRef CAS PubMed.
- J. H. Lee, A. Mirzaei, J. H. Kim, J. Y. Kim, A. F. Nasriddinov, M. N. Rumyantseva, H. W. Kim and S. S. Kim, Sens. Actuators, B, 2020, 310, 127870 CrossRef CAS.
- V. E. Strempel, D. Löffler, J. Kröhnert, K. Skorupska, B. Johnson, R. N. D’Alnoncourt, M. Driess and F. Rosowski, J. Vac. Sci. Technol., A, 2016, 34, 01A135 CrossRef.
- S. C. Riha, B. M. Klahr, E. C. Tyo, S. Seifert, S. Vajda, M. J. Pellin, T. W. Hamann and A. B. F. Martinson, ACS Nano, 2013, 7, 2396–2405 CrossRef CAS PubMed.
- H. Yan, H. Cheng, H. Yi, Y. Lin, T. Yao, C. Wang, J. Li, S. Wei, J. Lu, H. Yan, H. Cheng, H. Yi, Y. Lin, T. Yao, C. Wang, J. Li and S. Wei, J. Am. Chem. Soc., 2015, 1–6 Search PubMed.
- B. J. Oneill, D. H. K. Jackson, J. Lee, C. Canlas, P. C. Stair, C. L. Marshall, J. W. Elam, T. F. Kuech, J. A. Dumesic and G. W. Huber, ACS Catal., 2015, 5, 1804–1825 CrossRef CAS.
- J. W. Elam, A. V. Zinovev, M. J. Pellin, D. J. Comstock and M. C. Hersam, ECS Trans., 2007, 3, 271–278 CrossRef CAS.
- J. Hämäläinen, M. Ritala and M. Leskelä, Chem. Mater., 2014, 26, 786–801 CrossRef.
- D. Valdesueiro, M. K. Prabhu, C. Guerra-Nunez, C. S. S. Sandeep, S. Kinge, L. D. A. Siebbeles, L. C. P. M. De Smet, G. M. H. Meesters, M. T. Kreutzer, A. J. Houtepen and J. R. V. Ommen, J. Phys. Chem. C, 2016, 120, 4266–4275 CrossRef CAS.
- W. Setthapun, W. D. Williams, S. M. Kim, H. Feng, J. W. Elam, F. A. Rabuffetti, K. R. Poeppelmeier, P. C. Stair, E. A. Stach, F. H. Ribeiro, J. T. Miller and C. L. Marshall, J. Phys. Chem. C, 2010, 114, 9758–9771 CrossRef CAS.
- T. D. Gould, A. M. Lubers, A. R. Corpuz, A. W. Weimer, J. L. Falconer and J. W. Medlin, ACS Catal., 2015, 5, 1344–1352 CrossRef CAS.
- P. Schindler, M. Logar, J. Provine and F. B. Prinz, Langmuir, 2015, 31, 5057–5062 CrossRef CAS PubMed.
- U. Cvelbar, M. Mozetič and A. Ricard, IEEE Trans. Plasma Sci., 2005, 33, 834–837 CAS.
- V. E. Strempel, K. Knemeyer, R. N. D’Alnoncourt, M. Driess and F. Rosowski, Nanomaterials, 2018, 8, 365 CrossRef PubMed.
- J. Lu, B. Fu, M. C. Kung, G. Xiao, J. W. Elam, H. H. Kung and P. C. Stair, Science, 2012, 335, 1205–1209 CrossRef CAS PubMed.
- F. C. Frank and J. H. Van Der Merwe, Proc. R. Soc. London, Ser. A, 1949, 198, 216–225 CAS.
- J. Haber, M. Witko and R. Tokarz, Appl. Catal., A, 1997, 157, 3–22 CrossRef CAS.
- R. Wojcieszak, M. J. Genet, P. Eloy, P. Ruiz and E. M. Gaigneaux, J. Phys. Chem. C, 2010, 114, 16677–16684 CrossRef CAS.
- R. L. Puurunen, W. Vandervorst, W. F. A. Besling, O. Richard, H. Bender, T. Conard, C. Zhao, A. Delabie, M. Caymax, S. De Gendt, M. Heyns, M. M. Viitanen, M. De Ridder, H. H. Brongersma, Y. Tamminga, T. Dao, T. De Win, M. Verheijen, M. Kaiser and M. Tuominen, J. Appl. Phys., 2004, 96, 4878–4889 CrossRef CAS.
- J. W. Elam, C. E. Nelson, R. K. Grubbs and S. M. George, Thin Solid Films, 2001, 386, 41–52 CrossRef CAS.
- R. L. Puurunen and W. Vandervorst, J. Appl. Phys., 2004, 96, 7686–7695 CrossRef CAS.
- O. Nilsen, C. E. Mohn, A. Kjekshus and H. Fjellvåg, J. Appl. Phys., 2007, 102, 024906 CrossRef.
- J. W. Elam, A. V. V. Zinovev, M. J. Pellin, D. J. Comstock and M. C. Hersam, ECS Trans., 2019, 3, 271–278 CrossRef.
- M. T. Sananes, A. Tuel and J. C. Volta, J. Catal., 1994, 145, 251–255 CrossRef CAS.
- K. Hermann, M. Witko, R. Druzinic and R. Tokarz, Appl. Phys. A: Mater. Sci. Process., 2001, 72, 429–442 CrossRef CAS.
- R. T. J. Haber and M. Witko, Appl. Catal., A, 1997, 157, 3–22 CrossRef.
- A. Miyamoto, Y. Yamazaki, M. Inomata and Y. Murakami, J. Phys. Chem., 1981, 85, 2366–2372 CrossRef CAS.
Footnote |
| † Electronic supplementary information (ESI) available: Growth curves, XRD, XPS, STEM-EDX, and ICP-OES. See DOI: 10.1039/d0cp02572k |
| This journal is © the Owner Societies 2020 |

