 Open Access Article
Creative Commons Attribution 3.0 Unported Licence
Electron spin relaxation properties of atomic hydrogen encapsulated in octavinyl POSS cages
George
Mitrikas
 * and
Stavroula
Menenakou
Institute of Nanoscience and Nanotechnology, N.C.S.R. Demokritos, 15310 Athens, Greece. E-mail: g.mitrikas@inn.demokritos.gr; Fax: +30 210 6503323; Tel: +30 210 6503304
First published on 24th June 2020
Abstract
The electron spin relaxation times of encapsulated atomic hydrogen in the vinyl derivative of silsesquioxane (R8Si8O12) cages (R = CH![[double bond, length as m-dash]](https://www.rsc.org/images/entities/char_e001.gif) CH2) are studied in detail by pulse electron paramagnetic resonance (EPR) methods in the temperature range between 10 and 300 K. The temperature dependence of the spin–lattice relaxation time, T1, shows similar behaviour with previously studied derivatives that typically involve Raman and thermally activated processes. The room-temperature phase-memory time TM = 9 μs is comparable to those reported for different alkyl derivatives and exhibits a characteristic temperature dependence with a considerable reduction below 200 K as a result of dynamic effects like methyl group rotation. However, this reduction is modest for the vinyl derivative since the minimum observed TM = 5 μs is much longer than the value of 1 μs reported for methyl-containing derivatives like R = C2H5, C3H7 (n-propyl), or OSi(CH3)2H. This discrepancy is attributed to the different rotation dynamics of the vinyl group, as evidenced by the determined activation energy and rotation frequency.
CH2) are studied in detail by pulse electron paramagnetic resonance (EPR) methods in the temperature range between 10 and 300 K. The temperature dependence of the spin–lattice relaxation time, T1, shows similar behaviour with previously studied derivatives that typically involve Raman and thermally activated processes. The room-temperature phase-memory time TM = 9 μs is comparable to those reported for different alkyl derivatives and exhibits a characteristic temperature dependence with a considerable reduction below 200 K as a result of dynamic effects like methyl group rotation. However, this reduction is modest for the vinyl derivative since the minimum observed TM = 5 μs is much longer than the value of 1 μs reported for methyl-containing derivatives like R = C2H5, C3H7 (n-propyl), or OSi(CH3)2H. This discrepancy is attributed to the different rotation dynamics of the vinyl group, as evidenced by the determined activation energy and rotation frequency.
1 Introduction
After the discovery of the ability of polyhedral oligomeric silsesquioxane (POSS) cages to stably host atomic hydrogen upon γ-irradiation,1 many electron paramagnetic resonance (EPR) studies of the H˙ radical have been reported.2 Early works focused mainly on the electron g-value and the temperature dependence of the hyperfine coupling constant A of the encapsulated hydrogen atom as a probe of its environment.3–5 Later determination of electron spin–lattice (T1) and phase memory (TM) relaxation times using pulse EPR methods were often triggered by their potential application as qubit embodiments in a similar fashion to other molecular spin systems like for instance endohedral fullerenes (N@C60 or P@C60).6 While atomic hydrogen is more attractive due to its simpler electronic 1s state and the exceptionally large hyperfine coupling of about 1420 MHz, detailed pulse EPR studies of relevant parameters to quantum computing like T1 and TM are scarce and concern exclusively cages of the type R8Si8O12 with R = C2H5,7 R = C3H7 (n-propyl),8 and R = OSi(CH3)2H.9 These studies showed that at ambient temperatures TM ranges from 9 to 14 μs and is determined by nuclear spin diffusion, whereas, below 200 K is abruptly reduced to 1 μs and follows a temperature dependence characteristic of systems in which spins that are coupled to the paramagnetic center undergo a dynamic process that averages inequivalent environments. As the temperature is reduced, the latter process slows down and leads to a shortening of TM due to the incomplete averaging of anisotropic hyperfine interactions. This is a very effective decoherence mechanism that is maximized when the rate of the dynamic process R becomes equal to the splitting Δ that is averaged.10Although slow processes like nuclear spin diffusion can be effectively suppressed by dynamical decoupling methods,11 this is not possible for mechanisms having short correlation times (typically τc < 100 ns) like the rapid reorientation of methyl groups.12 As a consequence, all methyl-containing H@POSS derivatives would suffer from short TM values in the low-temperature range between 10 and 150 K, despite the fact that the corresponding T1 values are much longer ranging between 60 s and 1 ms in the same temperature interval.7–9 This peculiarity, which is intrinsic for all POSS cages possessing methyl groups in the organic substituents R, could be a drawback for the implementation of H@POSS in quantum computing applications where long TM values at low temperatures are required.
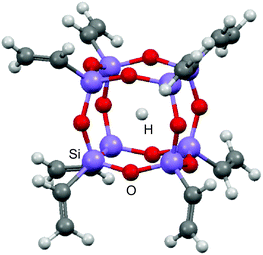
Herein we present a detailed electron spin relaxation study on the H@POSS derivative with R = CH![[double bond, length as m-dash]](https://www.rsc.org/images/entities/char_e001.gif) CH2, (CH2CH)8Si8O12 (Fig. 1), containing an organic group with different rotational degrees of freedom compared to the previously reported R = OSi(CH3)2H (also termed Q8MH8).9 For the sake of completeness we additionally present the corresponding data for the species with R = OSi(CH3)3, also known as Q8M8. The latter two species, namely Q8MH8 and Q8M8, have shown to exhibit the longest TM value of 14 μs at room temperature9 due to the larger electronegativity of R and the longer distance between the unpaired electron and the peripheral proton nuclei as compared to those of alkyl derivatives.2,8 While H@(CH2CH)8Si8O12 does not differ considerably from H@Me8Si8O12 or H@Et8Si8O12 in terms of nuclear spin diffusion, and thus a TM of 9 μs would be expected, one may anticipate a possible change on the temperature dependence of TM for the vinyl derivative as a consequence of the reduced rotational modes of the organic substituent R dictated by the inhibited rotation about the carbon–carbon double bond. This aspect of relaxation dynamics has triggered our present work for two reasons: first, it is an excellent way to test our previous assignment of the low-temperature relaxation enhancement to methyl rotation, and second, it can give further insight into the relaxation mechanisms of H@POSS and thus help to design species with longer TM values.
CH2, (CH2CH)8Si8O12 (Fig. 1), containing an organic group with different rotational degrees of freedom compared to the previously reported R = OSi(CH3)2H (also termed Q8MH8).9 For the sake of completeness we additionally present the corresponding data for the species with R = OSi(CH3)3, also known as Q8M8. The latter two species, namely Q8MH8 and Q8M8, have shown to exhibit the longest TM value of 14 μs at room temperature9 due to the larger electronegativity of R and the longer distance between the unpaired electron and the peripheral proton nuclei as compared to those of alkyl derivatives.2,8 While H@(CH2CH)8Si8O12 does not differ considerably from H@Me8Si8O12 or H@Et8Si8O12 in terms of nuclear spin diffusion, and thus a TM of 9 μs would be expected, one may anticipate a possible change on the temperature dependence of TM for the vinyl derivative as a consequence of the reduced rotational modes of the organic substituent R dictated by the inhibited rotation about the carbon–carbon double bond. This aspect of relaxation dynamics has triggered our present work for two reasons: first, it is an excellent way to test our previous assignment of the low-temperature relaxation enhancement to methyl rotation, and second, it can give further insight into the relaxation mechanisms of H@POSS and thus help to design species with longer TM values.
2 Experimental
2.1 Sample preparation
Octavinylsilsesquioxane ((CH2![[double bond, length as m-dash]](https://www.rsc.org/images/entities/char_e001.gif) CH)8Si8O12, CAS 69655-76-1) was prepared by hydrolysis and subsequent condensation of trichlorovinylsilane (CH2
CH)8Si8O12, CAS 69655-76-1) was prepared by hydrolysis and subsequent condensation of trichlorovinylsilane (CH2![[double bond, length as m-dash]](https://www.rsc.org/images/entities/char_e001.gif) CHSiCl3, CAS 75-94-5, 97% Aldrich) that was used as received.13 In a 100 ml round bottomed flask containing 72 ml of ethanol cooled in an ice bath, 4 ml of CH2
CHSiCl3, CAS 75-94-5, 97% Aldrich) that was used as received.13 In a 100 ml round bottomed flask containing 72 ml of ethanol cooled in an ice bath, 4 ml of CH2![[double bond, length as m-dash]](https://www.rsc.org/images/entities/char_e001.gif) CHSiCl3 (31.2 mmol) were added dropwise with vigorous stirring. After that, a mixture of 8 ml of ethanol and 4 ml of water (72 mmol) was added dropwise and the solution was stirred for a week at room temperature. The white fine crystalline precipitate was filtered off, further washed with methanol and finally dried in air at 70 °C to give 325 mg of pure product (13% yield). The compound was analysed by infrared spectroscopy revealing resonances at 3070w, 3028w, 2989w, 2960w, 1605m, 1410m, 1275m, 1165 (sh), 1080s (br), 1000m, 965m, 775m, 755 (sh), 566s, 460m cm−1. These are in excellent agreement with previously reported IR data of the same compound for which the structure was also analysed with X-ray crystallography.14
CHSiCl3 (31.2 mmol) were added dropwise with vigorous stirring. After that, a mixture of 8 ml of ethanol and 4 ml of water (72 mmol) was added dropwise and the solution was stirred for a week at room temperature. The white fine crystalline precipitate was filtered off, further washed with methanol and finally dried in air at 70 °C to give 325 mg of pure product (13% yield). The compound was analysed by infrared spectroscopy revealing resonances at 3070w, 3028w, 2989w, 2960w, 1605m, 1410m, 1275m, 1165 (sh), 1080s (br), 1000m, 965m, 775m, 755 (sh), 566s, 460m cm−1. These are in excellent agreement with previously reported IR data of the same compound for which the structure was also analysed with X-ray crystallography.14
Encapsulation of atomic hydrogen was performed with γ-irradiation in steps using a 60Co source. The accumulated dose was measured using Red Perspex Dosimeters, Type 4034 AD. 80 mg of POSS powder were mixed with 16 mg of I2(s) (acting as radical scavenger), placed in a sealed vial and irradiated for 24 days resulting in a total dose of 240 kGy. After γ-irradiation the powder was purified by the precipitation method using methanol to remove iodine. The recovered powder was dried under vacuum (10−1 mbar) for 1 h and 25 mg of the sample was transferred into an EPR quartz tube. Comparison of the cw EPR spectrum (in the presence of O2, unsaturated conditions) with a standard sample gave an estimate of 7.5 × 10¹⁵ spins per cm3 for the electron spin concentration. To avoid paramagnetic oxygen in pulsed EPR measurements, the quartz tube was filled with He gas following the procedure described previously.9
2.2 Spectroscopy
Infrared spectra were recorded at room temperature on as-prepared powders using the Attenuated Total Reflection (ATR) technique with a PerkinElmer Spectrum 100 FTIR spectrometer (range 400–4000 cm−1).EPR measurements at the X-band were carried out on a Bruker ESP 380E spectrometer equipped with a rectangular ER 4102ST cavity (continuous wave (cw) mode) or an EN 4118X-MD4 Bruker resonator (pulse mode). Low temperature measurements were performed with a helium cryostat from Oxford Inc. (at temperatures between 10 and 300 K). The microwave frequency was measured with a HP 5350B microwave frequency counter. The temperature was stabilized with an Oxford ITC4 temperature controller within ±0.1 K. The magnetic field was calibrated using a DPPH standard. The relaxation measurements were performed at the low-field EPR transition. The repetition rate was properly adjusted in every measurement in order to avoid saturation.
The electron spin–lattice relaxation times T1 were measured by inversion recovery with the pulse sequence π–t–π/2–τ–π–τ–echo. The lengths of the mw π/2 and π pulses were 16 and 32 ns, respectively, and the interpulse delay τ = 600 ns. For each trace, 100 data points were collected with an appropriate time increment to ensure complete magnetization recovery. The phase-memory times TM were measured by the two-pulse echo decay sequence, π/2–t–π–t–echo, with t varying.
At temperatures lower than 20 K, where T1 exceeds the maximum instrumental shot repetition time of 2 s, the electron spin echo was recorded with a HP Infinium 54810A oscilloscope which allowed the acquisition of the entire time trace in a single shot. The corresponding T1 values were obtained with the saturation method: after saturation using a fast repetition rate, the microwave irradiation was interrupted and the system allowed to relax for time t which was recorded with a chronometer. The recovered magnetization was measured with a two-pulse echo in a single-shot experiment recorded with the oscilloscope.
2.3 Data manipulation
The data were processed with the program MATLAB 7.0 (The MathWorks, Natick, MA). T1 relaxation times were determined by fitting the time traces with single exponential functions. For obtaining TM a stretched exponential function was used. cw-EPR spectra were simulated with the EasySpin package.15 For powder spectra simulations the isotropic spin Hamiltonian![[script letter H]](https://www.rsc.org/images/entities/char_e142.gif) = gβeB/hSz − gHβnB/hIz + AisoSzIz was used, where g and gH are the electron and nuclear g-factors, βe and βn are the Bohr and nuclear magnetons, Aiso is the proton hyperfine coupling constant, and B is the static magnetic field along z-axis. For fluid solution spectra, the superhyperfine term
= gβeB/hSz − gHβnB/hIz + AisoSzIz was used, where g and gH are the electron and nuclear g-factors, βe and βn are the Bohr and nuclear magnetons, Aiso is the proton hyperfine coupling constant, and B is the static magnetic field along z-axis. For fluid solution spectra, the superhyperfine term  was added with N = 1 and N = 2 for the species with one and two 29Si atoms in the POSS core cage, respectively.
3 Results and discussion
3.1 cw-EPR spectroscopy
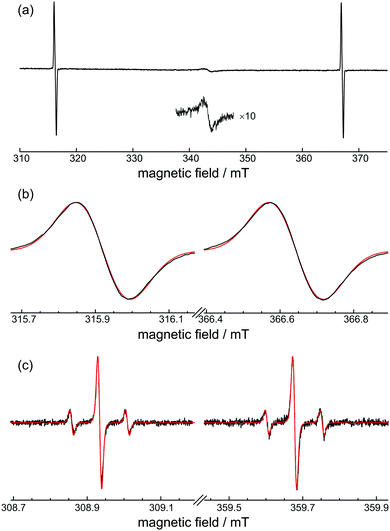
The room-temperature EPR spectrum of H@(CH2CH)8Si8O12 is shown in Fig. 2(a). Apart from the two characteristic EPR transitions of H˙ that are separated by about 50.8 mT, there is also a weak signal around g = 2 that is attributed to radiation-induced free radicals. This signal, which is stronger if O2 is used as radical scavenger instead of I2(s), decays to noise level within a couple of days when the sample is exposed to air.Fig. 2(b) shows a closer inspection of the inhomogeneously broadened resonance lines having ΔBpp = 0.14 mT. The simultaneous simulation of both spectra gave g = 2.00282(10), Aiso = 1414.2(2) MHz, and a Gaussian lineshape with a FWHM of 4.90(5) MHz, which are close to the values reported previously for alkyl-substituted derivatives.8
The 29Si isotropic hyperfine coupling, A29Si, can be obtained from the analysis of the solution EPR spectra shown in Fig. 2(c). The spectra have narrow linewidths ΔBpp = 10.8 μT and exhibit satellite peaks separated by 0.149 mT that are assigned to the hyperfine interaction between the unpaired electron and 29Si atoms of the POSS cage. Assuming all eight positions are magnetically equivalent and taking into account the natural abundance 4.67% of 29Si, the abundance of POSS species with none (singlet), one (doublet), and two (triplet) 29Si atoms is calculated by the binomial distribution as 68.15%, 26.79% and 4.58%, respectively. These three species constitute more then 99.5% of the total paramagnetic centres and thus their properly weighted signals reproduce accurately the relative intensities of peaks in the experimental EPR spectrum as can be seen in Fig. 2(c). A nearly Gaussian lineshape with a FWHM of 11.2 μT was used for the simulation which included convolution with a 4 μT Lorentzian peak for better fit. The obtained isotropic simulation parameters g = 2.00276(5), Aiso = 1414.3(1) MHz and |A29Si| = 4.20(2) MHz are in very good agreement with the values found for alkyl-POSS, especially with those of H@Et8Si8O12.2,8
3.2 Spin–lattice relaxation
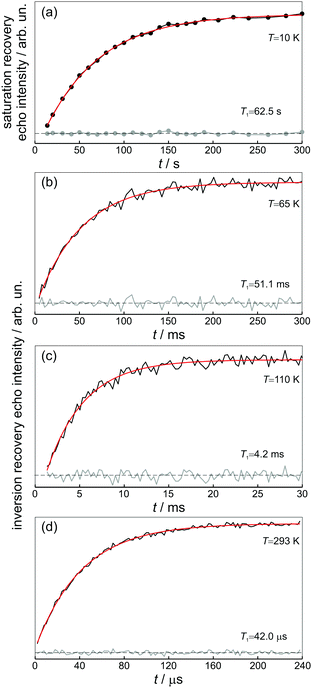
The obtained room-temperature spin–lattice relaxation time T1 = 42 μs is similar to that reported for Q8MH8 (ref. 9) and to that measured for Q8M8 in the present study. The single exponential character of T1-decay is retained over the whole temperature range as can be seen in Fig. 3. Interestingly, the value of 62.5 s measured at 10 K is – to the best of our knowledge – the longest reported T1 value for trapped hydrogen atoms.The temperature dependence of the spin–lattice relaxation rate 1/T1 is displayed in Fig. 4. From the “Raman” 1/T1vs. T log–log representation shown in Fig. 4(a) it is evident that more than one relaxation processes exist. At both low and high temperatures the relaxation rate obeys a T3 dependence, whereas, for intermediate temperatures 70 K < T < 150 K a stronger T5 dependence is observed. This result suggests that apart from the usual two-phonon Raman process (scaling as T2 at the high-temperature limit), there is at least one additional process that is characterized by a stronger than T2 dependence at high temperatures, namely Orbach, local-mode, or thermally activated process.16
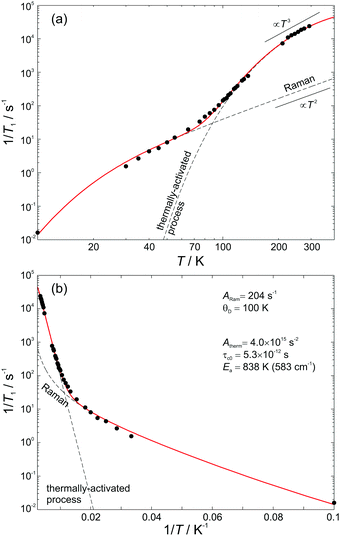 | ||
| Fig. 4 Temperature dependence of the spin–lattice relaxation rate and the fitting curve using eqn (1). The dashed lines are the Raman and thermally activated contributions to the total relaxation rate. (a) “Raman” and (b) “Orbach” representation with the fitting parameters. | ||
Following the arguments of our previous work on Q8MH8,9 we modelled the present data with a sum of Raman and thermally activated processes given by
 | (1) |
 | (2) |
![[thin space (1/6-em)]](https://www.rsc.org/images/entities/char_2009.gif) exp(Ea/kBT), Ea is the activation energy, τc0 is the preexponential factor, and ω is the EPR frequency. The fitting curve with the parameters shown in Fig. 4 is in good agreement with experimental points.
exp(Ea/kBT), Ea is the activation energy, τc0 is the preexponential factor, and ω is the EPR frequency. The fitting curve with the parameters shown in Fig. 4 is in good agreement with experimental points.
On the other hand, from the Orbach 1/T1vs. 1/T semi-log representation shown in Fig. 4(b), one could also assume the presence of two Orbach processes (1/T1 ∝ Δ3/(eΔ/T − 1)) with 73 K (6.3 meV) and Δ2 = 811 K (69.9 meV) at the low and high temperature limits, respectively. However, given that such low-lying excited electronic states do not exist in atomic hydrogen, we may conclude that the Orbach process is rather unlikely and that the low temperature data can be best described by a Raman process with θD = 100 K.
For the high temperature data, a clear decision between a thermally activated and a local process cannot be made because these two processes exhibit similar 1/T1 temperature dependence for T < Ea (or T < Δloc). Measurements at higher microwave frequencies could help to distinguish between the two because for the thermally activated process the relaxation rate decreases at sufficiently high EPR frequency, ω. However, a previous study on H@Et8Si8O127 showed that 1/T1 was slightly increased when measurements were performed at high-field EPR, a situation compatible with the field dependence of the Raman process.17 This result indicates that the disentanglement of T1 processes may be more complex. Nevertheless, on the basis of our previous analysis9 we model the high-temperature spin–lattice relaxation data as a thermally-activated rather than a local mode process. This is because a local mode process will have a finite probability if the local-mode energy Δloc is less than twice the Debye temperature.18 Considering an experimentally determined Δloc = 811 K, which is related to the high-temperature activation energy, it is obvious that a local mode process is inconsistent with the previous Raman analysis and θD = 100 K. Interestingly, the obtained activation energy Ea = 583 cm−1 is close to the strong infrared absorption observed at 566 cm−1 that is assigned to deformation vibrations d(O–Si–O) and δ(Si–C![[double bond, length as m-dash]](https://www.rsc.org/images/entities/char_e001.gif) C).14
C).14
It should be noted that, contrary to previous results, where T1 was found to depend strongly on the side groups R and to expand with their size,8 the similarity of the room-temperature T1 value of 42 μs observed for the three POSS derivatives in our present study indicates a modest dependence of T1 on the type of the organic substituent R. This implies that the spin–lattice relaxation is mainly determined by the dynamics of the core cage, Si8O12. On the other hand, as will be shown in the following section, TM depends strongly on the choice of side groups R and this property could be the key for controlling the electron spin coherence of H@POSS.
3.3 Spin–spin relaxation
The transverse electron spin relaxation time, T2, is probed through the two-pulse sequence shown in Fig. 5. Decay traces measured at different temperatures show typical stretched-exponential behaviour that can be fitted with | (3) |
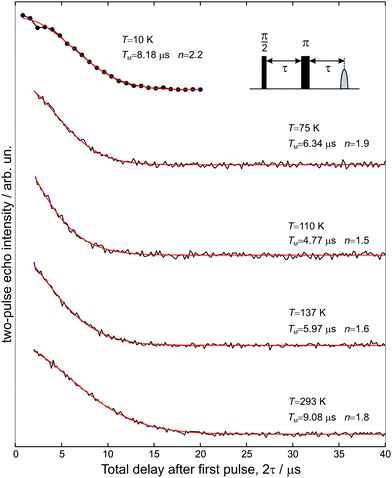 | ||
| Fig. 5 Two-pulse electron spin echo decays measured at five different temperatures as a function of 2τ, and the superimposed stretched exponential fits using eqn (3). | ||
The room-temperature phase memory time of H@(CH2CH)8Si8O12, TM = 9.1 μs, is similar to that observed previously for alkyl derivatives8 but smaller than TM = 14 μs found for H@Q8MH8 (ref. 9) and H@Q8M8.11 This result provides strong evidence that different characteristics of R like electronegativity, number of hydrogen atoms and their proximity to the trapped hydrogen are key factors that determine TM at ambient temperature. Species with larger R group electronegativity, χGroup, exhibit smaller spin delocalization and, therefore, weaker interactions with the cage magnetic nuclei, as is evidenced by the larger Aiso and the smaller |A29Si| hyperfine coupling constants.2 Moreover, POSS derivatives bearing more distant protons in R may have different nuclear spin diffusion since the hyperfine interaction for such protons is purely dipolar and the diffusion barrier radius is strongly affected by the anisotropy of the local dipolar field.17 On the other hand, the temperature dependence of TM reveals that the dynamics of cage substituents is a crucial parameter too. For instance, Fig. 6(a) shows that for the two species H@Q8MH8 and H@Q8M8TM exhibits quite different temperature dependence within the range 50 K < T < 200 K, whereas, for T > 200 K they are identical. This result supports our previous assignment of the low-temperature relaxation enhancement to the rotation of methyl groups and clearly shows that small changes in the rotation dynamics of R (OSi(CH3)2H vs. OSi(CH3)3) can have important impact on the electron spin relaxation properties.
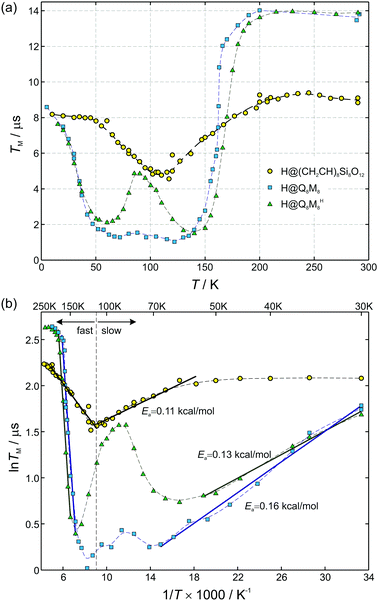 | ||
| Fig. 6 (a) Temperature dependence of phase memory times TM for three different POSS derivatives: (CH2CH)8Si8O12 (circles), Q8M8 (squares), and Q8MH8 (triangles, modified with permission from ref. 9, copyright © the Owner Societies 2012). Dashed curves connect data points. (b) Data in the lnTMvs. 1/T representation. Straight lines are fits with Arrhenius equation for the case of slow (T < 110 K) and fast (T > 110 K) motional limit, respectively. The fitting parameters for the fast motional limit are Ea = 0.31 kcal mol−1 for (CH2CH)8Si8O12, Ea = 3.4 kcal mol−1 for Q8M8, and Ea = 3.6 kcal mol−1 for Q8MH8. | ||
The case of H@(CH2CH)8Si8O12 shows clear differences compared to H@Q8MH8 and H@Q8M8. First, the temperature range of TM shortening is narrower and, second, the percentage reduction of the room-temperature TM value is smaller. Moreover, the minimum value of TM = 5 μs observed at T = 110 K is about five times longer than the corresponding value of H@Q8M8.
The temperature dependence of TM shown in Fig. 6(a) can be analyzed in terms of the rotation of methyl groups acting as a dynamic process that averages inequivalent environments. The physical motion of a methyl proton between two sites that have different resonance frequencies ω1 and ω2 due to the different hyperfine interactions with the unpaired electron, can modulate the EPR frequency of the paramagnetic centre and thus contribute to electron spin dephasing. The effect is similar to the classic two site exchange phenomenon and has been treated theoretically for the case of secular hyperfine interactions.20 Assuming a correlation time τc = τc0![[thin space (1/6-em)]](https://www.rsc.org/images/entities/char_2009.gif) exp(Ea/kBT) for the jumping motion between the two sites, with Ea being the activation energy and τc0 the preexponential factor, we define the rate of process R = 1/τc and the energy difference Δ = δω/2 = (ω1 − ω2)/2. In the fast motional limit, R ≫ Δ, the echo decay is given by10
exp(Ea/kBT) for the jumping motion between the two sites, with Ea being the activation energy and τc0 the preexponential factor, we define the rate of process R = 1/τc and the energy difference Δ = δω/2 = (ω1 − ω2)/2. In the fast motional limit, R ≫ Δ, the echo decay is given by10
 | (4) |
 | (5) |
In this fast motional limit the relaxation time TM is reduced as the temperature is decreased. From the slope of the Arrhenius plot shown in Fig. 6(b) we can deduce the rotation barrier Ea/kB = 158 ± 7 K or Ea = 0.31 ± 0.01 kcal mol−1 for H@(CH2CH)8Si8O12. Interestingly, this is about an order of magnitude smaller than the value Ea = 3.4 kcal mol−1 obtained for H@Q8M8 or Ea = 3.6 kcal mol−1 found previously for H@Q8MH8.9 The latter two values are typical for activation energies of methyl group rotation as probed by nuclear magnetic resonance (NMR)21,22 or neutron scattering methods.12 The much lower value found here for H@(CH2CH)8Si8O12 implies a virtually free rotation as compared to the other two species. Given the fact that rotation about the carbon–carbon double bond is not allowed, one can assume that the rotation barrier Ea = 0.31 kcal mol−1 corresponds to reorientation of the vinyl groups around the Si–C bonds. We note here that such a free rotation is a peculiar result since any sp2 character of the vinyl Si–C bond should hinder rotation. On the other hand, a previous NMR study of (CH2CH)8Si8O12 revealed the rapid anisotropic reorientation of the vinyl groups around the Si–C bonds with a frequency higher than 100 kHz.14 Although no activation energy was reported for this dynamic process, the magnitude of rotation frequency is in line with our TM results. Assuming R = 1/τc = 100 kHz and taking Δ = 200 kHz (vide infra), eqn (5) gives TM = 5 μs which is in expellant agreement with the corresponding experimental value at T = 110 K. On the basis of this agreement and the lack of experimental Ea values from other methods, we assign the obtained Ea = 0.31 kcal mol−1 to reorientation of the vinyl groups around the Si–C bonds. The unexpected low value could be linked to steric hindrance effects also related to the solid-state phase of the samples.
In the slow motional limit, R ≪ Δ, the two-pulse echo decays with the relaxation time TM = τc which increases as the temperature is decreased. The corresponding data for H@(CH2CH)8Si8O12 in the range 55 K < T < 110 K also follow a linear relation in the ln![[thin space (1/6-em)]](https://www.rsc.org/images/entities/char_2009.gif) TMvs. 1/T representation shown in Fig. 6(b). However, the obtained rotation barrier Ea/kB = 57 ± 3 K or Ea = 0.11 ± 0.01 kcal mol−1 is considerably smaller than the corresponding one found for the fast motional limit. On the other hand, similar values for Ea were found for the other two species, indicating that the low activation energy is a common attribute of all systems in the slow motional limit despite the composition of R. The origin of this peculiarity could be the contribution of nonsecular and pseudosecular hyperfine interactions to the dephasing mechanism. Kispert et al.10 recognized that the motion of a CH2 group produces an additional effect if the effective fields at the two proton positions are not parallel; the nuclear spin will sometimes change due to the motion, in a similar manner that anisotropic hyperfine interaction mixes EPR and NMR states and gives rise to – otherwise – forbidden NMR transitions.23 Although this effect is smeared out in the fast motional limit, it can cause TM to deviate from τc in the slow motional limit as has been observed for radicals in crystals.10
TMvs. 1/T representation shown in Fig. 6(b). However, the obtained rotation barrier Ea/kB = 57 ± 3 K or Ea = 0.11 ± 0.01 kcal mol−1 is considerably smaller than the corresponding one found for the fast motional limit. On the other hand, similar values for Ea were found for the other two species, indicating that the low activation energy is a common attribute of all systems in the slow motional limit despite the composition of R. The origin of this peculiarity could be the contribution of nonsecular and pseudosecular hyperfine interactions to the dephasing mechanism. Kispert et al.10 recognized that the motion of a CH2 group produces an additional effect if the effective fields at the two proton positions are not parallel; the nuclear spin will sometimes change due to the motion, in a similar manner that anisotropic hyperfine interaction mixes EPR and NMR states and gives rise to – otherwise – forbidden NMR transitions.23 Although this effect is smeared out in the fast motional limit, it can cause TM to deviate from τc in the slow motional limit as has been observed for radicals in crystals.10
The small activation energies obtained from data measured at low temperatures may also be linked to tunneling effects of methyl groups. As a consequence of tunneling, the temperature dependence of the correlation rate τc−1 does not follow a simple Arrhenius behaviour with a single activation energy. In the high temperature limit the activation energy corresponds to the barrier height V3 minus the energy of the lowest torsional level, E0, whereas, at low temperature, the apparent activation energy is smaller and equals the energy difference between the first excited and ground torsional states, E01 = E1 − E0.24 This bi-exponential character of the correlation rate τc−1 has been experimentally observed for methyl group tunneling by NMR and inelastic neutron scattering (INS) techniques,25,26 and is in line with the two different activation energies obtained for H@(CH2CH)8Si8O12, namely Ea = 0.31 kcal mol−1 and Ea = 0.11 kcal mol−1 at high and low temperature, respectively.
Apart from the significant discrepancy between the activation energies of H@(CH2CH)8Si8O12 and Q8M8 derivatives (H@Q8MH8 and H@Q8M8) in the fast motional limit, a noteworthy difference concerns the minimum observed TM value occurring at coalescence, i.e. when R = Δ. In this limit, the slow motional formula TM = τc gives Δ ≈ TM−1 from which the values Δ ≈ 200 kHz and Δ ≈ 1 MHz can be inferred for H@(CH2CH)8Si8O12 and H@Q8M8, respectively. The much smaller anisotropic averaged splitting Δ found for H@(CH2CH)8Si8O12 reflects the reduced rotational modes of the organic substituent R, namely the reorientation of the vinyl groups around the Si–C bonds, in contrast to the more flexible rotation of R in the methyl-containing species, as illustrated in Fig. 7. Clearly, this result shows that the rotational dynamics of the peripheral organic groups of the cage play a key role in the determination of the electron spin coherence properties of the encapsulated hydrogen atom. Proper design of POSS cages by taking into account this new aspect would help to increase the TM of atomic hydrogen to such a level that H@POSS could rival endohedral fullerenes.
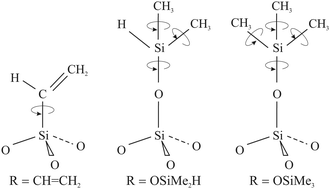 | ||
| Fig. 7 Schematic representation of the RSiO3/2 units depicting the available rotation modes for each one of the three POSS derivatives. | ||
4 Conclusions
The electron spin relaxation properties of atomic hydrogen encapsulated in (CH2CH)8Si8O12 cages were studied in detail with pulse EPR methods. The comparison with derivatives bearing different organic substituents R, namely Q8M8 and Q8MH8, showed similar T1 values for all species implying that spin–lattice relaxation is mainly determined by the dynamics of the core cage Si8O12. In contrast to this, the temperature dependence of TM revealed that electron spin coherence is very sensitive to the type of peripheral organic groups. These results showed for the first time that the rotational dynamics of R have a major impact on both the temperature dependence of TM and the minimum TM value occurring at coalescence, R = Δ. As nuclear spin diffusion is the leading dephasing mechanism in proton-containing ligands, deuterium isotopic substitution seems to be an obvious approach to increase TM. Our present work identified the rotational degrees of freedom of the cage substituents as a new key factor that affects electron spin coherence times, and therefore, should also be taken into account in the design of H@POSS species for quantum computing applications. We anticipate that this combination could result in molecular spin systems with unprecedented large TM values and also shed light into other decoherence mechanisms that are typically masked by nuclear spin diffusion.Conflicts of interest
There are no conflicts to declare.Acknowledgements
We acknowledge support of this work by the project MIS 5002567, implemented under the “Action for the Strategic Development on the Research and Technological Sector”, funded by the Operational Programme “Competitiveness, Entrepreneurship and Innovation” (NSRF 2014–2020) and co-financed by Greece and the European Union (European Regional Development Fund).Notes and references
- R. Sasamori, Y. Okaue, T. Isobe and Y. Matsuda, Science, 1994, 265, 1691–1693 CrossRef CAS PubMed.
- M. Paech and R. Stoesser, J. Phys. Chem. A, 1997, 101, 8360–8365 CrossRef CAS.
- H. Dilger, E. Roduner, R. Scheuermann, J. Major, M. Schefzik, R. Stoesser, M. Paech and D. G. Fleming, Physica B, 2000, 289–290, 482–486 CrossRef.
- B. Gross, H. Dilger, R. Scheuermann, M. Paech and E. Roduner, J. Phys. Chem. A, 2001, 105, 10012–10017 CrossRef CAS.
- M. Kaupp, J. Asher, A. Arbuznikov and A. Patrakov, Phys. Chem. Chem. Phys., 2002, 4, 5458–5466 RSC.
- W. Harneit, in Spin Quantum Computing with Endohedral Fullerenes, ed. A. A. Popov, Springer International Publishing, Cham, 2017, pp. 297–324 Search PubMed.
- N. Weiden, M. Paech and K. Dinse, Appl. Magn. Reson., 2001, 21, 507–516 CrossRef CAS.
- R. S. Schoenfeld, W. Harneit and M. Paech, Phys. Status Solidi B, 2006, 243, 3008–3012 CrossRef CAS.
- G. Mitrikas, Phys. Chem. Chem. Phys., 2012, 14, 3782–3790 RSC.
- L. D. Kispert, M. K. Bowman, J. R. Norris and M. S. Brown, J. Chem. Phys., 1982, 76, 26–30 CrossRef CAS.
- G. Mitrikas, E. K. Efthimiadou and G. Kordas, Phys. Chem. Chem. Phys., 2014, 16, 2378–2383 RSC.
- N. Jalarvo, O. Gourdon, G. Ehlers, M. Tyagi, S. K. Kumar, K. D. Dobbs, R. J. Smalley, W. E. Guise, A. Ramirez-Cuesta, C. Wildgruber and M. K. Crawford, J. Phys. Chem. C, 2014, 118, 5579–5592 CrossRef CAS.
- P. G. Harrison and C. Hall, Main Group Met. Chem., 1997, 20, 515–529 CAS.
- C. Bonhomme, P. Tolédano, J. Maquet, J. Livage and L. Bonhomme-Coury, J. Chem. Soc., Dalton Trans., 1997, 1617–1626 RSC.
- S. Stoll and A. Schweiger, J. Magn. Reson., 2006, 178, 42–55 CrossRef CAS PubMed.
- S. S. Eaton and G. R. Eaton, eMagRes, 2016, 5, 1543–1556 CAS.
- S. S. Eaton and G. R. Eaton, Biological Magnetic Resonance, in Distance Measurements in Biological Systems by EPR, ed. L. J. Berliner, G. R. Eaton and S. S. Eaton, Springer US, 2000, vol. 19, pp. 29–154 Search PubMed.
- D. W. Feldman, J. G. Castle and J. Murphy, Phys. Rev., 1965, 138, A1208–A1216 CrossRef.
- I. M. Brown, in Time Domain Electron Spin Resonance, ed. L. Kevan and R. N. Schwartz, Wiley, New York, 1979, ch. 6, p. 201 Search PubMed.
- G. M. Zhidomirov and K. M. Salikhov, Sov. Phys. JETP-USSR, 1969, 29, 1037–1040 Search PubMed.
- J. B. Lambert, R. J. Nienhuis and J. W. Keepers, Angew. Chem., Int. Ed. Engl., 1981, 20, 487–500 CrossRef.
- P. A. Beckmann, C. W. Mallory, F. B. Mallory, A. L. Rheingold and X. Wang, ChemPhysChem, 2015, 16, 1509–1519 CrossRef CAS PubMed.
- A. Schweiger and G. Jeschke, Principles of Pulse Electron Paramagnetic Resonance, Oxford Univ. Press, New York, 2001 Search PubMed.
- A. Horsewill, Prog. Nucl. Magn. Reson. Spectrosc., 1999, 35, 359–389 CrossRef CAS.
- W. Müller-Warmuth, R. Schüler, M. Prager and A. Kollmar, J. Chem. Phys., 1978, 69, 2382–2392 CrossRef.
- M. V. Cleemput, A. Buekenhoudt, L. V. Gerven and A. J. Horsewill, J. Chem. Phys., 1995, 103, 2787–2794 CrossRef.
| This journal is © the Owner Societies 2020 |

