 Open Access Article
Polarization-dependent vibrational shifts on dielectric substrates†
C.
Yang
ab,
W.
Wang
b,
A.
Nefedov
 b,
Y.
Wang
 b,
T. G.
Mayerhöfer
 *cd and
C.
Wöll
 *b
*b
aBeijing Key Laboratory of Bio-inspired Energy Materials and Devices, School of Space and Environment, Beihang University, Beijing, 100191, China
bInstitute of Functional Interfaces (IFG), Karlsruhe Institute of Technology (KIT), 76344 Eggenstein-Leopoldshafen, Germany. E-mail: christof.woell@kit.edu
cLeibniz Institute of Photonic Technology (IPHT), Albert-Einstein-Str. 9, D-07745 Jena, Germany. E-mail: thomas.mayerhoefer@uni-jena.de
dInstitute of Physical Chemistry, and Abbe Center of Photonics, Friedrich Schiller University, Helmholtzweg 4, Jena D-07743, Germany
First published on 9th July 2020
Abstract
The interaction of light with matter at surfaces of dielectrics strongly depends on polarization. Here, we present the first infrared spectroscopic evidence for significant polarization effects in the spectroscopic detection of adsorbate vibrational frequencies. In addition to much larger peak intensities for p-polarized light relative to s-polarization, a small but distinct blue shift was identified for CO adsorbed at the surfaces of two prototype dielectric substrates, CeO2(111) and CaCO3(10.4). A simulation using a layer model yields very good agreement with experiment.
Infrared spectroscopy is a standard method to probe vibrational excitations of molecules. In the context of Surface Science, Infrared Reflection Absorption Spectroscopy, IRRAS, has been developed into one of the most important techniques to monitor chemical processes occurring at gas-solid interfaces.1 The large reflectivity of metals for light in the infrared regime has made an application of this method rather straightforward, and in case of carbon monoxide, the most simple IR-active diatomic, spectra for species adsorbed on metal surfaces have already been reported in 1972.2 For dielectrics the reflectivity in the IR regime is extremely low and, in contrast to metals, such spectra have not become available until recently, when IRRAS data for CO/ZnO and CO/TiO2 were reported. The pronounced experimental problems related to recording IR-spectra in a reflection geometry for dielectric substrates result from the optical properties of dielectrics. Here, the reflectivity change due to the presence of the adsorbate is so low that the experimental detection is a challenge. Only recently these technical difficulties have been overcome3 and a number of groups have reported IR spectra recorded in reflection for dielectric substrates.4,5
The effective screening of the electric field by the conduction electrons, the main reason for the high reflectivity of p-polarized light on metals, also prohibits recording of data with s-polarized light – this component of the electric field oriented parallel to the substrate surface is virtually completely screened, giving rise to the so-called surface selection rule stating that only vibrations with a component of the transition dipole moment oriented perpendicular to the surface can be observed in IRRAS applied to metals.6,7 This situation is different on dielectrics – on such insulating substrates, the use of s-polarized light to record spectra becomes possible, due to the absence of image dipoles.
IRRAS data recorded with s- and p-polarized light for CO adsorbed on the well-ordered, single-crystalline surfaces of CaCO3(10.4) and CeO2(111) are shown in Fig. 1(a) and (b), respectively. Experiments were carried out in ultrahigh vacuum (UHV) using a dedicated apparatus described in previous work.3 The (111) oriented ceria substrate had the shape of a disc, with a diameter of about 8 mm and a thickness of 1 mm. Prior to the IRRAS experiments, the surface was prepared using standard procedures and then carefully characterized using low-energy electron diffraction and x-ray photoelectron spectroscopy. Calcite single crystal blocks (8 × 8 × 12 mm3) with optical quality were purchased from Korth Kristalle GmbH (Altenholz (Kiel), Germany). The blocks were cut into small pieces in the normal atmosphere before fixed to the sample holder. After the single crystals were introduced into the UHV system, they were cleaved with a scalpel blade attached at the termination of the wobble stick, as described in previous work.8 Then the freshly cleaved (10.4)-oriented calcite single crystal was transferred to the IRRAS chamber with a base pressure of 8.0 × 10⁻¹¹ mbar. IRRAS data were recorded using a state-of-the-art vacuum Fourier-transform IR spectrometer (Vertex 80v, Bruker). All spectra shown are difference spectra obtained by subtracting a reference spectrum recorded immediately before adsorption of CO at 65 ± 3 K (cooling with liquid He).
In the spectra shown in Fig. 1, the CO stretch vibration appears as a negative band for both polarizations, i.e. the reflectivity of the CO-covered dielectric substrates increases at the position of the vibrational band. The occurrence of such negative bands in IRRAS data recorded for dielectrics is a well-known phenomenon.1
While for s-polarized incident radiation an increase of reflectivity at the position of the vibrational band is observed in all cases, for p-polarized light the situation depends on the incidence angle and the optical constant of the dielectric.5 For example, on TiO2 even a change of sign of vibrational bands could be observed when modifying the optical constant of the substrate by vacancy doping.9
Importantly, the CO vibrational band observed in the p-polarized spectrum is blue-shifted with respect to the s-polarized band by 4 cm−1 for ceria and by 3.8 cm−1 for calcite. In addition, the change in absorbance (−lg(R/R0)) caused by the excitation of the molecular vibration is substantially stronger, by about an order of magnitude, than in spectra recorded for s-polarization.
To our knowledge, experimental data for such frequency shifts between IR-spectra recorded using different polarizations have not yet been discussed. For monolayers of CO adsorbed on MgO(100) only one single peak could be detected at 2150.5 cm−1 in p-polarized transmission spectra above 45 K, and an additional doublet at 2137.5 and 2132.5 cm−1 observed on MgO(100) below 45 K, the latter of which is also detected with s-polarization, was attributed to a Davydov-splitting (three CO molecules in the adsorbate unit cell).10
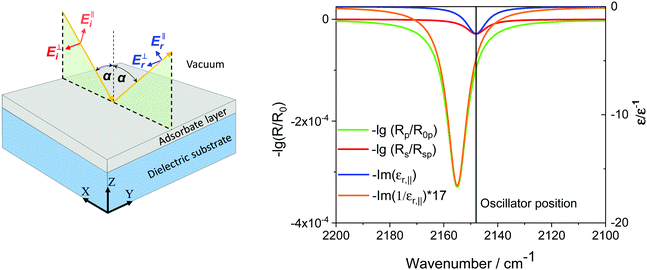
Below we analyze the somewhat counterintuitive experimental observation that different frequencies observed for s- and p-polarized light using a model (see Fig. 2) where the adsorbate layer is sandwiched between two semi-infinite media, vacuum and the dielectric substrate.
 | ||
| Fig. 2 Comparison of −lg(Rs/R0s) with −Im(εj,‖) and of −lg(Rp/R0p) with Im(εj,‖) for α = 80°. The inset shows the 3-layer model (see text) used to simulate the experimental data. | ||
In the s-polarized case, the situation is rather simple, the electric field has to be continuous when going from the vacuum through the adsorbed layer and then into the dielectric bulk. Accordingly, the reflectivity of s-polarized light is given by the maximum of the imaginary part of the dielectric function, Im(εj,‖).
In case of p-polarized light, two components have to be considered, the component Ep,t oriented along the surface, and Ep,v oriented vertical to the surface (see Fig. 1d). While Ep,t also has to show a continuous transition through the three layers, for Ep,v the presence of the surface causes a discontinuity. As a result, in this case the position of the vibrational band is given by the maximum of the negative imaginary part of the inverse of the dielectric function, −Im(1/εj,‖) for higher angles of incidence. A plot of the different parts of the dielectric function obtained by using the model developed by Piro11 is provided in Fig. 2 (for more details see below).
Generally, the maximum of the imaginary part of the dielectric function (which, in the absence of local field effects, coincides with the oscillator frequency, ω0) is different from the maximum of the negative imaginary part of the inverse of the dielectric function and, as a result, shifts of vibrational bands recorded with p-polarized light away from ω0 should occur.12–14 This p-shift is similar to that observed for much thicker dielectric films on dielectric substrates in the context of the so-called Berreman effect, where the existence of a peak at −Im(1/εj,‖) is brought into connection with LO phonons.15
Unfortunately, from the viewpoint of a treatment of the IR spectra in the context of the Beer–Lambert law, no analytical expressions are available to predict this frequency shift of p-polarized spectra relative to s-polarized data. However, in the past powerful simulation methods have been developed, which allow computing the optical properties of dielectric surfaces in some detail. Indeed, the p-shifts discussed above are observed independent of the optical model, e.g. a semi-infinite medium (a strong absorbing material), a thin freestanding film or a film on a thick substrate.12,13 For all these models, the reflectance can be calculated by applying the same matrix formalisms,16,17 which can also account for anisotropic substrates or layers.
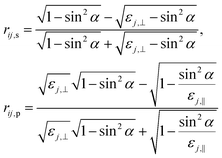
In the following, we will consider the case relevant for the materials for which data are shown in Fig. 2, i.e. an optically uniaxial dielectric material with the dielectric axes oriented either parallel or perpendicular to the surface. In the first case, a signal is obtained only for p-polarized light and a non-zero angle of incidence, in the second only for s-polarized light. To simulate these situations, we use the layer model, with label i denoting vacuum, j the adsorbate layer, and sub the dielectric substrate. For this case, the matrix formalism yields the following entries for the reflection coefficient rab for light incident from a vacuum on the surface16,17 (for more information about the formalism and the calculation of Rs and Rp, see ESI†):
 | (1) |
In the case of a molecular adsorbate with a stretch frequency ![[small nu, Greek, tilde]](https://www.rsc.org/images/entities/i_char_e0e1.gif) 0, a damping constant γ and an oscillator strength S to illustrate these findings, we assume a single oscillator, oriented along the CO axis (the “c-axis”) at
0, a damping constant γ and an oscillator strength S to illustrate these findings, we assume a single oscillator, oriented along the CO axis (the “c-axis”) at ![[small nu, Greek, tilde]](https://www.rsc.org/images/entities/char_e0e1.gif) 0 = 2149 cm−1, a damping constant γ = 10 cm−1, an oscillator strength S = 275 cm−1 the expression for the dielectric function is
0 = 2149 cm−1, a damping constant γ = 10 cm−1, an oscillator strength S = 275 cm−1 the expression for the dielectric function is
 | (2) |
For εj,a and εj,b, the principal dielectric functions perpendicular to the main (c-)axis, we assume that it is constant in the spectral region of interest and has a (constant) value εj,a == ε∞,j,a = εj,b == ε∞,j,b = 1.6.
Clearly, the maximum of the imaginary part of εj,c is located at ![[small nu, Greek, tilde]](https://www.rsc.org/images/entities/i_char_e0e1.gif) 0 for s-polarized light, whereas the maximum of the negative imaginary part of −1/εj,c is located at
0 for s-polarized light, whereas the maximum of the negative imaginary part of −1/εj,c is located at  ,18,19 exhibiting a distinct blue shift:
 | (3) |
The size of the p-shift thus depends on oscillator strength and the dielectric background, which we fixed at ε∞,j,c = 2.2. The dielectric constants ε∞,j,a = ε∞,j,b and ε∞,j,c (“dielectric background”) are equal to the squares of the principal indices of refractions, which are nearly constant in the optically transparent regime. A layer thickness of 4 pm was used for the simulation. In addition, we assume an isotropic substrate with a dielectric background of εsub == ε∞,sub =5.31, resembling the dielectric constant of ceria.
From the comparison in Fig. 2 it is obvious that at high angles of incidence (α = 80°), s-polarized absorbance displays a band with a minimum at the oscillator position when the c-axis is oriented parallel to the interface, while p-polarized reflectance shows a band with a position similar to the band in the negative dielectric loss spectrum (−Im(1/εj,‖)) if the c-axis is oriented perpendicular to the interface.
For describing the experimental data shown in Fig. 1 and the forward calculation in Fig. 3, we consider a CO molecule adsorbed in a perpendicular geometry on the corresponding substrate.
 | ||
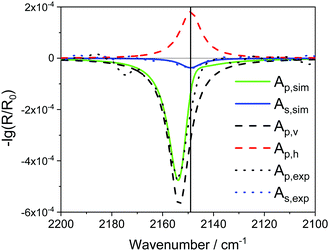
| Fig. 3 Comparison of As,sim = −lg(Rs/R0s) with Ap,sim = −lg(Rp/R0p) (solid lines) and the horizontal and vertical components Ap,h and Ap,v of −lg(Rp/R0p). Experimental data for CO/CeO2(111) As,exp and Ap,exp are shown as points (same data as in Fig. 1b). | ||
We focus on the ceria substrate (assuming its dielectric background εsub = 5.31), for calcite the situation will be slightly different. The different dielectric background of the calcite substrate would alter the overall intensities slightly. The dielectric background of calcite is (ignoring anisotropy) about half of that of CeO2, and accordingly the s-polarized absorbance would be about four times higher while the p-polarized absorbance would be reduced to 50%. Although for the ceria (111) substrate theoretical results suggest an orientation of the molecular axis perpendicular to the surface,20 thermal occupation of the frustrated rotations of the molecule will yield a so-called dynamic tilt angle. As a result, the transition dipole moment of the vibration effectively shows components both perpendicular and parallel to the surface. In the following, we assume that this dynamic tilt angle amounts to 46° (on calcite, the larger ratio of the p- and s-polarized absorbance suggest a smaller tilt angle of about 20°). The azimuthal direction of this tilt angle is assumed to be random.
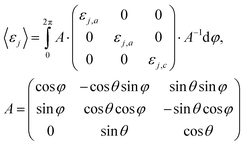
We used a matrix approach, with which we calculate an averaged dielectric tensor according to,
What results is an effective medium, which is still optically uniaxial and whose optical axis is oriented perpendicular to the interface, so that all preceding considerations concerning the band shift are still valid. The only difference is that due to the polar angle θ being different from 0°, the calculated shift for parallel polarization is now somewhat smaller and the corresponding band appears at lower wavenumbers than the extremum of the dielectric loss function. The correspondingly calculated spectra are displayed in Fig. 3, where we set 〈εj〉a = εj,⊥ and 〈εj〉c = εj,‖ in eqn (1).
From the comparison, we see that the experimental data can be well reproduced by the simulations. For the parameters described above we obtain a change in absorbance occurring in s-polarized light, which is a factor of about 1/12 weaker than in the p-polarized cases. In this respect we want to emphasize that the model used in this work is certainly a simplification, since the real polarization state and the change of the electric fields at the surface of a crystal to which a monolayer of a diatomic molecule is bound can only be approximated by the used macroscopic layer model. An extension to better describe this situation is the so-called d-parameter description, which has also been discussed in detail for a C![[double bond, length as m-dash]](https://www.rsc.org/images/entities/char_e001.gif) O monolayer on NaCl.22 The d-parameter description is a linear expansion of the reflection coefficient which is proportional to the cosine of the angle of incidence.22 Due to the high incidence angle we use, the effect of the correction term would be small, which is why we neglected it. In any case, the correction has an effect mainly on the intensity. The band position, and in particular the fact that a small but distinct blue shift is predicted, is seemingly not affected.
O monolayer on NaCl.22 The d-parameter description is a linear expansion of the reflection coefficient which is proportional to the cosine of the angle of incidence.22 Due to the high incidence angle we use, the effect of the correction term would be small, which is why we neglected it. In any case, the correction has an effect mainly on the intensity. The band position, and in particular the fact that a small but distinct blue shift is predicted, is seemingly not affected.
To summarize, the main differences between the CO binding on cerium(IV) oxide and calcite are, aside from binding strength represented in different CO stretch frequencies, the somewhat smaller damping constant and a smaller dynamic tilt angle. What seems to stay approximately constant is the oscillator strength and ε∞,j,c, which determine the blue shift of the p-polarized absorbance.
In conclusion, our experimental polarization-resolved IRRAS data recorded for CO adsorbed on two different dielectric surfaces, ceria and calcite, provide direct evidence that the CO vibrational band positions differ between spectra recorded in s- and p-polarization. In the context of a theoretical analysis using a layer model we propose that these findings are related to the discontinuity of the E-field component oriented vertical to the dielectric/vacuum interface, leading to a blue-shift when using p-polarized light.
Conflicts of interest
There are no conflicts to declare.Acknowledgements
W. W. is grateful for a Postdoc fellowship donated by the Helmholtz and China Postdoctoral Council (OCPC). CWY acknowledges financial support from National Natural Science Foundation of China (21902005).References
- Y. J. Chabal, Surface infrared spectroscopy, Surf. Sci. Rep., 1988, 8, 211–357 CrossRef CAS.
- J. Pritchard, Chemisorption on Copper, J. Vac. Sci. Technol., 1972, 9, 895–900 CrossRef CAS.
- C. Yang and C. Wöll, IR spectroscopy applied to metal oxide surfaces: adsorbate vibrations and beyond, Adv. Phys.: X, 2017, 2, 373–408 CAS.
- C. Wöll, Structure and Chemical Properties of Oxide Nanoparticles Determined by Surface-Ligand IR Spectroscopy, ACS Catal., 2020, 10, 168–176 CrossRef.
- Y. Wang and C. Wöll, IR spectroscopic investigations of chemical and photochemical reactions on metal oxides: bridging the materials gap, Chem. Soc. Rev., 2017, 46, 1875–1932 RSC.
- R. G. Greenler, Infrared Study of Adsorbed Molecules on Metal Surfaces by Reflection Techniques, J. Chem. Phys., 1966, 44, 310–315 CrossRef CAS.
- R. G. Greenler, D. R. Snider, D. Witt and R. S. Sorbello, The metal-surface selection rule for infrared spectra of molecules adsorbed on small metal particles, Surf. Sci., 1982, 118, 415–428 CrossRef CAS.
- S. Rode, N. Oyabu, K. Kobayashi, H. Yamada and A. Kuhnle, True Atomic-Resolution Imaging of (10(1)over-bar4) Calcite in Aqueous Solution by Frequency Modulation Atomic Force Microscopy, Langmuir, 2009, 25, 2850–2853 CrossRef CAS PubMed.
- M. Xu, Y. Gao, Y. Wang and C. Wöll, Monitoring electronic structure changes of TiO2(110) via sign reversal of adsorbate vibrational bands, Phys. Chem. Chem. Phys., 2010, 12, 3649–3652 RSC.
- J. Heidberg, M. Kandel, D. Meine and U. Wildt, The monolayer CO adsorbed on MgO(100) detected by polarization infrared spectroscopy, Surf. Sci., 1995, 331–333, 1467–1472 CrossRef CAS.
- O. E. Piro, Optical-properties, reflectance, and transmittance of anisotropic absorbing crystal plates, Phys. Rev. B: Condens. Matter Mater. Phys., 1987, 36, 3427–3435 CrossRef PubMed.
- T. Mayerhöfer, S. Weber and J. Popp, Dispersion analysis of perpendicular modes in anisotropic crystals and layers, J. Opt. Soc. Am. A, 2011, 28, 2428–2435 CrossRef PubMed.
- T. G. Mayerhöfer, V. Ivanovski and J. Popp, Dispersion analysis with inverse dielectric function modelling, Spectrochim. Acta, Part A, 2016, 168, 212–217 CrossRef PubMed.
- T. Mayerhöfer, S. Höfer, V. Ivanovski and J. Popp, Understanding longitudinal optical oscillator strengths and mode order, 2019, arXiv e-prints.
- D. W. Berreman, Infrared absorption at longitudinal optic frequency in cubic crystal films, Phys. Rev., 1963, 130, 2193–2198 CrossRef CAS.
- E. Centurioni, Generalized matrix method for calculation of internal light energy flux in mixed coherent and incoherent multilayers, Appl. Opt., 2006, 44, 7532–7539 CrossRef PubMed.
- T. G. Mayerhöfer and J. Popp, Modelling IR spectra of polycrystalline materials in the large crystallites limit—quantitative determination of orientation, J. Opt. A: Pure Appl. Opt., 2006, 8, 657–671 CrossRef.
- R. Raman, P. Mishra, A. Kapoor and R. Muralidharan, Origin of Berreman effect in GaN layers on sapphire substrates, J. Appl. Phys., 2011, 110, 053519 CrossRef.
- D. B. Tanner, Optical Effects in Solids, Cambridge University Press, Cambridge, 2019 Search PubMed.
- C. Yang, X. Yu, S. Heißler, A. Nefedov, S. Colussi, J. Llorca, A. Trovarelli, Y. Wang and C. Wöll, Surface Faceting and Reconstruction of Ceria Nanoparticles, Angew. Chem., Int. Ed., 2017, 56, 375–379 CrossRef CAS PubMed.
- T. Mayerhöfer, New Method of Modeling Infrared Spectra of Non-Cubic Single-Phase Polycrystalline Materials with Random Orientation, Appl. Spectrosc., 2002, 56, 1194–1205 CrossRef.
- W. Chen and W. L. Schaich, The optical effects of an adsorbate layer – d-parameter description of simple-models, Surf. Sci., 1989, 218, 580–602 CrossRef CAS.
Footnote |
| † Electronic supplementary information (ESI) available. See DOI: 10.1039/d0cp02399j |
| This journal is © the Owner Societies 2020 |


