
 Open Access Article
 This Open Access Article is licensed under a
 Creative Commons Attribution 3.0 Unported Licence
A new technique for determining the refractive index of ices at cryogenic temperatures†‡
James W.
Stubbing§
 a,
Martin R. S.
McCoustra
b and
Wendy A.
Brown
*a
a,
Martin R. S.
McCoustra
b and
Wendy A.
Brown
*a
aDepartment of Chemistry, School of Life Sciences, University of Sussex, Falmer, Brighton, BN1 9QJ, UK. E-mail: w.a.brown@sussex.ac.uk
bInstitute of Chemical Sciences, Heriot-Watt University, Edinburgh, EH14 4AS, UK
First published on 21st October 2020
Abstract
A reflection–absorption optical (RAO) spectrometer, operating across the ultra-violet/visible (UV/visible) wavelength region, has been developed that allows simultaneous measurements of optical properties and thickness of thin solid films at cryogenic temperatures in ultrahigh vacuum. The RAO spectrometer enables such measurements to be made after ice deposition, as opposed to most current approaches which make measurements during deposition. This allows changes in the optical properties and in the thickness of the film to be determined subsequent to thermal, photon or charged particle processing. This is not possible with current techniques. A data analysis method is presented that allows the wavelength dependent n and k values for ices to be extracted from the reflection–absorption spectra. The validity of this analysis method is shown using model data from the literature. New data are presented for the reflection UV/visible spectra of amorphous and crystalline single component ices of benzene, methyl formate and water adsorbed on a graphite surface. These data show that, for benzene and methyl formate, the crystalline ice has a larger refractive index than amorphous ice, reflecting changes in the electronic environment occurring in the ice during crystallisation. For water, the refractive index does not vary with ice phase.
Introduction
In order to understand the nature of materials in remote, extreme or production environments, observations of radiation scattering have long been employed. Encoded within the scattered radiation are details of size, shape and spectroscopy (composition) of the scattering centres. These can be interpreted using appropriate theoretical descriptions for bulk materials, thin films or granular materials. Knowledge of the optical constants of materials is fundamental to interpreting this data across the electromagnetic spectrum. However, it is especially important in the infrared and optical regions when considering dust grains and thin films growing on them in our atmosphere, throughout the solar system and in the interstellar medium.1–5 Likewise, measurements of optical constants play an important characterisation and quality assurance role in a range of fields from geology6 to the food industry7 and optical technologies.8–10 Of particular relevance to this work is the examination of optical constants of astrochemical ice analogues.11–13 Ices form on dust grains in space at low temperatures when atoms reactively accrete to form molecules and gas phase molecules accrete onto dust grains in a range of astrophysical environments.14The optical constants define how light interacts with a material. For a non-absorbing medium, the key optical constant is the refractive index, n, which is given by the ratio of the velocity of light in a vacuum to the propagation velocity of light in the material. However, this description does not take into account the absorption of light by the material. To do this, we must define the complex refractive index, m, which is given in terms of refraction and absorption coefficients, n and k respectively (eqn (1)).
| m = n + ik | (1) |
Typically, the Kramers–Kronig (KK) relationship has been used to determine ice refractive indices from experimental spectra.11,13,17–25 The KK method is a powerful tool, but several issues have recently been identified that can result in the recovery of incorrect or incomplete refractive index data.26 In particular, the KK method requires an accurate value of the ice thickness, d. This is often estimated using assumptions21,27–30 or only measured during ice deposition.11,22,23,31–35 He–Ne laser interferometry is often used to make such measurements. Fig. 1 illustrates the production of interference fringes as light is reflected from a reflective substrate supporting a thin transmissive ice film. Measuring the thickness of an ice during deposition means that the effect of post-deposition processing or particle bombardment36 on its thickness cannot be measured and therefore neither can the refractive index.26 Finally, in order to perform the KK analysis the Fresnel coefficients for transmission are required. Therefore, only ices deposited on a transmitting substrate can be examined and experimental arrangements utilising the significant sensitivity advantage of reflection–absorption on a reflective substrate are not suitable.
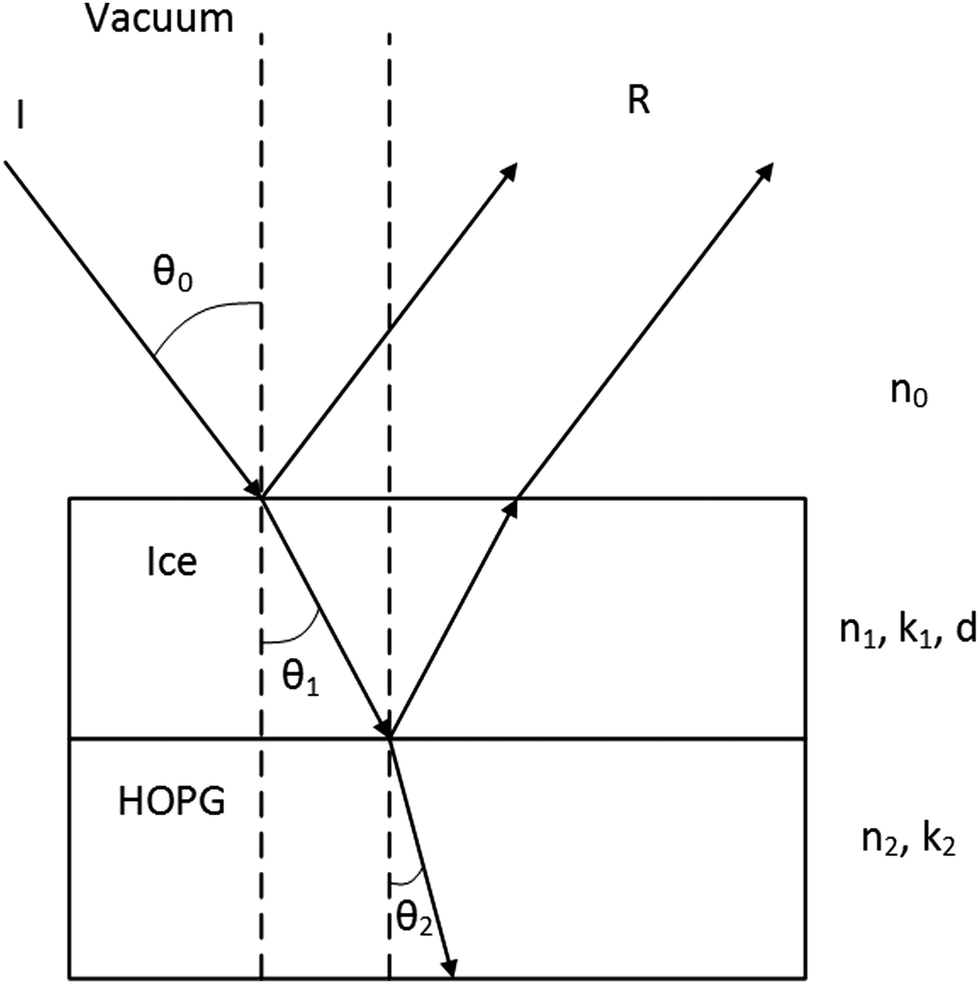 | ||
| Fig. 1 Schematic diagram illustrating the origin of interference fringes at the interface of a transmissive film (ice) and reflective substrate (highly oriented pyrolytic graphite, HOPG). I and R represent the incident and reflected beams respectively. θ0, θ1 and θ2 are the angles of incidence, refraction due to the ice and refraction due to the HOPG substrate respectively. The ice thickness is d, and n1 and k1 are the ice optical parameters. n0 is the refractive index of the vacuum, equal to 1, and n2 and k2 are the substrate optical properties. | ||
In light of the above, we have designed and developed a RAO spectroscopy apparatus to simultaneously determine the UV/visible refractive index and thickness of ices deposited on a reflective surface under ultrahigh vacuum. This apparatus has previously been demonstrated in measurements of the real part of the refractive index of amorphous benzene (C6H6) ice as a proof of concept.26 The apparatus allows n and d to be simultaneously determined ab initio and in a single experimental procedure. Additionally, as spectra are recorded after the ice has been deposited, the effect of processing can be measured.26
The work described here presents a comparison of the refractive index of amorphous and crystalline C6H6, methyl formate (CH3OCHO, MF) and water (H2O) ices and provides an explanation for the differences observed. These systems are being investigated in this work due to their relevance to astrochemistry37–41 and their contrasting optical spectroscopy. H2O is the most abundant component of interstellar, cometary and planetary ices and is optically transparent in thin films above 220 nm. C6H6 is the prototype of the (poly)cyclic aromatic hydrocarbon compound family which represents a sink for around 20% of all galactic carbon and has a characteristic UV spectroscopy dominated by excitation of π electrons. MF is readily formed by energetic processing of simple models of interstellar ices and is observed in warm pre-stellar environments. While MF absorbs in the UV, the spectra are weak in comparison to those of C6H6.
C6H6 has well-characterised surface behaviour relevant to astrochemistry42–44 and has well defined UV/visible absorption behaviour that can be used as a benchmark.45–47 In previous work,44 multilayers of C6H6 deposited on HOPG at 25 K have been shown to undergo a phase change after annealing to 90 K. This phase change was shown by changes in the reflection–absorption infrared (RAIR) spectrum of C6H6 upon annealing. Other authors have also observed this thermally induced phase change using vibrational spectroscopy methods. Jakob and Menzel48 deposited multilayers of C6H6 on Ru(001) at 53 K in its amorphous form, and observed splitting of several RAIRS bands upon annealing the ice to 127 K. Raman spectra recorded by Ishii et al. show band splitting after annealing C6H6 ices deposited at 17 K on gold coated Cu to 58 K, indicative of crystallisation.49 In the same study, X-ray diffraction measurements49 confirmed the lack of order in the initially deposited films, and showed that the annealed films were fully crystalline. Swiderek et al. used electron energy loss spectroscopy (EELS) to show that films of C6H6 deposited on Pt at 32 K gave different spectra compared to films deposited at 100 K.49 Specifically, vibronic bands assigned to the 3B1u ← 1A1g transition were sharper and shifted to higher energy loss in crystalline benzene compared to amorphous ice.50
In addition to examining the phase change itself, several authors have found that C6H6 deposited at elevated temperatures directly forms an ordered or crystalline phase. When C6H6 is deposited at 110 K on Cu(111), an initial chemisorbed layer forms, lying flat on the surface.51 Subsequently deposited C6H6 adsorbs as an almost parallel oriented physisorbed bilayer, which is followed by the growth of ordered multilayers.51 This behaviour was shown by a combination of temperature programmed desorption (TPD), high resolution EELS (HREELS) and near edge X-ray absorption fine structure (NEXAFS) measurements.51 Similar results were also observed for C6H6 deposited at 120 K on Ru(001), shown by TPD and HREELS.52 On graphite, neutron diffraction experiments suggest that an initial, flat-lying, physisorbed monolayer forms when C6H6 is deposited at 100 K, followed by the growth of crystalline multilayers.53
The effect of the benzene phase change on the electronic spectrum of C6H6 ice was recently examined in detail by Dawes et al.45 Transmission spectra were recorded in the wavelength range 115–340 nm for C6H6 deposited on a MgF2 window at 25 K. C6H6 was crystallised by annealing the ice deposited at 25 K to 90 K for 2 minutes, and subsequently several band shifts and line profile changes were observed in the spectrum.
Whilst the C6H6 phase change has previously been described spectroscopically, the effect of the phase change on the refractive index of C6H6 ices has not been examined. Indeed only one study has determined the refractive index of crystalline C6H6 ice. Romanescu et al. split the output of a HeNe laser into two beams which were then reflected off a Au substrate at different reflection angles during deposition of C6H6 at 100 K.54 The period of the resulting interference fringes, and the known reflection angles, were used to determine an n value of 1.54 ± 0.02 for the crystalline C6H6 ice.54 This is higher than the value of n = 1.43 ± 0.07 previously determined by our group for amorphous C6H6 ice.26
In addition to comparing the real parts of the refractive indices of amorphous and crystalline ices, we present a new analysis method which allows the determination of the complex refractive index m as a function of wavelength from experimental reflection–absorption spectra for an ice. No prior knowledge of the transmission Fresnel coefficients is required, in contrast to the KK analysis. Hence ices deposited on opaque surfaces can be successfully examined. The analysis method is based on the work of Kozlova et al.,55 who determined m for lithium niobite (LiNbO3) thin films and single crystals on an opaque Si substrate. This is the first time such a method has been applied to astronomically relevant molecular systems.
Experimental methodology
The data presented here were recorded using a new reflection absorption optical (RAO) spectrometer,26 attached to an ultrahigh vacuum (UHV) chamber.56 A highly oriented pyrolytic graphite (HOPG) surface is mounted in the vacuum chamber on the end of a copper cold finger, connected to a closed-cycle helium refrigerator (SHI-APD). This is used as a carbonaceous interstellar dust grain analogue surface.12,57–62 The helium refrigerator allows a base temperature of 26 K to be achieved and the typical base pressure in the chamber is ≤2 × 10⁻¹⁰ mbar. The sample is cleaned by heating to 250 K for 3 minutes, and cleanness is confirmed by the lack of any desorption, as measured by a mass spectrometer, during a heating ramp.The design and installation of the RAO apparatus has been described in detail elsewhere.26 Briefly, a UHV compatible, stainless steel lens assembly was designed which allowed UV/visible light to be fed into the chamber, reflected from the HOPG substrate and subsequently collected via fibre optic cables and analysed by a compact dispersive spectrophotometer (Ocean Optics QE Pro). This assembly is connected to a linear drive (Vacgen Ltd) which allows the angle of incidence (and hence angle of reflection) to be varied from near normal to almost grazing incidence. The range of angles of incidence achieved is 31°–68° with respect to the surface normal. Light is provided by an Ocean Optics DH-2000-S-DUV-TTL source with a spectral range of 190–900 nm.
C6H6 (Sigma-Aldrich, ≥99.9%), MF (Sigma Aldrich, anhydrous 99%) and deionised H2O were further purified prior to use by repeated freeze–pump–thaw cycles. Ices were grown on the HOPG surface by admitting vapour into the UHV chamber via a high precision leak valve. During deposition, the surface is positioned facing the leak valve outlet. Dosing in this manner (direct dosing) allows ices to be grown which are thick enough to produce interference fringes. The total exposure is reported in Langmuir, Lm, where 1Lm = 1 × 10⁻⁶ mbar s. UV/visible reflection–absorption spectra are produced by recording reflection spectra of the surface before (background spectrum, R0) and after (sample spectrum, R) dosing. The surface is rotated to face the leak valve outlet for dosing and then is returned to its original position during this procedure. The UV/visible spectra are presented in the form ΔR/R as a function of wavelength, where ΔR/R = (R − R0)/R0. This corrects for the fact that the light source intensity is not equal across the entire spectral range.63 All UV/visible spectra presented are the average of 128 scans with an integration time of 250 ms per scan. These parameters were chosen by trial and error to obtain the highest signal without saturating the CCD array detector. RAIR spectra for ices were also recorded using a Thermo-Nicolet FTIR spectrometer coupled to a liquid nitrogen cooled mercury cadmium telluride detector. RAIR spectra are the result of the co-addition of 256 scans at a resolution of 4 cm−1 and are also presented in the form of ΔR/R.
Where ices have been annealed, the ices were deposited at base temperature and subsequently heated linearly to the annealing temperature. They were held at the annealing temperature for 3 minutes before returning to base temperature and recording a UV/visible or RAIR spectrum.
Data analysis
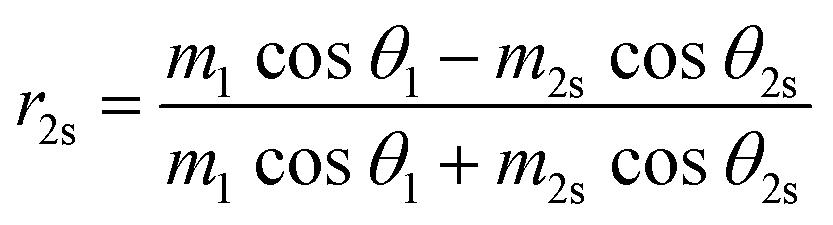
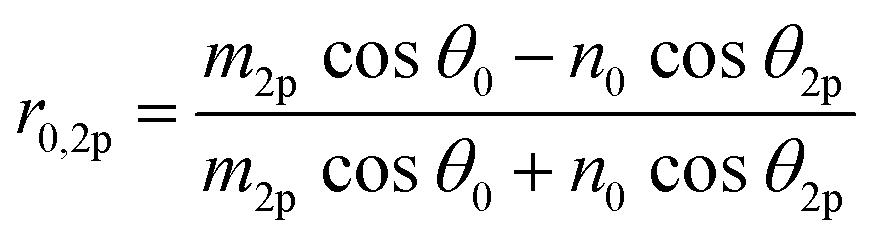
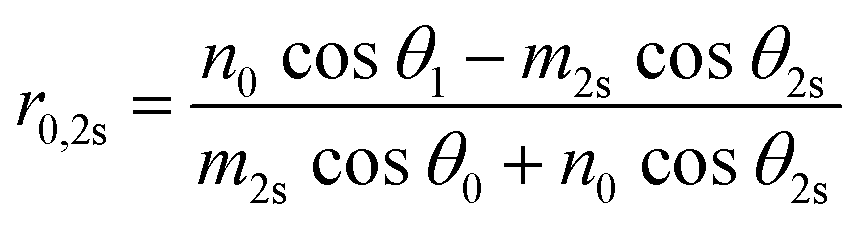
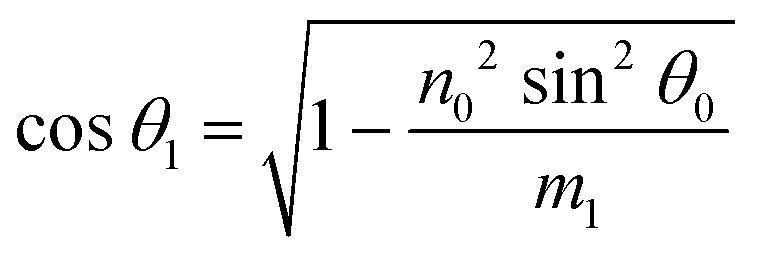
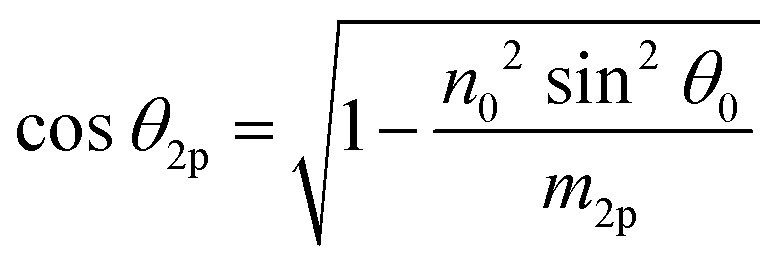
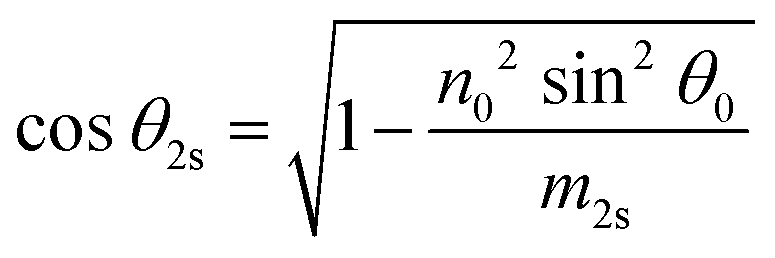
The UV/visible spectra were first analysed using a method developed by Harrick for use in the infrared,64 and adapted to our system in previous work.26 This allows the ice thickness, d, and the real part of the refractive index, n, to be determined by examining the spacing between the extrema of the interference fringes produced at different angles of incidence. Unlike previous methods, n and d are determined using a single experimental procedure, and any effect of processing the ice on these values can be examined as they are measured after the ice has been grown. Whilst this serves as a proof of concept for the apparatus and gives accurate values of n and d for the ices examined, this method does not give information about the imaginary part of the refractive index, k, nor the wavelength dependence of the complex refractive index. This is essential if the data are to be used in simulating the optical properties of ices in astronomical environments.In order to determine m as a function of wavelength for an optically opaque surface, a method was developed based on the work of Kozlova et al.55 The analysis works by taking a starting value of n, along with other parameters described below including an initial guess of k, and using these to simulate a reflectance spectrum, (ΔR/R)sim. The simulated spectrum is then compared to the experimental one, (ΔR/R)exp, and a match parameter is determined. The values of n and k are then varied until a good match between (ΔR/R)exp and (ΔR/R)sim is found. With reference to Fig. 1, the input parameters can be determined. The angle of incidence, θ0, refractive index of the vacuum, n0 (equal to 1), complex refractive index of the ice, m1 (where m1 = n1 + ik1), ice thickness, d, and the complex refractive index of the HOPG, m2 (equal to n2 + ik2) all contribute to (ΔR/R)exp. In the case of HOPG, there are two sets of optical parameters as HOPG is birefringent: one set for p-polarised light (n2p and k2p) and the second for s-polarised light (n2s and k2s) yielding complex refractive indices m2p and m2s. Both of these optical parameters must be taken into account in the analysis, as the incident light is unpolarised. In this work, the optical parameters used for HOPG are those determined by Djurišić and Li.65
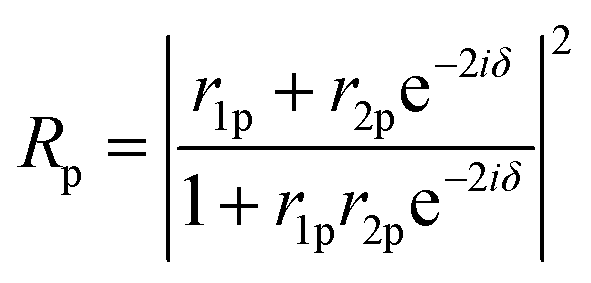
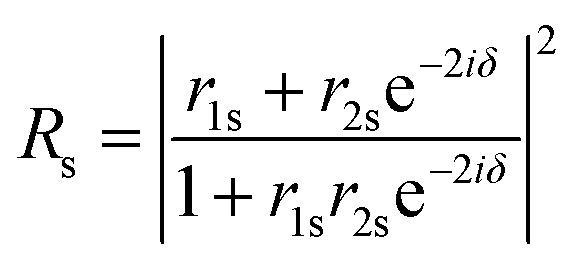
Using the parameters described, the Fresnel coefficients of reflection for s- and p-polarised light for the vacuum/ice, ice/substrate and vacuum/substrate interfaces, can be determined. These are r1p and r1s (vacuum/ice), r2p and r2s (ice/substrate) and r0,2p and r0,2s (vacuum/substrate) as given by eqn (2)–(7).16,55
 | (2) |
 | (3) |
 | (4) |
 | (5) |
 | (6) |
 | (7) |
 | (8) |
 | (9) |
 | (10) |
 | (11) |
 | (12) |
| R0p = |r0,2p|2 | (13) |
| R0s = |r0,2s|2 | (14) |
 | (15) |
| Rsim = Rp + Rs | (16) |
| R0sim = R0p + R0s | (17) |
 | (18) |
A Python code was written to perform the analysis described. The required inputs are the experimental reflection spectra at each reflection angle and the ice thickness examined, with the reflection angles and thicknesses determined using the Harrick method.26,64 Additionally, the HOPG optical parameters are necessary. The outputs of the analysis code are the determined wavelength dependent values of n1 and k1, as well as the simulated spectra for each ice thickness and reflection angle. The code can be found in the ESI,‡ Appendix E1.
In order to test the theory and the code, test data with known values of n1 and k1 were used as a benchmark. The values of n1 were those of Kofman et al.66 determined for amorphous solid water (ASW). Fig. 2 plots n as a function of wavelength determined by Kofman et al.66 The data are fitted with a polynomial function in order to determine n across the full wavelength range used in this work. It should be noted that the wavelength range has an upper limit of 591 nm due to the availability of the HOPG optical parameters.
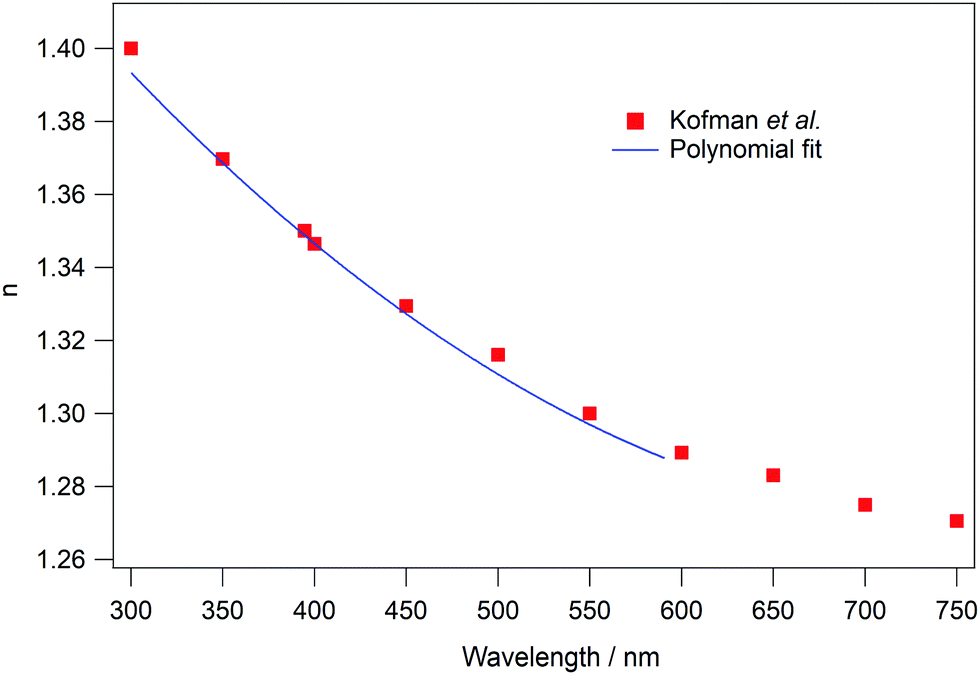 | ||
| Fig. 2 Real part of the refractive index, n, of amorphous water ice as a function of wavelength. The red squares represent the values reported by Kofman et al.66 The blue line is a fit to the data to give n across the wavelength range used to test the analysis method. | ||
Kofman et al.66 did not determine wavelength dependent values of k for ASW, therefore a constant value of 0.01 was assumed. This value was chosen, as previously reported values in the relevant wavelength region tend to be small (≪0.5) and positive for water.25,67 In any case, the specific value used is less important than the fact that it is known. The values of n and k for ASW were used to produce simulated reflection spectra using a separate Python code, shown in the ESI,‡ Appendix E2. The code takes the known values of θ, d, λ, n2s, k2s, n2p, k2p, n1 and k1 and uses eqn (2)–(17) to give simulated ΔR/R spectra. Spectra were simulated with ice thicknesses between 100 and 500 nm. An example of a simulated water spectrum is shown in Fig. 3A (blue trace) for an ASW ice thickness of 400 nm and a reflection angle of 53°.
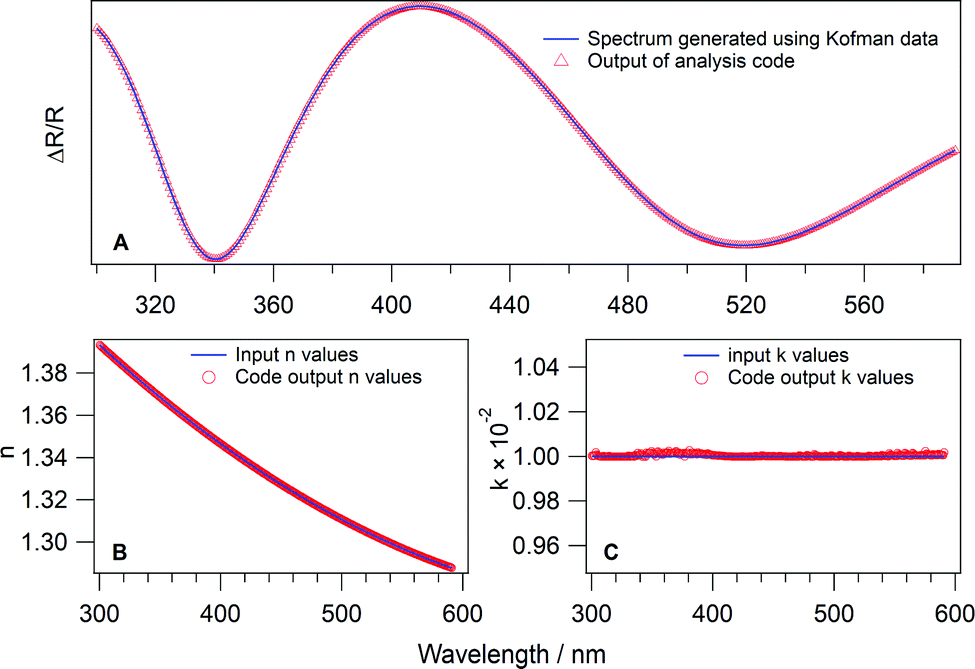 | ||
| Fig. 3 Comparison of the results of the analysis with the input values: (A) comparison of a spectrum used as an input for the analysis code (blue line) and the output spectrum (red triangles); (B) and (C) are the real and complex parts of the refractive index of water ice respectively as a function of wavelength. The blue lines are the values used to produce the input spectrum and the red empty circles are the results produced by the analysis. | ||
The simulated ASW spectra were then used as input (ΔR/R)exp data for the analysis code. Fig. 3 shows the results of the analysis. Fig. 3B and C show the calculated, wavelength dependent, values of n and k (red open circles) respectively. The input values are also shown as blue lines. Fig. 3B shows that the calculated n values from the simulated ASW spectra agree very well with those determined by Kofman et al.66 Similarly, Fig. 3C shows that the determined k values are in excellent agreement with the assumed value of 0.01, with only very small variations observed around 350 and 560 nm. In fact, the determined values of k differ from the assumed value by less than 0.05%. Fig. 3A shows that this small variation is insignificant, as the simulated spectrum matches the input spectrum very well. Clearly the data analysis method presented here works well for the analysis of UV/visible reflection–absorption spectra of ices on opaque or reflective surfaces.
Experimental results
Initially, RAIRS was used to characterise the ices grown on HOPG. Infrared spectra of C6H6,42,44,45,48,52,68,69 MF70–75 and H2O42,43,56,76–78 ices have all been recorded previously and are used as a benchmark for the spectra presented here. Fig. 4 shows several RAIR spectra of C6H6 ices. Fig. 4A shows the wavenumber region 3150–2950 cm−1 and Fig. 4B shows the region 1600–950 cm−1. The red spectrum shown in Fig. 4 is that of 500Lm of C6H6 deposited on HOPG at 27 K. At this deposition temperature, benzene is in its amorphous form.44,45 The bands in the amorphous C6H6 spectrum at 3090 cm−1 and 3032 cm−1 (Fig. 4A) and those at 1479 cm−1 and 1036 cm−1 (Fig. 4B) have been observed previously.42 They are assigned to the C–H stretch (ν(CH)aromatic), ν(CH) combination mode, aromatic C–C stretch (ν(CC)aromatic) and C–H in plane deformation (δ(CH)in-plane) mode of C6H6 respectively.68,69,79 In addition to these bands, several other features are observed in the spectra, which can be assigned by comparison with the literature.48,52,68,69,79 The band at 3068 cm−1 is assigned to the ν(CH)aromatic mode of C6H6. The bands at 1176 cm−1 and 1148 cm−1 are assigned to δ(CH)in-plane modes and the band at 973 cm−1 is the δ(CH)out of plane mode. Tentative assignments of the bands at 1402 cm−1 and 1012 cm−1 are given based on their frequencies. These are assigned to ν(CC)aromatic and δ(CH) modes respectively. The appearance of additional bands compared to previous work is explained by the fact that the ices examined by Salter et al.44 are estimated to be approximately 10 nm thick, whereas those in this work are of the order of hundreds of nm thick.26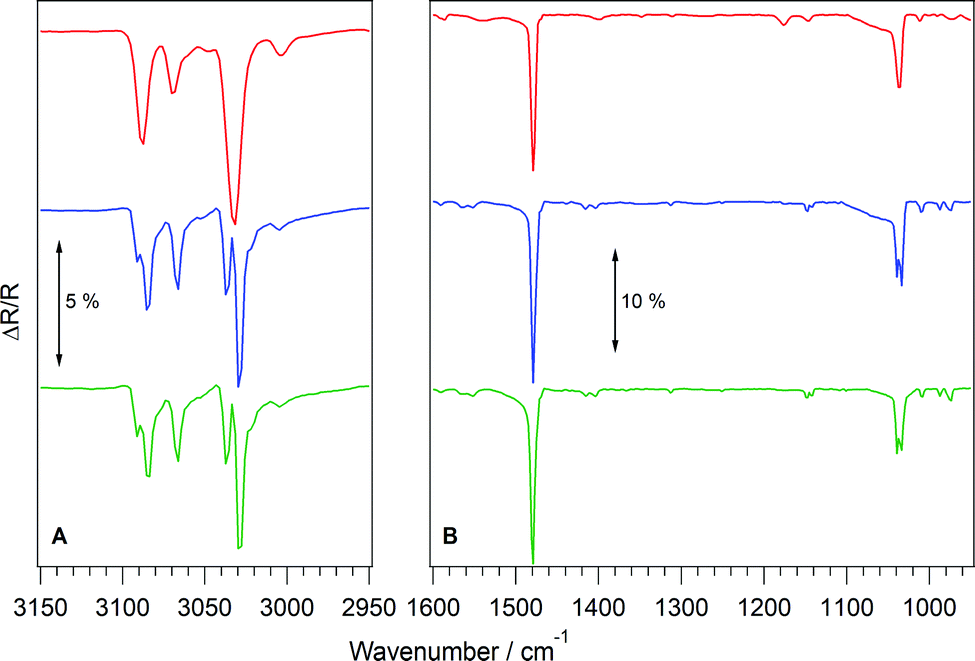 | ||
| Fig. 4 RAIR spectra of 500Lm of C6H6 ice deposited on HOPG. The red spectrum represents C6H6 deposited at 27 K. The blue trace represents the ice in the red trace annealed to 90 K. The green trace is that for ice deposited at 70 K. | ||
C6H6 ice is known to undergo a thermally induced phase change.44,45,47,50,51,80 This phase change has previously been observed upon annealing to 90 K,44 with total crystallisation being complete following annealing to 120 K. The blue trace in Fig. 4 shows the effect of annealing the amorphous C6H6 ice to 90 K. In Fig. 4A, the ν(CH)aromatic mode at 3090 cm−1 splits into two bands at 3091 cm−1 and 3085 cm−1, the second ν(CH)aromatic mode red-shifts to 3066 cm−1 and the ν(CH) combination band splits into two bands at 3037 cm−1 and 3030 cm−1. In Fig. 4B, the ν(CC)aromatic band at 1479 cm−1 increases in intensity and the second ν(CC)aromatic band at 1402 cm−1 shifts and splits into peaks at 1416 cm−1 and 1404 cm−1. The first δ(CH)in-plane mode at 1176 cm−1 disappears, whereas the peak at 1148 cm−1 splits into bands at 1148 cm−1 and 1142 cm−1 and the mode at 1036 cm−1 splits into two bands at 1040 cm−1 and 1034 cm−1. Finally the δ(CH) mode at 1012 cm−1 shifts slightly to 1011 cm−1 and the δ(CH)out of plane mode at 973 cm−1 splits to give bands at 987 cm−1 and 974 cm−1. These changes in the RAIR spectrum of C6H6 are in agreement with those previously assigned to crystallisation of the ice.44,45,48
Further experiments were undertaken to examine whether crystalline C6H6 ice could be grown directly. A deposition temperature of 70 K was chosen as it was sufficiently high to crystallise C6H6, but far enough away from the desorption temperature of around 150 K, as shown in Fig. E1, ESI.‡ The green trace in Fig. 4A and B shows the RAIR spectrum of 500Lm of benzene deposited at 70 K. It is clearly identical to the annealed spectrum, and upon further annealing no changes were observed in any of the bands, indicating that the ice was fully crystalline. In light of these results, crystalline C6H6 ices were grown at a deposition temperature of 70 K, and amorphous C6H6 ices were deposited at base temperature.
Similar characterisation experiments were performed for MF and H2O ices, both of which also undergo thermally induced phase changes. RAIR spectra of MF are shown in Fig. E2 in the ESI.‡ Additionally, band assignments are given in Table E1 in the ESI,‡ with reference to the literature.70,71,73–75,81,82 When MF is deposited at 27 K, it is in its amorphous form and subsequent annealing to 100 K causes the spectrum to change, indicative of an amorphous to crystalline phase transition.83 However, when MF is deposited on the HOPG surface at 105 K, in an attempt to grow crystalline ice directly, the RAIR spectrum of the ice differs to that of the annealed ice (Fig. E2, ESI‡) and agrees with the spectra recorded by Modica and Palumbo.70 Previous studies have shown that MF can exist in two crystalline forms,82 in line with our observations. In this work, only the form deposited at 105 K is examined, and this is referred to as crystalline MF. Fig. E3 of the ESI‡ shows RAIR spectra of H2O ices grown at 27 K and at 135 K. At 27 K, the broad bands are typical of ASW, whereas the spectrum resulting from the ice grown at 135 K is typical of that observed for crystalline water ice (CI).14,84
Fig. 5 shows UV/visible spectra of amorphous (Fig. 5A) and crystalline (Fig. 5B) C6H6 ices for a single C6H6 exposure and at two reflection angles. Several common features are immediately apparent. Firstly, the feature in all the spectra at 656 nm arises as an artefact from the light source and can be disregarded.26,63 Interference fringes are also observed. These are used to determine the ice thickness and real part of the refractive index using the method of Harrick.26,64 The extrema of the interference fringes shift in wavelength at different reflection angles and previous work has shown that increasing the exposure increases the number of interference fringes seen in the spectrum, as expected due to the increased ice thickness.26
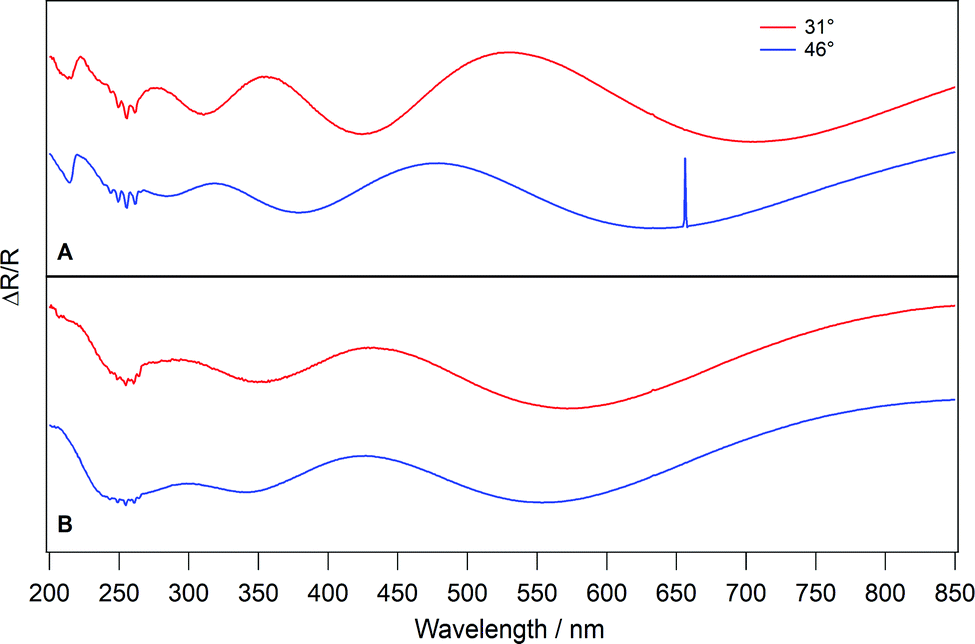 | ||
| Fig. 5 UV/visible reflection–absorption spectra taken at two different reflection angles for 400Lm of amorphous (A) and crystalline (B) C6H6 ices deposited on HOPG. | ||
In each spectrum in Fig. 5, absorption bands, which do not shift with C6H6 exposure, are also observed. The amorphous C6H6 spectra (Fig. 5A) show two absorption features. One is located at 214.8 nm and the other is observed as several peaks centred on approximately 255 nm. These absorption bands have been observed previously45–47,50,85–87 and are assigned to the 1B1u ← 1A1g and 1B2u ← 1A1g transitions of C6H6, respectively. The 1B1u ← 1A1g band in the amorphous C6H6 spectra in Fig. 5A appears as a broad peak with a maximum intensity at 214.8 nm. In the crystalline spectra (Fig. 5B), the intensity of this feature is lost. The reason for the disappearance of the 1B1u ← 1A1g band upon crystallisation is unclear. However, it should be noted that the intensity of the reflected light below approximately 220 nm is very low in our experiment, which may affect the clarity of the spectra below this wavelength.
Fig. 6 shows UV/visible spectra of amorphous and crystalline C6H6 in the region 230–280 nm, to highlight the 1B2u ← 1A1g transition. It is clear from Fig. 6 that the absorption due to the 1B2u ← 1A1g transition changes upon crystallisation of C6H6. The peaks in the crystalline C6H6 spectrum (blue trace) are blue shifted compared to the amorphous spectrum (red trace) by 0.7 nm. Additionally, the bands are sharpened in the crystalline spectrum. The full width at half maximum of the central band at approximately 255 nm is 2.63 nm in the amorphous spectrum, compared to 1.94 nm in the crystalline spectrum. The sharpening and blue shift of the 1B2u ← 1A1g bands in crystalline C6H6 is in excellent agreement with work by Dawes et al.43 The positions of the peaks in amorphous and crystalline C6H6 ice are shown in Table 1, alongside the observations of Dawes et al.45 The spectrum of crystalline C6H6 ice in Fig. 6 also contains minor peaks in between the bands listed in Table 1. These are possibly evidence of Davydov splitting,88 where the presence of more than one equivalent molecular entity in the unit cell interacts to cause the splitting of electronic or vibrational bands. This effect has also been observed in UV/visible spectra of crystalline C6H6 ice recorded by Dawes et al.45
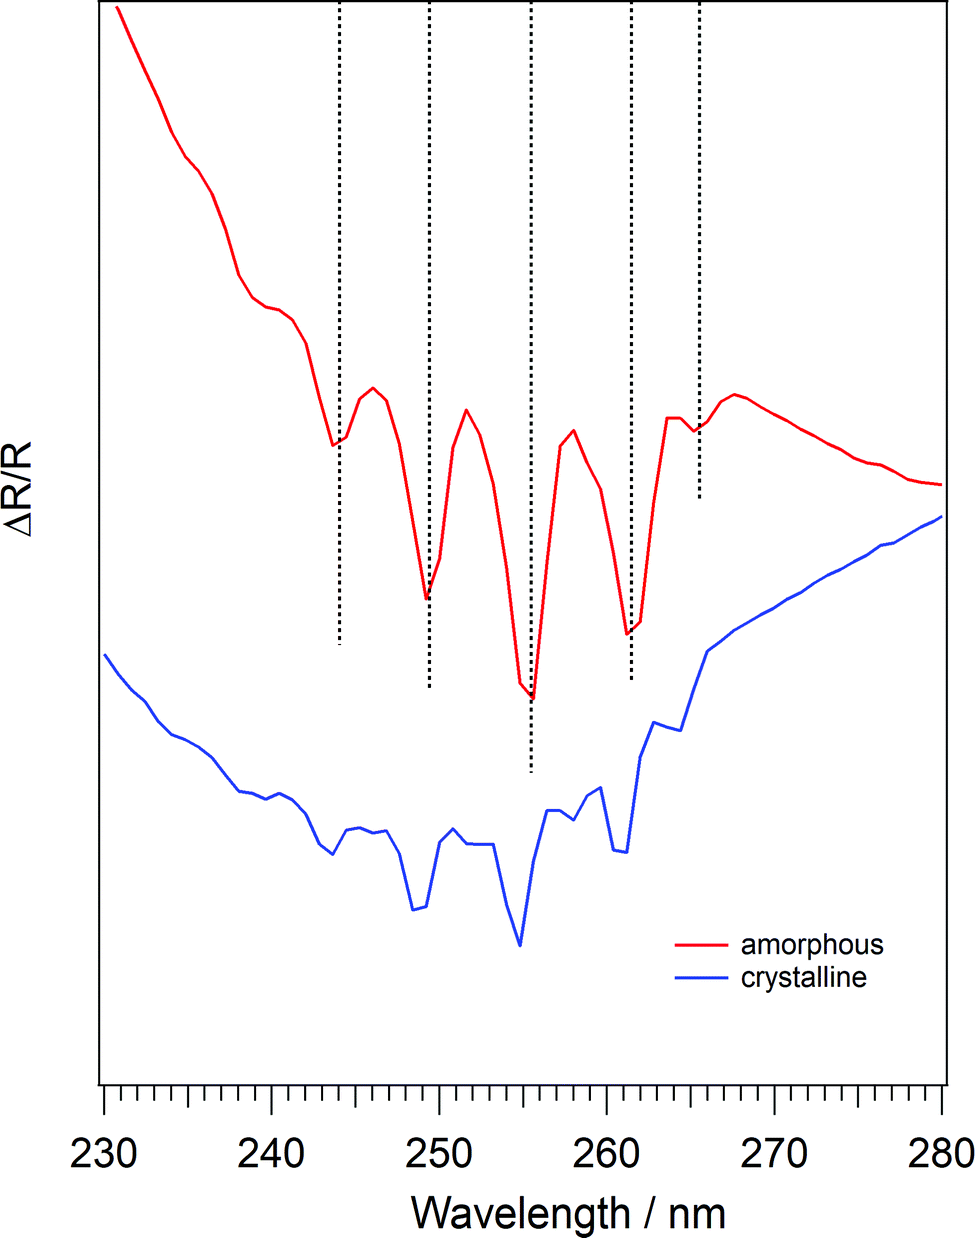 | ||
| Fig. 6 UV/visible reflection–absorption spectra of amorphous (red trace) and crystalline (blue trace) C6H6 on HOPG in the wavelength range 230–280 nm. In each case the C6H6 exposure is 400Lm and the reflection angle is 46°. | ||
| Band position in this work/nm | Band position observed by Dawes et al.45/nm | ||
|---|---|---|---|
| Amorphous C6H6 | Crystalline C6H6 | Amorphous C6H6 | Crystalline C6H6 i |
| 244.0 | 243.3 | 244.15 | 243.25 |
| 249.4 | 248.7 | 249.80 | 248.85 |
| 255.5 | 254.7 | 255.65 | 254.65 |
| 261.5 | 260.9 | 261.60 | 260.80 |
| 265.5 | 264.3 | 265.65 | 264.45 |
UV/visible spectra of amorphous and crystalline MF and H2O are shown in the ESI‡ as Fig. E4 and E5 respectively. In both cases, the characteristic interference fringes are shown. However, unlike the spectra of C6H6 in Fig. 5, no sharp absorption features are seen. For H2O, this is in line with previous work which shows that no absorption is expected at wavelengths above 180 nm.77,89–91 However, MF is known to show an absorption feature at 223 nm in the liquid phase.92 The reason that this feature is not observed in this work is unclear, particularly given that the absorption cross-sections of C6H6 and MF are of similar magnitudes.45,92 One explanation may be that the dipole symmetry forbidden 1B1u and 1B2u states of C6H6 are only observed due to Herzberg–Teller vibronic coupling, which allows them to intensity steal from an allowed transition.45 This may lead to an increase in absorption intensity of the C6H6 band which is not observed for MF.
The Harrick analysis26,64 was applied to the UV/visible spectra of C6H6, MF and H2O ices in order to determine the real part of the refractive index and the thicknesses of the ices. The determined values of n are shown in Table 2.
| Ice | Refractive index, n |
|---|---|
| Amorphous C6H6 | 1.43 ± 0.0726 |
| Crystalline C6H6 | 1.63 ± 0.08 |
| Amorphous MF | 1.23 ± 0.05 |
| Crystalline MF | 1.40 ± 0.08 |
| ASW | 1.38 ± 0.08 |
| CI | 1.40 ± 0.12 |
The refractive index of amorphous C6H6 ice has previously been determined for the data presented here and has a value of n = 1.43 ± 0.07.26 The data shown in Fig. 5 give a refractive index of 1.63 ± 0.08 for crystalline C6H6 ice. This is in agreement, within error, with the value of n = 1.54 ± 0.02 determined by Romanescu et al.54 for C6H6 deposited at 100 K on a gold surface. It is also in agreement with previous work by Yamada and Person, which gives a value of n of 1.57 ± 0.05. The upper limit of the n value for amorphous MF ice is close to the value of 1.30 determined by Modica and Palumbo,70 with the slight variation most likely due to a difference in deposition method. Whilst no literature values of n for crystalline MF ice are available, the agreement between the values determined for amorphous and crystalline C6H6 and amorphous MF with the literature suggest that the value for crystalline MF is reasonable. The determined values of n for ASW and CI are almost identical to each other within the error ranges. Similar behaviour has been observed in the literature, where the refractive index of water ice does not vary as a function of deposition temperature.35,93
The determined real parts of the refractive indices in Table 2 were then used to calculate the thicknesses of the ices. Fig. 7 shows that for all amorphous and crystalline ices, there is a linear relationship between thickness and exposure. Errors in d are determined from the upper and lower limits of n.
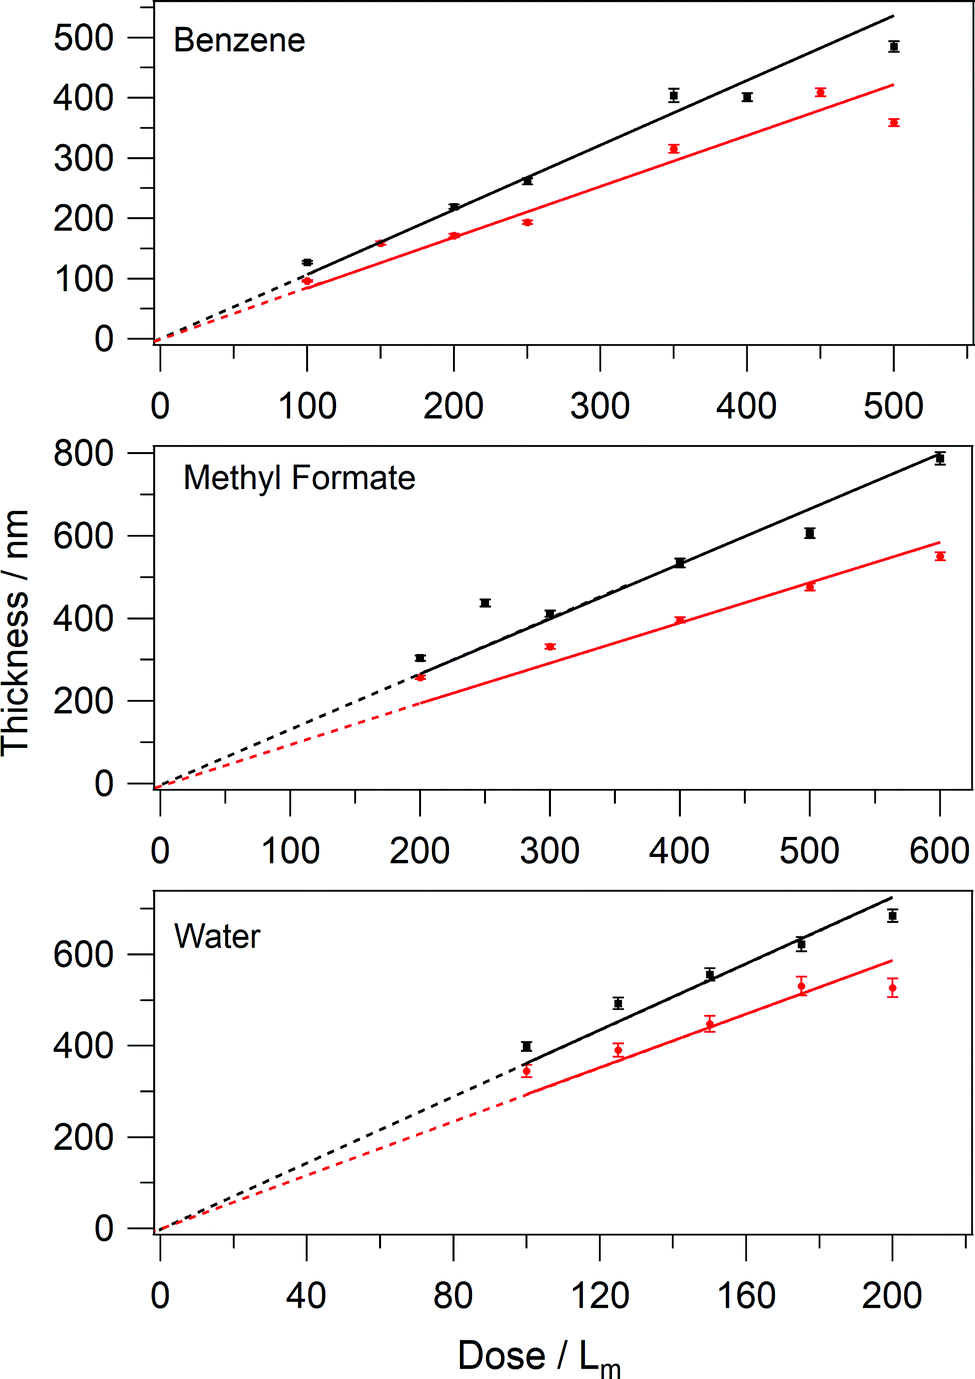 | ||
| Fig. 7 The thickness of C6H6, MF and H2O ices as a function of exposure. The black squares are amorphous ices and the red circles are crystalline ices. Dotted lines show the fits, which are fixed with an intercept of 0. | ||
In all cases, it is clear that crystalline ices are thinner than the amorphous ones. Tests were performed to ensure that the observed thickness difference was due to the phase change, rather than to a reduced sticking probability during deposition at elevated temperatures. Temperature programmed desorption, where the surface is linearly heated whilst desorption is monitored by a quadrupole mass spectrometer (QMS) was used to confirm this. The area under a plot of QMS intensity as a function of surface temperature, for a given mass fragment, is directly proportional to the amount of adsorbate on the surface.14 For C6H6, no decrease in sticking probability (TPD curve area) was observed between 27 K and 70 K. For MF and H2O, a small decrease was found, which was corrected for by increasing the dose time at the higher deposition temperature. Hence, the change in thickness is solely a product of the ice phase.
The thickness difference between amorphous and crystalline ices can be expressed as a compaction factor, calculated from the ratio of weighted least squares linear fits to each set of data in Fig. 7. In each fit, the intercept is fixed at 0, as an exposure of 0Lm must have no thickness. The ratio of the gradients for the crystalline to amorphous C6H6 data gives a compaction factor of 0.74. This means that crystalline C6H6 ice is 0.74 times as thick as the amorphous ice for the same total amount of C6H6. The compaction factors for MF and H2O are 0.74 and 0.82 respectively.
Following the initial analysis, UV/visible spectra of amorphous and crystalline C6H6 ices were then used as input spectra for the analysis code, in order to determine the wavelength dependent values of n and k for the ices. Fig. 8 shows the output spectrum (blue trace) for an exposure of 400Lm C6H6 at a fixed reflection angle of 53° in the wavelength region 200–300 nm. The 1B1u ← 1A1g and 1B2u ← 1A1g transitions at 214 nm and 255 nm respectively are very well reproduced in the simulated spectrum. The values of n and k over the same wavelength range for C6H6 are shown in Fig. 9. The good agreement between the spectra in Fig. 8, as well as the data already shown in Fig. 3, indicates that the theory presented here is suitable to describe the physical processes which give rise to the observed reflection spectra.
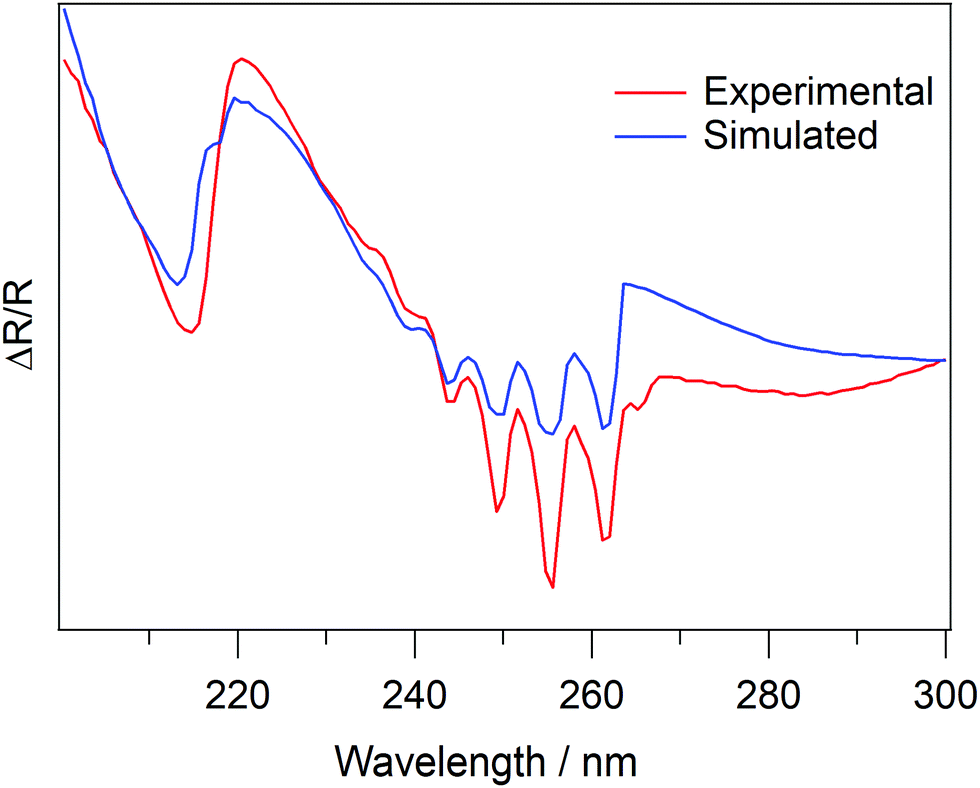 | ||
| Fig. 8 Comparison of reflection–absorption spectra, in the wavelength range 200 nm to 300 nm, of 400Lm amorphous C6H6 on HOPG. The red trace is the experimental spectrum. The blue trace is the simulated spectrum. The reflection angle is 53°. | ||
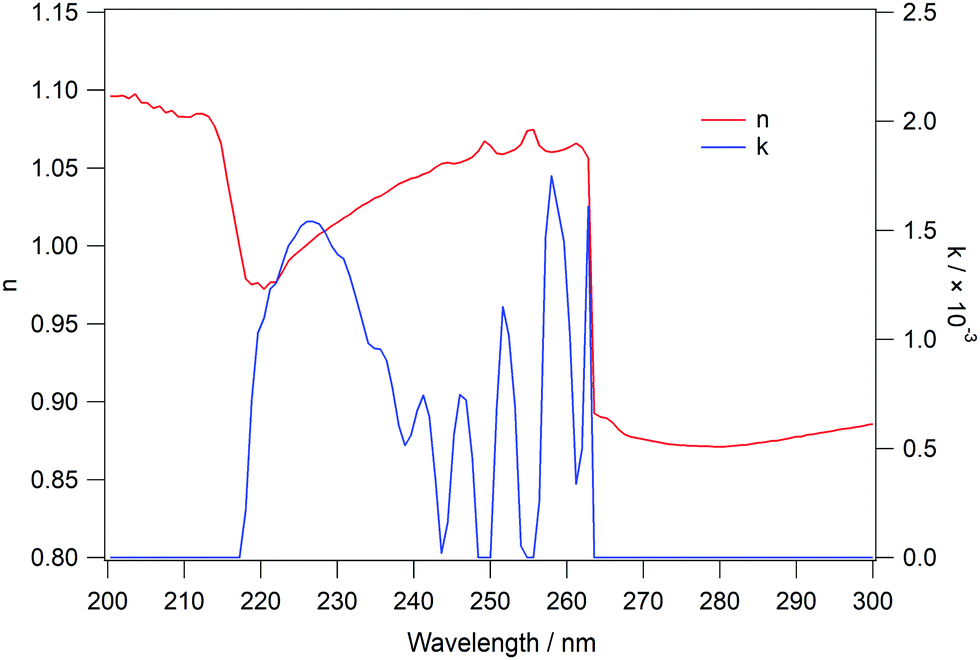 | ||
| Fig. 9 Calculated values of n (red trace) and k (blue trace) for amorphous C6H6 ice, used to produce the spectrum in Fig. 8. | ||
Fig. 10 shows the same spectra as Fig. 8, but now across the entire wavelength range. Whilst the data shown in Fig. 8 show that the absorption features of benzene can be well reproduced by the code, Fig. 10 shows that the interference fringes at longer wavelengths are not well reproduced by the code.
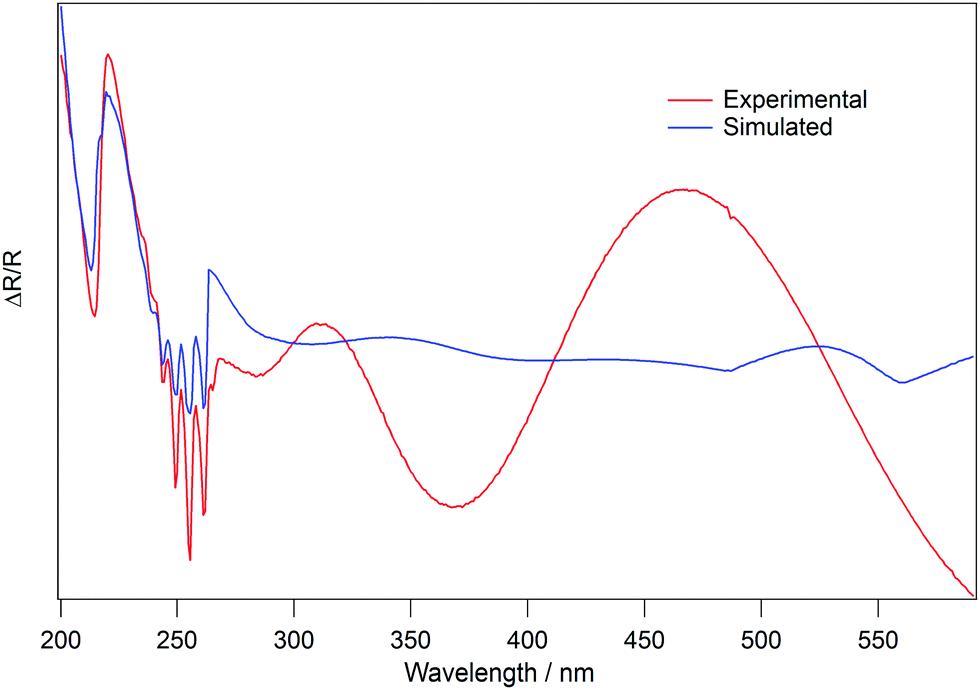 | ||
| Fig. 10 Comparison of the experimental and simulated reflection–absorption spectra, in the wavelength range 200–590 nm, of 400Lm amorphous C6H6 on HOPG. The red trace is the experimental spectrum and the blue trace is the simulated spectrum produced by the analysis code. The reflection angle is 53°. | ||
Discussion
For both C6H6 and MF, Table 2 shows that the crystalline ices have a higher refractive index. This suggests that light impinging on the solid from a vacuum is slowed more upon entering the crystalline ice medium than the amorphous one. Similar behaviour has been reported for thin films of germanium selenide.94 This change can be rationalised by considering the concept of the optical impedance, Z, of a medium. As proposed by Kronig,95 optical impedance is defined as the ratio of the amplitudes of the perpendicular wave vectors in a propagating light wave, i.e. the ratio of the electronic wave vector, E, to the magnetic wave vector, H, and is shown in eqn (19).95,96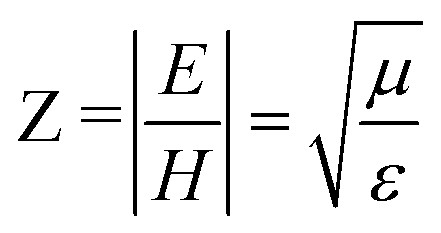 | (19) |
In an amorphous form, the molecules are randomly aligned, and hence the electronic environment is disordered, i.e. the electron cloud of each molecule is randomly aligned relative to its neighbours. Crystalline C6H6 ice consists of C6H6 molecules arranged in a herringbone structure.48,52,97–100 Therefore, there is a difference in the electronic environment in the two ice phases for each molecule. This will cause the dielectric constant, and hence impedance, of the ice to change. In order to explain the difference in refractive index between amorphous and crystalline ice, it is necessary to look at the relationship between the refractive index n and the optical impedance Z. The literature shows that n varies with ε1/2.16,95 Therefore n ∝ 1/Z, and hence a change in impedance must be accompanied by a change in refractive index.
For C6H6 and MF, the refractive index of crystalline ice is higher than that of amorphous ice; 1.63 ± 0.08 compared to 1.43 ± 0.07, and 1.23 ± 0.07 compared to 1.40 ± 0.08 respectively. This implies that Z is lower for crystalline C6H6 and MF ices than for the amorphous phase, and subsequently that the dielectric constant, ε, of the crystalline ice is higher than for amorphous ice, as shown in eqn (19). In agreement with this, crystalline materials have previously been shown to have higher values of ε than their amorphous counterparts.82,94,101,102 Recent theoretical work by Pilling and Bonfim also showed that an increase of ε would lead to an increase in the intensity of infrared bands, in agreement with the spectra shown in Fig. 4 and Fig. E2 (ESI‡).103 The dielectric constant of a medium is also related to its polarizability,103 and therefore our data suggest that crystalline C6H6 and MF ices are more polarisable than their amorphous counterparts. Unlike C6H6 and MF, the refractive indices of ASW and CI do not vary, and agree within the error limits. This is in agreement with previous work which has shown that the refractive index of H2O ice does not vary with temperature.35,93 It is not clear why the behaviour of H2O differs from the other molecules in this work, but further investigations of this type on other molecules will help to clarify this.
It was shown that the amount of adsorbate on the HOPG surface was consistent for all molecules at the various deposition temperatures. Therefore, the observed compaction shown in Fig. 7 is solely a consequence of the ice phase transition. This implies that crystalline ices are denser than their amorphous counterparts. However, care must be taken to not over-extrapolate from this data. The exact structures of amorphous C6H6 and MF ices are unknown. For example, if the ices are porous, the compaction may be due to a combination of pore collapse and decrease in intermolecular distances. For H2O ice, the structure is well studied35,84,93,104,105 and ASW is known to be porous. In this work, the ASW is likely to be in its compact form, where the porosity is less than other forms of ASW but still significant.104,105 Despite the fact that the refractive index of ASW and CI does not vary (Table 2), there is a clear compaction shown in Fig. 7. This is certainly in part due to loss of porosity. Westley et al.35 found that in the temperature range 20–140 K, the density of H2O ice remains constant. In this case, loss of porosity going from ASW to CI would be the sole reason for the observed compaction. Based on the compaction factor of 0.82, this suggests that porosity represents 18% of the ASW thickness, higher than typical estimates of 10%. Therefore, for H2O ice, we conclude that a loss of porosity and a decrease in intermolecular distance upon the phase change is responsible for the observed compaction. Indeed, an increase in density of H2O ice as a function of surface temperature has been previously observed.93,106
The analysis used to determine the complex refractive index of an ice was shown to be valid using test data from the literature, as shown in Fig. 3. However, when the code is used to analyse the experimental C6H6 spectra, there is clearly a discrepancy between the input data and results (Fig. 10). This suggests that there is a systematic error in the experimental data which is not accounted for in the detailed analysis. The analysis reproduces the C6H6 absorption features (Fig. 8), but the interference fringes at wavelengths greater than approximately 270 nm are not well reproduced (Fig. 10). It is noted that the absorption features do not shift as the reflection angle is varied, whereas the relative positions of the interference fringes do shift, as shown in Fig. 5. It is therefore possible that an experimental uncertainty on the true value of θ leads to the observed discrepancy in Fig. 10. This uncertainty is likely due to the limits of precision of the differentially pumped rotary feedthrough which enables sample rotation, and the need to rotate the sample between recording a background spectrum and a sample spectrum. An alternative reason for the disagreement shown in Fig. 10 is that the structure of amorphous C6H6 ice is unknown. The presence of pores or small nuclei would cause a large amount of scatter and diffuse reflections of the light which would impact on the spectra, converting them from reflection–absorption spectra to diffuse-reflectance spectra. However, a similar discrepancy between the experimental and simulated spectra also exists for crystalline C6H6 ice. Therefore, we suggest that an error in reflection angle is a more likely explanation for this situation.
In order to test the effect of a mismatch between the experimental reflection angle and that used in the analysis code, the benchmarking procedure already described was repeated, but with an error of ±2° built into the value of θ. It was shown that this relatively small error on the experimental reflection angle, compared to the value of θ used in the analysis, has a dramatic effect on the results of the analysis, leading to inaccurate values of n and k for the ice (see Fig. E6, in the ESI‡). Furthermore, it results in a poor match between the interference fringes of the experimental and simulated spectra, similar to that shown in Fig. 10 for the experimental data (Fig. E7 in the ESI‡). Therefore we conclude that an uncertainty on reflection angle is the most likely cause of the discrepancy between the data sets shown in Fig. 10. This uncertainty was not found to impact the Harrick analysis,26,64 as this method is dependent on the fringe spacing rather than the exact fringe positions. Experimental modifications are currently underway to remove this systematic error from the experiments. Nonetheless, the data presented here clearly demonstrate the usefulness of this new technique for simultaneously determining ice thickness and refractive index, as well as the applicability of the analysis method to the recorded data.
Conclusions
We have presented a new technique to simultaneously measure the refractive index and thickness of ices adsorbed on opaque substrates at cryogenic temperatures and UHV pressures. New data are reported for amorphous and crystalline C6H6, MF and H2O ices adsorbed on an HOPG substrate. RAIRS shows that these phases can be identified from their infrared absorption spectra, as reported previously. UV/visible reflection–absorption spectra have allowed the determination of the refractive indices of the distinct ice phases.Crystalline C6H6 is found to have a refractive index of 1.63 ± 0.08, whilst amorphous C6H6 ice has a lower refractive index of 1.43 ± 0.07.26 Similarly, crystalline MF ice has a refractive index of 1.40 ± 0.08 compared to 1.23 ± 0.05 for amorphous MF. This difference is assigned to a change in the dielectric constant of the ice that occurs as a result of the phase change. H2O shows different behaviour, with the two phases having almost identical refractive indices, in line with previous work. Further work is required to fully understand this behaviour.
We describe a novel analysis method to determine the wavelength dependent, complex refractive index of these ices. This method was tested using data from Kofman et al.66 and was shown to correctly determine the complex refractive index of an ice from a UV/visible reflection–absorption spectrum. Applying the method to our experimental data has shown that the absorption features of amorphous benzene ice are excellently reproduced by the analysis method. This work has implications for the astrochemistry community, where the complex refractive index is used to simulate the optical properties of icy grains to account for scattering effects in spectroscopic measurements.
The method we have described is widely applicable to the measurement of refractive indices and thicknesses of ices in situ, thus allowing measurements to be made of ices that have been processed by heating, photon or charge particle irradiation. This provides a distinct advantage over previous techniques,11,22,23,31–35 where thickness and refractive index could only be measured during ice deposition.
Conflicts of interest
There are no conflicts to declare.Acknowledgements
JWS thanks the University of Sussex for a PhD studentship. This work was funded by the STFC under grant numbers ST/M000869/1 and ST/M001075/1 at Sussex and Heriot-Watt respectively. The authors would like to thank Dr Adam Baskerville, Research Fellow at the University of Sussex, for his helpful discussions and guidance in writing the analysis code.References
- J. S. Mathis, Observations and theories of interstellar dust, Rep. Prog. Phys., 1993, 56, 605–652 CrossRef CAS.
- T. Nousiainen, Optical modeling of mineral dust particles: A review, J. Quant. Spectrosc. Radiat. Transfer, 2009, 110, 1261–1279 CrossRef CAS.
- J. W. Hovenier and O. Muñoz, Light scattering in the Solar System: an introductory review, J. Quant. Spectrosc. Radiat. Transfer, 2009, 110, 1280–1292 CrossRef CAS.
- B. Meland, P. D. Kleiber, V. H. Grassian and M. A. Young, Correlated IR spectroscopy and visible light scattering measurements of mineral dust aerosol, J. Geophys. Res., 2010, 115, D20208 CrossRef.
- M. Tang, D. J. Cziczo and V. H. Grassian, Interactions of water with mineral dust aerosol: water adsorption, hygroscopicity, cloud condensation, and ice nucleation, Chem. Rev., 2016, 116, 4205–4259 CrossRef CAS.
- Y. Nakamura, Y. Katayama and K. Hirakawa, Hydration and refractive indices of Holocene tephra glass in Hokkaido, Northern Japan, J. Volcanol. Geotherm. Res., 2002, 114, 499–510 CrossRef CAS.
- S. M. Mokhtar, H. M. Swailam and H. E.-S. Embaby, Physicochemical properties, nutritional value and techno-functional properties of goldenberry (Physalis peruviana) waste powder, Food Chem., 2018, 248, 1–7 CrossRef CAS.
- K. Kourtakis, M. Lewittes, B.-L. Yu and S. Subramoney, Novel-stratified low reflectivity anti-reflective coatings derived from self-assembly of high refractive index nanoparticles, J. Coat. Technol. Res., 2016, 13, 953–961 CrossRef CAS.
- M.-J. Choi, O. D. Kwon, S. D. Choi, J.-Y. Baek, K.-J. An and K.-B. Chung, Enhanced anti-reflective effect of SiNx/SiOx/InSnO multi-layers using plasma enhanced chemical vapor deposition system with hybrid plasma source, Appl. Sci. Converg. Technol., 2016, 25, 73–76 CrossRef.
- Z. Yue, G. Xue, J. Liu, Y. Wang and M. Gu, Nanometric holograms based on a topological insulator material, Nat. Commun., 2017, 8, 15354 CrossRef CAS.
- W. R. M. Rocha, S. Pilling, A. L. F. de Barros, D. P. P. Andrade, H. Rothard and P. Boduch, Infrared complex refractive index of astrophysical ices exposed to cosmic rays simulated in the laboratory, Mon. Not. R. Astron. Soc., 2017, 464, 754–767 CrossRef CAS.
- L. J. Allamandola, G. G. M. Tielens and J. R. Barker, Interstellar polycyclic aromatic hydrocarbons - the infrared emission bands, the excitation/emission mechanism, and the astrophysical implications, Astrophys, J. Suppl. Ser., 1989, 71, 733 CrossRef CAS.
- W. R. M. Rocha and S. Pilling, Determination of optical constants n and k of thin films from absorbance data using Kramers–Kronig relationship, Spectrochim. Acta, Part A, 2014, 123, 436–446 CrossRef CAS.
- D. J. Burke and W. A. Brown, Ice in space: surface science investigations of the thermal desorption of model interstellar ices on dust grain analogue surfaces, Phys. Chem. Chem. Phys., 2010, 12, 5947 RSC.
- M. Farley-Born and E. Wolf, Principles of Optics, Cambridge University Press, Cambridge, 7th edn, 1999 Search PubMed.
- E. Hecht, Optics, Addison Wesley, San Francisco, 4th edn, 2002 Search PubMed.
- P. Ehrenfreund, A. C. A. Boogert, P. A. Gerakines, A. G. G. M. Tielens and E. F. Van Dishoeck, Infrared spectroscopy of interstellar apolar ice analogs, Astron. Astrophys., 1997, 328, 649–669 CAS.
- J. Räty, P. Pääkkönen and K.-E. Peiponen, Assessment of wavelength dependent complex refractive index of strongly light absorbing liquids, Opt. Express, 2012, 20, 2835 CrossRef.
- W. R. M. Rocha and S. Pilling, Computational modeling of the class I low-mass protostar Elias 29 applying optical constants of ices processed by high energy cosmic ray analogs, Astrophys. J., 2015, 803, 18 CrossRef.
- D. M. Hudgins, S. A. Sandford, L. J. Allamandola and A. G. G. M. Tielens, Mid- and far-infrared spectroscopy of ices - optical constants and integrated absorbances, Astrophys, J. Suppl. Ser., 1993, 86, 713 CrossRef CAS.
- J. Elsila, L. J. Allamandola and S. A. Sandford, The 2140 cm−1 (4.673 micron) solid CO band: the case for interstellar O2 and N2 and the photochemistry of nonpolar interstellar ice analogs, Astrophys. J., 1997, 479, 818–838 CrossRef CAS.
- G. A. Baratta and M. E. Palumbo, Infrared optical constants of CO and CO2 thin icy films, J. Opt. Soc. Am. A, 1998, 15, 3076 CrossRef CAS.
- M. H. Moore, R. F. Ferrante, W. James Moore and R. Hudson, Infrared spectra and optical constants of nitrile ices relevant to Titan's atmosphere, Astrophys. J. Suppl. Ser., 2010, 191, 96–112 CrossRef CAS.
- R. L. Hudson, R. F. Ferrante and M. H. Moore, Infrared spectra and optical constants of astronomical ices: I. Amorphous and crystalline acetylene, Icarus, 2014, 228, 276–287 CrossRef CAS.
- G. M. Hale and M. R. Querry, Optical constants of water in the 200 nm to 200 μm wavelength region, Appl. Opt., 1973, 12, 555 CrossRef CAS.
- J. W. Stubbing, T. L. Salter, W. A. Brown, S. Taj and M. R. S. McCoustra, A fibre-coupled UHV-compatible variable angle reflection-absorption UV/visible spectrometer, Rev. Sci. Instrum., 2018, 89, 054102 CrossRef CAS.
- S. Pilling, E. Seperuelo Duarte, A. Domaracka, H. Rothard, P. Boduch and E. F. da Silveira, Radiolysis of H2O:CO2 ices by heavy energetic cosmic ray analogs, Astron. Astrophys., 2010, 523, A77 CrossRef.
- S. Pilling, E. Seperuelo Duarte, E. F. da Silveira, E. Balanzat, H. Rothard, A. Domaracka and P. Boduch, Radiolysis of ammonia-containing ices by energetic, heavy, and highly charged ions inside dense astrophysical environments, Astron. Astrophys., 2010, 509, A87 CrossRef.
- A. Bergantini, S. Pilling, H. Rothard, P. Boduch and D. P. P. Andrade, Processing of formic acid-containing ice by heavy and energetic cosmic ray analogues, Mon. Not. R. Astron. Soc., 2014, 437, 2720–2727 CrossRef CAS.
- E. Dartois, J. J. Ding, A. L. F. de Barros, P. Boduch, R. Brunetto, M. Chabot, A. Domaracka, M. Godard, X. Y. Lv, C. F. Mejía Guamán, T. Pino, H. Rothard, E. F. da Silveira and J. C. Thomas, Swift heavy ion irradiation of water ice from MeV to GeV energies, Astron. Astrophys., 2013, 557, A97 CrossRef.
- B. S. Berland, D. R. Haynes, K. L. Foster, M. A. Tolbert, S. M. George and O. B. Toon, Refractive indices of amorphous and crystalline HNO3/H2O films representative of Polar Stratospheric Clouds, J. Phys. Chem., 1994, 98, 4358–4364 CrossRef CAS.
- R. Luna, M. Á. Satorre, M. Domingo, C. Millán and C. Santonja, Density and refractive index of binary CH4, N2 and CO2 ice mixtures, Icarus, 2012, 221, 186–191 CrossRef CAS.
- M. Á. Satorre, M. Domingo, C. Millán, R. Luna, R. Vilaplana and C. Santonja, Density of CH4, N2 and CO2 ices at different temperatures of deposition, Planet. Space Sci., 2008, 56, 1748–1752 CrossRef CAS.
- D. M. Paardekooper, G. Fedoseev, A. Riedo and H. Linnartz, A novel approach to measure photodesorption rates of interstellar ice analogues, Astron. Astrophys., 2016, 596, A72 CrossRef.
- M. S. Westley, G. A. Baratta and R. A. Baragiola, Density and index of refraction of water ice films vapor deposited at low temperatures, J. Chem. Phys., 1998, 108, 3321–3326 CrossRef CAS.
- P. Ehrenfreund, L. D’Hendecourt, S. Charnley and R. Ruiterkamp, Energetic and thermal processing of interstellar ices, J. Geophys. Res. Planets, 2001, 106, 33291–33301 CrossRef CAS.
- J. Cernicharo, A. M. Heras, A. G. G. M. Tielens, J. R. Pardo, F. Herpin, M. Guélin and L. B. F. M. Waters, Infrared Space Observatory's discovery of C4H2, C6H2, and benzene in CRL 618, Astrophys. J., 2001, 546, L123–L126 CrossRef CAS.
- J. Bernard-Salas, E. Peeters, G. C. Sloan, J. Cami, S. Guiles and J. R. Houck, The Spitzer IRS spectrum of SMP LMC 11, Astrophys. J., 2006, 652, L29–L32 CrossRef CAS.
- S. E. Malek, J. Cami and J. Bernard-Salas, The rich circumstellar chemistry of SMP LMC 11, Astrophys. J., 2012, 744, 16 CrossRef.
- R. T. Garrod and E. Herbst, Formation of methyl formate and other organic species in the warm up phase of hot molecular cores, Astron. Astrophys., 2006, 457, 927–936 CrossRef CAS.
- A. Occhiogrosso, S. Viti, P. Modica and M. E. Palumbo, A study of methyl formate in astrochemical environments, Mon. Not. R. Astron. Soc., 2011, 418, 1923–1927 CrossRef CAS.
- J. D. Thrower, M. P. Collings and F. J. M. Rutten, Laboratory investigations of the interaction between benzene and bare silicate grain surfaces, Mon. Not. R. Astron. Soc., 2009, 394, 1510–1518 CrossRef CAS.
- D. Marchione, J. D. Thrower and M. R. S. McCoustra, Efficient electron-promoted desorption of benzene from water ice surfaces, Phys. Chem. Chem. Phys., 2016, 18, 4026–4034 RSC.
- T. L. Salter, J. W. Stubbing, L. Brigham and W. A. Brown, A TPD and RAIRS comparison of the low temperature surface behavior of benzene, toluene, and xylene on graphite, J. Chem. Phys., 2018, 149, 164705 CrossRef.
- A. Dawes, N. Pascual, S. V. Hoffmann, N. C. Jones and N. J. Mason, Vacuum ultraviolet photoabsorption spectroscopy of crystalline and amorphous benzene, Phys. Chem. Chem. Phys., 2017, 19, 27544–27555 RSC.
- T. Etzkorn, B. Klotz, S. Sørensen, I. V. Patroescu, I. Barnes, K. H. Becker and U. Platt, Gas-phase absorption cross sections of 24 monocyclic aromatic hydrocarbons in the UV and IR spectral ranges, Atmos. Environ., 1999, 33, 525–540 CrossRef CAS.
- S. Fally, M. Carleer and A. C. Vandaele, UV Fourier transform absorption cross sections of benzene, toluene, meta-, ortho-, and para-xylene, J. Quant. Spectrosc. Radiat. Transfer, 2009, 110, 766–782 CrossRef CAS.
- P. Jakob and D. Menzel, Initial stages of multilayer growth and structural phase transitions of physisorbed benzene on Ru(001), J. Chem. Phys., 1996, 105, 3838–3848 CrossRef CAS.
- K. Ishii, H. Nakayama, T. Yoshida, H. Usui and K. Koyama, Amorphous State of Vacuum-Deposited Benzene and Its Crystallization, Bull. Chem. Soc. Jpn., 1996, 69, 2831–2838 CrossRef CAS.
- P. Swiderek and H. Winterling, Spin-forbidden transitions in amorphous and crystalline thin films of benzene, Chem. Phys., 1998, 229, 295–307 CrossRef CAS.
- M. Xi, M. X. Yang, S. K. Jo, B. E. Bent and P. Stevens, Benzene adsorption on Cu(111): Formation of a stable bilayer, J. Chem. Phys., 1994, 101, 9122–9131 CrossRef CAS.
- P. Jakob and D. Menzel, Benzene multilayers: A model for their anisotropic growth from vibrational spectroscopy and thermal desorption, Surf. Sci., 1989, 220, 70–95 CrossRef CAS.
- P. Meehan, T. Rayment, R. K. Thomas, G. Bomchil and J. W. White, Neutron diffraction from benzene adsorbed on graphite, J. Chem. Soc. Faraday Trans. 1, 1980, 2011 RSC.
- C. Romanescu, J. Marschall, D. Kim, A. Khatiwada and K. S. Kalogerakis, Refractive index measurements of ammonia and hydrocarbon ices at 632.8 nm, Icarus, 2010, 205, 695–701 CrossRef CAS.
- N. S. Kozlova, V. R. Shayapov, E. V. Zabelina, A. P. Kozlova, R. N. Zhukov, D. A. Kiselev, M. D. Malinkovich and M. I. Voronova, Spectrophotometric determination of optical parameters of lithium niobate films, Mod. Electron. Mater., 2017, 3, 122–126 CrossRef.
- A. S. Bolina, A. J. Wolff and W. A. Brown, Reflection absorption infrared spectroscopy and temperature-programmed desorption studies of the adsorption and desorption of amorphous and crystalline water on a graphite surface, J. Phys. Chem. B, 2005, 109, 16836–16845 CrossRef CAS.
- B. T. Draine, Interstellar dust grains, Annu. Rev. Astron. Astrophys., 2003, 41, 241–289 CrossRef.
- B. T. Draine and S. Malhotra, On graphite and the 2175 Å extinction profile, Astrophys. J., 1993, 414, 632 CrossRef CAS.
- T. P. Stecher and B. Donn, On Graphite and Interstellar Extinction, Astrophys. J., 1965, 142, 1681 CrossRef CAS.
- L. J. Allamandola, S. A. Sandford, A. G. G. M. Tielens and T. M. Herbst, Infrared spectroscopy of dense clouds in the C–H stretch region – methanol and ‘diamonds’, Astrophys. J., 1992, 399, 134 CrossRef CAS.
- E. Bussoletti, L. Colangeli and V. Orofino, Interstellar amorphous carbon, Astrophys. J., 1987, 321, L87 CrossRef CAS.
- D. A. Williams and E. Herbst, It's a dusty Universe: surface science in space, Surf. Sci., 2002, 500, 823–837 CrossRef CAS.
- Ocean Optics, DH-2000 Family – Ocean Optics, https://oceanoptics.com/product/dh-2000-family/, accessed 1 May 2017.
- N. J. Harrick, Determination of refractive index and film thickness from interference fringes, Appl. Opt., 1971, 10, 2344 CrossRef CAS.
- A. B. Djurišić and E. H. Li, Optical properties of graphite, J. Appl. Phys., 1999, 85, 7404–7410 CrossRef.
- V. Kofman, M. J. A. Witlox, J. Bouwman, I. L. ten Kate and H. Linnartz, A multifunctional setup to record FTIR and UV-vis spectra of organic molecules and their photoproducts in astronomical ices, Rev. Sci. Instrum., 2018, 89, 053111 CrossRef CAS.
- P. S. Ray, Broadband complex refractive indices of ice and water, Appl. Opt., 1972, 11, 1836 CrossRef CAS.
- G. Strazzulla and G. Baratta, Laboratory study of the IR spectrum of ion-irradiated frozen benzene, Astron. Astrophys., 1991, 241, 310–316 CAS.
- R. Ruiterkamp, Z. Peeters, M. H. Moore, R. L. Hudson and P. Ehrenfreund, A quantitative study of proton irradiation and UV photolysis of benzene in interstellar environments, Astron. Astrophys., 2005, 440, 391–402 CrossRef CAS.
- P. Modica and M. E. Palumbo, Formation of methyl formate after cosmic ion irradiation of icy grain mantles, Astron. Astrophys., 2010, 519, A22 CrossRef.
- D. J. Burke, F. Puletti, P. M. Woods, S. Viti, B. Slater and W. A. Brown, Adsorption and thermal processing of glycolaldehyde, methyl formate, and acetic acid on graphite at 20 K, J. Phys. Chem. A, 2015, 119, 6837–6849 CrossRef CAS.
- M. Roman, S. Taj, M. Gutowski, M. R. S. McCoustra, A. C. Dunn, Z. G. Keolopile, A. Rosu-Finsen, A. M. Cassidy and D. Field, Non-linear and non-local behaviour in spontaneously electrical solids, Phys. Chem. Chem. Phys., 2018, 20, 5112–5116 RSC.
- B. A. Sexton, A. E. Hughes and N. R. Avery, A spectroscopic study of the adsorption and reactions of methanol, formaldehyde and methyl formate on clean and oxygenated Cu(110) surfaces, Surf. Sci., 1985, 155, 366–386 CrossRef CAS.
- A. L. Schwaner, J. E. Fieberg and J. M. White, Methyl formate on Ag(111). 1. thermal adsorption–desorption characteristics and alignment in monolayers, J. Phys. Chem. B, 1997, 101, 11112–11118 CrossRef CAS.
- L. Krim, M. Jonusas, J.-C. Guillemin, M. Yáñez and A. M. Lamsabhi, Reduction of C
![[double bond, length as m-dash]](https://www.rsc.org/images/entities/char_e001.gif) O functional groups through H addition reactions: a comparative study between H2CO + H, CH3CH2CHO + H and CH3OCHO + H under interstellar conditions, Phys. Chem. Chem. Phys., 2018, 20, 19971–19978 RSC.
O functional groups through H addition reactions: a comparative study between H2CO + H, CH3CH2CHO + H and CH3OCHO + H under interstellar conditions, Phys. Chem. Chem. Phys., 2018, 20, 19971–19978 RSC. - M. E. Palumbo, The morphology of interstellar water ice, J. Phys. Conf. Ser., 2005, 6, 211–216 CrossRef CAS.
- A. Dawes, N. Pascual, N. J. Mason, S. Gärtner, S. V. Hoffmann and N. C. Jones, Probing the interaction between solid benzene and water using vacuum ultraviolet and infrared spectroscopy, Phys. Chem. Chem. Phys., 2018, 20, 15273–15287 RSC.
- J. D. Thrower, M. P. Collings, F. J. M. Rutten and M. R. S. McCoustra, Thermal desorption of C6H6 from surfaces of astrophysical relevance, J. Chem. Phys., 2009, 131, 244711 CrossRef CAS.
- AIST, SDBS-898, https://sdbs.db.aist.go.jp/sdbs/cgi-bin/landingpage?sdbsno=898, accessed 11 December 2018.
- R. A. May, R. S. Smith and B. D. Kay, Mobility of supercooled liquid toluene, ethylbenzene, and benzene near their glass transition temperatures investigated using inert gas permeation, J. Phys. Chem. A, 2013, 117, 11881–11889 CrossRef CAS.
- E. Zahidi, M. Castonguay and P. McBreen, RAIRS and TPD study of methyl formate, ethyl formate, and methyl acetate on Ni(111), J. Am. Chem. Soc., 1994, 116, 5847–5856 CrossRef CAS.
- M. Roman, A. Dunn, S. Taj, Z. G. Keolopile, A. Rosu-Finsen, M. Gutowski, M. R. S. McCoustra, A. M. Cassidy and D. Field, Assigning a structural motif using spontaneous molecular dipole orientation in thin films, Phys. Chem. Chem. Phys., 2018, 20, 29038–29044 RSC.
- J. E. Katon and N. L. Ranieri, The infrared spectrum of crystalline methyl formate, Spectrosc. Lett., 1978, 11, 367–373 CrossRef CAS.
- H. J. Fraser, M. P. Collings, M. R. S. McCoustra and D. A. Williams, Thermal desorption of water ice in the interstellar medium, Mon. Not. R. Astron. Soc., 2001, 327, 1165–1172 CrossRef CAS.
- A. Hiraya and K. Shobatake, Direct absorption spectra of jet-cooled benzene in 130–260 nm, J. Chem. Phys., 1991, 94, 7700–7706 CrossRef CAS.
- E. R. Bernstein, S. D. Colson, R. Kopelman and G. W. Robinson, Electronic and vibrational exciton structure in crystalline benzene, J. Chem. Phys., 1968, 48, 5596–5610 CrossRef CAS.
- S. D. Colson, D. M. Hanson, R. Kopelman and G. W. Robinson, Direct observation of the entire exciton band of the first excited singlet states of crystalline benzene and naphthalene, J. Chem. Phys., 1968, 48, 2215–2231 CrossRef CAS.
- A. Davydov, Theory of Molecular Excitons, Springer, New York, 1st edn, 1971 Search PubMed.
- G. R. Branton and C. E. Brion, Total absorption and the energy dependence of the partial oscillator strengths for “photoionization” of the valence orbitals of H2O using an electron-electron coincidence method, J. Electron Spectrosc. Relat. Phenom., 1974, 3, 129–135 CrossRef CAS.
- C. A. Cantrell, A. Zimmer and G. S. Tyndall, Absorption cross sections for water vapor from 183 to 193 nm, Geophys. Res. Lett., 1997, 24, 2195–2198 CrossRef CAS.
- W. F. Chan, G. Cooper and C. E. Brion, The electronic spectrum of water in the discrete and continuum regions. Absolute optical oscillator strengths for photoabsorption (6–200 eV), Chem. Phys., 1993, 178, 387–400 CrossRef CAS.
- Y. Nunes, G. Martins, N. J. Mason, D. Duflot, S. V. Hoffmann, J. Delwiche, M.-J. Hubin-Franskin and P. Limão-Vieira, Electronic state spectroscopy of methyl formate probed by high resolution VUV photoabsorption, He(I) photoelectron spectroscopy and ab initio calculations, Phys. Chem. Chem. Phys., 2010, 12, 15734 RSC.
- Z. Dohnálek, G. A. Kimmel, P. Ayotte, R. S. Smith and B. D. Kay, The deposition angle-dependent density of amorphous solid water films, J. Chem. Phys., 2003, 118, 364–372 CrossRef.
- I. Gregora, B. Velickýa and M. Závětová, Refractive index of crystalline and amorphous GeS, Phys. Status Solidi, 1981, 104, K95–K100 CrossRef CAS.
- R. Kronig, B. S. Blaisse and J. J. V. D. Sande, Optical impedance and surface coating, Appl. Sci. Res., Sect. B, 1950, 1, 63–76 CrossRef.
- F. G. Smith and J. H. Thomson, Optics, John Wiley & Sons Ltd, Chichester, 2nd edn, 1988 Search PubMed.
- G. E. Bacon, N. A. Curry and S. A. Wilson, A crystallographic study of solid benzene by neutron diffraction, Proc. R. Soc. A, 1964, 279, 98–110 CAS.
- S. K. Nayak, R. Sathishkumar and T. N. G. Row, Directing role of functional groups in selective generation of C–H⋯π interactions: In situ cryo-crystallographic studies on benzyl derivatives, CrystEngComm, 2010, 12, 3112 RSC.
- E. G. Cox and J. A. S. Smith, Crystal Structure of Benzene at −3 °C, Nature, 1954, 173, 75 CrossRef CAS.
- E. G. Cox, D. W. J. Cruickshank and J. A. S. Smith, The Crystal Structure of Benzene at -3Formula C, Proc. R. Soc. A, 1958, 247, 1–21 CAS.
- C. Ghosh and B. P. Varma, Some optical properties of amorphous and crystalline antimony trisulphide thin films, Solid State Commun., 1979, 31, 683–686 CrossRef CAS.
- D. Vanderbilt, X. Zhao and D. Ceresoli, Structural and dielectric properties of crystalline and amorphous ZrO2, Thin Solid Films, 2005, 486, 125–128 CrossRef CAS.
- S. Pilling and V. S. Bonfim, The influence of molecular vicinity (expressed in terms of dielectric constant) on the infrared spectra of embedded species in ices and solid matrices, RSC Adv., 2020, 10, 5328–5338 CAS.
- K. P. Stevenson, G. A. Kimmel, Z. Dohnálek, R. S. Smith and B. D. Kay, Controlling the Morphology of Amorphous Solid Water, Science, 1999, 283, 1505–1507 CAS.
- G. A. Kimmel, K. P. Stevenson, Z. Dohnálek, R. S. Smith and B. D. Kay, Control of amorphous solid water morphology using molecular beams. I. Experimental results, J. Chem. Phys., 2001, 114, 5284–5294 CrossRef CAS.
- D. E. Brown, S. M. George, C. Huang, E. K. L. Wong, K. B. Rider, R. S. Smith and B. D. Kay, H2O condensation coefficient and refractive index for vapor-deposited ice from molecular beam and optical interference measurements, J. Phys. Chem., 1996, 100, 4988–4995 CrossRef CAS.
Footnotes |
| † All data referred to in this manuscript are presented in either the manuscript or the electronic supplementary information (ESI). |
| ‡ Electronic supplementary information (ESI) available. See DOI: 10.1039/d0cp02373f |
| § Present address: Surrey Space Centre, University of Surrey, Guildford, Surrey, GU2 7XH, UK. |
| This journal is © the Owner Societies 2020 |