The carbon and oxygen K-edge NEXAFS spectra of CO+†
Received
24th April 2020
, Accepted 27th June 2020
First published on 1st July 2020
Abstract
We present and analyze high resolution near edge X-ray absorption fine structure (NEXAFS) spectra of CO+ at the carbon and oxygen K-edges. The spectra show a wealth of features that appear very differently at the two K-edges. The analysis of these features can be divided into three parts; (i) repopulation transition to the open shell orbital – here the C(1s) or O(1s) to 5σ transition, where the normal core hole state is reached from a different initial state and different interaction than in X-ray photoelectron spectroscopy; (ii) spin coupled split valence bands corresponding to C(1s) or O(1s) to π* transitions; (iii) remainder weak and long progressions towards the double ionization potentials containing a manifold of peaks. These parts, none of which has correspondence in NEXAFS spectra of neutral molecules, are dictated by the localization of the singly occupied 5σ orbital, adding a dimension of chemistry to the ionic NEXAFS technique.
1 Introduction
Near edge X-ray absorption fine structure (NEXAFS) is a prominent member of the family of X-ray spectroscopies that since long has been instrumental for studies of molecular electronic and conformational structures.1 Apart from in depth studies of the X-ray absorption process itself, effective and simplified rules have been proposed for the spectral analysis and applied for a wide range of species, like one-center rules, building block and bond length with ruler principles, and, for fixed in space species, orientational probing.1–4 Owing to recently improved techniques to trap molecular cations in sufficient amount and time to be measurable by X-ray synchrotron beams,5–11 high-resolution NEXAFS of such species has now become a realistic proposition.
Molecular ions have been the subject of analysis in a number of research contexts – in mass spectroscopic analysis,12 combustion chemistry,13 atmospheric chemistry, astrophysics for interstellar clouds and protoplanetary disks,14,15 photofragmentation16,17 and dissociative recombination in heavy-ion storage-cooler rings,18 to mention a few examples. Very recently, the possibility to use X-ray absorption on molecular ions raised the question on what kind of informational content this spectroscopy brings for our expanded understanding of these species. Herein, we address this question by studying a prototype example, the carbon monoxide cation, a simple species where the two K-edges are reachable in the soft X-ray region. Owing to the distinct localization of the carbon and oxygen core hole species, and the very different relaxation of the electronic clouds following their creation, neutral carbon monoxide has been the subject for numerous experimental and theoretical benchmark studies for NEXAFS.19–26
As shown in the present work, the NEXAFS spectra of cationic CO+ (ground state 1σ22σ23σ24σ21π45σ1) show widely different, and much richer, structures than neutral CO (Fig. 1). This raises the question not only of the informational content that NEXAFS may bring for molecular ions but also how we can address these novel features by theory and simulations. We here show that the spectral analysis of these features can be divided into three parts. The first part, at lowest transition energy, corresponds to the repopulation of the orbital hole that was created in the ionization process – here the C(1s) or O(1s) to 5σ transition, thus creating a bare core hole state with correspondence to X-ray photoelectron spectroscopy (XPS), but reached from a different initial state and with different interaction. The second part, which shows the highest intensities, contains spin-coupled split bands corresponding to C(1s) or O(1s) to valence π* transitions. The appearance of these states turns out unexpectedly and widely different at the two edges concerning splitting, intensity and vibrational fine structure. The third part of the spectrum shows a remaining weak and long progression containing a manifold of peaks with highly irregular appearance. None of these features have counterparts in NEXAFS spectra of neutral molecules and will here be analyzed by ab initio electron correlated wave function calculations. Each part will be discussed separately in the following.
 |
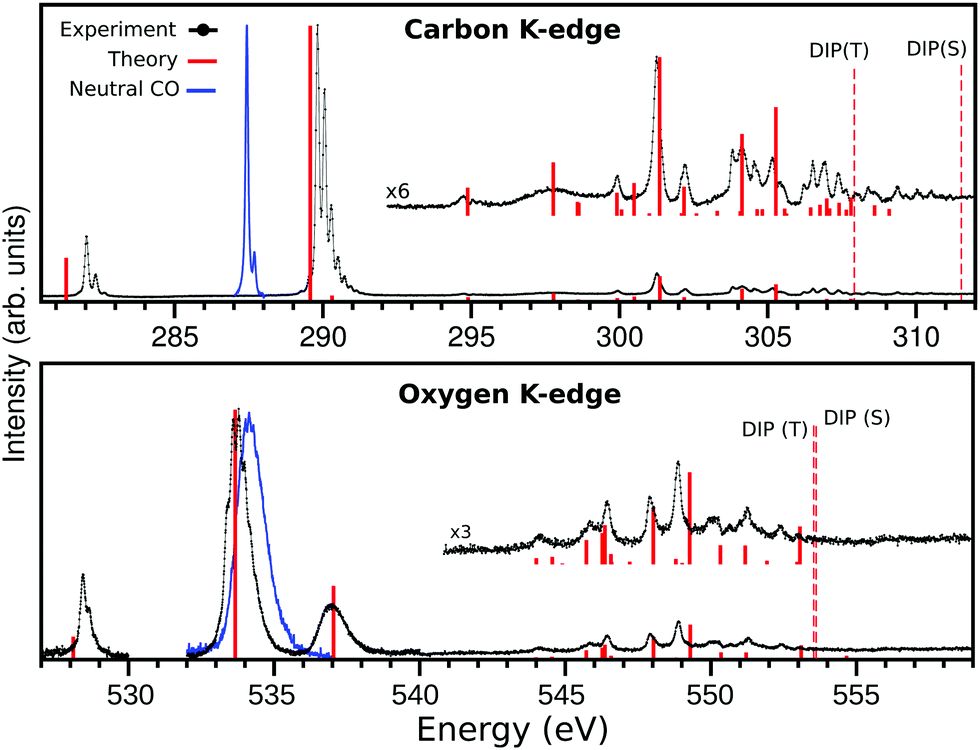
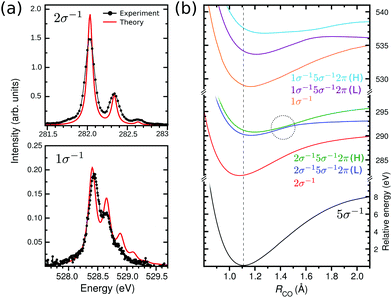
| | Fig. 1 The X-ray absorption spectrum of CO+ (solid black) at carbon (top panel) and oxygen (lower panel) K-edges and the calculated spectrum (solid red bars). The carbon K-edge theoretical spectrum was shifted by −1.3 eV in order to match most features at the region above 294 eV, and the oxygen K-edge was shifted by −0.75 eV to match most features at the region above 540 eV. The dashed lines represents the singlet and triplet double ionization potentials (DIP) 1s−15σ−1. The spectrum on the oxygen edge was measured in three regions, the region 540–560 eV was measured with a larger bandwidth. The intensity of the three regions were matched by a lower resolution measurement. | |
2 Experiment
NEXAFS of molecular ions can be measured using different types of ion beams10,11 or ion traps.5 Here we have used the Nano Cluster Trap endstation at beamline UE52-PGM at BESSY II to measure NEXAFS in ion yield of CO+. The experimental setup has been described elsewhere.5,27 In brief, ionic species of CO were created by leaking CO gas into a He plasma created by a magnetron sputtering source. CO+ was selected using a quadrupole mass filter, and then guided into a linear, cryogenic radio frequency ion trap. Besides a dominant population of the vibrational ground state, Penning ionization of carbon monoxide also produces ions in vibrationally excited states with relative intensities of 3–8% and ≤1% for the ν = 1 and ν = 2 states, respectively,28,29 in agreement with our findings. These vibrationally excited states do not correspond to the buffer gas temperature of 10–20 K because they are not quenched efficiently by collisions with buffer gas in the ion trap. X-rays were introduced into the ion trap, and after absorption, the core excited state of the molecule relaxes primarily via Auger decay followed by dissociation into C+ and O+. The fragments are also trapped, and the contents of the trap is rapidly analyzed using a reflectron time-of-flight mass spectrometer. The X-ray energy was scanned and an action spectrum of CO+ was created by analyzing the yield of the dissociation fragments, which is assumed to be proportional to the X-ray absorption spectrum of CO+. The photon energy was calibrated according to the procedure described in Weiss et al.30 The calibration was checked by measuring NEXAFS in total electron yield of neutral CO in an upstream gas-cell. The high resolution spectra of the lowest lying states of CO+ were measured with a monochromator exit slit of 100 μm for the carbon edge and 20 μm for the oxygen edge, with estimated bandwidths of 50 meV and 25 meV respectively. The only exception is the 540–560 eV region of the oxygen K-edge spectrum, where a larger slit of 40 μm was used, resulting in an estimated bandwidth of 53 meV. In the long oxygen spectrum, e.g., shown in Fig. 1, different parts are measured separately. The relative intensities of the different parts agree with a low resolution spectrum of the complete 527–559 eV region. Spectroscopic constants were obtained by a Franck–Condon analysis, using Voigt profiles and assuming Morse potentials.27 In the Franck–Condon analysis, spectroscopic constants from Dixon et al.31 were used for the initial state 5σ−1. Details of the experimental fitting procedure and comparison with previous studies can be found in the ESI.†
3 Theory
3.1 Electronic structure
Due to the complexity of the NEXAFS spectrum of CO+, a few different computational techniques were applied in order to obtain accurate description of the experimental features. The electronic structure method chosen was the state-average restricted active space self-consistent field (SA-RASSCF),32–34 followed by a multi-state second-order perturbation (MS-RASPT2),35 implemented in the OpenMolcas software.36 The ANO-RCC-VQZP basis set37 along with the auxiliary (8s6p4d) Rydberg basis set were used (with a few exceptions as will be described below) and the simulations were performed in the Abelian point group C2V. Scalar relativistic effects have been included by using a second-order Douglas–Kroll–Hess Hamiltonian,38,39 in combination with the ANO-RCC basis. In the RASPT2 step, an imaginary shift of 0.3 Hartree40 and the default ionization-potential electron-affinity (IPEA) shift of 0.25 Hartree41 were in use. The core-excited states were obtained using the core-valence separation (CVS) method implemented in the OpenMolcas code42,43 and the transition dipole moments in the velocity gauge were obtained by the RAS state-interaction approach.44,45
In order to get the best modeling and description of the different features of CO+ NEXAFS, three different active space configurations were considered. The active space configuration on the RASSCF method is labeled RAS(n, l, m; i, j, k), where i, j, and k are the number of orbitals in RAS1, RAS2, and RAS3 spaces respectively, n is the total number of electrons in the active space, l the maximum number of holes allowed in RAS1, and m the maximum number of electrons in RAS3. In all simulations, the 1s orbital (1σ for oxygen and 2σ for carbon) is placed in the RAS1 space, which is frozen to avoid variational collapse.
For the analysis related to the 2π splitting presented in Section 4.2, we performed only a RASSCF calculation (and aug-cc-pVTZ basis set) with a minimal active space RAS(2,1,0;1,3,0), with the 1s orbital in the RAS1 space and the 5σ and 2π orbitals in RAS2 space, with one electron each. The reason here is that we wanted to showcase that the 2π splitting is intrinsic to the coupling between the three open-shells and is independent of interaction with other molecular orbitals or dynamical correlation. The calculations of the potential energy curves (Fig. 2b) used in the wave packet dynamics (see Section 3.2) were done with an RAS(9,1,0;1,14,0) space. For the simulation of the full spectrum presented in Fig. 1 and 5, an extended RASSCF calculation where all three RAS spaces were used in order to include more orbitals in the active space, leading to a RAS(9,1,3;1,4,20) space, where the 1s orbital as placed in RAS1, the occupied orbitals in RAS2 and unoccupied in RAS3. A maximum of three electrons was allowed in the RAS3 space. The state-average natural molecular orbitals obtained from these calculations are presented in Fig. S1 and S2 (ESI†). To reach the wide range of transition states presented in the experimental NEXAFS, 35 and 30 core-excited states were computed for each of symmetries a1, b1 and b2 (C2V irreducible representation) at carbon and oxygen K-edge, respectively, leading to a total of 135 and 90 core-excited states. No excited states were computed at the a2 symmetry as these states are of delta character, which are dipole forbidden transitions in NEXAFS of CO+ studied here. Further analysis of the size of active space, number of electrons in RAS3, spin–orbit coupling and transition dipole moment gauge were made and are presented in the ESI.†
 |
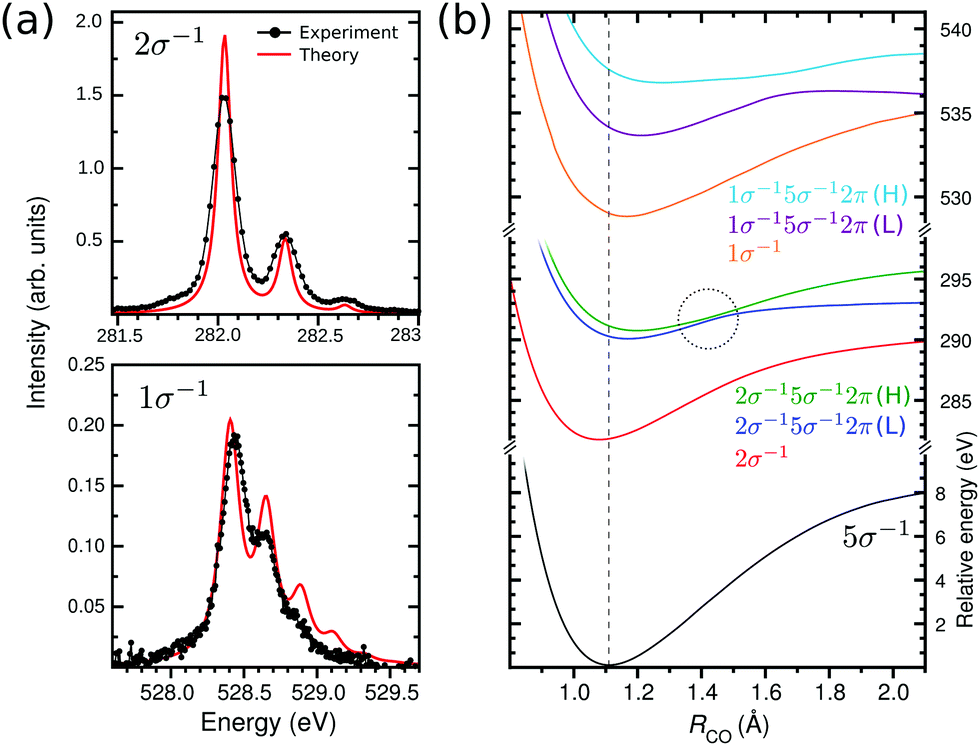
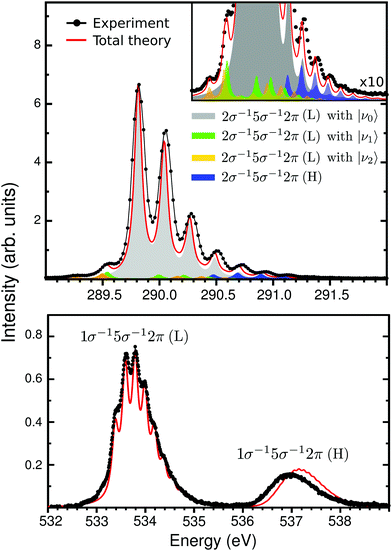
| | Fig. 2 (a) Vibrational X-ray absorption spectrum of CO+ at carbon and oxygen K-edge (solid black) and the calculated spectra (solid red). The theoretical spectra were shifted by −0.25 eV to match the 2σ−15σ−12π (L) band. (b) Potential energy curves used in the calculation of the vibrational XAS spectra at the carbon and oxygen K-edges. The dashed line represents the vertical transition point. The dashed circle shows the point of non-adiabatic coupling between the two 2σ−15σ−12π states. | |
3.2 Wave packet dynamics
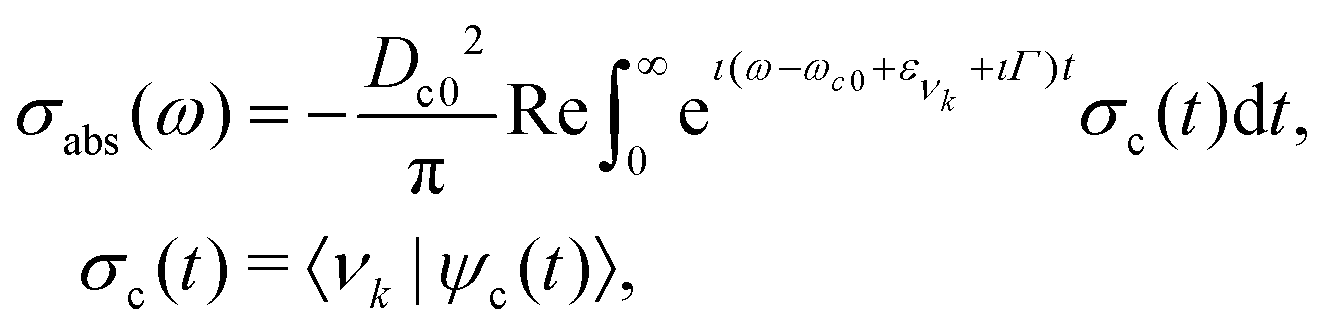
For the vibrational spectrum simulation (Fig. 2a and 3), the quantum wave packet formalism was used. The X-ray absorption cross section in the time-dependent formalism can be defined as46| |  | (1) |
where Dc0 is transition dipole moment between ground and core-excited states (obtained from MS-RASPT2 calculations), ω the incident photon energy, ωc0 the vertical transition energy, ενk the energy of the ground state vibrational level νk, Γ the core-hole HWHM lifetime broadening (39.8 meV for carbon and 79 meV for oxygen). The autocorrelation function σc(t) is defined by the overlap between the ground state vibrational wave function |νk〉 and the core-excited wave packet defined aswith hc as the nuclear Hamiltonian of the core-excited state. The wave packet (2) is obtained by the numerical solution of the time-dependent Schrodinger equation with the ground state vibrational wave function |νk〉. The vibrational spectra shown in Fig. 2a and 3 were computed considering the lowest vibrational level of the ground state |ν0〉, with exception of the hot bands presented in the carbon K-edge 2σ−15σ−12π resonance, where the vibrational levels |ν1〉 and |ν2〉 were used. All wave packet simulations were performed employing the eSPec program.47–49
 |
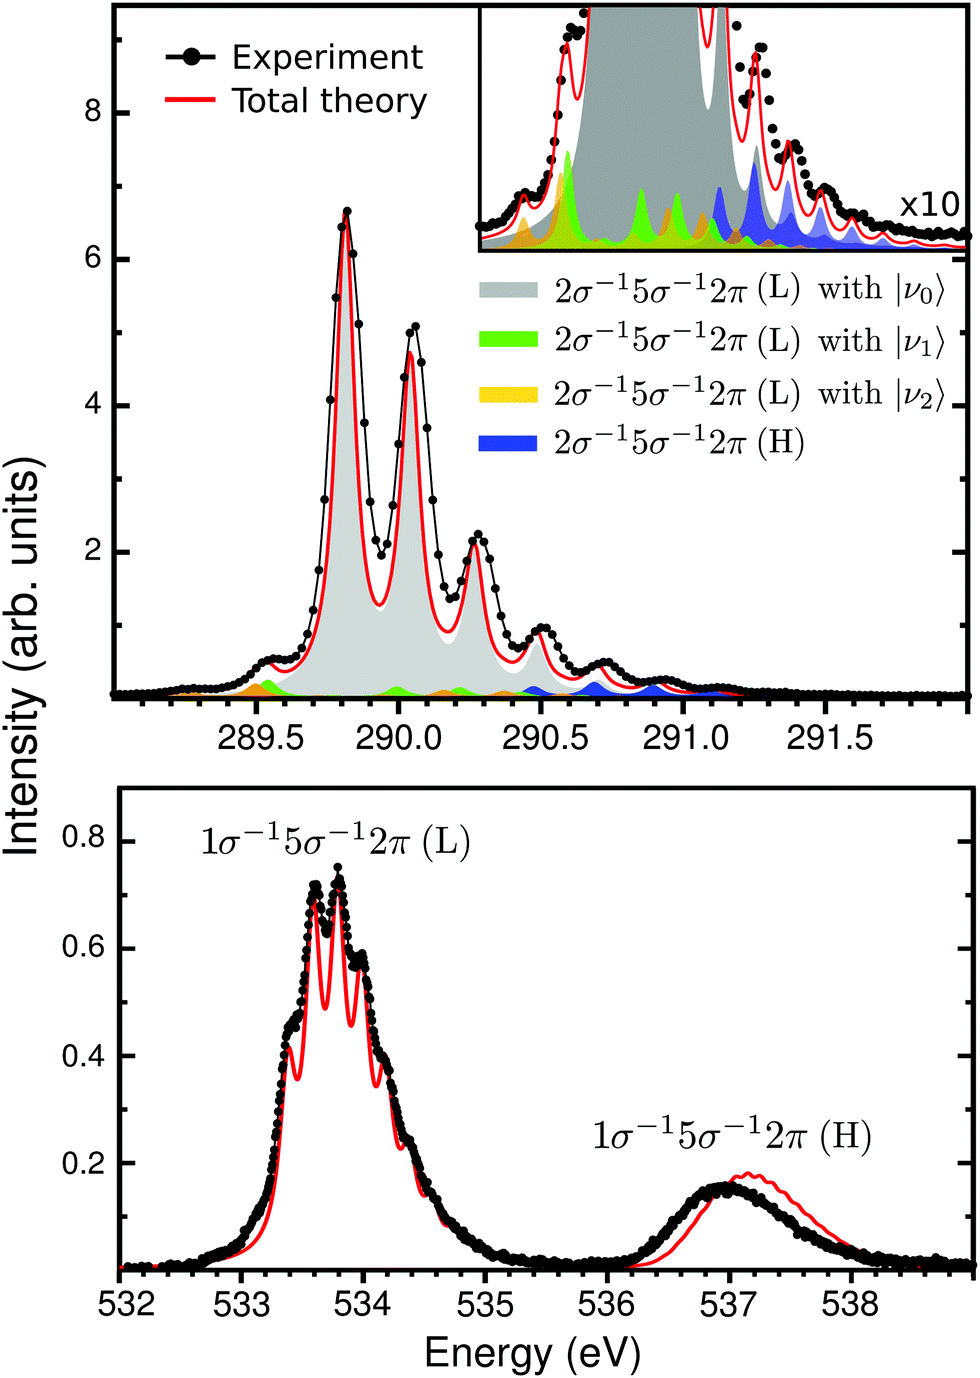
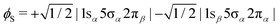
| | Fig. 3 Vibrational X-ray absorption spectrum of CO+ at the carbon (top panel) and oxygen (lower panel) K-edge, experimental (black lines) and calculated (solid red). On the top panel, the colors represents the individual contribution of the theoretical modeling, with the insert showing it in details. The theoretical spectrum was shift by −0.25 eV to match the 2σ−15σ−12π (L) band. | |
4 Results
4.1 Repopulation of 5σ orbital
Let us start with the lowest energy transition region of the NEXAFS spectrum of CO+ (Fig. 1). The repopulation transition from the 5σ−1 ground to the bare core-hole state, C(2σ−1) (at 282 eV) or O(1σ−1) (at 528 eV), shows vibrational fine structure. The wave packet dynamics calculations using the MS-RASPT2 potential energy curves (PEC) (see Section 3) catch nicely the frequency splitting and intensity of these structures (see Fig. 2a). For CO+ spectra, this has particular interest since the molecular orbital that is half filled in the initial state, the 5σ orbital, is of “lone-pair” character, being almost totally localized on the carbon atom with little interatomic overlap. This is also reflected by the small difference in equilibrium geometries, 1.13 versus 1.11 Å, of the neutral ground and 5σ−1 states of CO and CO+, respectively. Thus we can expect the spectra to be similar to the corresponding XPS.50,51
While the vibrational progressions of the repopulation transition appear similar in the carbon and oxygen spectra, with a dominating 0–0 transition and two diminished 0–1 and 0–2 transitions, their origin is completely different. In the carbon case, it corresponds to a shortening of the bond length and in the oxygen case to a lengthening (see Fig. 2b). A rationalization of this phenomena was provided by considering the ESCA potential model for chemical shifts,52 where the shift for a core hole state in an atom depends on the ground state charging of that atom. Therefore, the charge gradient dictates the energy gradient upon core ionization, and as the charge gradients for 1σ−1 and 2σ−1 ionization of CO must be equal in magnitude but of opposite sign, the carbon and oxygen core-hole state bond length must change in opposite directions.53 The ESCA model is a ground state model, and relaxation modifies the geometry shifts (giving positive contributions in all cases), however, the qualitative conclusion still remains. Indeed, the effect is reproduced by the MS-RASPT2 optimization of the core-hole states, see Fig. 2b, indicating a reduction of the bond length of CO+ by 0.03 Å in the 2σ−1 case, and a lengthening of 0.05 Å in the 1σ−1 case, with respect that of the ground state. While the general trends in changes of molecular potentials following core ionization are known, we can expect that future studies of “repopulation transitions” in cationic NEXAFS can yield information about the states of core ionized molecules. The vibrational constants for the 1σ−1 and 2σ−1 states (Fig. 2a), extracted from both experiment and theory as presented in Table 1, are in good agreement.
Table 1 Experimental spectroscopic constants of core-hole excited CO+ as obtained by a Franck–Condon analysis assuming Morse potentials for the initial and final state. Te denotes the bottom of the potential curve, ωe the harmonic frequency, ωeχe the anharmonicity coefficient, and Re the equilibrium bond length. Theoretical vibrational constants are associated with the calculated potential energy curves (Fig. 2) and the theoretical Te values are shifted by −0.25 eV
| State |
Experiment |
Theory |
|
T
e [eV] |
ω
e [meV] |
ω
e
χ
e [meV] |
ΔRe [Å] |
T
e [eV] |
ω
e [meV] |
ω
e
χ
e [meV] |
R
e [Å] |
ΔRe [Å] |
| 5σ−1 |
0 |
— |
— |
— |
0 |
278.70 |
2.04 |
1.113 |
— |
| 2σ−1 |
282.00 |
310.9 ± 20 |
1.4 ± 1.1 |
−0.037 |
282.02 |
307.87 |
2.27 |
1.080 |
−0.033 |
| 2σ−15σ−12π (L) |
289.85 |
243.6 ± 1.5 |
2.9 ± 0.4 |
0.060 |
289.83 |
237.75 |
2.88 |
1.169 |
0.056 |
| 2σ−15σ−12π (H) |
— |
— |
— |
— |
290.50 |
212.60 |
1.78 |
1.198 |
0.085 |
| 1σ−1 |
528.48 |
225.3 ± 15 |
0.3 ± 0.15 |
0.047 |
528.45 |
243.79 |
2.89 |
1.167 |
0.054 |
| 1σ−15σ−12π (L) |
533.44 |
210.1 ± 0.8 |
1.4 ± 0.2 |
0.100 |
533.41 |
212.16 |
2.23 |
1.212 |
0.099 |
| 1σ−15σ−12π (H) |
— |
— |
— |
— |
536.55 |
99.28 |
60.11 |
1.280 |
0.167 |
4.2 The 2π splitting
The second part of the CO+ NEXAFS contains the most intense bands (Fig. 1), at 290 eV for carbon K-edge and between 533–538 eV for oxygen. These features are related to the core-excitation to the 2π (π*) orbital, with the open-shell 5σ orbital as spectator. First, let us focus on the carbon edge (Fig. 3 top panel). In the experimental spectrum, this band appears to be related to a single transition with a well defined vibrational progression. This is surprising since there are two independent spin coupled states that are expected from a three-open shell system, like in the oxygen K-edge spectrum (see Fig. 3 bottom panel). Only through our MS-RASPT2 and wave packet simulations we can predict the splitting and spectral intensities of the 2σ−15σ−12π state, which is related to the coupling between singlet and triplet open-shells, one with high and the other with exceedingly small intensity. However, with the current experimental accuracy, this cannot be observed. For clarity, these two 2π states are labeled low (L) and high (H), related to their energy. The presence of the 2σ−15σ−12π (H) transition leads to a predicted longer total vibrational progression, extending to 291.5 eV, which contrasts with the 2σ−15σ−12π (L) vibrational progression which fades at around 290.8 eV. In addition, transitions from vibrationally excited initial states, related to the gas-discharge ion source, are seen at 289.5 eV. Through our wave packet simulations, they can be assigned to the 2σ−15σ−12π (L) transition starting from the ground electronic state vibrational levels ν1 and ν2 (see Section 3.2 for details). At the oxygen edge this can also be seen at around 533 eV, but is less pronounced. Furthermore, a direct comparison of the experimental and total theoretical 2σ−15σ−12π spectrum at the carbon edge, shows a smaller vibrational frequency on the theory side, with a peak shift of 25 meV at ν = 5. This is related to the shape of the 2σ−15σ−12π PECs. In Fig. 2b, a point of avoided crossing is highlighted between the low and high 2σ−15σ−12π PECs, at around 1.5 Å, where the two 2π states become closer. This avoided crossing is associated with a non-adiabatic coupling between the two states. The possible vibronic coupling was tested through the approach described by Couto et al.,54,55 but no significant changes in the spectral profile were seen, due to the crossing being above the vertical transition point (Franck–Condon region) from the ground state PEC (1.5 eV for 2σ−15σ−12π (L) and 0.7 eV for 2σ−15σ−12π (H)). At the oxygen edge (Fig. 3 bottom panel) the PECs of the 1σ−15σ−12π states are well separated (Fig. 2b) and the vibrational progression peaks of the theoretical spectrum overlaps well with the experimental ones. The carbon and oxygen K-edge vibrational constants were computed from both experimental and theoretical data, and are reported in Table 1. For the carbon edge, with well separated vibrational structure, there is a very good agreement between experimentally and theoretically obtained vibrational constants. One should notice that the transition to a 2σ−15σ−12π state at the carbon edge has earlier been reported in the photoelectron satellite spectra of CO,56–59 but which appear differently from NEXAFS.
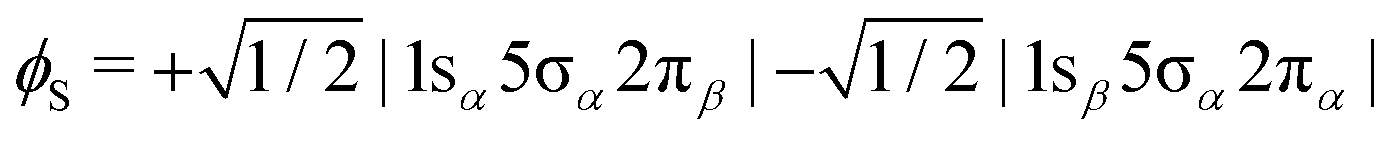
In order to shed light on the appearance and major differences between the carbon and oxygen 2π spectra (Fig. 3), let us consider a minimal open-shell RASSCF calculation with only three orbitals 1s (1σ or 2σ), 5σ and 2π, and one electron occupation in each (the one-particle basis set is described in Section 3). The two doublet electronic states that can be reached by a dipole transition from the doublet 5σ−1 ground state of CO+, are projected (assuming ms = 1/2 for both initial and final states) on only three determinants: |1sα5σα2πβ|, |1sα5σβ2πα| and |1sβ5σα2πα|. Given the ground state of CO+, the following linear combinations could be considered an obvious choice for the spin coupling
| |  | (3) |
| | 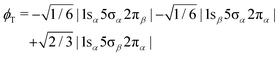 | (4) |
In fact they define configuration state functions where the indices S and T refer to the spin coupling (singlet and triplet, respectively) of the 1s → 2π excitation, followed by coupling to 5σ. In first approximation we can assume that the transition dipole moment to
ϕT is null, even if this is strictly true only in the frozen orbital approximation. However, we will see that a picture based on singlet/triplet excitations can be miss leading because the
ϕS and
ϕT configurations may strongly interact as they are eigenstates of
S2 but not of the Hamiltonian. Focusing on the carbon K-edge NEXAFS (1s = 2σ), by diagonalizing the Hamiltonian over the three determinants, we get two (low (L) and high (H)) eigenstates
| | | ψCL = +0.75|2σα5σα2πβ| − 0.10|2σα5σβ2πα| − 0.65|2σβ5σα2πα| = +0.99ϕS − 0.12ϕT | (5) |
| ψCH = −0.32|2σα5σα2πβ| + 0.81|2σα5σβ2πα| − 0.49|2σβ5σα2πα| = +0.12ϕS + 0.99ϕT |
where the coefficients were obtained from the RASSCF calculations mentioned above. By the expressions in
eqn (5), we can see that the eigenstates correspond to a limited mixing of the two configurations
ϕS and
ϕT. With the reasonable assumption that the transition dipole moment to
ϕT is negligible in comparison to that to
ϕS, the ratio of the intensities for the dipole transitions to the levels L and H can be roughly estimated from the values of the expansion coefficient on
ϕS in
eqn (5) as (0.99/0.12)
2 = 68, in qualitative agreement with both experiment and our more accurate MS-RASPT2 results in
Fig. 3. The situation is different at the oxygen K-edge. In fact, by the diagonalization of the Hamiltonian projected on the three considered determinants, we get
| | | ψOL = +0.38|1σα5σα2πβ| + 0.43|1σα5σβ2πα| − 0.81|1σβ5σα2πα| = +0.85ϕS + 0.53ϕT | (6) |
| ψOH = −0.72|1σα5σα2πβ| + 0.69|1σα5σβ2πα| + 0.03|1σβ5σα2πα| = −0.53ϕS + 0.85ϕT. |
In this case, the mixing of the two configurations is much larger and the transition intensity is comparable for both lower and upper level. The estimated intensity ratio is (0.85/0.53)
2 = 2.6, in qualitative agreement with both experiment and MS-RASPT2 results shown in
Fig. 3. The configuration interaction seeing here is due to an (exchange) term proportional to ([1s,5σ|5σ,1s] + [2π,5σ|5σ,2π]) (Mulliken notation), that can be comparable to the difference of the diagonal terms of the 2 × 2 Hamiltonian matrix. Such difference is relatively small in the case of spin split core-excitations from an open shell ground state. The redistribution of intensity between the two eigenstates
ψ (
eqn (5) and (6)) is well described by a simple diagonalization over the two “spin-coupled” configurations
ϕ (
eqn (3)), because such two excitations are energetically well separated from the other excitations in the NEXAFS spectrum. For higher excitations, where several diagonal terms can be closer to each other, the configuration space will in general be larger than two and the intensity redistribution more complex.
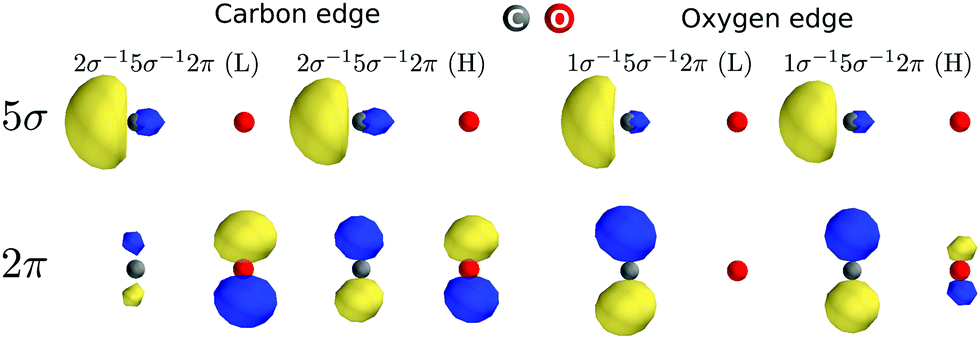
The 2π splitting effect appears differently in the carbon and oxygen K-edge of CO+ just because of different values of the exchange integrals that rule the energy splitting and the coupling of the two doublet configurations (see Table S1 from ESI†). These values are in turn dependent on the localization of the molecular orbitals (see Fig. 4). We can see that the molecular orbitals localize quite differently upon opening the 1σ and 2σ core holes. For instance, the value of the [2π,5σ|5σ2π] exchange integral, which largely dictates the splitting of the two 2π states, is considerably larger for oxygen than for carbon. This is due to the co-localization of the 5σ and 2π orbitals (in fact on the carbon site) in the case of the oxygen core hole, while the two orbitals localize on different sites in the case of the carbon K-edge. A strong evidence of this localization effect is also highlighted by the singlet and triplet double-ionization potentials (1s−15σ−1) represented by the dashed lines in Fig. 1. At the carbon K-edge, the splitting between singlet and triplet 2σ−15σ−1 ionization thresholds is about 3.5 eV, while at the oxygen K-edge they are almost degenerate. This reflects clearly that the exchange integral [1s,5σ|5σ,1s] is larger at the carbon K-edge, as both holes are localized on the carbon atom, leading to a bigger separation between the ionization potentials, while the opposite holds at the oxygen K-edge. Finally, although the intensity redistribution due to the interaction between the two 2π configurations defined above is considerable, it is questionable if this should be called “electron correlation” in the sense of Löwdin's definition, as only configurations with different spin coupling and not orbital constitution are involved. However, the situation is very different in the remaining spectrum, where strong electron correlation appears.
 |
| | Fig. 4 The 5σ and 2π natural orbitals density for 1s−15σ−12π (L) and (H) core-excited states at the carbon and oxygen edges. | |
4.3 High-energy region
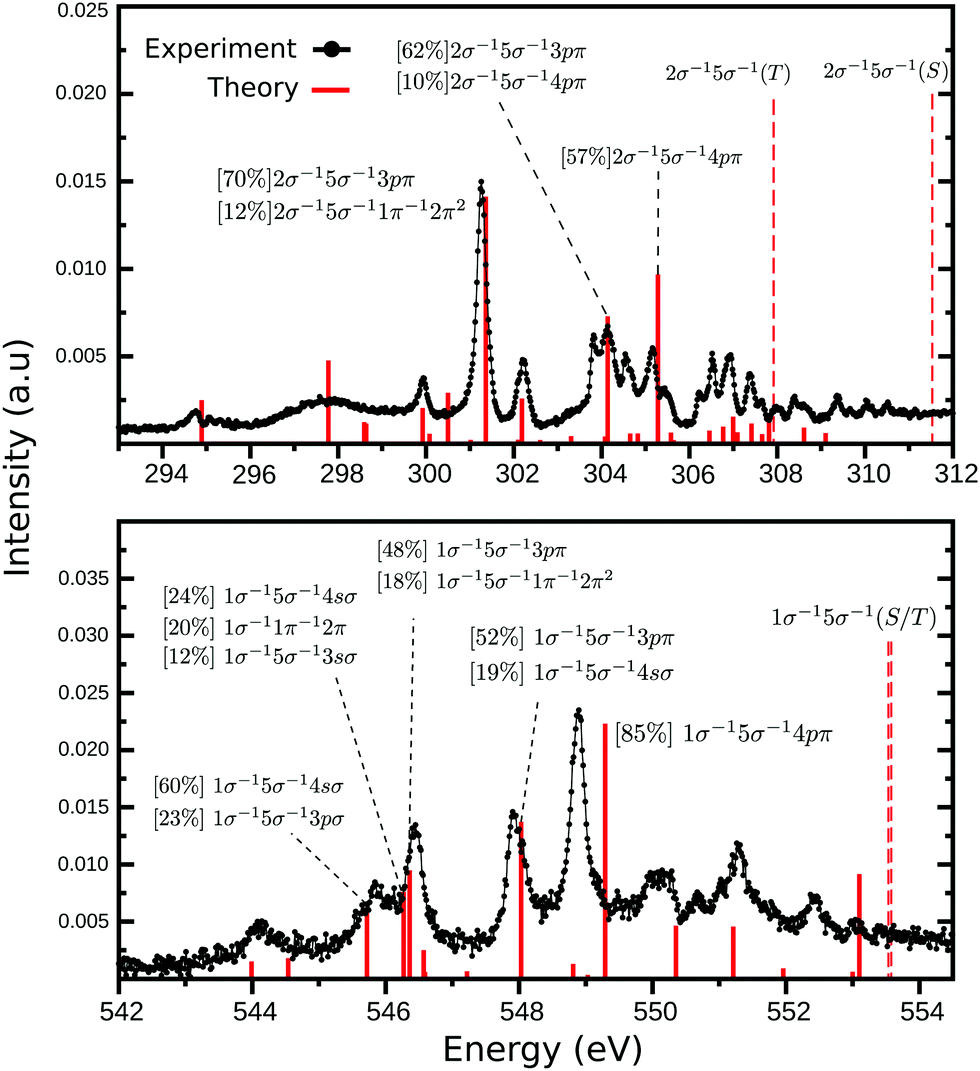
The third and last part of the CO+ NEXAFS spectra, shows a wide and very irregular spectral structure evolve, from 294 to 312 eV at the carbon edge, and from 543 to 554 eV at the oxygen edge (see Fig. 1 and 5). These have seemingly no reminiscence at all of progressive mixed valence-Rydberg or Rydberg transitions converging to the edges as often observed in NEXAFS of neutral molecules. While in the neutral CO NEXAFS22,25 spectra two-electron two-hole transitions are observed as faint structures above the ionization threshold, in CO+ they are observed as being mixed with the Rydberg ones below the ionization edge (see Fig. 5 and Tables S3–S5 of ESI†). The MS-RASPT2 calculations assign a number of transitions to these regions, most of them of multiconfigurational character, but yet, quite a few have a dominating configuration with a one-electron excitation keeping the 5σ hole as a spectator.
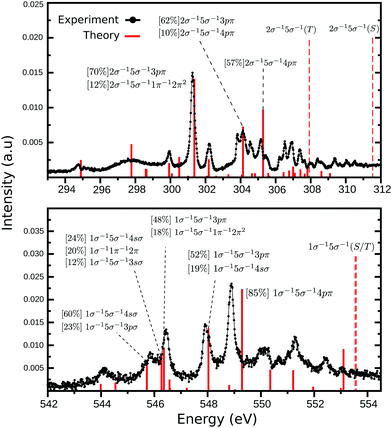 |
| | Fig. 5 High energy part of NEXAFS spectra presented in Fig. 1 for carbon (top) and oxygen (bottom) K-edges. The assignment of all transitions presented here can be found in the ESI.† The dashed lines represents the singlet and triplet double ionization potentials. | |
It can be instructive to compare carbon and oxygen in this part of the spectrum, as they have exactly the same form of the MS-RASPT2 wave function and basis set. In both cases, the strongest peaks are related to the excitation to Rydberg-like orbitals (Fig. 5), namely the 3sσ, 4sσ, 3pπ and 4pπ, being just a couple of cases where this configuration has strong CI dominance, i.e., above 70%. Higher Rydberg transitions are also populated but with much less intensity (see ESI†). This is also a token of strong correlation effects, as a one particle transition turns up in more than one state and prohibits a one-to-one mapping of states and orbitals. In the carbon spectrum, the 3p is stronger than 4p transition, as one normally expects for neutral molecules, while the reverse holds for oxygen. The lack of an one-to-one mapping between orbitals and states indicates a breakdown of the molecular orbital picture. NEXAFS of cations demonstrates a special form of this breakdown, which is due to semi-internal transitions, where one internal transition filling the singly occupied open molecular orbital is coupled with an external core-to-unoccupied orbital transition. In our recently analyzed spectrum of N2+,27 many of these semi-internal transitions were predicted and observed. It seems that for CO+ there are fewer of them, in particular for oxygen K-edge NEXAFS, mainly residing at low energy with rather low intensity.
Another striking difference between the carbon and oxygen edges is the density of states. While at the carbon edge our theoretical simulations shows 43 transition between 294 and 308 eV (around 14 eV range), at the oxygen edge only 21 transitions are predicted between 532 and 542 eV (around 10 eV range). This difference is mostly due to the semi-internal transitions of which there are more at the carbon edge, and recalling that 5σ is a carbon orbital, we find it compelling that there seemingly is a local, one-center, selection operating also for these semi-internal transitions. It is notable that for neutral CO, the NEXAFS spectrum also has a richer profile at the carbon edge,22,60 something that also is deeply related to particular localization of molecular orbitals in this molecule. Some of the disagreement between theory and experiment can be related to the absence of vibrational fine structure in the simulation of the high energy region, which would result in many more peaks. Also, other factors related to the electronic structure modelling influences the accuracy of our results. This is addressed in the ESI.†
One last salient difference between the carbon and oxygen spectra is the strong split of the singlet and triplet double ionization potentials in the carbon case (2σ−15σ−1(S) = 311.53 and 2σ−15σ−1(T) = 307.92 eV), and the near degeneracy of these ionization potentials in the oxygen case (1σ−15σ−1(T) = 553.53 and 1σ−15σ−1(S) = 553.57 eV). This has the interesting consequence that fine structure is observed between the two thresholds in the carbon case. The computed discrete line spectrum is not a good representation of the continuum and requires a normalization which “smooths out” transitions. However, in this particular and unique case, the discrete spectrum of one channel overlaps the continuum part of the other. Discrete continuum interaction leads generally to bands with Fano profiles. These features are too weak and too dense to be observed here, and the fact that the two channels are built from different spin parent couplings may indicate that the interaction is quite weak. This could be the subject for a further special investigation.
5 Conclusion
The NEXAFS spectra of CO+ display rich structures relating to vibrational and spin coupled highly excited electronic transitions, with no counterpart in NEXAFS of closed shell molecules. As shown in the present work, they call for a theoretical analysis that includes localization, relaxation, spin-coupling and correlation effects. The direct comparison between carbon and oxygen K-edges, computed with the same form of the wave function, shows distinct and salient differences. The repopulation of the open molecular orbital in the initial state provides additional and complementary information on the core hole state of the neutral molecule normally seen in XPS, which shows opposite trends in bond length changes for C(1s) and O(1s) ionization of CO. The spin split core-valence transitions were found surprisingly and delicately dependent on fundamental Coulomb and exchange interactions and orbital localization. The wide high energy part of the spectra exhibits exceedingly detailed and irregular structures for which a one-to-one mapping between orbitals and states cannot be made. It displays that the molecular orbital picture breaks down and is replaced by a situation where Rydberg one-electron and two-electron two-hole transitions coexist. We can conclude that the appearance of the spectra in all three parts are dictated by the localization of the singly occupied 5σ ground state orbital, proposing that the ionic NEXAFS technique has potential for chemical analysis. Our study indicates that NEXAFS of ions introduces a new field of X-ray spectroscopy of highly excited molecular systems, unravelling completely novel features that call for in depth understanding and theoretical analysis. It is our belief that the CO+ NEXAFS spectra presented here can serve as benchmark for further exploration of molecular ions of different character and size.
Conflicts of interest
There are no conflicts to declare.
Acknowledgements
R. C. C. and H. Å. thank Dr Xin Li for providing the exchange integrals calculations. The beamtime for this project was granted at BESSY II beamline UE52-PGM, operated by Helmholtz-Zentrum Berlin. The simulations were performed on resources provided by the Swedish National Infrastructure for Computing (SNIC) at the National Supercomputer Center (NSC), through the project “Multiphysics Modeling of Molecular Materials” (SNIC 2019/2-41). This project has received funding from the European Union's Horizon 2020 research and innovation programme under grant agreement no. 730872 and by the German Federal Ministry of Education and Research (BMBF) through Grant No. BMBF-05K16Vf2. R. L. and J.-E. R. acknowledge funding from the Swedish Research Council, contract 637-2014-6929, and 2014-04518, respectively.
Notes and references
-
J. Stöhr, NEXAFS Spectroscopy, Springer Verlag, Berlin, 1992 Search PubMed.
-
J. Berkowitz, Photoabsorption, Photoionization and Photoelectron Spectroscopy, Academic Press, New York, 1979 Search PubMed.
- K. Ueda, J. Phys. B: At., Mol. Opt. Phys., 2003, 36, R1–R47 CrossRef CAS.
-
S. Svanberg, Atomic and Molecular Spectroscopy: Basic Aspects and Practical Applications, Springer, Berlin, 2003 Search PubMed.
- K. Hirsch, J. T. Lau, P. Klar, A. Langenberg, J. Probst, J. Rittmann, M. Vogel, V. Zamudio-Bayer, T. Möller and B. von Issendorff, J. Phys. B: At., Mol. Opt. Phys., 2009, 42, 154029 CrossRef.
- V. Zamudio-Bayer, K. Hirsch, A. Langenberg, M. Kossick, A. aawicki, A. Terasaki, B. v. Issendorff and J. T. Lau, J. Chem. Phys., 2015, 142, 234301 CrossRef CAS PubMed.
- V. Zamudio-Bayer, K. Hirsch, A. Langenberg, A. aawicki, A. Terasaki, B. v. Issendorff and J. T. Lau, J. Chem. Phys., 2015, 143, 244318 CrossRef CAS PubMed.
- V. Zamudio-Bayer, K. Hirsch, A. Langenberg, M. Niemeyer, M. Vogel, A. Lawicki, A. Terasaki, J. T. Lau and B. von Issendorff, Angew. Chem., Int. Ed., 2015, 54, 4498–4501 CrossRef CAS PubMed.
- V. Zamudio-Bayer, R. Lindblad, C. Bülow, G. Leistner, A. Terasaki, B. v. Issendorff and J. T. Lau, J. Chem. Phys., 2016, 145, 194302 CrossRef CAS PubMed.
- S. Schippers, A. L. D. Kilcoyne, R. A. Phaneuf and A. Müller, Contemp. Phys., 2016, 57, 215–229 CrossRef CAS.
- J.-P. Mosnier, E. T. Kennedy, P. van Kampen, D. Cubaynes, S. Guilbaud, N. Sisourat, A. Puglisi, S. Carniato and J.-M. Bizau, Phys. Rev. A, 2016, 93, 061401 CrossRef.
- T. A. Miller and V. E. Bondybey, Appl. Spectrosc. Rev., 1982, 18, 105–169 CrossRef CAS.
- F. Qi, Proc. Combust. Inst., 2013, 34, 33–63 CrossRef CAS.
- E. F. van Dishoeck, Faraday Discuss., 2014, 168, 9–47 RSC.
- O. Novotný, P. Wilhelm, D. Paul, Á. Kálosi, S. Saurabh, A. Becker, K. Blaum, S. George, J. Göck, M. Grieser, F. Grussie, R. von Hahn, C. Krantz, H. Kreckel, C. Meyer, P. M. Mishra, D. Muell, F. Nuesslein, D. A. Orlov, M. Rimmler, V. C. Schmidt, A. Shornikov, A. S. Terekhov, S. Vogel, D. Zajfman and A. Wolf, Science, 2019, 365, 676–679 CrossRef PubMed.
- H. B. Pedersen, S. Altevogt, B. Jordon-Thaden, O. Heber, M. L. Rappaport, D. Schwalm, J. Ullrich, D. Zajfman, R. Treusch, N. Guerassimova, M. Martins, J.-T. Hoeft, M. Wellhöfer and A. Wolf, Phys. Rev. Lett., 2007, 98, 223202 CrossRef CAS PubMed.
- H. B. Pedersen, L. Lammich, C. Domesle, B. Jordon-Thaden, O. Heber, J. Ullrich, R. Treusch, N. Guerassimova and A. Wolf, Phys. Rev. A: At., Mol., Opt. Phys., 2010, 82, 023415 CrossRef.
- M. Larsson, Annu. Rev. Phys. Chem., 1997, 48, 151–179 CrossRef CAS.
- D. A. Shaw, G. C. King, D. Cvejanovic and F. H. Read, J. Phys. B: At., Mol. Opt. Phys., 1984, 17, 2091–2100 CrossRef CAS.
- M. Neeb, J.-E. Rubensson, M. Biermann and W. Eberhardt, J. Electron Spectrosc. Relat. Phenom., 1994, 67, 261–274 CrossRef CAS.
- D. Cvetko, L. Floreano, R. Gotter, A. M. Malvezzi, L. Marassi, A. Morgante, G. Naletto, A. Santaniello, G. Stefani, F. Tommasini, G. Tondello and A. Verdini, Proc. SPIE, 1997, 3150, 86–96 CrossRef CAS.
- R. Püttner, I. Dominguez, T. J. Morgan, C. Cisneros, R. F. Fink, E. Rotenberg, T. Warwick, M. Domke, G. Kaindl and A. S. Schlachter, Phys. Rev. A: At., Mol., Opt. Phys., 1999, 59, 3415–3423 CrossRef.
- M. Coreno, M. de Simone, K. Prince, R. Richter, M. Vondráček, L. Avaldi and R. Camilloni, Chem. Phys. Lett., 1999, 306, 269–274 CrossRef CAS.
- G. Fronzoni, M. Stener, A. Lisini and P. Decleva, Chem. Phys., 1996, 210, 447–459 CrossRef CAS.
- H. Ågren and R. Arneberg, Phys. Scr., 1984, 30, 55–58 CrossRef.
- H. Ågren, V. Carravetta, O. Vahtras and L. G. M. Pettersson, Theor. Chem. Acc., 1997, 97, 14–40 Search PubMed.
- R. Lindblad, L. Kjellsson, R. C. Couto, M. Timm, C. Bülow, V. Zamudio-Bayer, M. Lundberg, B. von Issendorff, J. T. Lau, S. L. Sorensen, V. Carravetta, H. Ågren and J.-E. Rubensson, Phys. Rev. Lett., 2020, 124, 203001 CrossRef CAS.
- H. Hotop and A. Niehaus, Int. J. Mass Spectrom., 1970, 5, 415–441 CrossRef CAS.
- D. Yee, W. Stewart, C. McDowell and C. Brion, J. Electron Spectrosc. Relat. Phenom., 1975, 7, 93–117 CrossRef CAS.
- M. R. Weiss, R. Follath, K. J. S. Sawhney and T. Zeschke, Nucl. Instrum. Methods Phys. Res., 2001, 467–468, 482–484 CrossRef CAS.
- T. A. Dixon and R. C. Woods, Phys. Rev. Lett., 1975, 34, 61 CrossRef CAS.
- H. J. A. Jensen, P. Jørgensen and H. Ågren, J. Chem. Phys., 1987, 87, 451–466 CrossRef CAS.
- P. Å. Malmqvist, A. Rendell and B. O. Roos, J. Phys. Chem., 1990, 94, 5477–5482 CrossRef CAS.
- H. Ågren, A. Flores-Riveros and H. Jensen, Phys. Scr., 1989, 40, 745–750 CrossRef.
- P. Å. Malmqvist, K. Pierloot, A. R. M. Shahi, C. J. Cramer and L. Gagliardi, J. Chem. Phys., 2008, 128, 204109 CrossRef.
- I. Fdez. Galván, M. Vacher, A. Alavi, C. Angeli, F. Aquilante, J. Autschbach, J. J. Bao, S. I. Bokarev, N. A. Bogdanov and R. K. Carlson,
et al.
, J. Chem. Theory Comput., 2019, 15, 5925–5964 CrossRef.
- B. O. Roos, R. Lindh, P.-Å. Malmqvist, V. Veryazov and P.-O. Widmark, J. Phys. Chem. A, 2004, 108, 2851–2858 CrossRef CAS.
- M. Douglas and N. M. Kroll, Ann. Phys., 1974, 82, 89–155 CAS.
- B. A. Hess, Phys. Rev. A: At., Mol., Opt. Phys., 1986, 33, 3742–3748 CrossRef CAS.
- N. Forsberg and P.-Å. Malmqvist, Chem. Phys. Lett., 1997, 274, 196–204 CrossRef CAS.
- G. Ghigo, B. O. Roos and P.-Å. Malmqvist, Chem. Phys. Lett., 2004, 396, 142–149 CrossRef CAS.
- L. S. Cederbaum, W. Domcke and J. Schirmer, Phys. Rev. A: At., Mol., Opt. Phys., 1980, 22, 206–222 CrossRef CAS.
- M. G. Delcey, L. K. Sorensen, M. Vacher, R. C. Couto and M. Lundberg, J. Comput. Chem., 2019, 40, 1789–1799 CrossRef CAS PubMed.
- P.-A. Malmqvist and B. O. Roos, Chem. Phys. Lett., 1989, 155, 189–194 CrossRef CAS.
- P. A. Malmqvist, B. O. Roos and B. Schimmelpfennig, Chem. Phys. Lett., 2002, 357, 230–240 CrossRef CAS.
- F. Gel'mukhanov and H. Ågren, Phys. Rep., 1999, 312, 87–330 CrossRef.
- V. C. Felicíssimo, F. F. Guimarães, F. Gel'mukhanov, A. Cesar and H. Ågren, J. Chem. Phys., 2005, 122, 094319 CrossRef.
- R. C. Couto, V. V. Cruz, E. Ertan, S. Eckert, M. Fondell, M. Dantz, B. Kennedy, T. Schmitt, A. Pietzsch, F. F. Guimarães, H. Ågren, F. Gel'mukhanov, M. Odelius, V. Kimberg and A. Föhlisch, Nat. Commun., 2017, 8, 14165 CrossRef CAS PubMed.
- V. Vaz da Cruz, E. Ertan, R. C. Couto, S. Eckert, M. Fondell, M. Dantz, B. Kennedy, T. Schmitt, A. Pietzsch, F. F. Guimarães, H. Ågren, F. Gel'mukhanov, M. Odelius, A. Föhlisch and V. Kimberg, Phys. Chem. Chem. Phys., 2017, 19, 19573–19589 RSC.
- T. X. Carroll, K. J. Børve, L. J. Sæthre, J. D. Bozek, E. Kukk, J. A. Hahne and T. D. Thomas, J. Chem. Phys., 2002, 116, 10221–10228 CrossRef CAS.
- M. Matsumoto, K. Ueda, E. Kukk, H. Yoshida, T. Tanaka, M. Kitajima, H. Tanaka, Y. Tamenori, K. Kuramoto, M. Ehara and H. Nakatsuji, Chem. Phys. Lett., 2006, 417, 89–93 CrossRef CAS.
-
K. Siegbahn, ESCA Applied to Free Molecules, North-Holland Pub. Co., 1970 Search PubMed.
- H. Ågren, Chem. Phys. Lett., 1981, 83, 149–150 CrossRef.
- R. C. Couto, M. Guarise, A. Nicolaou, N. Jaouen, G. S. Chiuzbăian, J. Lüning, V. Ekholm, J.-E. Rubensson, C. Såthe and F. Hennies,
et al.
, Phys. Rev. A, 2016, 93, 032510 CrossRef.
- R. C. Couto, M. Guarise, A. Nicolaou, N. Jaouen, G. S. Chiuzbaian, J. Lüning, V. Ekholm, J.-E. Rubensson, C. Såthe, F. Hennies, V. Kimberg, F. F. Guimarães, H. Agren, F. Gel'mukhanov, L. Journel and M. Simon, Sci. Rep., 2016, 6, 20947 CrossRef CAS PubMed.
- L. Medhurst, P. Heimann, M. Siggel, D. Shirley, C. Chen, Y. Ma, S. Modesti and F. Sette, Chem. Phys. Lett., 1992, 193, 493–498 CrossRef CAS.
- H. Köppe, A. Kilcoyne, J. Feldhaus and A. Bradshaw, J. Electron Spectrosc. Relat. Phenom., 1995, 75, 97–108 CrossRef.
- K. Ueda, M. Hoshino, T. Tanaka, M. Kitajima, H. Tanaka, A. De Fanis, Y. Tamenori, M. Ehara, F. Oyagi, K. Kuramoto and H. Nakatsuji, Phys. Rev. Lett., 2005, 94, 243004 CrossRef.
- M. Ehara, K. Kuramoto, H. Nakatsuji, M. Hoshino, T. Tanaka, M. Kitajima, H. Tanaka, A. De Fanis, Y. Tamenori and K. Ueda, J. Chem. Phys., 2006, 125, 114304 CrossRef CAS.
- M. Domke, C. Xue, A. Puschmann, T. Mandel, E. Hudson, D. Shirley and G. Kaindl, Chem. Phys. Lett., 1990, 173, 122–128 CrossRef CAS.
Footnote |
| † Electronic supplementary information (ESI) available: Details of the electronic structure calculations, experimental vibrational constants extraction and assignment of all theoretical transitions. See DOI: 10.1039/d0cp02207a |
|
| This journal is © the Owner Societies 2020 |
Click here to see how this site uses Cookies. View our privacy policy here. 
 Open Access Article
 This Open Access Article is licensed under a Creative Commons Attribution-Non Commercial 3.0 Unported Licence
 *a,
Ludvig
Kjellsson
*a,
Ludvig
Kjellsson