 Open Access Article
Impact of binding to the multidrug resistance regulator protein LmrR on the photo-physics and -chemistry of photosensitizers†
Sara H.
Mejías
 *,
Gerard
Roelfes
 and
Wesley R.
Browne
 *
*
Stratingh Institute for Chemistry, University of Groningen, Nijenborgh 4, 9747 AG, Groningen, The Netherlands. E-mail: w.r.browne@rug.nl
First published on 11th May 2020
Abstract
Light activated photosensitizers generate reactive oxygen species (ROS) that interfere with cellular components and can induce cell death, e.g., in photodynamic therapy (PDT). The effect of cellular components and especially proteins on the photochemistry and photophysics of the sensitizers is a key aspect in drug design and the correlating cellular response with the generation of specific ROS species. Here, we show the complex range of effects of binding of photosensitizer to a multidrug resistance protein, produced by bacteria, on the formers reactivity. We show that recruitment of drug like molecules by LmrR (Lactococcal multidrug resistance Regulator) modifies their photophysical properties and their capacity to induce oxidative stress especially in 1O2 generation, including rose bengal (RB), protoporphyrin IX (PpIX), bodipy, eosin Y (EY), riboflavin (RBF), and rhodamine 6G (Rh6G). The range of neutral and charged dyes with different exited redox potentials, are broadly representative of the dyes used in PDT.
Introduction
Photosensitizers (PS) that generate reactive oxygen species (ROS), primarily singlet oxygen (1O2) by triplet energy transfer, but also superoxide and hydroxyl radicals, are key tools in the study of damage to cellular components such as proteins, nucleic acids, or/and lipids caused by ROS,1–4 as well as, in photodynamic therapy (PDT).5–8 A challenge encountered in the use of especially singlet oxygen photosensitizers in biological environments is the effect that cellular components have on their activity and the type and fate of the ROS species generated, especially in comparison to their photochemistry in, e.g., aqueous or organic media.Organisms respond to reactive oxygen species (ROS) using redox active proteins through a set of reversible, e.g., with methionine (Met) and cysteine (Cys) and irreversible, oxidation of tryptophan (Trp) and tyrosine (Tyr) residues and the protein backbone.9 In addition to passive interference, bacterial cells trap ‘drug-like’ molecules for transport out of the cell using so called multidrug resistance (MDR) transporters. MDRs regulate removal of a wide variety of chemically distinct compounds from the cell, reducing the efficacy of drugs.10 The LmrR (Lactococcal multidrug resistance Regulator) protein, for example, is primarily responsible for the multidrug resistance in Lactococcus lactis bacteria.11–13 The LmrR protein used in this study is a drug resistance regulator in bacteria.14,15 Although it is responsible for sensing foreign molecules and stimulating the transport system, the mechanism for transport out of cells involves binding of the foreign species within protein environments such as in LmrR.11,16,17
It is a homodimeric protein, which binds with relatively high affinities to, e.g., the DNA-binding compounds Hoechst 33342, daunomycin, ethidium bromide, and rhodamine 6G, by sandwiching them between the tryptophan residues present within its hydrophobic pocket (Fig. 1).11,18,19 LmrR's structure provides for a broad and shallow conformational energy surface in which the conformation can shift readily to accommodate structurally unrelated compounds.19 Interaction of the protein LmrR with photoactive compounds, allows exploration of the effect of inclusion within proteins through, e.g., transition dipole moments and energetics of bound molecules through the electric fields produced by charged amino acids and/or non-specific interactions,20–23 on their photophysical and photochemical properties.
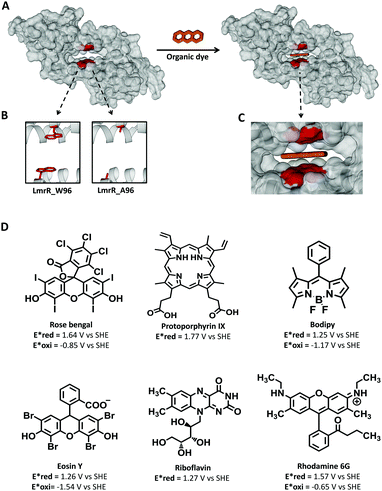 | ||
| Fig. 1 (A) Left, space filled representation of dimeric LmrR (pdb 3F8B) with an expansion of the hydrophobic pocket; right, same representation but with the organic dye filling the pocket. Organic dye is represented as three orange rings. (B) Cartoon representation of the LmrR_W96 pocket with a tryptophan in the 96 position, left, and LmrR_A96 pocket with alanine at 96 position, right. (C) Zooming of the dye filled LmrR_pocket. (D) Photosensitizers used in the current study with their reduction (Ered*) and oxidation (Eoxi*) potential of the photoexcited state. | ||
Here we make use the promiscuity of LmrR to bind small molecules to provide a platform on which to establish the effect of binding on the photophysical and photochemical properties of a wide range of commonly used 3O2 sensitizers, including rose bengal (RB), protoporphyrin IX (PpIX), bodipy, eosin Y (EY), riboflavin (RBF), and rhodamine 6G (Rh6G) (Fig. 1D).24–30 The selected dyes are neutral or charged dyes with different exited state redox potentials and intersystem crossing quantum yields as a broad representation of the dyes used in PDT. The photophysical and chemical properties of the selected dyes are known to be strongly influenced by their environment.31–37 Predicting the changes that occur in the hydrophobic pocket of LmrR is challenging as changes in aromatic interactions (e.g., the interaction with tryptophans), the local environment, nature of the fluorophore (including the singlet and triplet lifetimes, redox potentials, photochemistry) each influence excited state properties. Hence, the range of dyes chosen reflects as much as possible the broad range of structures employed as 1O2 generators. The affinity of LmrR for binding planar organic dyes (Fig. 1C) and the effect that binding has on the photophysics including photostability of the dyes under conditions of continuous irradiation with visible light is explored. The generation of singlet oxygen is of particular interest. We show that the singlet oxygen generated in proximity of the protein undergoes rapid reaction with it, and that tryptophan provides sacrificial protection for the bound dye, extending the life of the dyes, in many cases, substantially.
Results and discussion
Design, synthesis and characterization of LmrR-fluorophore complex
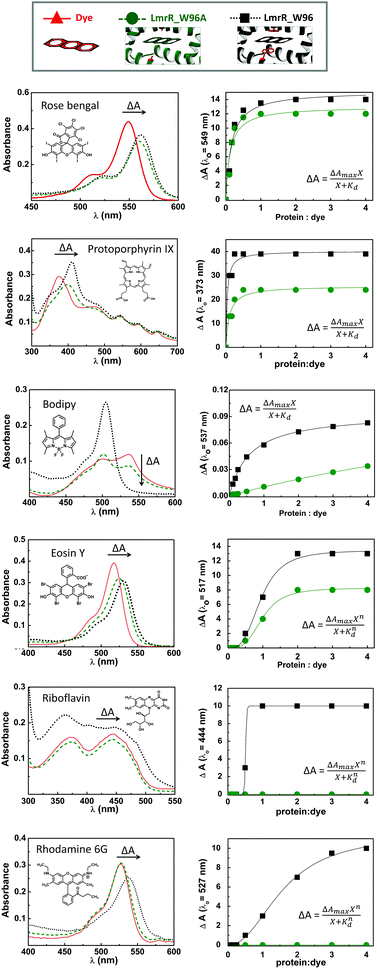
LmrR is homodimeric protein (molecular weight around 15 kDa) that contains a large hydrophobic pocket at its dimer interface and its conformation can shift readily to accommodate planar molecules (Fig. 1A).11,12,19,38–40 Its high affinity for planar drugs is ascribed to two tryptophans at its dimer interface, position 96 (and 96’on the dimer partner).11,12,19,38–40 Two variants of LmrR are used in the present study (Fig. 1B and Fig. S1 and S2, ESI†): LmrR_A96 where the tryptophans within the cavity (position 96) are substituted with alanine and LmrR_W96 where the tryptophans are retained. For both variants the other tryptophans present at positions 67 and 124 (on the strep tag) are substituted for alanine to avoid interference.The affinity of the dyes for each of the proteins was estimated by UV-Vis absorption spectroscopy. Their interaction with the LmrR proteins (W96 and A96) is manifested typically in a red shift in their visible absorbance compared to that in buffer (Fig. 2 and Fig. S4, Table S1, ESI†), which is consistent with localization within the hydrophobic environment of the protein pocket (solvatochromism).31,32,35 The shift is greater when tryptophan is present indicating additional interactions with the tryptophan residues, e.g., through π–π stacking.41–44 The shift in absorption maximum (Δλmax) as the protein–dye ratio was varied was fitted (Fig. 2) using a saturation growth model (eqn (1)) or Hill model (eqn (2)) where it provided a better fit to the data obtained. Eqn (1) is used satisfactorily for rose bengal, protoporphyrin IX, and bodipy, while eqn (2) was used for eosin Y, riboflavin and rhodamine 6G to yield the dissociation constant (Kd) (Table 1).
 | (1) |
 | (2) |
| K d (μM) | Δλmax (nm) | n | ||||
|---|---|---|---|---|---|---|
| A96 | W96 | A96 | W96 | A96 | W96 | |
| Protoporphyrin IX | 0.10 | 0.03 | 26 | 40 | 1 | 1 |
| Rose bengal | 0.15 | 0.12 | 13 | 15 | 1 | 1 |
| Bodipy | 13.70 | 0.59 | 0.1 | 0.1 | 1 | 1 |
| Eosin Y | 0.99 | 0.94 | 8 | 13 | 3.5 | 3.2 |
| Riboflavin | 0 | 0.51 | 0 | 10 | 0 | 34.6 |
| Rhodamine 6G | 0 | 1.59 | 0 | 11.5 | 0 | 2.2 |
Bodipy shows only a minor shift in its maximum absorbance (3 nm), consistent with the minor solvatochromic shift expected for bodipy dyes.45 Thus, the binding affinity was determined from the decrease in absorbance at 537 nm assigned to absorbance by bodipy aggregates in the absence of the protein. The binding affinity of bodipy to LmrR_W96 is much greater than to LmrR_A96 with a Kd of 0.59 μM for LmrR_W96 vs. Kd of 13.7 μM for LmrR_A96 indicating that aromatic interactions are important for this dye. Riboflavin and rhodamine 6G show changes in their spectra upon addition of LmrR_W96, but not with LmrR_W96A, indicating either that binding relies on interaction with the tryptophans or that the pocket itself has only a negligible electronic effect on the bound dyes.46 The absorption bands of the riboflavin bound to LmrR_W96 are slightly shifted and show more pronounced vibronic structure consistent with confinement of the photosensitizer within the protein pocket in the presence of tryptophan47,48 showing a Kd of 0.5 μM. Rhodamine 6G binds more weakly to LmrR_W96 with a Kd of 1.59 μM. The structural stability of LmrR-dye complex was verified by circular dichroism (Fig. S5, ESI†), which confirms structure and thermal stability of LmrR is not affected upon binding of the dyes (Tm = 50 °C).
Overall, although the tryptophan is not essential for dye binding, for most of the dyes the tryptophan residues increase binding affinity. Eosin Y, riboflavin and rhodamine show a Hill type response which indicates that a critical amount of protein is required to observe dye binding. Hence an excess of protein is required to ensure that essentially all dye is bound within the pocket of the LmrR protein and in the studies described below a 4![[thin space (1/6-em)]](https://www.rsc.org/images/entities/char_2009.gif) :
:![[thin space (1/6-em)]](https://www.rsc.org/images/entities/char_2009.gif) 1 stoichiometry of protein
1 stoichiometry of protein![[thin space (1/6-em)]](https://www.rsc.org/images/entities/char_2009.gif) :
:![[thin space (1/6-em)]](https://www.rsc.org/images/entities/char_2009.gif) dye is used, unless stated otherwise.
dye is used, unless stated otherwise.
Influence of LmrR on dye luminescence
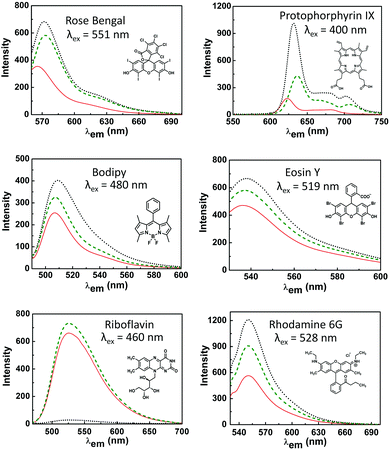
The photoluminescence of the dyes used here is sensitive to the hydrophobicity of their environment, conformational changes induced by binding and the presence of quenchers (of singlet and/or triplet excited states via electron or energy transfer).31,32,34,49 The effect of the hydrophobic environment and, moreover, tryptophan moieties on the emission is therefore useful in studying protein dye interactions (Fig. 3, see also Tables S1, S8 and S9, ESI†).For rose bengal, the increase in emission upon binding either of the protein mutants is substantial and is consistent with the increase in lifetime observed typically in apolar and non-hydrogen bonding media.50,51 For eosin Y, rhodamine 6G, protoporphyrin IX and bodipy, the increase in emission upon binding to the protein is more pronounced with LmrR_W96 than with LmrR_W96A. Protoporphyrin IX aggregates in solution, which reduces the lifetime of the singlet-excited state and hence reduces its quantum yield of emission.52,53 Its emission increases slightly when bound to LmrR_A96, while a notable increase is observed with LmrR_W96, indicating that tryptophan units assist in breaking up of homo-aggregates. For bodipy the observed increase is attributed to a loss of rotational freedom at the meso position which is expected to contribute to the increase in emission.54–57 In contrast to the other dyes, riboflavin emission is heavily quenched by LmrR_W96, consistent with electron transfer between tryptophan and riboflavin.58–60 For all dyes, the Stokes shift is less with LmrR_A96 and LmrR_W96 than in buffer alone, which is consistent with confinement in the hydrophobic environment of the protein cavity and differences in solvent reorganization kinetics.
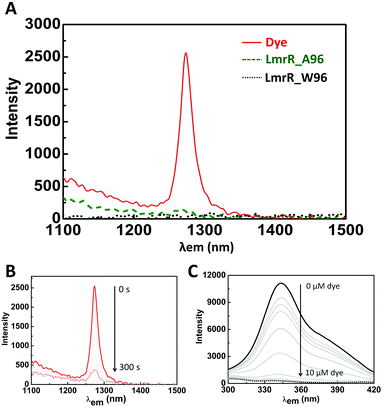
The emission from the tryptophan decreases concomitant with addition of the dyes with almost complete quenching with less than a 10-fold excess of each dye (Fig. 4C and Fig. S6, ESI†). However, although the residual emission is weak, the emission lifetime does not change significantly compared to that of LmrR_W96 in the absence of the dye (Fig. S7 and Table S8, ESI†), indicating static quenching.
The emission decay lifetimes of the dyes in the absence and presence of the LmrR_W96 compared with that in non-aqueous solvents are consistent with incorporation with the hydrophobic pocket of the protein (Table S9, ESI†). For example, the fluorescence lifetime of protoporphyrin IX and bodipy increases in the presence of the protein when compared with the lifetime in water, consistent with the break-up of aggregates in the presence of the protein. For eosin Y and rhodamine the fluorescence lifetime does not change significantly, while the emission intensity does which suggests amino acids increase fluorescence quantum yields. For riboflavin, measured lifetime is similar in the absence and presence of protein, while fluorescence intensity is decreased consistent with static quenching.
Singlet oxygen (1O2) emission
The near-IR phosphorescence of 1O2 upon irradiation of riboflavin in D2O is substantially diminished in the presence of LmrR_A96 and it is not detectable in the presence of the LmrR_W96 mutant (Fig. 4A). Furthermore, continuous irradiation of riboflavin in D2O, in the absence of protein, results in a decrease in 1O2 emission intensity over time (ca. 20% over 5 min, Fig. 4B), due to attack of the 1O2 generated on the dye. The loss of 1O2 emission indicates that both LmrR variants either inhibit 3O2 sensitization by quenching the triplet state of the riboflavin and/or the 1O2 produced reacts rapidly, with the amino acids, such as the tyrosine residues present in the protein, and hence emission is quenched.61–64 Notably, 1O2 emission in the presence of [Ru(bpy)3]2+ is quenched completely in the presence of either protein (Fig. S8B, ESI†). Since the dication [Ru(bpy)3]2+ is unlikely to bind within the pocket, but instead to the anionically charged surface of the protein, its emission (at 610 nm) is relatively unaffected by the proteins (Fig. S8A, ESI†). Hence it is clear that 1O2, if formed, is in sufficient proximity to react rapidly with the protein. Hence, the absence of 1O2 emission in the presence of the LmrR variants cannot be taken as a conclusive evidence for inhibition of 1O2 generation.Photochemical stability of dyes
The bleaching of most of the dyes upon irradiation in the presence of O2 follows first order decay with rates of 2.4 × 10⁻³, 2.7 × 10⁻³ and 3.6 × 10⁻³ for rose bengal, bodipy and eosin Y, respectively (Table 2). Riboflavin shows biexponential decay with a fast and slow component (3.7 × 10⁻² and 8.1 × 10⁻⁴, respectively), which indicates several degradation pathways in the presence of oxygen. Protoporphyrin IX and rhodamine 6G are stable under irradiation due to absence of ROS generation, attributed to formation of dye aggregates that quench the excited state (vide supra) of the dye for protoporphyrin IX65,66 and a low intersystem crossing quantum yield for rhodamine 6G.67,68 In the absence of oxygen, generally bleaching is slower (Table 2). Excited state reduction (Ered*) and oxidation (Eox*) potentials (Fig. 1 and Table S2, ESI†) were calculated using the equation for Gibbs free energy of photoinduced electron transfer (see methods for details).69 The redox potential for tryptophan (1.09 V)70 is sufficiently low to allow for oxidation by the dyes. Most of the dyes show photobleaching in the absence of protein due to ROS generation (vide supra), and hence the observed behaviour of the dyes in the presence of protein is a combination of several interactions between dye–protein-ROS, the net result of which is determined by the thermodynamics and the kinetics of the interactions. Hence prediction of the behaviour of each dye in the presence of the LmrR is difficult and each dye needs to be studied separately. The effect of protein hydrophobicity and tryptophan on the photostability of the dyes was explored by monitoring their visible absorbance over time during extended irradiation in the presence and absence of protein and O2 (Fig. 5–7 and Fig. S9–S11, ESI†). An increase in absorbance between 300 to 350 nm in the presence of both O2 and LmrR protein is attributed to the oxidation of amino acids (e.g., tyrosine and tryptophan) upon reaction with 1O2.61–64,71–73Air equilibrated Y = A1![[thin space (1/6-em)]](https://www.rsc.org/images/entities/char_2009.gif) exp(−k1x) + A2 exp(−k1x) + A2![[thin space (1/6-em)]](https://www.rsc.org/images/entities/char_2009.gif) exp(−k2x) + Yo exp(−k2x) + Yo |
Argon purged Y = A![[thin space (1/6-em)]](https://www.rsc.org/images/entities/char_2009.gif) exp(−kx) + Yo exp(−kx) + Yo |
|||||||
|---|---|---|---|---|---|---|---|---|
| k 1 (s−1) × 10−3 | k 2 (s−1) × 10−3 | A 1 | A 2 | Y o | k (s−1) × 10−3 | A | Y o | |
| Rose bengal | 2.4 | — | 0.8 | — | 0.2 | 2.6 | 0.6 | 0.3 |
| Bodipy | 2.7 | — | 1 | — | 0 | — | — | — |
| EosinY | 3.6 | — | 0.9 | — | 0.1 | 16 | 0.8 | 0.2 |
| Riboflavin | 37 | 0.81 | 0.6 | 0.4 | 0 | 140 | 0.9 | 0.08 |
In all cases, oxidative damage to the protein is not significant in the absence of O2 and hence excited state electron transfer (photoredox chemistry) from or to the dyes can be excluded. The time dependence of the changes in visible absorbance of each dye and LmrR-dye assemblies in the presence and absence of oxygen were fitted to decay models that fit best the data obtained, and hence these models do not, a priori, have physical meaning. It should be noted that in all cases the irradiation wavelength and intensity (ca. 300 mW) was identical, and hence the photokinetic factors are comparable and all rate constants described below are relative and allow for broad comparison of the behaviours of the different classes of dye.
The five arbitrary models used for fitting the bleaching data: linear decay (eqn (3)), mono exponential decay (eqn (4)), biexponential decay (eqn (5)), algebraic decay (eqn (6)) and stretched algebraic decay (eqn (7)).
| Y = Yo − kx | (3) |
| Y = Yo + Ae−kx | (4) |
| Y = Yo + A1e−k1x + A2e−k2x | (5) |
 | (6) |
 | (7) |
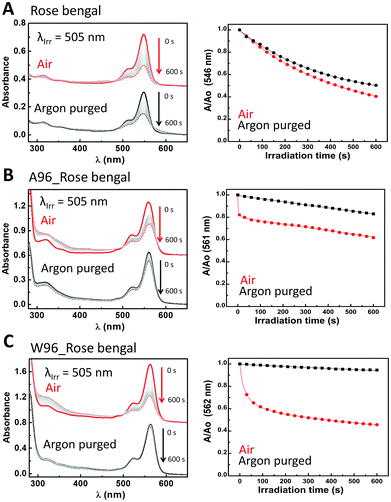
Rose bengal (Fig. 5) represents the first class as its absorbance undergoes monoexponential decay upon irradiation that is unaffected by O2, k = 2.4 × 10⁻³ s−1 and 2.6 × 10⁻³ s−1, respectively. In the absence of oxygen, the presence of LmrR_A96 or W96, results in a large reduction in the rate of decay, and a change to linear decay (k = 2.8 × 10⁻⁴ s−1 and 9.3 × 10⁻⁵ s−1, respectively). The large decrease in rate suggests the protein shuts down the pathway observed when the dye is in solution in the absence of oxygen. Possibly, the protein's hydrophobic pocket limits the formation of hydroxyl radicals that are otherwise formed in water upon photoexcitation of rose bengal,74,75 and is consistent with the increase in the fluorescence observed also (vide supra). When oxygen is present, the protein–dye complex shows faster photobleaching than with the dye alone in solution. For both proteins, the decay can only be fit by a combination of linear and algebraic decay models (eqn (3) and (6)). For the algebraic part, the decay rate is 0.9 s−1 with LmrR_A96 and slower, 0.1 s−1, for LmrR_W96. A second linear decay component is required to fit the decay fully with a rate similar to that observed in the absence of oxygen (Fig. 5 and Table S3, ESI†).
The second class includes most of the dyes, bodipy (Fig. 6), eosin Y (Fig. S9, ESI†), protoporphyrin IX (Fig. S10, ESI†) and riboflavin (Fig. S11, ESI†). For these dyes, the hydrophobicity of the protein pocket has little influence on the decay observed, in contrast to the effect of the tryptophan. Notably each dye is affected by LmrR_W96 in a different manner, which is discussed below.
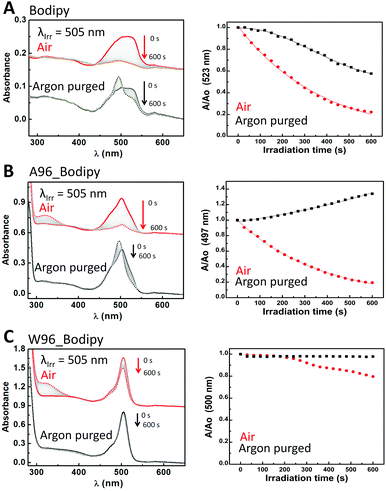
Bodipy shows monoexponential decay upon visible irradiation in the presence of oxygen (2.7 × 10⁻³ s−1) (Fig. 6). In absence of oxygen, a change in spectral shape is observed indicating changes in the bodipy probably due to ROS, however the change in aggregation state may also be a contributing factor. Similar changes are observed in the presence of LmrR_A96: exponential decay (2.7 × 10⁻³ s−1) in the presence of oxygen and a spectral shift in the absence of oxygen. The presence of tryptophan inhibits the photodegradation substantially even in the presence of oxygen, however it is notable that protein degradation occurs instead (manifested in an increase in absorbance at ca. 350 nm, Fig. 6 and Table S4, ESI†).
The rate of decay of the visible absorbance of eosin Y (Fig. S9 and Table S5, ESI†) is similar to that of bodipy, but surprisingly, the decay rate in the absence of oxygen 16 × 10−3 s−1 is faster than in the presence of oxygen (3.6 × 10⁻³ s−1), indicating interaction of the dye with oxygen (quenching) is competing with an intramolecular decay pathway. The same trend is observed in the presence of LmrR_A96, (5.6 × 10⁻³ s−1 and 1.1 × 10⁻² s−1, respectively). With LmrR_W96 monoexponential decay (5.3 × 10⁻³ s−1) is observed in presence of oxygen, however, in its absence, the decay follows an algebraic stretched decay (3.3 × 10⁻³ s−1), which indicates, as for rose bengal, several pathways to dye degradation.
Protoporphyrin IX (Fig. S10 and Table S6, ESI†), in the presence of oxygen, shows similar behaviour as bodipy in that upon irradiation in the presence of LmrR_A96 a shift in absorbance is observed with a monoexponential decay (1.8 × 10⁻³ s−1). However, in contrast to bodipy, tryptophan accelerates the photodegradation of protoporphyrin IX in the presence of oxygen and required fitting with a biexponential model (5.8 × 10⁻² and 4.1 × 10⁻³ s−1). In the absence of oxygen, photobleaching is not observed in presence of both LmrR_A96 and LmrR_W96. In the absence of protein protoporphyrin does not undergo photodegradation upon irradiation which is consistent with aggregation induced excited state quenching (vide supra).76
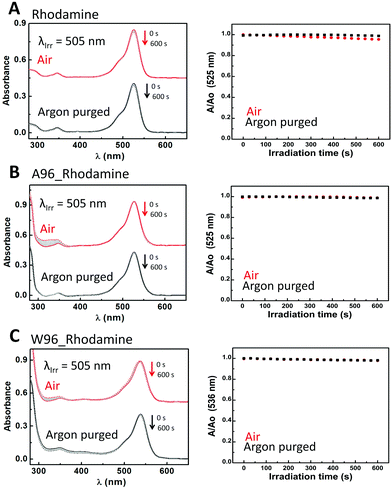
Riboflavin (Fig. S11 and Table S7, ESI†) is the only dye which shows quenching of its emission in the presence of tryptophan. The photodegradation pathways of riboflavin have been studied elsewhere.77–80 The photoreactivity of riboflavin arises from its triplet excited state. The absorbance of riboflavin decays monoexponentially (0.14 s−1) when irradiated in absence of oxygen. LmrR_A96 does not affect the decay substantially (0.08 s−1). By contrast, oxygen reduces the rate of bleaching with a biexponential decay observed (3.7 × 10⁻² s−1 and 8.1 × 10⁻⁴ s−1), ascribed to additional reaction pathways including 1O2 generation. In the presence of oxygen and LmrR_A96, a single exponential decay (5.1 × 10⁻² s−1) is observed, indicating that the protein interferes with the riboflavin 1O2 decay pathway, consistent with the increase in absorbance at ca. 310 nm attributed to irreversible amino acid oxidation. LmrR_W96 inhibits all photobleaching in the absence of oxygen, ascribed to electron transfer deactivation between the riboflavin anion radical (RF˙−) and tryptophan cation radical (Trp(H)˙+).81 O2 can compete with this pathway to form O2˙− which reacts with the tryptophan radical irreversibly manifested again in an increase in absorbance at ca. 310 nm. For rhodamine 6G (Fig. 7 and Table S9, ESI†), which does not generate 1O2 neither the protein and the presence of tryptophan affect significantly the decay trend or rate. Rhodamine 6G is photostable even in the presence of oxygen, consistent with its low triplet state quantum yield.82 Thus, neither degradation or oxidation is observed in the absence and the presence of the protein or oxygen.
Summary
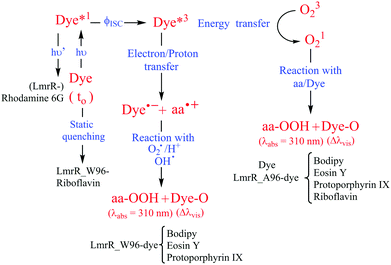
The hydrophobic pocket of the LmrR protein is used to study the effect of protein hydrophobicity and tryptophan on the photostability of organic dyes under extended irradiation in the presence and absence of oxygen. LmrR shows high promiscuity for planar organic dyes with different structures and wide range of redox potentials. The dyes show high affinity for binding to the LmrR pocket with Kd from nano to micro-molar range. Upon interaction with LmrR, most of the dyes show changes in the absorption spectrum consistent with changes in the hydrophobicity due to the protein pocket and further changes in the presence of tryptophan that suggest additional electronic interactions between tryptophan and fluorophores. The selected dyes can sensitize the ROS (e.g., 1O2) generation that leads to photodegradation of the dyes in solution. For example, with riboflavin 1O2 emission decays over time due to dye bleaching. The presence of both LmrR_A96 or LmrR_W96, results in a near complete quenching of the 1O2 emission, indicating that either the protein quenches the triplet state of the dye preventing 1O2 generation or protein amino acids react with 1O2 and hence preventing 1O2 emission (Fig. 8). Interestingly, tryptophan offers sacrificial protection to oxidation for most of the dyes, and in the case of bodipy prevents any degradation even in the presence of oxygen.Conclusions
LmrR is a transcription factor that controls the expression of the heterodimeric ABC transporter LmrCD, which is a major multidrug transporter in Lactococcus lactis bacteria.14,15 LmrCD transporters act as efflux pumps for antibiotics which is one of the mechanism for bacterial drug resistance. Recently, it has been shown that some toxic compounds such as the DNA-binding drugs Hoechst 33342 (H33342) interact directly with LmrR and its presence in the growth medium induces a significant upregulation of the lmrCD genes and higher resistance to antibiotics.83The present study shows that LmrR, and especially the tryptophan residue, has a major impact on the photochemistry and photobleaching of dyes. The variation in behaviour observed in the present study indicates that the behaviour of dyes in general cannot be easily assumed based on their properties in aqueous or organic solvents. The rates of photodegradation observed here, although relative, may be general to other protein systems as the photostability and photochemistry of dyes embedded in LmrR strongly depends on protein–dye interactions and the relative susceptibility of the protein itself to react with 1O2 among others. Finally, the complex interaction of 1O2 with the protein observed in this study holds implications for our expectations of how photochemically active dyes will behave when moving from solution studies to in vivo applications. In the latter case, protein dye interactions need to be considered in the dyes overall activity, not least in PDT antibacterial applications. The efficiency of the photodynamic therapy relies on the generation of ROS as superoxide anions, hydrogen peroxide (H2O2), free hydroxyl radicals (OH˙), and singlet oxygen (1O2) by the drugs inside the cell.84 These ROS oxidize various biomolecules causing damage in the cell. In spite of the multitarget approach of photodynamic therapy, bacteria can develop defence to oxidative stress generated by ROS by specific enzymatic pathways.85–87 However, it is not clear how bacterial mechanisms deal with singlet oxygen.84 Our work shows a potentially important pathway in bacterial resistance to singlet oxygen by preventing its formation in the first place.
Methods
Gene construction and cloning
The gene encoding for LmrR is based on that used in our previously reported pET17b_LmrR_LM.39 The LmrR gene includes the K55D and K59Q modifications and a modified C-terminal strep-tag (tag amino acid sequence is ASHPQFEL). LmrR_W96 was generated by introducing W67A and W124A modifications on the LmrR gene and LmrR_W96A includes also the W96A modification. The modification on the plasmids were carried out by quick-change site-directed mutagenesis protocol.Expression and purification
The expression of the different protein variants was performed as described previously with minor modifications.39 Briefly, protein expression plasmids of the LmrR constructs were transformed into E. coli BL21 (DE3)_C43. Cells were grown in LB media containing 0.1 mg mL−1 ampicillin at 37 °C to an OD at 600 nm of 0.6–0.8. The expression was induced with 1 mM IPTG and the cells were grown overnight at 30 °C.The proteins were expressed as strep-tagged proteins and purified using standard affinity chromatography methods. Briefly, cells were harvested by centrifugation during 15 min at 4700 g and resuspended in buffer (50 mM NaH2PO4, pH 8.0, 150 mM NaCl). Cells were lysed by sonication (75% (200 W) for 8 min (10 s on, 15 s off)) and the lysed cells were incubated with DNAseI (0.1 mg mL−1, containing final concentration 10 mM MgCl2) for 1 hour at 4 °C.
After centrifugation (15![[thin space (1/6-em)]](https://www.rsc.org/images/entities/char_2009.gif) 000 rpm, JA-17, 1 h, 4 °C, Beckman), the supernatant was equilibrated with 6 mL of pre-equilibrated Strep-tag Tactin column material for 1 h (mixed at 200 rpm on a rotary shaker) at room temperature. The column was washed with 3 × 1 CV (column volume) of resuspension buffer (same buffer as used before), and eluted with 6 × 0.5 CV of resuspension buffer containing 2.5 mM desthiobiotin. The impurities were removed from pure LmrR by FPLC using a Superdex 200 size exclusion column (GE Healthcare) in 50 mM potassium phosphate pH 8 buffer. The protein size and purity were analyzed by SDS polyacrylamide gel electrophoresis. The concentration of LmrR_W96 is determined by using the calculated molar absorptivities, ε280 = 28
000 rpm, JA-17, 1 h, 4 °C, Beckman), the supernatant was equilibrated with 6 mL of pre-equilibrated Strep-tag Tactin column material for 1 h (mixed at 200 rpm on a rotary shaker) at room temperature. The column was washed with 3 × 1 CV (column volume) of resuspension buffer (same buffer as used before), and eluted with 6 × 0.5 CV of resuspension buffer containing 2.5 mM desthiobiotin. The impurities were removed from pure LmrR by FPLC using a Superdex 200 size exclusion column (GE Healthcare) in 50 mM potassium phosphate pH 8 buffer. The protein size and purity were analyzed by SDS polyacrylamide gel electrophoresis. The concentration of LmrR_W96 is determined by using the calculated molar absorptivities, ε280 = 28![[thin space (1/6-em)]](https://www.rsc.org/images/entities/char_2009.gif) 880 M−1 cm−1, and LmrR_W96A ε280 = 17
880 M−1 cm−1, and LmrR_W96A ε280 = 17![[thin space (1/6-em)]](https://www.rsc.org/images/entities/char_2009.gif) 880 M−1 cm−1 (calculations were done by Protparam on the Expasy server. http://web.expasy.org/protpara). Purified proteins were stored in dark frozen at −80 °C.
880 M−1 cm−1 (calculations were done by Protparam on the Expasy server. http://web.expasy.org/protpara). Purified proteins were stored in dark frozen at −80 °C.
Protein–dye binding determination
UV-Vis absorption spectra were recorded using a SPECORD S600 UV-Vis spectrophotometer. Binding was monitored by absorbance peak shift (specified in the figures to each dye) at room temperature in a 1 cm pathlength quartz cuvette. Stock solutions of dyes were prepared (800 μM), in 50 mM phosphate buffer pH 8 in the case of rose bengal and rhodamine 6G, in methanol in the case of protoporphyrin IX and bodipy, in ethanol in the case of eosin Y and in 10% of acetonitrile in the case of riboflavin. 2 mL at 6 μM of rose bengal, 10 μM of protoporphyrin IX, 10 μM of bodipy, 30 μM of riboflavin, 4 μM of eosin Y and 6 μM rhodamine 6G on 50 mM phosphate buffer pH 8 was used as starting point. Titration of protein to dye were carried out in the range of 0.1 to 4 equiv. initial dye concentration.Circular dichroism (CD) spectroscopy
CD spectra were recorded using a JASCO J-810 CD Spectrometer. CD spectra of LmrR protein in 50 mM phosphate buffer at pH 8 were acquired in a 1 cm path length quartz cuvettes at a protein concentration of 1 μM and with or without 10 μM dye. A band-width of 1 nm and 1 nm increment were used in all cases. Thermal denaturation was followed by monitoring the ellipticity at 222 nm at 5 °C intervals.Emission spectroscopy
Emission spectra were recorded using a JASCO_FP6200 spectrophotomer at room temperature in a 1 cm pathlength quartz cuvette and using a 310 nm long-pass filter at the detector side. 2 mL at 2 μM of rose bengal, 5 μM of protoporphyrin IX, 0.25 μM of bodipy, 0.5 μM of riboflavin, 0.1 μM of eosin Y and 0.1 μM rhodamine 6G in 50 mM phosphate buffer pH 8 was measured in the absence of protein and in the presence of a four-fold excess of LmrR_W96 and LmrR_W96A. Emission spectra were corrected for instrument response and absorbance.Quenching of tryptophan fluorescence
Dye (as a stock solution) was added to 1 mL of a buffered solution (50 mM phosphate buffer, pH 8) containing 1 μM LmrR_W96 in a step wise manner from 0.1 to 10 equiv. with respect to the initial protein concentration in 1 cm pathlength cuvettes. Emission spectra were recorded after 3–5 min incubation time at room temperature with excitation at 280 nm unless stated otherwise. The spectra were corrected for detector response and absorbance. The integrated emission from 300–420 nm was plotted against the concentration of the dye.Emission lifetimes
A PicoQuant PDL 800-B diode laser driver connected to a PicoQuant PLS 255 led-head equipped with 250–350 nm bandpass filter provided excitation light. TCSPC was carried out using a PicoQuant Tau-SPAD-100 single photon counting module equipped with 325–385 nm bandpass filter and connected to a PicoQuant PicoHarp 300 TC-SPC module. The Tau SPAD was powered by a DSN 102 dual SPAD power supply. The internal trigger from the PDL was used as input for time stamping on the PicoHarp and the emitted light was measured perpendicular to the excitation light. Lifetimes were calculated using FluoFit with correction for the IRF, obtained by scattering from BaSO4 at 45° relative to the excitation light.Singlet oxygen measurements
1O2 emission generated upon excitation at 455 nm (50 mW) was detected 1 cm pathlength quartz cuvettes using a cuvette holder with collimator for collection of the emitted light (Thorlabs) equipped with a 950 nm long pass filter and delivery by fiber optic to an Andor Technology Shamrock300i spectrograph equipped with a 75 L mm−1 (1300 nm blazed) grating and idus-InGaAs 512 pixel diode array (Andor Technology). Spectral calibration was performed with the emission lines from a TL light. 30 μM of riboflavin or [Ru(bpy)3]2+ in deuterated 50 mM phosphate buffer pD 8 was measure in the absence and presence of 120 μM LmrR_W96 and LmrR_W96A protein.Photochemical stability
UV/vis absorption spectra were typically recorded at 30 s intervals during continuous irradiation at room temperature in 1 cm pathlength quartz cuvettes. 800 μM dye stock solutions were prepared, prior to experiments, in 50 mM phosphate buffer in D2O pD 8 in the case of rose bengal and rhodamine 6G, in methanol in the case of protoporphyrin IX and bodipy, in ethanol in the case of eosin Y and in 10% of acetonitrile in water in the case of riboflavin. From these solutions 2 mL of 6 μM rose bengal, 10 μM protoporphyrin IX, 10 μM bodipy, 30 μM riboflavin, 4 μM eosin Y, and 6 μM rhodamine 6G in 50 mM phosphate buffer in D2O at pD 8 were used both with and without a 4 fold excess of LmrR_W96 or LmrR_W96A. The proteins were prepared by lyophilisation followed by dissolution in D2O. Solutions were irradiated with at 505 or 455 nm using the collimated output of high power LEDs (Thorlabs) such that the entire output passed through the cuvette as a 7 mm beam. Oxygen was removed from the sample by purging with argon for 15 min.Calculation of excited state redox potential calculation. The equations for Gibbs free energy of photoinduced electron transfer (eqn (8) and (9))69,88 were used to calculated excited state redox potentials. Ground state reduction and oxidation potentials were obtained from literature values.89–94 Electrostatic work for charge generation and separation is approximated to 0 and energy gap between zeroth vibrational levels of the ground and excited state (Eoo) is approximated as the intercept of the normalized emission and absorption spectra of the LmrR_W96-dye complex.
 | (8) |
 | (9) |
Conflicts of interest
There are no conflicts to declare.Acknowledgements
Financial support was provided by The Netherlands Ministry of Education, Culture and Science (Gravity Program 024.001.035 to G. R. and W. R. B.).References
- R. W. Redmond and J. N. Gamlin, Photochem. Photobiol., 1999, 70, 391–475 CrossRef CAS PubMed.
- G. Stark, J. Membr. Biol., 2005, 205, 1–16 CrossRef CAS PubMed.
- J. L. Ravanat, P. Di Mascio, G. R. Martinez, M. H. G. Medeiros and J. Cadet, J. Biol. Chem., 2001, 276, 40601–40604 CAS.
- V. Vargová, R. E. Giménez, H. Černocká, D. C. Trujillo, F. Tulli, V. I. P. Zanini, E. Paleček, C. D. Borsarelli and V. Ostatná, Electrochim. Acta, 2016, 187, 662–669 CrossRef.
- T. Dai, Y. Y. Huang and M. R. Hamblin, Photodiagn. Photodyn. Ther., 2009, 6, 170–188 CrossRef CAS PubMed.
- X. Ragàs, D. Sánchez-García, R. Ruiz-González, T. Dai, M. Agut, M. R. Hamblin and S. Nonell, J. Med. Chem., 2010, 53, 7796–7803 CrossRef PubMed.
- S. A. G. Lambrechts, T. N. Demidova, M. C. G. Aalders, T. Hasan and M. R. Hamblin, Photochem. Photobiol. Sci., 2005, 4, 503–509 RSC.
- T. Maisch, Mini-Rev. Med. Chem., 2009, 9, 974–983 CrossRef CAS PubMed.
- H. B. Gray and J. R. Winkler, Proc. Natl. Acad. Sci. U. S. A., 2015, 112, 10920–10925 CrossRef CAS PubMed.
- C. F. Higgins, Nature, 2007, 446, 749–757 CrossRef CAS PubMed.
- P. K. Madoori, H. Agustiandari, A. J. M. Driessen and A. M. W. H. Thunnissen, EMBO J., 2009, 28, 156–166 CrossRef CAS PubMed.
- H. Agustiandari, J. Lubelski, H. B. Van Den Berg Van Saparoea, O. P. Kuipers and A. J. M. Driessen, J. Bacteriol., 2008, 190, 759–763 CrossRef CAS PubMed.
- H. Agustiandari, E. Peeters, J. G. de Wit, D. Charlier and A. J. M. Driessen, Microbiology, 2011, 157, 1519–1530 CrossRef CAS PubMed.
- H. Agustiandari, J. Lubelski, H. B. Van Den Berg Van Saparoea, O. P. Kuipers and A. J. M. Driessen, J. Bacteriol., 2008, 190, 759–763 CrossRef CAS PubMed.
- H. Agustiandari, E. Peeters, J. G. de Wit, D. Charlier and A. J. M. Driessen, Microbiology, 2011, 157, 1519–1530 CrossRef CAS PubMed.
- K. Takeuchi, Y. Tokunaga, M. Imai, H. Takahashi and I. Shimada, Sci. Rep., 2014, 4, 6922 CrossRef PubMed.
- J. P. Van Der Berg, P. K. Madoori, A. G. Komarudin, A. M. Thunnissen, A. J. M. Driessen and S. Korolev, PLoS One, 2015, 10(8), e0135467 CrossRef PubMed.
- H. Wade, Curr. Opin. Struct. Biol., 2010, 20, 489–496 CrossRef CAS PubMed.
- K. Takeuchi, Y. Tokunaga, M. Imai, H. Takahashi and I. Shimada, Sci. Rep., 2015, 4, 6922 CrossRef PubMed.
- R. Schweitzer-Stenner, J. Porphyrins Phthalocyanines, 2011, 15, 312–337 CrossRef CAS.
- E. S. Manas, J. M. Vanderkooi and K. A. Sharp, J. Phys. Chem. B, 1999, 103, 6334–6348 CrossRef CAS.
- H. Khoa Ly, M. Sezer, N. Wisitruangsakul, J. J. Feng, A. Kranich, D. Millo, I. M. Weidinger, I. Zebger, D. H. Murgida and P. Hildebrandt, FEBS J., 2011, 278, 1382–1390 CrossRef PubMed.
- R. Schweitzer-Stenner, J. Phys. Chem. B, 2008, 112, 10358–10366 CrossRef CAS PubMed.
- J. E. Hill, M. K. Linder, K. S. Davies, G. A. Sawada, J. Morgan, T. Y. Ohulchanskyy and M. R. Detty, J. Med. Chem., 2014, 57, 8622–8634 CrossRef CAS PubMed.
- Z. Fan, X. Cui, D. Wei, W. Liu, B. Li, H. He, H. Ye, N. Zhu and X. Wei, Sci. Rep., 2016, 6, 25353 CrossRef CAS PubMed.
- E. Blake, J. Allen and A. Curnow, Photodiagn. Photodyn. Ther., 2013, 10, 575–582 CrossRef CAS PubMed.
- K. S. Davies, M. K. Linder, M. W. Kryman and M. R. Detty, Bioorg. Med. Chem., 2016, 24, 3908–3917 CrossRef CAS PubMed.
- J. P. M. L. Rolim, M. A. S. De-Melo, S. F. Guedes, F. B. Albuquerque-Filho, J. R. De Souza, N. A. P. Nogueira, I. C. J. Zanin and L. K. A. Rodrigues, J. Photochem. Photobiol., B, 2012, 106, 40–46 CrossRef CAS PubMed.
- S. T. G. Buck, F. Bettanin, E. Orestes, P. Homem-de-Mello, H. Imasato, R. B. Viana, J. R. Perussi and A. B. F. da Silva, J. Chem., 2017, 1–9 Search PubMed.
- A. Arboleda, D. Miller, F. Cabot, M. Taneja, M. C. Aguilar, K. Alawa, G. Amescua, S. H. Yoo and J.-M. Parel, Am. J. Ophthalmol., 2014, 158, 64–70 CrossRef CAS PubMed.
- M. Chakraborty and A. K. Panda, Spectrochim. Acta, Part A, 2011, 81, 458–465 CrossRef CAS PubMed.
- M. A. Rauf, J. P. Graham, S. B. Bukallah and M. A. S. Al-Saedi, Spectrochim. Acta, Part A, 2009, 72, 133–137 CrossRef CAS PubMed.
- L. Ludvíková, P. Friš, D. Heger, P. Šebej, J. Wirz and P. Klán, Phys. Chem. Chem. Phys., 2016, 18, 16266–16273 RSC.
- F. M. Zehentbauer, C. Moretto, R. Stephen, T. Thevar, J. R. Gilchrist, D. Pokrajac, K. L. Richard and J. Kiefer, Spectrochim. Acta, Part A, 2014, 121, 147–151 CrossRef CAS PubMed.
- S. Terdale and A. Tantray, J. Mol. Liq., 2017, 225, 662–671 CrossRef CAS.
- G. R. Brunk, K. A. Martin and A. M. Nishimura, Biophys. J., 1976, 16, 1373–1384 CrossRef CAS PubMed.
- N. M. B. Neto, D. S. Correa, L. De Boni, G. G. Parra, L. Misoguti, C. R. Mendonça, I. E. Borissevitch, S. C. Zílio and P. J. Gonçalves, Chem. Phys. Lett., 2013, 587, 118–123 CrossRef.
- J. Bos, F. Fusetti, A. J. M. Driessen and G. Roelfes, Angew. Chem., Int. Ed., 2012, 51, 7472–7475 CrossRef CAS PubMed.
- J. Bos, W. R. Browne, A. J. M. Driessen and G. Roelfes, J. Am. Chem. Soc., 2015, 137, 9796–9799 CrossRef CAS PubMed.
- L. Villarino, K. E. Splan, E. Reddem, L. Alonso-Cotchico, C. Gutiérrez de Souza, A. Lledós, J.-D. Maréchal, A.-M. W. H. Thunnissen and G. Roelfes, Angew. Chem., Int. Ed., 2018, 57, 7785–7789 CrossRef PubMed.
- R. G. Huber, M. A. Margreiter, J. E. Fuchs, S. Von Grafenstein, C. S. Tautermann, K. R. Liedl and T. Fox, J. Chem. Inf. Model., 2014, 54, 1371–1379 CrossRef CAS PubMed.
- R. G. Huber, M. A. Margreiter, J. E. Fuchs, S. Von Grafenstein, C. S. Tautermann, K. R. Liedl and T. Fox, J. Chem. Inf. Model., 2014, 54, 1371–1379 CrossRef CAS PubMed.
- C. R. Martinez and B. L. Iverson, Chem. Sci., 2012, 3, 2191 RSC.
- Y. Deng, X. Feng, D. Yang, C. Yi and X. Qiu, BioResources, 2012, 7, 1145–1156 Search PubMed.
- L. Li, B. Nguyen and K. Burgess, Bioorg. Med. Chem. Lett., 2008, 18, 3112–3116 CrossRef CAS PubMed.
- S. Al-Ani, ISESCO J. Sci. Technol., 2013, 9, 34–42 Search PubMed.
- X. Shu, V. Lev-Ram, T. J. Deerinck, Y. Qi, E. B. Ramko, M. W. Davidson, Y. Jin, M. H. Ellisman and R. Y. Tsien, PLoS Biol., 2011, 9, e1001041 CrossRef CAS PubMed.
- T. A. Schüttrigkeit, C. K. Kompa, M. Salomon, W. Rüdiger and M. E. Michel-Beyerle, Chem. Phys., 2003, 294, 501–508 CrossRef.
- A. Nooraldeen, M. Palanichant and P. K. Palanisamy, Int. J. Nonlinear Sci., 2009, 7, 290–300 Search PubMed.
- E. Alarcón, A. M. Edwards, A. Aspée, C. D. Borsarelli and E. a. Lissi, Photochem. Photobiol. Sci., 2009, 8, 933–943 RSC.
- M. B. E. Turbay, V. Rey, N. M. Argañaraz, F. E. M. Vieyra, A. Aspée, E. A. Lissi and C. D. Borsarelli, J. Photochem. Photobiol., B, 2014, 141, 275–282 CrossRef CAS PubMed.
- N. C. Maiti, S. Mazumdar and N. Periasamy, J. Phys. Chem. B, 1998, 102, 1528–1538 CrossRef CAS.
- F. Würthner, T. E. Kaiser and C. R. Saha-Möller, Angew. Chem., Int. Ed., 2011, 50, 3376–3410 CrossRef PubMed.
- J.-D. Wang, S. Li, R. Lü and A. Yu, Acta Phys.-Chim. Sin., 2015, 31, 1787–1794 CAS.
- N. Dorh, S. Zhu, K. B. Dhungana, R. Pati, F.-T. Luo, H. Liu and A. Tiwari, Sci. Rep., 2015, 5, 18337 CrossRef CAS PubMed.
- G. N. Lewis and M. Calvin, Chem. Rev., 1939, 25, 273–328 CrossRef CAS.
- B. Hinkeldey, A. Schmitt and G. Jung, ChemPhysChem, 2008, 9, 2019–2027 CrossRef CAS PubMed.
- L. Shen and H. F. Ji, J. Photochem. Photobiol., B, 2008, 92, 10–12 CrossRef CAS PubMed.
- P. Li, S. Liu, X. Wang, Z. Liu and Y. He, Luminescence, 2013, 28, 910–914 CrossRef CAS PubMed.
- H. Staudt, D. Oesterhelt, M. Grininger and J. Wachtveitl, J. Biol. Chem., 2012, 287, 17637–17644 CrossRef CAS PubMed.
- M. J. Davies, Biochem. J., 2016, 473, 805–825 CrossRef CAS PubMed.
- F. M. Pimenta, R. L. Jensen, T. Breitenbach, M. Etzerodt and P. R. Ogilby, Photochem. Photobiol., 2013, 89, 1116–1126 CrossRef CAS PubMed.
- J. M. Gebicki, Arch. Biochem. Biophys., 2016, 595, 33–39 CrossRef CAS PubMed.
- R. Ruiz-González, A. L. Cortajarena, S. H. Mejias, M. Agut, S. Nonell and C. Flors, J. Am. Chem. Soc., 2013, 135, 9564–9567 CrossRef PubMed.
- C. TAnielian and G. Heinrich, Photochem. Photobiol., 1995, 61, 131–135 CrossRef CAS.
- R. F. Khairutdinov and N. Serpone, J. Phys. Chem., 1995, 99, 11952–11958 CrossRef CAS.
- S. A. Soper, H. L. Nutter, R. A. Keller, L. M. Davis and E. B. Shera, Photochem. Photobiol., 1993, 57, 972–977 CrossRef CAS.
- J. Widengren and R. Rigler, Bioimaging, 1996, 4, 149–157 CrossRef CAS.
- D. Rehm and A. Weller, Isr. J. Chem., 1970, 8, 259–271 CrossRef CAS.
- S. D. Glover, R. Tyburski, L. Liang, C. Tommos and L. Hammarström, J. Am. Chem. Soc., 2018, 140, 185–192 CrossRef CAS PubMed.
- P. Walrant and R. Santus, Photochem. Photobiol., 1974, 19, 411–417 CrossRef CAS PubMed.
- Y. Fukunaga, Y. Katsuragi, T. Izumi and F. Sakiyama, J. Biochem., 1982, 92, 129–141 CrossRef CAS PubMed.
- M. S. Hamdy, E. L. Scott, R. H. Carr and J. P. M. Sanders, Catal. Lett., 2012, 142, 338–344 CrossRef CAS.
- M. Różanowska, J. Ciszewska, W. Korytowski and T. Sarna, J. Photochem. Photobiol., B, 1995, 29, 71–77 CrossRef.
- M. Geoffroy, P. Lambelet and P. Richert, J. Agric. Food Chem., 2000, 48, 974–978 CrossRef CAS PubMed.
- M. Gouterman, J. Mol. Spectrosc., 1961, 6, 138–163 CrossRef CAS.
- I. Ahmad and F. H. M. Vaid, Compr. Ser. Photochem. Photobiol. Sci., 2006, 6, 13–40 CAS.
- P. F. Heelis, Chem. Soc. Rev., 1982, 11, 15 RSC.
- S. Astanov, M. Z. Sharipov, A. R. Fayzullaev, E. N. Kurtaliev and N. Nizomov, J. Mol. Struct., 2014, 1071, 133–138 CrossRef CAS.
- M. A. Sheraz, S. H. Kazi, S. Ahmed, Z. Anwar and I. Ahmad, Beilstein J. Org. Chem., 2014, 10, 1999–2012 CrossRef PubMed.
- E. Silva, P. Barrias, E. Fuentes-Lemus, C. Tirapegui, A. Aspee, L. Carroll, M. J. Davies and C. López-Alarcón, Free Radical Biol. Med., 2019, 131, 133–143 CrossRef CAS PubMed.
- K. Hirakawa and H. Ito, Chem. Phys. Lett., 2015, 627, 26–29 CrossRef CAS.
- P. K. Madoori, H. Agustiandari, A. J. M. Driessen and A. M. W. H. Thunnissen, EMBO J., 2009, 28, 156–166 CrossRef CAS PubMed.
- F. Cieplik, D. Deng, W. Crielaard, W. Buchalla, E. Hellwig, A. Al-Ahmad and T. Maisch, Crit. Rev. Microbiol., 2018, 571–589 CrossRef CAS PubMed.
- J. Nakonieczna, E. Michta, M. Rybicka, M. Grinholc, A. Gwizdek-Wiśniewska and K. P. Bielawski, BMC Microbiol., 2010, 10, 323 CrossRef CAS PubMed.
- M. Tim, J. Photochem. Photobiol., B, 2015, 150, 2–10 CrossRef CAS PubMed.
- N. Kashef and M. R. Hamblin, Drug Resist. Updates, 2017, 31, 31–42 CrossRef PubMed.
- G. J. Kavarnos, Fundamentals of photoinduced electron transfer, VCH Publishers, 1993 Search PubMed.
- K. Fidaly, C. Ceballos, A. Falguières, M. S. I. Veitia, A. Guy and C. Ferroud, Green Chem., 2012, 14, 1293–1297 RSC.
- V. Srivastava and P. P. Singh, RSC Adv., 2017, 7, 31377–31392 RSC.
- C. L. Hou, Y. Yao, D. Wang, J. Zhang and J. L. Zhang, Org. Chem. Front., 2019, 6, 2266–2274 RSC.
- K. M. Schaich, Lipids, 1992, 27, 209–218 CrossRef CAS PubMed.
- S. L. J. Tan and R. D. Webster, J. Am. Chem. Soc., 2012, 134, 5954–5964 CrossRef CAS PubMed.
- S. Doose, H. Neuweiler and M. Sauer, ChemPhysChem, 2009, 10, 1389–1398 CrossRef CAS PubMed.
Footnote |
| † Electronic supplementary information (ESI) available: Additional spectroscopic and analytical data. See DOI: 10.1039/d0cp01755h |
| This journal is © the Owner Societies 2020 |

