
 Open Access Article
 This Open Access Article is licensed under a
 Creative Commons Attribution 3.0 Unported Licence
Gas molecules sandwiched in hydration layers at graphite/water interfaces†
Hideaki
Teshima
ab,
Qin-Yi
Li
 ab,
Yasuyuki
Takata
bc and
Koji
Takahashi
*ab
ab,
Yasuyuki
Takata
bc and
Koji
Takahashi
*ab
aDepartment of Aeronautics and Astronautics, Kyushu University, Nishi-Ku, Motooka 744, Fukuoka 819-0395, Japan. E-mail: takahashi@aero.kyushu-u.ac.jp
bInternational Institute for Carbon-Neutral Energy Research (WPI-I2CNER), Kyushu University, Nishi-Ku, Motooka 744, Fukuoka 819-0395, Japan
cDepartment of Mechanical Engineering, Kyushu University, Nishi-Ku, Motooka 744, Fukuoka 819-0395, Japan
First published on 1st June 2020
Abstract
Hydration structures are ubiquitous at solid/liquid interfaces and play a key role in various physicochemical and biological phenomena. Recently, it has been reported that dissolved gas molecules attracted to hydrophobic surfaces form adsorbed gas layers. Although a hydration structure and adsorbed gas layers coexist on the surface, the relationships between them remain unknown. In this study, we investigated a highly ordered pyrolytic graphite/pure water interface with and without adsorbed gas layers using frequency-modulation atomic force microscopy. We penetrated the adsorbed gas layers with the strong load force of the AFM tip and thereby obtained the frequency shift curves inside them. By comparing the curves with those measured on a bare HOPG surface, we found that the adsorbed gas layers were located at regions where the molecular density of water was low and were sandwiched between hydration layers with high water density. Moreover, the distance between adjacent hydration layers was larger than that predicted by simulations and was the same with and without the adsorbed gas layers. We propose that gas molecules on the hydrophobic surface interact with the hydration structure before forming the adsorbed gas layers, and extend the distance between hydration layers.
Introduction
Interfaces between solids and liquids are important, both in nature and in industry. Accordingly, the behavior of water molecules at solid/liquid interfaces has been widely studied.1 In particular, the periodic fluctuation of the molecular density of water in the vertical direction, which is called a hydration structure, has attracted attention because of its role in phenomena such as hydrophobic interactions,2,3 slippage of fluids,4,5 surface tension at the solid/liquid interface,6 crystal growth,7 and the stability and folding of proteins.8,9 A hydration structure is composed of regions of dense and sparse water molecules. The region where the molecular density of water is high is called a hydration layer. Since the first observation in 1983,10 hydration structures have been widely investigated experimentally11–18 and in simulations.5,19–22 For detailed experimental observation of them, techniques with very high sensitivity and spatial resolution are needed, such as surface force apparatus,10,11 X-ray reflectivity,12 and atomic force microscopy (AFM).13–18 Of these methods, AFM is particularly powerful, because it can measure not only the hydration structure, but also the geometry of the underlying solid surface with sub-nanometer spatial resolution.Recently, it has been reported based on AFM measurements that the distance between adjacent hydration layers on hydrophobic surfaces is larger than that on hydrophilic surfaces. For example, Yang et al. measured the hydration structures on graphene and mica surfaces simultaneously using the same AFM tip and obtained a distance of 0.51–0.56 nm on the graphene and 0.23–0.33 nm on the mica.17 Uhlig et al. also reported similar distances between adjacent layers of approximately 0.50 nm on five different types of hydrophobic two-dimensional material including graphene, and a distance of 0.34 nm on mica.18 Interestingly, although the distance on the hydrophilic surfaces is in good agreement with the result from MD simulations,20 the distance on hydrophobic surfaces is much larger than that from the simulations.5,19–21
As a cause of this discrepancy, gas molecules attracted to a hydrophobic surface have been proposed.16–18 For example, Schlesinger and Sivan reported that the distance between hydration layers on the hydrophobic surface changed before and after the degassing of the solution, which strongly suggests a relationship between the dissolved gas molecules and the hydration structure.16 In addition, experiments23,24 and simulations25–28 have shown that the hydrophobic surface immersed in liquid attracts dissolved gas molecules and create nanoscopic gas-enrichment layers on the hydrophobic surface. Recently, it was revealed using high-sensitivity AFM that the gas-enrichment layers have the height of a few nanometers or less and can take several shapes, such as a row-like ordered gas layer,16,17,29–33 and a disordered gas layer covering the ordered gas layers.30,33 Although these adsorbed gas layers and the hydration structure exist in the same region, a concrete relationship between them, which is essential for understanding fundamental phenomena at solid/liquid interfaces, remains unclear.
In this study, we observed the highly ordered pyrolytic graphite (HOPG)/pure water interface with and without adsorbed gas layers using frequency modulation (FM)-AFM. We conducted height profile imaging of the surface and 2D frequency-shift mapping. By changing the load force applied to the AFM tip, we penetrated the adsorbed gas layers and measured the frequency shift curves inside them. By comparing the curves with those obtained on a bare HOPG surface, we revealed the relationship between the adsorbed gas layers and the hydration structure. Specifically, the adsorbed gas layer was composed of three gas layers. We propose that the adsorbed gas layers are located at regions where the water density is low and are sandwiched in hydration layers. In addition, the distance between adjacent hydration layers was higher than that from MD simulations and did not change in the presence or absence of the adsorbed gas layers. From these results, we propose that gas molecules exist in a hydration structure even before the formation of adsorbed gas layers and expand the distance between hydration layers compared to that in degassed water. Furthermore, from the comparison between the frequency-shift curves during approach and retraction, we suggest that first and second adsorbed gas layers are ordered gas layers that are strongly confined in dense hydration layers and attracted by van der Waals forces, whereas the third layer is a disordered gas layer that is weakly confined due to the relatively sparse hydration layer and the weak van der Waals forces.
Experimental
Atomic force microscopy
We used FM-mode of SPM-8100FM AFM (Shimadzu Corp., Japan). In this mode, an AFM tip is oscillated at its resonance frequency, which shifts to positive/negative when a repulsive/attractive force is applied. The FM mode utilizes the magnitude of the frequency shift as a feedback parameter and makes it possible to realize a high sensitivity imaging. PPP-NCHR cantilevers (Nanosensors, tip radius: ∼10 nm; spring constant: 42 N m−1) were used and the spring constant was calibrated using Sader's method.34 Because it is desirable to use hydrophilic AFM tips for imaging the gas/liquid interface,35 oxygen plasma treatments (Plasma Reactor 500, Yamato Scientific, Japan) were conducted for 30 minutes, where the power and flow rate were set to 150 W and 70 sccm, respectively.2D frequency-shift mapping was conducted as follows: An AFM tip approached the sample surface while the shift in resonance frequency was recorded. When the shift exceeded a preset value, the tip stopped approaching and returned to its original position. By continuing this procedure while shifting the tip in the x-axis direction, 2D (x- and z-axes) frequency-shift maps at the solid/liquid interface were obtained. Frequency shift–distance curves were obtained by extracting and averaging 64 lines from the 2D frequency-shift map. The background noise was also extracted from the region away from the hydration layers and subtracted from the frequency shift–distance curves.
Nucleation of adsorbed gas layers
HOPG (SPI-1 grade, 10 mm × 10 mm, Alliance Biosystems, Inc., Japan) was chosen as the substrate surface since the surface is atomically smooth and has been widely used for the AFM study on the hydration structure and adsorbed gas layer. Adsorbed gas layers were generated on the surface by the solvent-exchange method36 using ethanol and pure water. First, HOPG was fixed on the glass liquid cell with a depth of ∼1 cm and immersed in ethanol (approximately 1.7 mL) for several minutes. The ethanol was then exchanged thoroughly by slowly injecting approximately 20 mL of pure water prepared by a water purifier (RFP742HA, Advantec, Japan). These ethanol and pure water were not degassed (air-saturated condition). This process can create a local air-supersaturated condition in the liquid because ethanol has a higher air solubility than pure water, thereby enhances the formation of nanoscopic gas phases at the solid/liquid interface. All experiments were conducted after the solvent-exchange procedure. When adding solvents, clean glass syringes and steel needles were used to avoid contamination originating from silicone oil.37 The room temperature was 23 °C.Results and discussion
Measurements of a bare HOPG/pure water interface
The height image of the interface between HOPG/pure water is shown in Fig. 1(a). Imaging was conducted with an oscillation amplitude of 0.8 nm. Our previous report shows that ordered and disordered gas layers can be observed by FM-AFM imaging with this amplitude because a small amplitude decreases the load force of the AFM tip and increases the measurement sensitivity.33 However, in Fig. 1(a), the features of adsorbed gas layers were not observed on the surface. Therefore, there are no adsorbed gas layers in this observation area. This is because the solvent-exchange method only increases the local gas concentration at the HOPG/pure water interface; thus, adsorbed gas layers are not always generated over the entire surface. Fig. 1(b) is the 2D frequency-shift map obtained on the same surface. The map shows alternating dark and bright stripes. This uniform structure parallel to the substrate surface is a hydration structure, which is typically observed on HOPG surfaces. Fig. 1(c) shows the averaged frequency shift–distance curves extracted from Fig. 1(b). As indicated by black broken lines, three peaks of the frequency shift appeared, which indicate the hydration layers. In addition, the valleys between the peaks correspond to the regions where the density of water molecules is low. | ||
| Fig. 1 Analysis of the bare HOPG/pure water interface. (a) Height image (3 μm × 3 μm). (b) 2D frequency-shift map during approach. (c) Averaged frequency shift–distance curves at the interface. The red and blue curves indicate the frequency-shift curves during approach and retraction, respectively. The peak-to-peak oscillation amplitude of the AFM tip is approximately 0.8 nm. The preset frequency shifts are +83 and +666 Hz in (a) and (b and c), respectively. A 2D frequency-shift map during retraction is shown in the ESI,† (Fig. S1(a)). | ||
Assuming that the AFM tip mechanically touches the HOPG surface at Z = 0, the distances between the HOPG surface and the first peak; the first and second peaks; and the second and third peaks are 0.42, 0.50, and 0.86 nm, respectively. These values are consistent with the previous reports and were larger than those reported on hydrophilic surfaces.17,18 Moreover, as shown by the red and blue lines in Fig. 1(c), there is no difference in the frequency shift between the approach and retraction curves. This result indicates that the hydration structure is stable against disturbance resulting from the AFM tip movement, which agrees with a past report.17
Measurements of a bare HOPG/pure water interface with adsorbed gas layers
Fig. 2 shows the results obtained on the HOPG surface where adsorbed gas layers exist. In the height image of Fig. 2(a), there are small black areas that were not observed on the bare HOPG surface shown in Fig. 1(a). In the magnified image on the area indicated by the white square (Fig. 2(b)), we found that the black areas are composed of row-like structures, as indicated by the red arrows. These structures are epitaxially ordered gas layers that are affected by the crystalline structures of the underlying graphite, which have been reported in previous FM-AFM measurements.16,17,29–33 By contrast, the area around the ordered gas layers was ∼0.3 nm higher and did not exhibit the row-like structure. Thus, we deduce that this area comprises disordered gas layers covering the underlying ordered gas layers.30,33Fig. 2(c) shows the 2D frequency-shift map obtained for the same area, which was measured with the same load force as used in Fig. 2(a and b). Therefore, this 2D frequency-shift map was measured on the adsorbed gas layers and the AFM tip did not penetrate them. From the Sader's formula,38 the force applied to the surface in these measurements was approximately 90 pN (shown in ESI,† Fig. S2(a)), which is almost the same as the force under which the adsorbed gas layers were observed.33 It should be noted that the geometry of the 2D frequency-shift map appears to be distorted because of unavoidable thermal drift; thus, this does not represent the actual shape of the substrate surface. In Fig. 2(d), the periodic hydration structure was not observed. This result agrees with the reports that the hydration structure does not appear on ordered17 and disordered gas layers.16 In addition, between the approach and retraction curves, hysteresis of the frequency shift was observed at Z = 0–0.8 nm. | ||
| Fig. 2 HOPG surface with adsorbed gas layers. (a) Height image (2 μm × 2 μm). (b) Magnified image (0.5 μm × 0.5 μm) in the area surrounded by the white broken line in (a). (c) 2D frequency-shift map in the approach. (d) Averaged frequency shift–distance curves on the adsorbed gas layers. The red and blue curves indicate the frequency-shift curves in the approach and retraction, respectively. The peak-to-peak oscillation amplitude of the AFM tip was approximately 0.8 nm. The preset frequency shift was +83 Hz. A 2D frequency-shift map during retraction is shown in the ESI,† (Fig. S1(b)). | ||
Fig. 3(a) shows the height image measured in the same area as in Fig. 2(a) with a high load force (810 pN; ESI,† Fig. S2(b)). The increase in the load force was achieved by controlling the oscillation amplitude or the preset value of the frequency shift. The small black regions observed in Fig. 2(a) disappeared and the bare HOPG surface appeared. This result indicates that the AFM tip with high load force penetrated the adsorbed gas layers and reached the bare HOPG surface; this is consistent with previous reports that not only low-sensitivity AFM (such as tapping mode31) but also FM mode with high load force penetrate adsorbed gas layers.33 When the 2D frequency-shift map of Fig. 3(b) was obtained, the load force increased to 800 pN (shown in ESI,† Fig. S2(a)) by increasing the preset frequency shift while keeping a small amplitude, resulting in the high sensitivity required for the detection of the hydration structures.33 Because this load force is almost the same as that used for the measurement in Fig. 3(a), the AFM tip should have reached the bare HOPG surface. As a result, bright and dark stripes were observed in Fig. 3(b).
 | ||
| Fig. 3 HOPG surface with adsorbed gas layers under high load force. (a) Height image (2 μm × 2 μm). (b) 2D frequency-shift map in the approach. (c) Averaged frequency shift–distance curves when penetrating the adsorbed gas layers. The red and blue curves indicate the frequency-shift curves in the approach and retraction, respectively. The peak-to-peak oscillation amplitude of the AFM tip was approximately 4.0 nm in (a) and 0.8 nm in (b and c). The preset frequency shifts were +83 Hz in (a) and +666 Hz in (b and c). A 2D frequency-shift map during retraction is shown in the ESI,† (Fig. S1(c)). | ||
As indicated by the black broken lines in Fig. 3(c), the distances between the HOPG surface and first peak, and between the first and second peaks were 0.68 and 0.70 nm, respectively. These distances are remarkably longer than those obtained on the bare HOPG surface and are close to the distances previously measured inside the adsorbed gas layers formed on hydrophobic surfaces (0.5–0.8 nm).16 Hence, we conclude that this periodic structure shown in Fig. 3(c) represents the inner structure of the adsorbed gas layers. In addition, hysteresis appeared at Z = 1.2–2.6 nm. In particular, the hysteresis observed at Z = 1.8–2.6 nm is remarkably similar to that observed at Z = 0–0.8 nm in Fig. 2(d). This result indicates that the measurement range of Fig. 3(c) shifted +1.8 nm in the Z direction from that of Fig. 2(d). Moreover, this result also indicates that the interface between the top of the adsorbed gas layers and bulk water is located approximately 1.8 nm away from the HOPG surface and thus the total thickness of the gas layers is 1.8 nm.
Comparison between the frequency shift–distance curves on the bare HOPG surface and inside adsorbed gas layers
For comparison, we again show the frequency shift–distance curves obtained on the bare HOPG surface (Fig. 1(c)) and inside the adsorbed gas layers (Fig. 3(c)) in Fig. 4. As indicated by the green arrows, the three peaks obtained inside the gas layers are located at approximately the same Z position as the valley of the curves obtained on the bare HOPG surface. The peak at Z = 0.3 nm, which was not present in Fig. 3(c), was judged to be a peak from this comparison. We propose that these three peaks represent the regions where the gas molecules are dense (i.e. each adsorbed gas layer). In addition, in the regions where the molecular density of water is high indicated by the black arrows, the frequency shifts on the bare HOPG surface were almost the same as those inside the gas layers. This result indicates that the hydration layers exist even inside the adsorbed gas layers, and that their positions are almost the same as in the case without adsorbed gas layers. In summary, the results in Fig. 4 provide evidence that gas molecules enter the regions between hydration layers, where the molecular density of water is low, and form the adsorbed gas layers; each adsorbed gas layer is sandwiched in hydration layers. | ||
| Fig. 4 Frequency shift–distance curves on a bare HOPG surface and inside adsorbed gas layers. The black arrows indicate the regions where the molecular density of water is high (hydration layers). The green arrows indicate the regions where the molecular density of gas is high (each gas layer) in the approach curve. The data are from Fig. 1(c) and 3(c). | ||
These alternate layers composed of water and gas molecules may be related to gas hydrates, in which hydrogen-bonded network of water creates cavities to trap the gas molecules. Therefore, the gas layers do not aggregate into one and thus they can appear alternately with the hydration layers. On the solid surface, the layered gas hydrate structures are thought to be formed by the interaction among the water molecules, gas molecules, and solid surfaces. Although the interfacial gas hydrates have been suggested in the previous studies,17,30,32 there was no direct evidence of the existence of them until our FM-AFM measurements.
The wettability of the AFM tip is an important factor for interfacial gas measurements. It is known that water molecules always adsorb on the surface of hydrophilic tips.20,35,39 The repulsive force experienced when the hydrophilic AFM tip penetrates the hydration layers is attributed to the temporal confinement of water molecules between the tip and the substrate surface.39 A repulsion force should also occur if there is a high density of gas molecules at the interface, owing to the temporary confinement of the gas molecules between the tip and the substrate. Therefore, our suggestion that the peaks observed in Fig. 3(c) represent each adsorbed gas layers is reasonable.
In the case of the confinement of water molecules, the repulsive force decreases and eventually becomes zero as the confined water molecules are reconstructed into both the hydration layers on the AFM tip and those on the substrate surface. However, when gas molecules are confined, the reconstruction cannot occur on the hydrophilic tip surface because no adsorbed gas layer is present; thus, the gas molecules must move only in the horizontal direction on the substrate surface. As a result, the peaks of the frequency shift generated when penetrating the adsorbed gas layers become larger than those derived from the hydration layers, which is consistent with the comparison shown in Fig. 4. By contrast, a hydrophobic tip is not suitable for the observation of gas phases because its surface dries easily.35 Although we measured the adsorbed gas layers using an AFM tip without hydrophilization treatment (shown in the ESI,† (Fig. S3)), we could not measure the hydration structure because the frequency shift derived from the gas/liquid interface became dominant. This result demonstrates the importance of using a hydrophilic tip for gas phase measurements. Moreover, this shows that the layer existing at the HOPG/pure water interface is composed of gas molecules, not airborne hydrocarbon contaminants.40,41
As mentioned above, the large distance between hydration layers experimentally observed on hydrophobic surfaces has been the subject of debate because it does not coincide with the MD simulation results. Yang et al. speculated that the large distance results from interactions among water, the flat graphene surface, and dissolved gas molecules.17 Schlesinger and Sivan found that the distance between hydration layers decreased to 0.32 nm on the surface of HOPG in degassed solution, which is in good agreement with the MD simulations.16 Uhlig et al. proposed that water molecules are expelled from the vicinity of the hydrophobic surface and are replaced by airborne hydrophobic atoms, resulting in a large distance between adjacent hydration layers (although they propose that the main component of the layers may be hydrocarbon molecules).18 Our new findings are that each adsorbed gas layer exists between the hydration layers and that the distance between hydration layers does not change before and after the formation of adsorbed gas layers.
Based on these experimental results and previous reports, we propose the following relationship between the gas molecules and hydration structures on a hydrophobic surface. First, the molecular concentration of gas on the hydrophobic surface increases compared with that in bulk water because the hydrophobic surface attracts dissolved gas molecules. Then, the attracted gas molecules enter between hydration layers and interact with the hydrophobic surface and water molecules, creating a large distance between adjacent hydration layers. Our proposal that the large distance on hydrophobic surfaces is derived from the dissolved gas molecules is reasonable because gas enrichment occurs universally on hydrophobic surfaces16 and because the large distance observed between hydration layers on hydrophobic surfaces does not depend on the material of the substrate.14,18 In addition, because previous MD simulations of the hydration structure did not take the existence of dissolved gas molecules into account,5,19–21 the distances predicted in these simulations were determined only by the interaction between a hydrophobic surface and water molecules. As a result, there is a discrepancy between the experimental and simulation results of the distance between hydration layers on the hydrophobic surface. This hypothesis is also supported by a previous report that the distance between adjacent hydration layers on a hydrophobic surface in degassed water decreases in comparison with that in non-degassed water and shows good agreement with that predicted by the MD simulation.16 Further, there is no difference in distances on the hydrophilic surface between the experimental and simulation results because the hydrophilic surface does not attract gas molecules.
Our results also showed that there are large distances between hydration layers on the hydrophobic surface without adsorbed gas layers (Fig. 1). This suggests that the gas molecules exist between the hydration layers, even when adsorbed gas layers do not exist. The reason why gas molecules cannot be detected by AFM measurements may be the low molecular density of gas, meaning that gas molecules can escape horizontally without being trapped between the AFM tip and the substrate. In fact, it was reported that the density of adsorbed gas layers is likely to be about 1/4 of that of pure water and about 300 times denser than nitrogen gas under atmospheric pressure.16 Therefore, a certain density of gas molecules is considered to be necessary for them to become stable and detectable structures, such as ordered and disordered gas layers. To elucidate the conditions under which the nucleation of adsorbed gas layers occurs, further experimental studies and MD simulations will be required.
Hysteresis of the frequency shift curves between approach and retraction inside adsorbed gas layers
As mentioned above, hysteresis appeared in the range of Z = 1.2–2.6 nm between the approach and retraction curves measured inside adsorbed gas layers (broken lines in Fig. 4). In the approach, the frequency shift starts to increase at the position of the third hydration layer (Z = 1.8 nm), and the peak appears closer to the substrate side (Z = 1.3 nm) than the third valley where water molecules are sparse (Z = 1.5 nm). By contrast, in the retraction, the peak appears at a position away from the substrate (Z = 1.6 nm), and the frequency shift continues to decrease up to Z = 2.6 nm, which is beyond the position of the third hydration layer.This hysteresis can be explained by the following mechanism. The first and second hydration layers, which are strongly influenced by the substrate, have sufficiently high molecular density of water to act as a barrier to the vertical movement of the sandwiched gas molecules. In addition, the gas molecules very close to the HOPG surface adsorb on the surface by attractive van der Waals forces because the interaction potential between the gas/solid molecules is typically an order of magnitude stronger than that between the gas/gas molecules.30,33 Therefore, when the hydration structure is disturbed by the AFM tip, the gas molecules cannot move vertically and are pushed in the horizontal direction. After retracting the AFM tip, these gas molecules return to their original position. Therefore, the hysteresis does not appear as far as the second hydration layer. However, because the water density approaches the bulk density as the distance from the substrate increases, the density of the third hydration layer becomes lower than that of the first and second layers. In addition, the distance between the second and third hydration layers is 0.86 nm, which is more than twice the diameter of a nitrogen molecule. Furthermore, because of the space between the HOPG surface and the third adsorbed gas layer, the attractive van der Waals forces between them become weak. For these reasons, the vertical constraint on the third adsorbed gas layer becomes weak. Therefore, in the approach, the third peak approaches the substrate side because the gas molecules are pushed toward the second hydration layer. During retraction, the gas molecules are pulled by the AFM tip over the third hydration layer because the water density is relatively low. Hence, there is interaction between the third adsorbed gas layer and the AFM tip, resulting in a frequency shift as far as Z = 2.6 nm.
This mechanism is supported by our previous report that aggregated gas molecules slightly away from the HOPG surface are mobile.33 In addition, Fig. 2(b) shows that the outermost layer of three adsorbed gas layers is a disordered gas layer and the next layer is an ordered gas layer. Therefore, the third adsorbed gas layer is the disordered gas layer, and the underlying first and second gas layers are the ordered gas layers. The stack of several ordered gas layers on the HOPG surface has been previously reported by AFM observations.30
In Fig. 5, we summarize our observation and interpretation of the hydration structure in the vicinity of graphite in air-saturated water with and without adsorbed gas layers. As reported by Schlesinger and Sivan,16 in solutions with low gas concentration, the range of the hydration structure will become short and match that observed in the MD simulations.
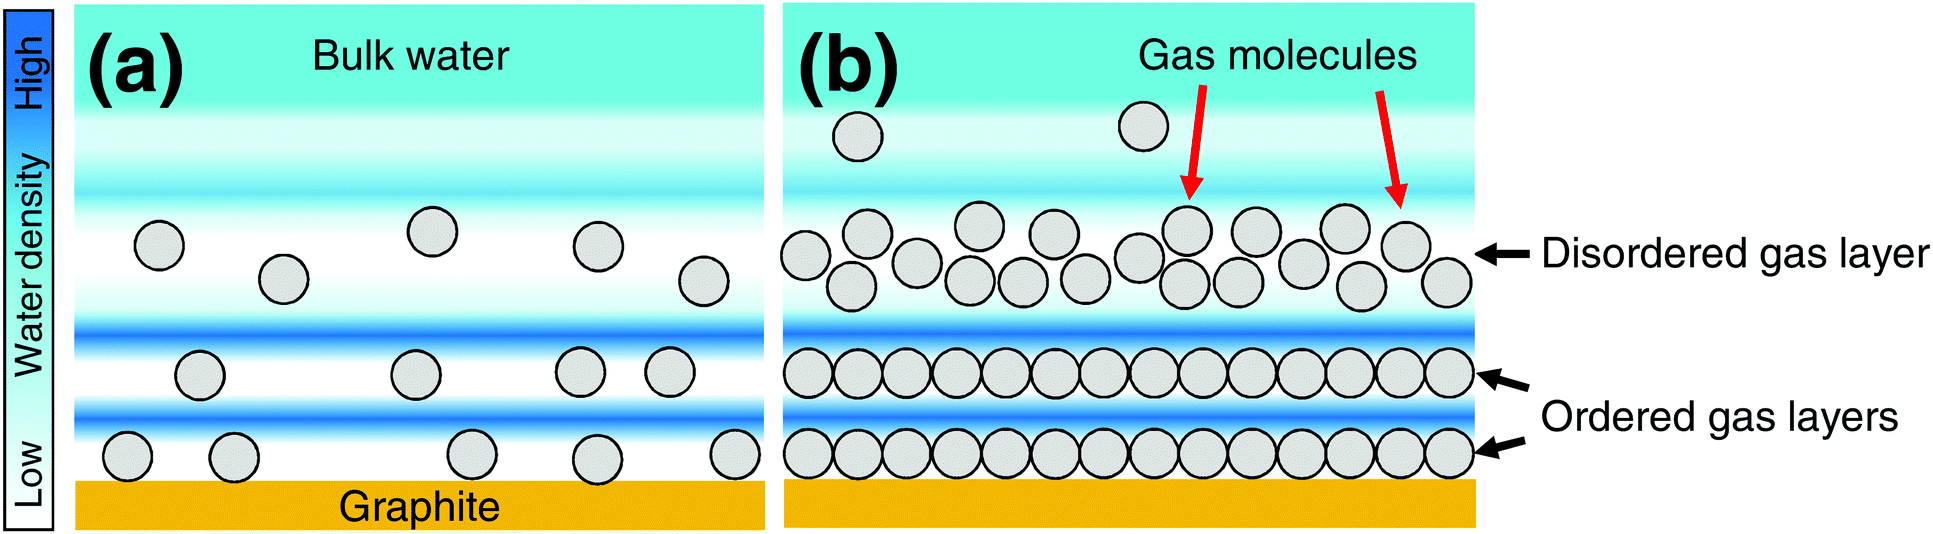 | ||
| Fig. 5 Schematic images of hydration structures on a graphite surface. The hydration structures on the graphite are compared (a) without and (b) with adsorbed gas layers in air-saturated pure water. The circles indicate gas molecules. | ||
Adsorbed gas layers or airborne hydrocarbon contaminants
It has been reported that airborne hydrocarbon contaminant can construct a row-like structure on the graphite surface, which is similar to, and thus hard to distinguish from an ordered gas layer.40,41 However, it has been also reported that there is a strong relationship between the nucleation of ordered gas layers and the concentration of dissolved gas molecules in pure water.29–32 In addition, water protects the graphite surface from airborne hydrocarbon contaminants.42 Furthermore, our previous reports have shown that the interfacial domains nucleated using the same protocol as this study are indeed gas phases.33,35 Our measurement results obtained with the hydrophobic tip (Fig. S3 in the ESI,†) also indicate that the layers covering the HOPG surface are composed of gas molecules. Therefore, we are confident that the components of the observed molecular layers are gas molecules.Conclusions
Because almost all of the previous reports focused separately on the adsorbed gas layers or the hydration structure, there is no data linking the internal structure of the adsorbed gas layers to the hydration structure. Our FM-AFM study clarifies this relationship by penetrating the adsorbed gas layers with high load force. We propose that the adsorbed gas layers are located at the region where the molecular density of water is low inside a hydration structure and appear alternately with the hydration layers. The distance between adjacent hydration layers was longer than that obtained by MD simulations, even before the formation of adsorbed gas layers. Therefore, we conclude that the enriched gas molecules, which are undetectable owing to the relatively low gas density, are present before the formation of the adsorbed gas layers and interact with the hydration layers, thereby increasing the distance between them.From the height images and the hysteresis of the frequency-shift curves in the approach and retraction, we found that the first and second adsorbed gas layers were row-like ordered gas layers, and did not move vertically because of the barrier of hydration layers and strong adsorption on the HOPG surface. By contrast, the third layer was a disordered gas layer and slightly moved in the vertical direction following the movement of the AFM tip. From these results, we determined the structures of water and gas molecules in the vicinity of the graphite surface with and without adsorbed gas layers. Our results suggest the importance of gas molecules at the hydrophobic substrate/pure water interface and will contribute to our understanding of fundamental phenomena at solid/liquid interfaces, as typified by the hydrophobic interaction. Future studies on the hydrophobic surface in water should consider the effect of dissolved gas molecules. We expect that the most important unresolved questions, such as the detailed interaction force among hydrophobic material, gas molecules, and water, the requisite conditions for nucleation of adsorbed gas layers, and their molecular configurations will be addressed in the near future by MD simulations that take the presence of gas molecules into consideration.
Conflicts of interest
There are no conflicts to declare.Acknowledgements
This work was partially supported by JST CREST Grant No. JPMJCR18I1, JSPS KAKENHI Grant No. JP17H03186, a Grant-in-Aid for JSPS Research Fellow No. JP18J11880, and a project commissioned by the New Energy and Industrial Technology Development Organization (NEDO), Japan. We thank Prof. Sushanta Mitra, Dr Naga Siva Kumar Gunda, Dr Enrique Wagemann, Mr Sirshendu Misra and Mr Tatsuya Ikuta for their scientific support.References
- O. Björneholm, M. H. Hansen, A. Hodgson, L. M. Liu, D. T. Limmer, A. Michaelides, P. Pedevilla, J. Rossmeisl, H. Shen and G. Tocci, et al., Water at Interfaces, Chem. Rev., 2016, 116, 7698–7726 CrossRef PubMed.
- E. E. Meyer, K. J. Rosenberg and J. Israelachvili, Recent Progress in Understanding Hydrophobic Interactions, Proc. Natl. Acad. Sci. U. S. A., 2006, 103, 15739–15746 CrossRef CAS PubMed.
- D. A. Doshi, E. B. Watkins, J. N. Israelachvili and J. Majewski, Reduced Water Density at Hydrophobic Surfaces: Effect of Dissolved Gases, Proc. Natl. Acad. Sci. U. S. A., 2005, 102, 9458–9462 CrossRef CAS PubMed.
- D. M. Huang, C. Sendner, D. Horinek, R. R. Netz and L. Bocquet, Water Slippage versus Contact Angle: A Quasi universal Relationship, Phys. Rev. Lett., 2008, 101, 226101 CrossRef PubMed.
- G. Tocci, L. Joly and A. Michaelides, Friction of Water on Graphene and Hexagonal Boron Nitride from Ab Initio Methods: Very Different Slippage despite Very Similar Interface Structures, Nano Lett., 2014, 14, 6872–6877 CrossRef CAS PubMed.
- Y. Yamaguchi, H. Kusudo, D. Surblys, T. Omori and G. Kikugawa, Interpretation of Young's Equation for a Liquid Droplet on a Flat and Smooth Solid Surface: Mechanical and Thermodynamic Routes with a Simple Lennard-Jones Liquid, J. Chem. Phys., 2019, 150, 044701 CrossRef PubMed.
- P. Raiteri and J. D. Gale, Water Is the Key to Nonclassical Nucleation of Amorphous Calcium Carbonate, J. Am. Chem. Soc., 2010, 132, 17623–17634 CrossRef CAS PubMed.
- S. Mondal, S. Mukherjee and B. Bagchi, Protein Hydration Dynamics: Much Ado about Nothing?, J. Phys. Chem. Lett., 2017, 8, 4878–4882 CrossRef CAS PubMed.
- D. Laage, T. Elsaesser and J. T. Hynes, Water Dynamics in the Hydration Shells of Biomolecules, Chem. Rev., 2017, 117, 10694–10725 CrossRef CAS PubMed.
- J. Israelachvili and R. Pashley, Molecular Layering of Water at Surfaces and Origin of Repulsive Hydration Forces, Nature, 1983, 306, 249–250 CrossRef CAS.
- J. Israelachvili and H. Wennerström, Role of Hydration and Water Structure in Biological and Colloidal Interactions, Nature, 1996, 379, 219–225 CrossRef CAS PubMed.
- L. Cheng, P. Fenter, K. L. Nagy, M. L. Schlegel and N. C. Sturchio, Molecular-Scale Density Oscillations in Water Adjacent to a Mica Surface, Phys. Rev. Lett., 2001, 87, 156103 CrossRef CAS PubMed.
- K. Suzuki, N. Oyabu, K. Kobayashi, K. Matsushige and H. Yamada, Atomic-Resolution Imaging of Graphite–Water Interface by Frequency Modulation Atomic Force Microscopy, Appl. Phys. Express, 2011, 4, 125102 CrossRef.
- I. Schlesinger and U. Sivan, New Information on the Hydrophobic Interaction Revealed by Frequency Modulation AFM, Langmuir, 2017, 33, 2485–2496 CrossRef CAS PubMed.
- T. Fukuma and R. Garcia, Atomic- and Molecular-Resolution Mapping of Solid-Liquid Interfaces by 3D Atomic Force Microscopy, ACS Nano, 2018, 12, 11785–11797 CrossRef CAS PubMed.
- I. Schlesinger and U. Sivan, Three-Dimensional Characterization of Layers of Condensed Gas Molecules Forming Universally on Hydrophobic Surfaces, J. Am. Chem. Soc., 2018, 140, 10473–10481 CrossRef CAS PubMed.
- C. W. Yang, K. Miyazawa, T. Fukuma, K. Miyata and I. S. Hwang, Direct Comparison between Subnanometer Hydration Structures on Hydrophilic and Hydrophobic Surfaces via Three-Dimensional Scanning Force Microscopy, Phys. Chem. Chem. Phys., 2018, 20, 23522–23527 RSC.
- M. R. Uhlig, D. Martin-Jimenez and R. Garcia, Atomic-Scale Mapping of Hydrophobic Layers on Graphene and Few-Layer MoS2 and WSe2 in Water, Nat. Commun., 2019, 10, 1–7 CrossRef CAS PubMed.
- J. G. Vilhena, C. Pimentel, P. Pedraz, F. Luo, P. A. Serena, C. M. Pina, E. Gnecco and R. Pérez, Atomic-Scale Sliding Friction on Graphene in Water, ACS Nano, 2016, 10, 4288–4293 CrossRef CAS PubMed.
- Z. Zhang, S. Ryu, Y. Ahn and J. Jang, Molecular Features of Hydration Layers Probed by Atomic Force Microscopy, Phys. Chem. Chem. Phys., 2018, 20, 30492–30501 RSC.
- D. Argyris, N. R. Tummala, A. Striolo and D. R. Cole, Molecular Structure and Dynamics in Thin Water Films at the Silica and Graphite Surfaces, J. Phys. Chem. C, 2008, 112, 13587–13599 CrossRef CAS.
- P. Spijker, T. Hiasa, T. Musso, R. Nishioka, H. Onishi and A. S. Foster, Understanding the Interface of Liquids with an Organic Crystal Surface from Atomistic Simulations and AFM Experiments, J. Phys. Chem. C, 2014, 118, 2058–2066 CrossRef CAS.
- H. Peng, M. A. Hampton and A. V. Nguyen, Nanobubbles Do Not Sit Alone at the Solid-Liquid Interface, Langmuir, 2013, 29, 6123–6130 CrossRef CAS PubMed.
- S. Wang, L. Zhou, X. Wang, C. Wang, Y. Dong, Y. Zhang, Y. Gao, L. Zhang and J. Hu, Force Spectroscopy Revealed a High-Gas-Density State near the Graphite Substrate inside Surface Nanobubbles, Langmuir, 2019, 35, 2498–2505 CrossRef CAS PubMed.
- N. N. Nguyen, A. V. Nguyen, K. M. Steel, L. X. Dang and M. Galib, Interfacial Gas Enrichment at Hydrophobic Surfaces and the Origin of Promotion of Gas Hydrate Formation by Hydrophobic Solid Particles, J. Phys. Chem. C, 2017, 121, 3830–3840 CrossRef CAS.
- H. Peng, G. R. Birkett and A. V. Nguyen, Origin of Interfacial Nanoscopic Gaseous Domains and Formation of Dense Gas Layer at Hydrophobic Solid–Water Interface, Langmuir, 2013, 29, 15266–15274 CrossRef CAS PubMed.
- S. M. Dammer and D. Lohse, Gas Enrichment at Liquid–Wall Interfaces, Phys. Rev. Lett., 2006, 206101 CrossRef PubMed.
- C. L. Wang, Z. X. Li, J. Y. Li, P. Xiu, J. Hu and H. P. Fang, High Density Gas State at Water/Graphite Interface Studied by Molecular Dynamics Simulation, Chin. Phys. B, 2008, 17, 2646–2654 CrossRef CAS.
- Y.-H. Lu, C.-W. Yang and I.-S. Hwang, Atomic Force Microscopy Study of Nitrogen Molecule Self-Assembly at the HOPG-Water Interface, Appl. Surf. Sci., 2014, 304, 56–64 CrossRef CAS.
- Y.-H. Lu, C.-W. Yang, C.-K. Fang, H.-C. Ko and I.-S. Hwang, Interface-Induced Ordering of Gas Molecules Confined in a Small Space, Sci. Rep., 2014, 4, 7189 CrossRef PubMed.
- Y.-H. Lu, C.-W. Yang and I.-S. Hwang, Molecular Layer of Gaslike Domains at a Hydrophobic Water Interface Observed by Frequency-Modulation Atomic Force Microscopy, Langmuir, 2012, 28, 12691–12695 CrossRef CAS PubMed.
- C.-K. Fang, H.-C. Ko, C.-W. Yang, Y.-H. Lu and I.-S. Hwang, Nucleation Processes of Nanobubbles at a Solid/Water Interface, Sci. Rep., 2016, 6, 24651 CrossRef CAS PubMed.
- H. Teshima, Y. Takata and K. Takahashi, Adsorbed Gas Layers Limit the Mobility of Micropancakes, Appl. Phys. Lett., 2019, 115, 071603 CrossRef.
- J. E. Sader, J. W. M. Chon and P. Mulvaney, Calibration of Rectangular Atomic Force Microscope Cantilevers, Rev. Sci. Instrum., 1999, 70, 3967–3969 CrossRef CAS.
- H. Teshima, K. Takahashi, Y. Takata and T. Nishiyama, Wettability of AFM Tip Influences the Profile of Interfacial Nanobubbles, J. Appl. Phys., 2018, 123, 054303 CrossRef.
- S.-T. Lou, Z.-Q. Ouyang, Y. Zhang, X.-J. Li, J. Hu, M.-Q. Li and F.-J. Yang, Nanobubbles on Solid Surface Imaged by Atomic Force Microscopy, J. Vac. Sci. Technol., B: Microelectron. Nanometer Struct. –Process., Meas., Phenom., 2000, 18, 2573–2575 CrossRef CAS.
- R. P. Berkelaar, E. Dietrich, G. A. M. Kip, E. S. Kooij, H. J. W. Zandvliet and D. Lohse, Exposing Nanobubble-like Objects to a Degassed Environment, Soft Matter, 2014, 10, 4947–4955 RSC.
- J. E. Sader and S. P. Jarvis, Accurate Formulas for Interaction Force and Energy in Frequency Modulation Force Spectroscopy, Appl. Phys. Lett., 2004, 84, 1801–1803 CrossRef CAS.
- T. Fukuma, B. Reischl, N. Kobayashi, P. Spijker, F. F. Canova, K. Miyazawa and A. S. Foster, Mechanism of Atomic Force Microscopy Imaging of Three-Dimensional Hydration Structures at a Solid-Liquid Interface, Phys. Rev. B: Condens. Matter Mater. Phys., 2015, 92, 155412 CrossRef.
- D. S. Wastl, A. J. Weymouth and F. J. Giessibl, Atomically Resolved Graphitic Surfaces in Air by Atomic Force Microscopy, ACS Nano, 2014, 8, 5233–5239 CrossRef CAS PubMed.
- A. Temiryazev, A. Frolov and M. Temiryazeva, Atomic-Force Microscopy Study of Self-Assembled Atmospheric Contamination on Graphene and Graphite Surfaces, Carbon, 2019, 143, 30–37 CrossRef CAS.
- Z. Li, A. Kozbial, N. Nioradze, D. Parobek, G. J. Shenoy, M. Salim, S. Amemiya, L. Li and H. Liu, Water Protects Graphitic Surface from Airborne Hydrocarbon Contamination, ACS Nano, 2016, 10, 349–359 CrossRef CAS PubMed.
Footnote |
| † Electronic supplementary information (ESI) available: Frequency-shift maps during retraction, force-distance curves calculated by Sader's formula, and measurement results of interfacial gas phases using hydrophobic AFM tip. See DOI: 10.1039/d0cp01719a |
| This journal is © the Owner Societies 2020 |