Mechanism of wettability alteration of the calcite {10![[1 with combining macron]](https://www.rsc.org/images/entities/h2_char_0031_0304.gif) 4} surface†
4} surface†
Received
30th March 2020
, Accepted 11th June 2020
First published on 29th June 2020
1. Introduction
Calcite (CaCO3), one of the most frequently occurring minerals in earth's crust, is of basic importance in almost all geological systems1 and therefore has been the subject of manifold research. In particular, the calcite–water interface has been investigated extensively both by experiments2–4 and computations.5–11 Applying X-ray scattering to the water molecules, researchers have observed two distinct hydration layers next to calcite,4 in agreement with subsequent molecular dynamics (MD) simulations that also show highly ordered water layers at the interface5,6 due to hydrogen bonding (OHwater⋯Ocalcite) and electrostatic interactions (Owater⋯Cacalcite).7,8 As molecular ordering at the calcite–water interface alters the surface properties of calcite, it plays a key role in the selective attachment of organic additives.9,10
Injection of low salinity water in oil reservoirs (water/brine flooding process) can enhance the oil recovery by ∼10%.12,13 It is known that interaction of salt ions with calcite is responsible for wettability alteration from a strongly oil-wet toward a water-wet state.14–17 In particular, low-salinity brines containing monovalent ions result in more water-wet characteristics. It has been concluded from experimental results that the mechanism of wettability modification is related to the affinity of the salt ions to calcite,18 and theoretical studies have been performed to deepen the understanding.19–21 In particular, a considerable density of monovalent ions (Na+ and Cl−) has been observed close to calcite in a simulation of the calcite–hydrocarbon interaction in concentrated brine, and decreasing interaction between the organic molecules and calcite for increasing salinity of the brine has been attributed to the formation of these salt layers.19 Indeed, an electric double layer is formed with Na+ ions in the Stern layer and Cl− ions in the diffuse layer.20
However, in spite of these works, it is still an open question how exactly, at the atomic level, the water wettability is enhanced by the salt ions in brine. Such knowledge would be valuable not only for oil recovery but also for other important fields such as contaminant migration and bio-mineralization. In the present work, we therefore aim to establish insights into the mechanism of wettability alteration of the calcite {10![[1 with combining macron]](https://www.rsc.org/images/entities/char_0031_0304.gif) 4} surface, the most stable surface of calcite,22,23 in the presence of brine. To this aim, we will investigate the interaction between this surface and the monovalent and divalent ions in saline water by molecular dynamics (MD) simulations, a powerful method for studying adsorption at the atomic level. Moreover, by means of quantum-chemical simulations, we will analyze how the calcite–water interaction energy changes in the presence of salt ions. These data will provide fundamental insights into the alteration of the water wettability and allow us to shed new light on the role of brine in enhanced oil recovery.
4} surface, the most stable surface of calcite,22,23 in the presence of brine. To this aim, we will investigate the interaction between this surface and the monovalent and divalent ions in saline water by molecular dynamics (MD) simulations, a powerful method for studying adsorption at the atomic level. Moreover, by means of quantum-chemical simulations, we will analyze how the calcite–water interaction energy changes in the presence of salt ions. These data will provide fundamental insights into the alteration of the water wettability and allow us to shed new light on the role of brine in enhanced oil recovery.
2. Computational details
The MD simulations described in this work refer to a 67.5 Å thick calcite slab (six layers of calcite) with a size of 89.1 Å × 89.8 Å in the xy-plane. It has been shown previously that this size is enough to achieve converged data.19–21 The atoms in the three bottom layers are frozen in their bulk positions to avoid artificial distortions due to the finite thickness of the slab. We note that water molecules can dissociate on the calcite {104} surface only at defects.24 The length of the simulation cell in the z-direction is set to 129.0 Å to add brine (with different compositions). The Lennard-Jones potentials of ref. 25 are used to describe the non-bonding van der Waals interactions (intra-calcite and calcite–brine interface). The optimized potential for liquid simulations all-atom (OPLS-AA) force-field parameters are adopted for the water molecules and salt ions.26 The TIP3P water model is adopted.27 Electrostatic interactions are calculated using particle-mesh Ewald summation with a real-space cutoff of 12 Å. The van der Waals cutoffs are also set to 12 Å. The water molecules and CO32− groups are treated as rigid bodies with all bonds constrained, using SETTLE (water)28 and LINCS.29 For executing the MD simulations, the GROMACS simulation package (version 5.1.5) is employed.30–32 A time step of 2 fs is found to provide stable results.
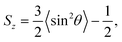
We first execute a steepest-descent energy minimization to remove atomic overlaps. Then the systems are equilibrated in 1 ns NVT runs at a temperature of 363 K, controlled by a Nosé–Hoover thermostat.33 Afterwards 100 ns NPT runs, which ensure statistical convergence, are executed at a temperature of 363 K and semi-isotropic pressure of 206 bar (typical conditions of oil reservoir), controlled by a velocity rescaling thermostat34 and Berendsen barostat35 with a coupling constant of 1 ps and a compressibility of 4.5 × 10⁻⁵ bar. The last 10 ns of the NPT runs are used to examine the molecular ordering in terms of the orientation order parameter36
| |  | (1) |
where
θ is the angle between the
xy-plane (interface plane) and the vector connecting the two hydrogen atoms of a water molecule. The average is taken over time and all molecules in a slab of 0.002 Å thickness that is aligned parallel to the calcite–brine interface in a distance
z.
Sz varies between −0.5 (orientation parallel to the interface) and 1 (orientation perpendicular to the interface), with a value of 0 in the case of isotropic orientation.
For water molecules and salt ions on the calcite {104} surface the adsorption energy (Ea) is determined by first-principles simulations using the Vienna ab initio simulation package.37 A periodic slab approach is adopted with a 15 Å vacuum region in the z-direction and at least 10 Å distance between images of the adsorbate in the xy-plane. The projector-augmented wave method38 and Perdew–Burke–Ernzerhof functional are used. Dispersion interactions are taken into account by the Grimme method (DFT-D3)39 to obtain accurate absorption heights and energies. For the Brillouin zone integrations, a 2 × 2 × 1 Γ-centered Monkhorst-Pack mesh is used in the structure optimizations and a 6 × 6 × 1 Γ-centered Monkhorst-Pack mesh in the self-consistency calculations. A Gaussian smearing of 0.05 eV is adopted. The kinetic energy cutoff is set to 400 eV. During the structure optimizations the atoms in the two bottom layers of the calcite slab are fixed. For the other atoms the positions are relaxed until the Hellmann–Feynman forces have converged to 0.01 eV Å−1. An energy convergence criterion of 10−6 eV is adopted. We calculate
| | | Ea = Etotal − (Ewater/ion + Ecalcite), | (2) |
where
Ewater/ion is the total energy of an isolated water molecule or salt ion,
Ecalcite is the total energy of the bare calcite slab, and
Etotal is the total energy after adsorption. To examine the charge transfer between the adsorbate and calcite slab a Bader charge analysis is performed.
40
3. Results and discussion
3.1. Water on the calcite {10![[1 with combining macron]](https://www.rsc.org/images/entities/h3_char_0031_0304.gif) 4} surface
4} surface
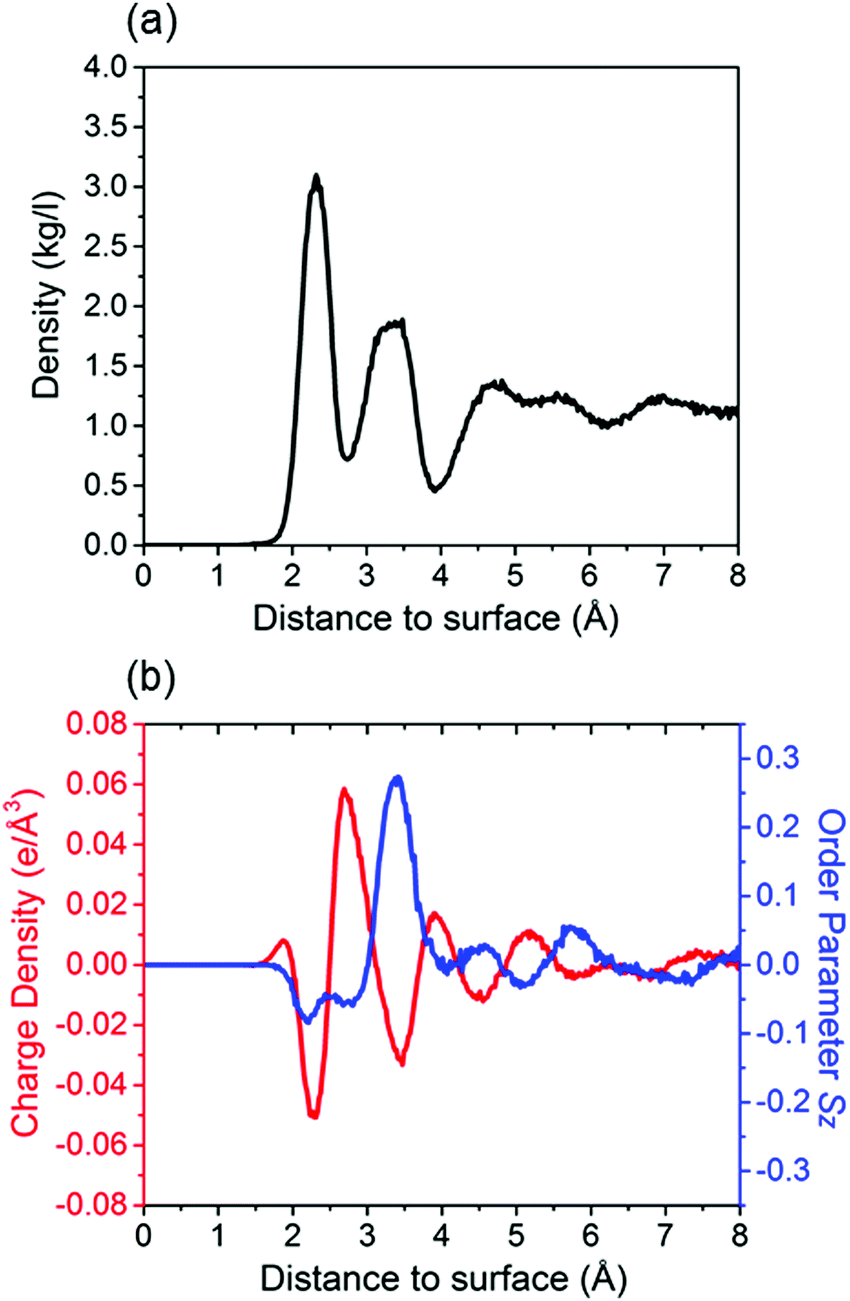
As a first step, we study (deionized) water on the calcite {104} surface. In our NPT run the temperature and pressure are controlled well, the total energy fluctuations are equilibrated to <0.1%, and the root mean square deviation reaches a plateau (Fig. S1, ESI†). The mass density of the water molecules is shown in Fig. 1a as function of the (perpendicular) distance to the calcite {104} surface. Oscillations represent several adsorption layers of water molecules. The first two layers appear at about 2.3 Å and 3.4 Å, which agrees well with experimental results (2.3 ± 0.1 Å and 3.45 ± 0.2 Å).4 Similar to previous MD simulations,9,19 we observe that the ordering decreases when the distance to the calcite {104} surface increases. The highly ordered hydration layers are also reflected in the charge density and order parameter profiles given in Fig. 1b. Two peaks of negative charge are due to the Owater atoms and are located at about 2.3 Å and 3.4 Å. Between them we observe a peak of positive charge due to the Hwater atoms. Moreover, deviations of the order parameter from a value of 0 show that the orientations of the water molecules are not random. Those located in the first hydration layer favor orientation parallel to the calcite {104} surface, while those in the second hydration layer tend to be oriented perpendicular.
 |
| | Fig. 1 (a) Mass density of water as function of the (perpendicular) distance to the calcite {104} surface. (b) Corresponding charge density and order parameter. Averages are taken over slabs of 0.002 Å thickness parallel to the calcite–brine interface. The last 10 ns of the NPT runs are used for data collection. The distance is measured from the outmost Ca2+ ion. | |
The calcite–brine interface after the MD simulation is shown in Fig. 2. In agreement with previous studies,7,8,20 hydrogen bonding (OHwater⋯Ocalcite, OHwater⋯Owater) and electrostatic interactions (Owater⋯Cacalcite) result in highly ordered hydration layers. We observe that the orientation of the water molecules follows the structural periodicity of calcite. The Ca2+ ions at the interface attract the oxygen atoms of the nearby water molecules such that their OH bonds are oriented almost parallel to the interface, giving rise to the first hydration layer. The water molecules close to CO32− groups point with their hydrogen atoms toward the interface, giving rise to the second hydration layer. This pattern is similar to results from force-field41 and quantum-chemical42 simulations.
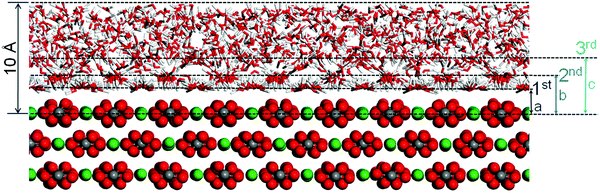 |
| | Fig. 2 Hydrated calcite {104} surface after the MD simulation. For clarity only a part of the system is shown. Three solvation layers are identified with average distances of a = 2.3 Å, b = 3.4 Å, and c = 4.8 Å. H is represented in white, C in gray, O in red, and Ca in green. | |
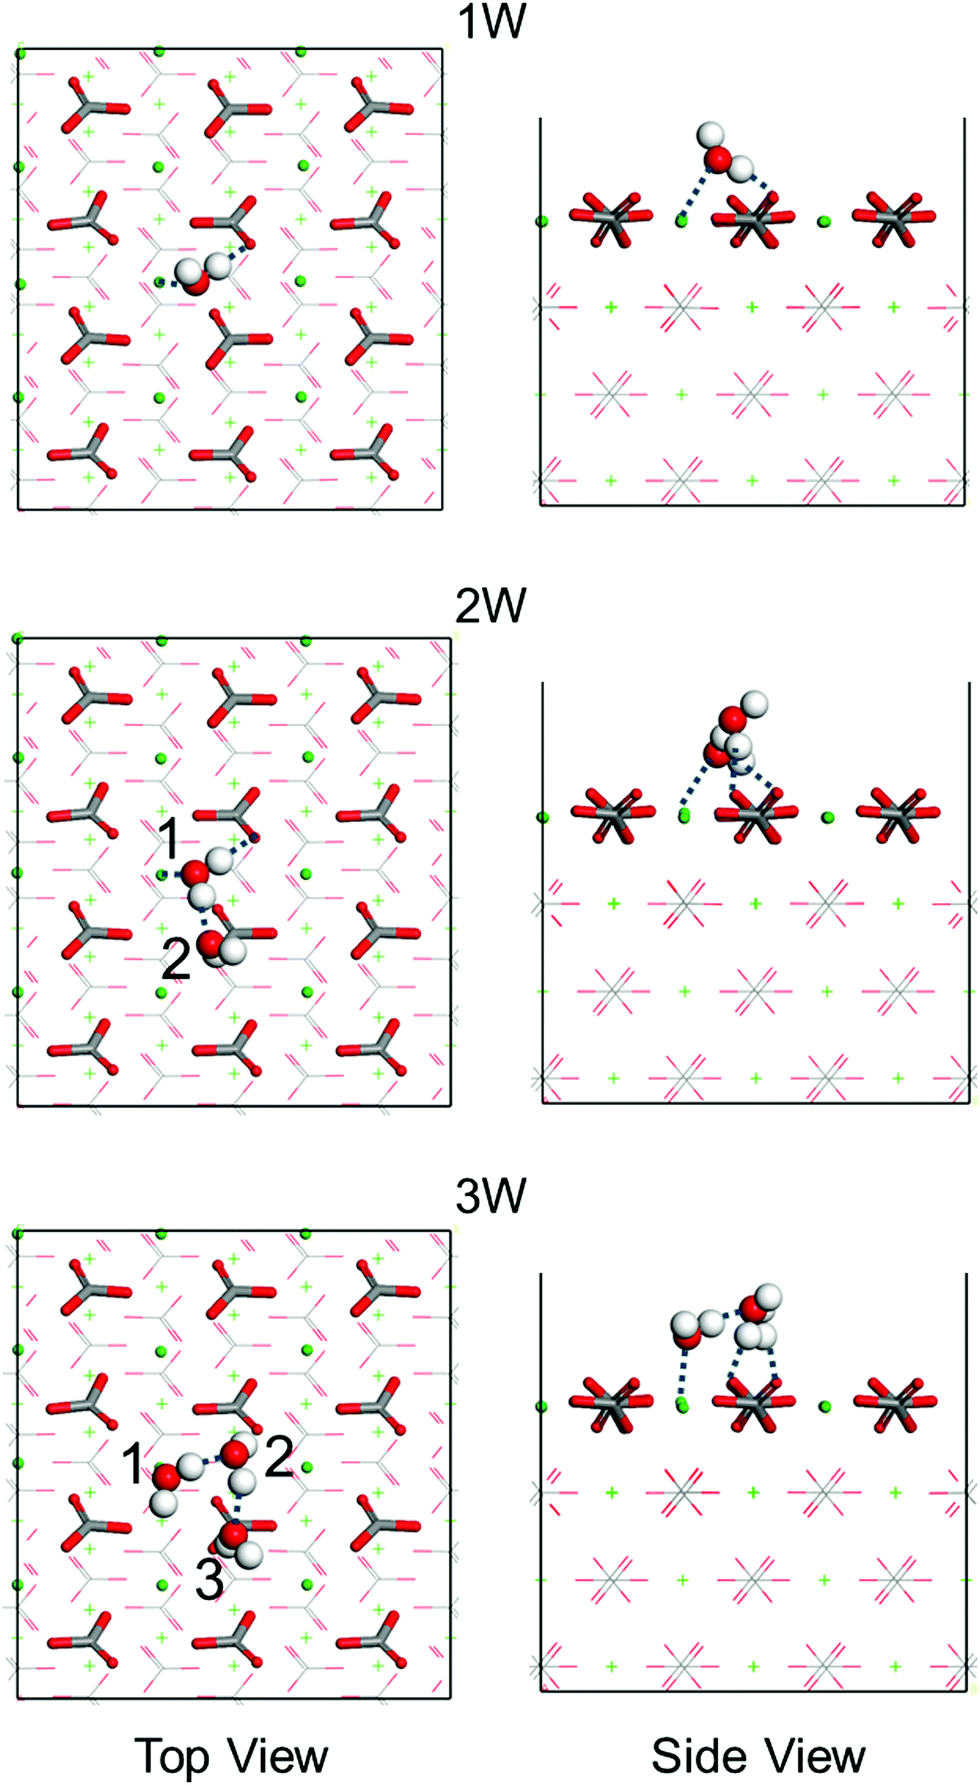
A series of first-principles simulations is used to obtain accurate adsorption energies of water molecules on the calcite {104} surface. According to the average structure obtained from the MD simulations (Fig. S2, ESI†), hydrogen bonds are formed between the water molecules at the interface. For this reason, we consider clusters of one to three water molecules on the calcite {104} surface using simulation cells of size 14.9 Å × 16.1 Å × 25.7 Å (Fig. S3, ESI†). The obtained adsorption energies are collected in Table 1 and the corresponding energetically favorable binding geometries are shown in Fig. 3. For a single water molecule we find an adsorption energy of −20.8 kcal mol−1, reasonably close to a previously reported result (−17.1 kcal mol−1).8 The adsorption energy is enhanced when a second and a third water molecule are added because of the formation of inter-molecular hydrogen bonds (Table 1).
Table 1 Adsorption energies (in kcal mol−1) on the calcite {104} surface as obtained from first-principles simulations. The labels refer to Fig. 3, 5, 6, and Fig. S4 (ESI). The energies required for deformation of the calcite {104} surface during adsorption are given in brackets
| 1W molecule 1 |
2W molecule 1 |
2W molecule 2 |
3W molecule 1 |
3W molecule 2 |
3W molecule 3 |
| −20.8 (1.8) |
−29.5 (2.7) |
−18.0 (2.7) |
−31.4 (3.5) |
−24.2 (3.5) |
−17.8 (3.5) |
|
|
| Na |
Mg |
Ca |
Cl |
|
|
| −12.9 (1.3) |
−8.8 (1.7) |
−17.8 (2.6) |
−25.1 (3.7) |
|
|
|
|
| Na/1W molecule 1 |
Na/2W molecule 1 |
Na/2W molecule 2 |
Na/3W molecule 1 |
Na/3W molecule 2 |
Na/3W molecule 3 |
| −31.1 (1.4) |
−31.4 (2.4) |
−25.6 (2.4) |
−30.9 (3.2) |
−26.8 (3.2) |
−26.5 (3.2) |
|
|
| Cl/1W molecule 1 |
Cl/2W molecule 1 |
Cl/2W molecule 2 |
|
|
|
| −27.1 (4.6) |
−28.7 (5.7) |
−26.7 (5.7) |
|
|
|
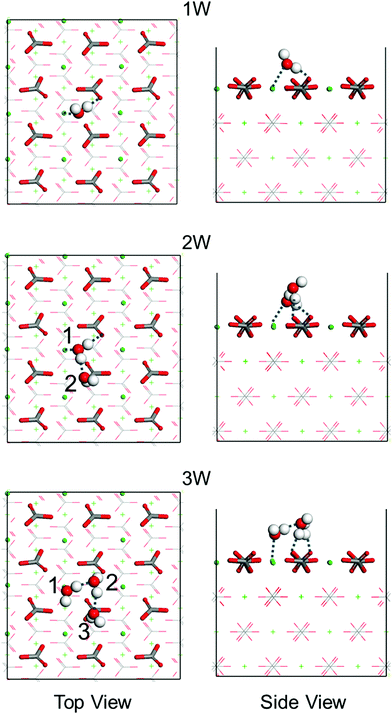 |
| | Fig. 3 Top and side views of the energetically favorable binding geometries of one (1W), two (2W), or three (3W) water molecules (numbered) on the calcite {104} surface, see Fig. S5 (ESI†) for the less favorable binding geometries. Dashed lines mark hydrogen bonds. H is represented in white, C in gray, O in red, and Ca in green. | |
3.2. Salt ions and brine on the calcite {104} surface
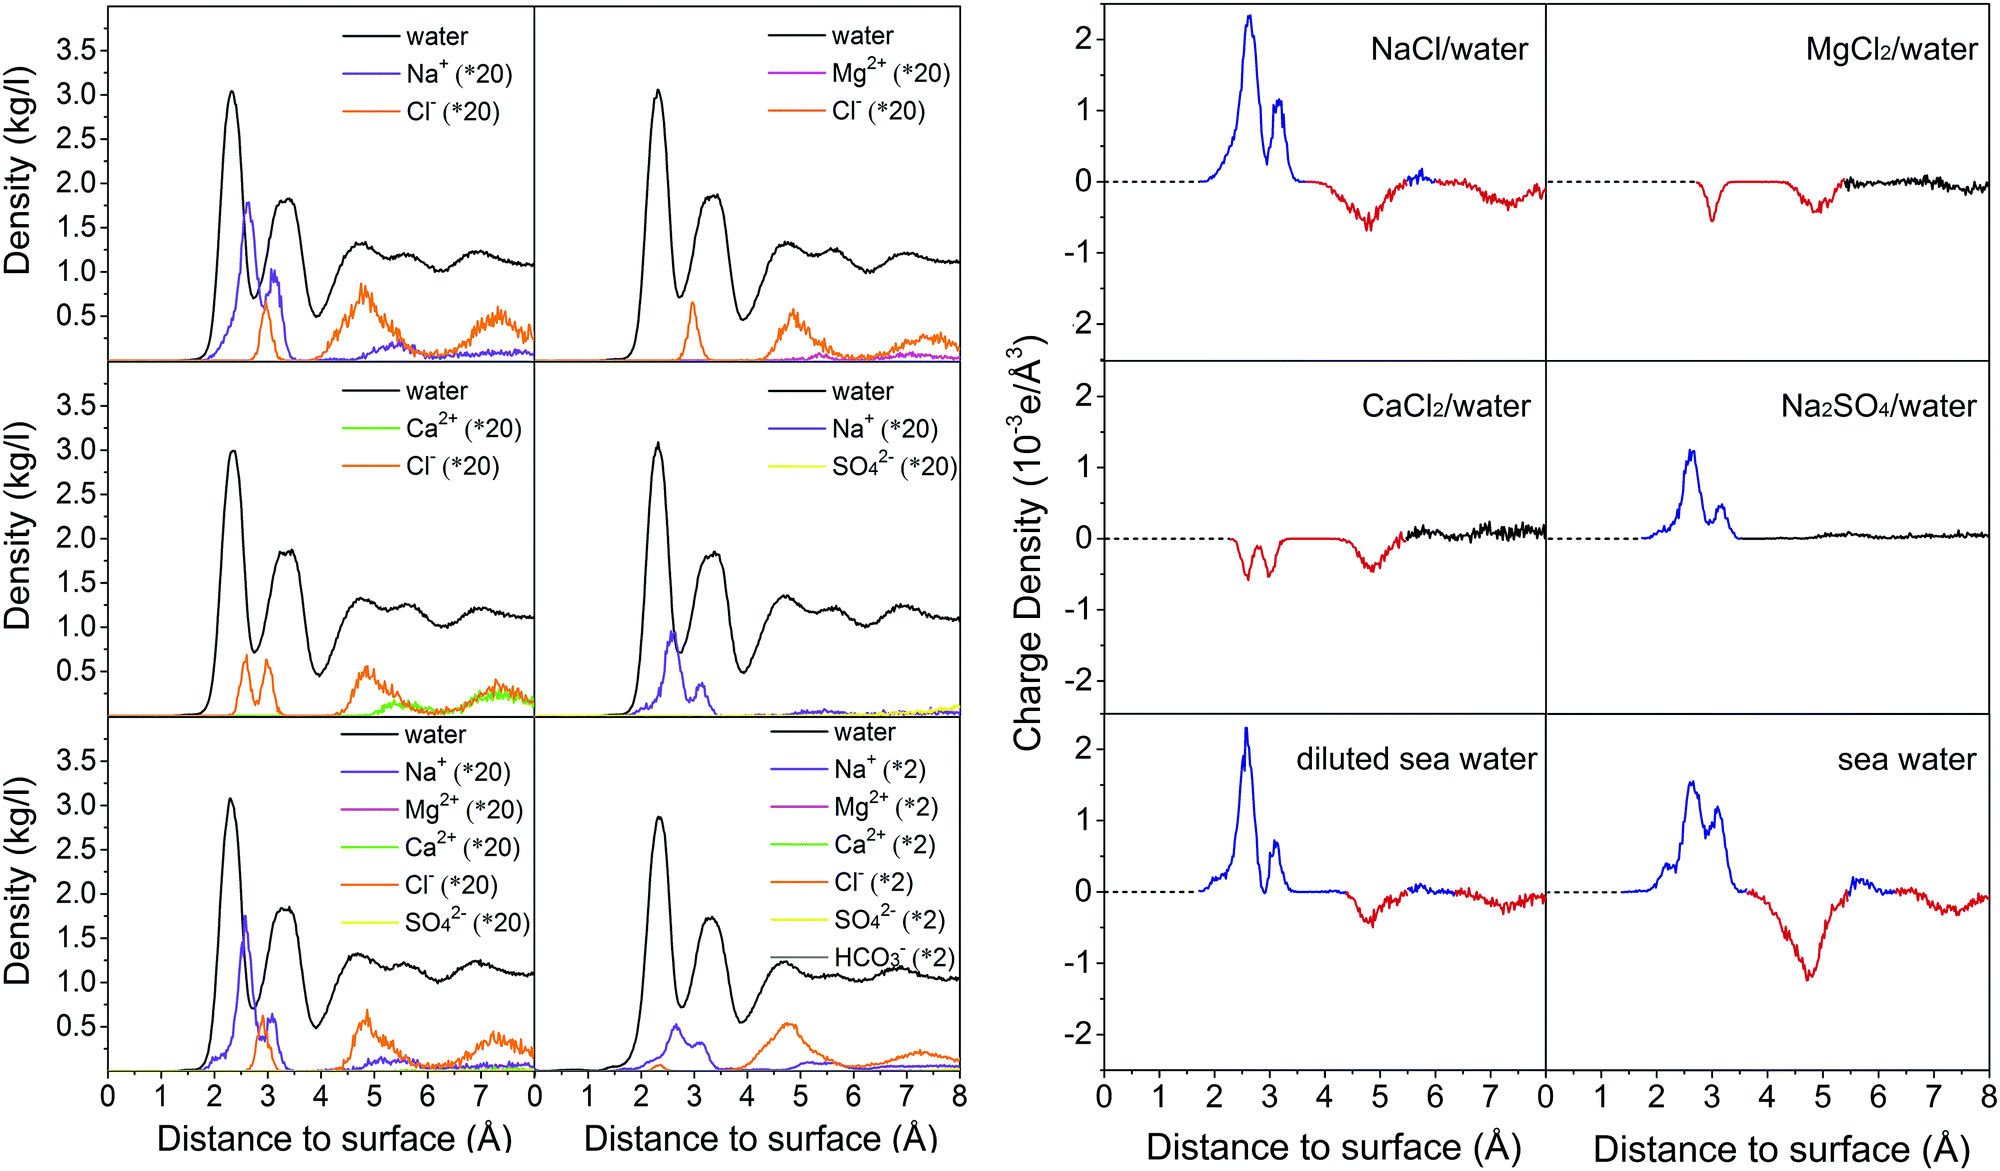
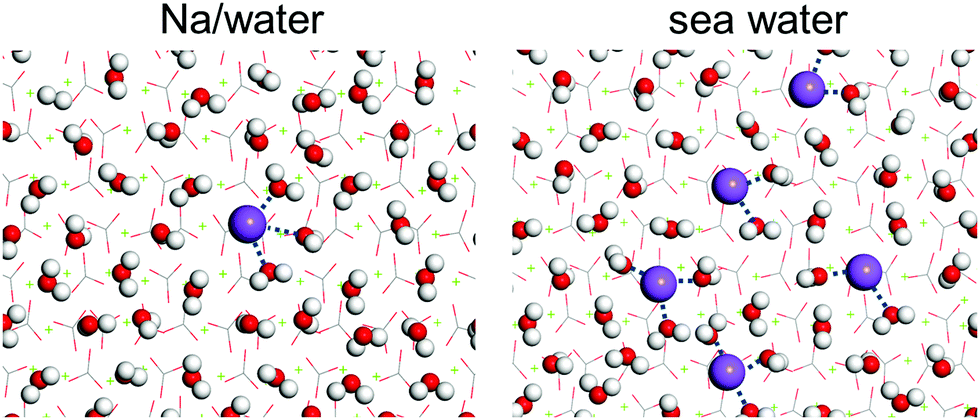
To examine whether the formed hydration layers can be broken by salt ions, the dynamics of brine on the calcite {104} surface is investigated by MD simulations for the compositions of Table 2. The convergence behavior is shown in Fig. S6–S11 (ESI†). Fig. 4 gives mass density profiles of the water molecules and salt ions as function of the (perpendicular) distance from the calcite {104} surface. We find that the divalent Ca2+ and Mg2+ ions cannot penetrate the hydration layers (in agreement with previous MD simulations19,20), whereas the Na+ and Cl− ions can penetrate them to interact with the calcite. This interaction is stronger for the Na+ than the Cl− ions, since the mass density peak closest to the calcite {104} surface (at about 2.6 Å) can be assigned to Na+, which leads to formation of an electric double layer with Na+ ions in the Stern layer and Cl− ions in the diffuse layer.20 The mass density profiles of the other salt ions in Fig. 4 do not exhibit special features. The different ability of the divalent and monovalent ions to penetrate the hydration layers is explained by the fact that the Mg2+ and Ca2+ ions form stable hydrates (Mg2+·6H2O, Ca2+·7H2O; Fig. S12, ESI†), while the Na+ and Cl− ions show fluctuating hydration numbers.
Table 2 Considered brine compositions (number of molecules/ions in the simulation box)
|
|
NaCl/water |
MgCl2/water |
CaCl2/water |
Na2SO4/water |
Diluted sea water |
Sea water |
| Na+ |
58 |
|
|
38 |
40 |
405 |
| Mg2+ |
|
19 |
|
|
4 |
44 |
| Ca2+ |
|
|
19 |
|
1 |
8 |
| Cl− |
58 |
38 |
38 |
|
46 |
462 |
| SO42− |
|
|
|
19 |
2 |
23 |
| HCO3− |
|
|
|
|
|
1 |
| Water |
27![[thin space (1/6-em)]](https://www.rsc.org/images/entities/char_2009.gif) 695 695 |
27754 |
27754 |
27716 |
27717 |
26799 |
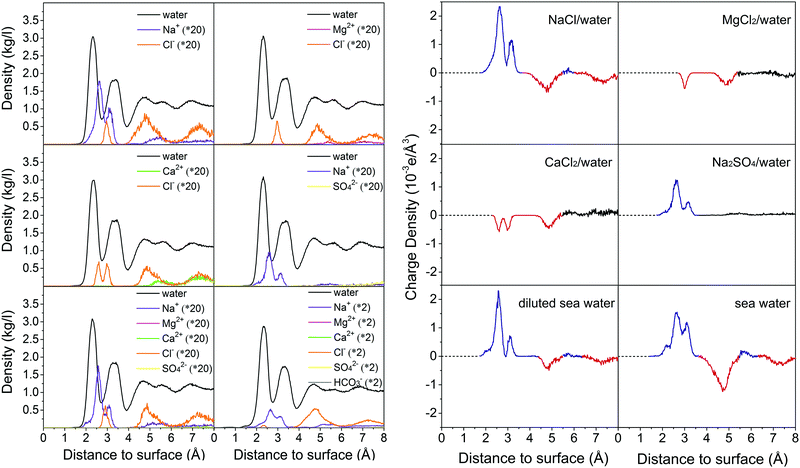 |
| | Fig. 4 Mass densities (left) and charge densities (right) of the water molecules and salt ions as functions of the (perpendicular) distance to the calcite {104} surface. Averages are taken over slabs of 0.002 Å thickness parallel to the calcite–brine interface. The distance is measured from the outmost Ca2+ ion. In the charge density plots blue and red color is used to highlight positive and negative peaks, respectively. | |
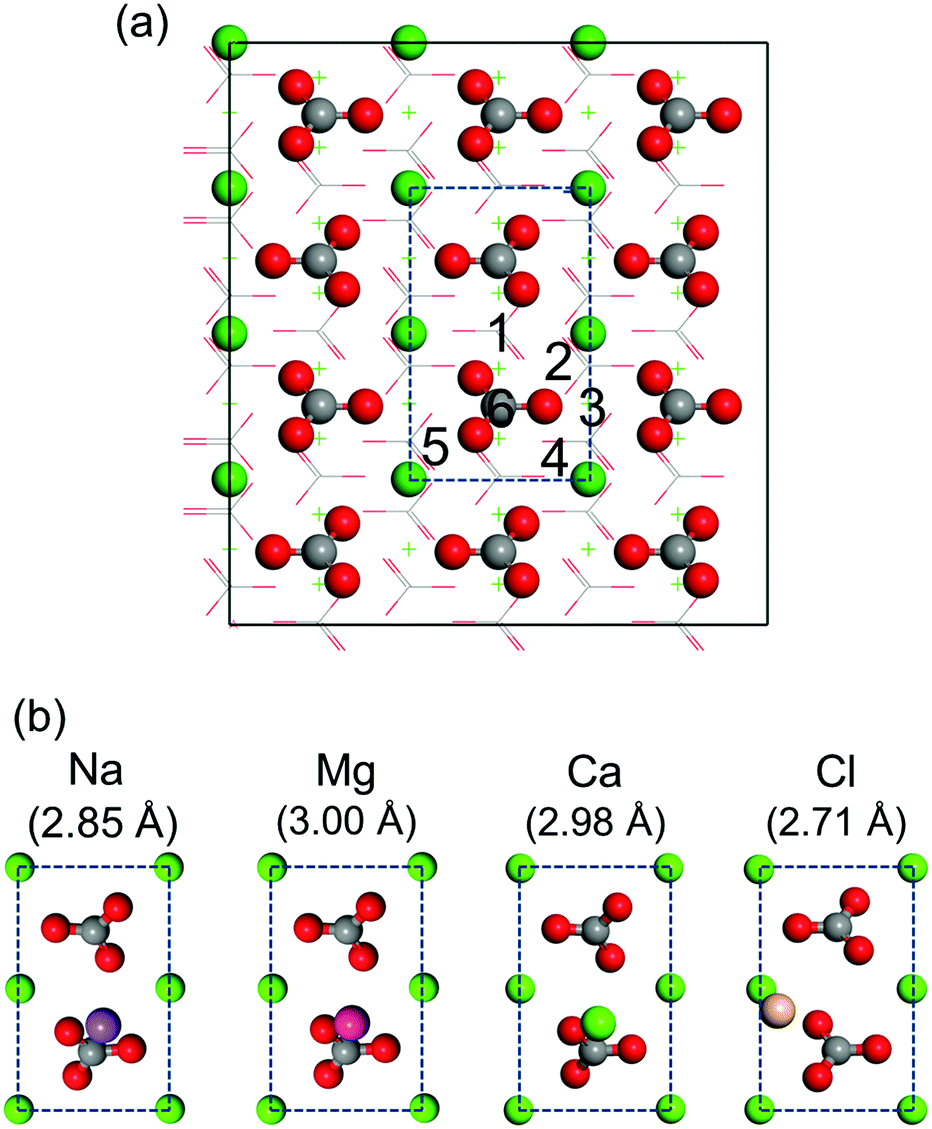
First-principles simulations of isolated salt ions on the calcite {104} surface are performed for the initial sites indicated in Fig. 5a. All initial sites result in the same binding geometry, which is shown in Fig. 5b for each case. Na+, Mg2+, and Ca2+ favor location on top of the CO32− group, while Cl− favors location on top of the Ca2+ ion. The corresponding adsorption energies are given in Table 1. We find weak binding for all the considered salt ions with the adsorption energy at most comparable to that of the water molecules. This fact only appears to imply that the hydration layers are stable and can hardly be perturbed by salt ions (which would contradict our MD result that Na+ and Cl− ions enter the first hydration layer).
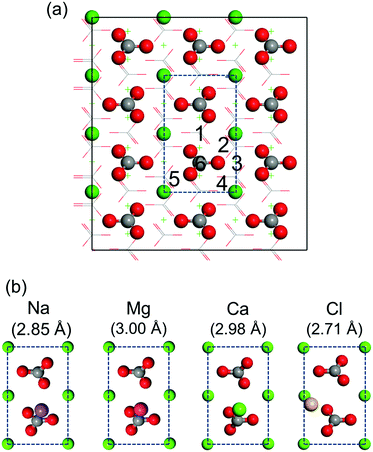 |
| | Fig. 5 (a) Top view of the calcite {104} surface. Dashed lines mark the surface unit cell. The considered initial sites are numbered. (b) Obtained binding geometries for isolated salt ions with the absorption distance from the outmost Ca2+ ion of the calcite slab in brackets. C is represented in gray, O in red, Na in purple, Mg in magenta, Cl in gold, and Ca in green. | |
 |
| | Fig. 6 Top and side views of the energetically favorable binding geometries of one Na+ ion and one (1W), two (2W), or three (3W) water molecules (numbered) on the calcite {104} surface. Dashed lines mark hydrogen bonds. H is represented in white, C in gray, O in red, Na in purple, and Ca in green. | |
3.3. Na+ hydrate formation on the calcite {104} surface
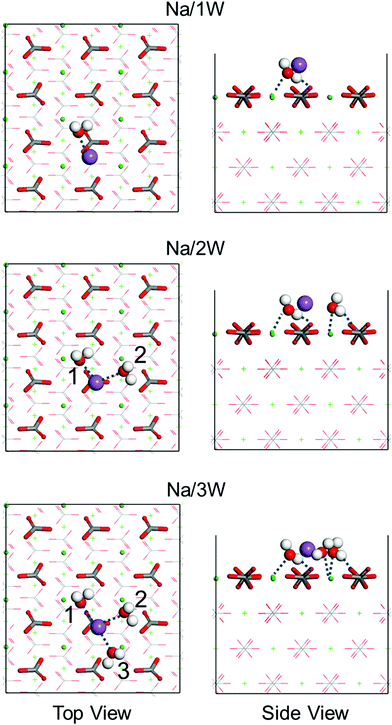
Only recently Na+ hydrate (Na+·3H2O) has been observed on NaCl using a combination of scanning tunneling microscopy and non-contact atomic force microscopy.43 This raises the question whether Na+ hydrate can also be formed on the calcite {104} surface when brine is injected into a reservoir for oil recovery, and whether it affects the wettability. To answer this question, we next study the interaction between Na+ hydrates and the calcite {104} surface by means of first-principles simulations. To this aim, we place a Na+ ion on our calcite slab and progressively add up to three water molecules. Fig. 6 shows the obtained energetically favorable binding geometries. It turns out that the Na+ ion favors location on top of a CO32− group. The oxygen atoms of the surrounding water molecules are oriented toward the Na+ ion as well as the nearest Ca2+ ion. The Na⋯Owater distance is about 2.6 Å and OHwater⋯Ocalcite hydrogen bonds are formed. The obtained adsorption energies of the water molecules (Table 1) are significantly enhanced by the presence of the Na+ ion and Bader charge analysis (Table 3) shows that the charge transfers from the Na/2W and Na/3W clusters to the calcite slab are much larger than the corresponding values of their fragments.
Table 3 Charge transfer (in electrons) between the adsorbate and calcite slab calculated by Bader charge analysis as difference between the charge of the isolated adsorbate and that of the adsorbate on calcite. Positive (negative) values mean that electrons are transferred from the adsorbate (calcite slab) to the calcite slab (adsorbate). The effect of the charge transfer on the density of states is addressed in Fig. S13 (ESI)
| 1W |
2W |
3W |
|
| −0.06 |
−0.07 |
−0.10 |
|
|
|
| Na |
Mg |
Ca |
Cl |
| 0.31 |
0.24 |
0.26 |
−0.65 |
|
|
| Na/1W |
Na/2W |
Na/3W |
|
| 0.18 |
0.77 |
1.00 |
|
First-principles simulations (favorable binding geometries shown in Fig. S4, ESI†) demonstrate that only mono-hydrated and bi-hydrated Cl− is stable on the calcite {104} surface but not tri-hydrated Cl−. Table 1 shows that in the case of Cl− the adsorption energies of the water molecules are less enhanced than in the case of Na+. This can explain why Cl− ions interact less with the calcite {104} surface than Na+ ions. Moreover, MD simulations of Na+ ions and water molecules on the calcite {104} surface, see the results in Fig. 7, demonstrate formation of Na+ hydrate (Na+·2H2O, Na+·3H2O), which enhances the wettability.
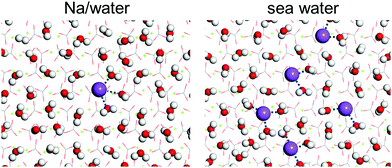 |
| | Fig. 7 Arrangement of the Na+ ions and water molecules on the calcite {104} surface (average structure from the last 5 ps of the MD simulation). H is represented in white, C in gray, O in red, Na in purple, and Ca in green. | |
4. Conclusions
While the water–calcite interface is of enormous technological relevance, the mechanism of wettability alteration by brine is under discussion. To achieve comprehensive understanding, we have investigated the interaction of the calcite {104} surface with water molecules and both monovalent and divalent ions (brine) at the atomic level, using MD and first-principles simulations. At the water–calcite interface strong hydrogen bonding (OHwater⋯Ocalcite) and electrostatic interactions (Owater⋯Cacalcite) result in formation of highly ordered water layers. Both monovalent and divalent ions are found to bind less to the calcite surface than to these water molecules. Divalent Mg2+ and Ca2+ hydrates are more stable than monovalent Na+ and Cl− hydrates. As a result, only the monovalent ions may penetrate through the ordered water layers and interact with the calcite {104} surface. In contact with the calcite {104} surface the Na+ ions interact more with the water molecules than the Cl− ions, giving rise to a distinct Na+ density peak in the first ordered water layer. The fact that the water–calcite interaction is increased by the presence of Na+ explains why the wettability of the calcite {104} surface is enhanced by brine. We find that charge transfer effects are always limited to the first calcite layer at the interface, while the electronic structure in deeper calcite layers is not affected by the interaction with water molecules and salt ions. Our results provide a better understanding of the role of brine in enhanced oil recovery.
Conflicts of interest
There are no conflicts to declare.
Acknowledgements
The research reported in this publication was supported by funding from King Abdullah University of Science and Technology (KAUST). For computer time, this research used the resources of the Supercomputing Laboratory at KAUST.
References
- C. R. Usher and A. E. Michel, Reactions on mineral dust, Chem. Rev., 2003, 103, 4883–4940 CrossRef CAS PubMed.
- S. L. S. Stipp, Toward a conceptual model of the calcite surface: hydration, hydrolysis, and surface potential, Geochim. Cosmochim. Acta, 1999, 63, 3121–3131 CrossRef CAS.
- P. Fenter, P. Geissbühler, E. DiMasi, G. Srajer, L. B. Sorensen and N. C. Sturchio, Surface speciation of calcite observed in situ by high-resolution X-ray reflectivity, Geochim. Cosmochim. Acta, 2000, 64, 1221–1228 CrossRef CAS.
- P. Geissbühler, P. Fenter, E. DiMasi, G. Srajer, L. B. Sorensen and N. C. Sturchio, Three-dimensional structure of the calcite-water interface by surface X-ray scattering, Surf. Sci., 2004, 573, 191–203 CrossRef.
- S. Kerisit and S. C. Parker, Free energy of adsorption of water and calcium on the {104} calcite surface, Chem. Commun., 2004, 52–53 RSC.
- S. Kerisit, D. J. Cooke, D. Spagnoli and S. C. Parker, Molecular dynamics simulations of the interactions between water and inorganic solids, J. Mater. Chem., 2005, 15, 1454–1642 RSC.
- P. Raiteri, J. D. Gale, D. Quigley and P. M. Rodger, Derivation of an accurate force-field for simulating the growth of calcium carbonate from aqueous solution: A new model for the calcite-water interface, J. Phys. Chem. C, 2010, 114, 5997–6010 CrossRef CAS.
- K. K. Sand, M. Yang, E. Makovicky, D. J. Cooke, T. Hassenkam, K. Bechgaard and S. L. S. Stipp, Binding of ethanol on calcite: The role of the OH bond and its relevance to biomineralization, Langmuir, 2010, 26, 15239–15247 CrossRef CAS PubMed.
- B. Zhu, X. Xu and R. Tang, Hydration layer structures on calcite facets and their roles in selective adsorptions of biomolecules: A molecular dynamics study, J. Chem. Phys., 2013, 139, 234705 CrossRef PubMed.
- J. W. Shen, C. Li, N. F. A. Van der Vegt and C. Peter, Understanding the control of mineralization by polyelectrolyte additives: Simulation of preferential binding to calcite surfaces, J. Phys. Chem. C, 2013, 117, 6904–6913 CrossRef CAS.
- S. Kerisit, S. C. Parker and J. H. Harding, Atomistic simulation of the dissociative adsorption of water on calcite surfaces, J. Phys. Chem. B, 2003, 107, 7676–7682 CrossRef CAS.
- M. B. Alotaibi and H. A. Nasr-El-Din, Chemistry of injection water and its impact on oil recovery in carbonate and clastic formations, Proc. – SPE Int. Symp. Oilfield Chem., 2009, 1, 512–521 Search PubMed.
-
M. F. Mehraban, S. Afzali, Z. Ahmadi, R. Mokhtari, S. Ayatollahi, M. Sharifi, A. Kazemi, M. Nasiri and S. Fathollahi Smart water flooding in a carbonate asphaltenic fractured oil reservoir-comprehensive fluid-fluid-rock mechanistic study. IOR 2017 – 19th Eur. Symp. Improv. Oil Recovery, 2017.
- T. Austad, S. Strand, M. Madland, T. Puntervold and R. Korsnes, Seawater in chalk: An EOR and compaction fluid, SPE Reserv. Eval. Eng., 2008, 11, 648–654 CrossRef CAS.
- T. Austad, S. F. Shariatpanahi, S. Strand, C. J. J. Black and K. J. Webb, Conditions for a low-salinity enhanced oil recovery (EOR) effect in carbonate oil reservoirs, Energy Fuels, 2012, 26, 569–575 CrossRef CAS.
- T. Austad, Water based EOR in carbonates and sandstones: New chemical understanding of the EOR-potential using smart water, Enhanced Oil Recovery Field Case Studies, 2013, 301–332 Search PubMed.
- N. Singh, S. Sharma, H. Vovusha, H. Li and U. Schwingenschlögl, Recent insights from computational materials chemistry into interfaces relevant to enhanced oil recovery, Adv. Theory Simul., 2019, 2, 1800183 CrossRef CAS.
- S. F. Shariatpanahi, S. Strand and T. Austad, Initial wetting properties of carbonate oil reservoirs: Effect of the temperature and presence of sulfate in formation water, Energy Fuels, 2011, 25, 3021–3028 CrossRef CAS.
- H. Chen, A. Z. Panagiotopoulos and E. P. Giannelis, Atomistic molecular dynamics simulations of carbohydrate-calcite interactions in concentrated brine, Langmuir, 2015, 31, 2407–2413 CrossRef CAS PubMed.
- M. Sedghi, M. Piri and L. Goual, Atomistic molecular dynamics simulations of crude oil/brine displacement in calcite mesopores, Langmuir, 2016, 32, 3375–3384 CrossRef CAS PubMed.
- M. M. Koleini, M. F. Mehraban and S. Ayatollahi, Effects of low salinity water on calcite/brine interface: A molecular dynamics simulation study, Colloids Surf., A, 2018, 537, 61–68 CrossRef CAS.
- J. M. Didymus, P. Oliver, S. Mann, A. L. Devries, P. V. Hauschka and P. Westbroek, Influence of low-molecular-weight and macromolecular organic additives on the morphology of calcium carbonate, J. Chem. Soc., Faraday Trans., 1993, 89, 2891–2900 RSC.
- Z. Gao, C. Li, W. Sun and Y. Hu, Anisotropic surface properties of calcite: A consideration of surface broken bonds, Colloids Surf., A, 2017, 520, 53–61 CrossRef CAS.
- J. S. Lardge, D. M. Duffy, M. J. Gillan and M. Watkins, Ab initio simulations of the interaction between water and defects on the calcite (104) surface, J. Phys. Chem. C, 2010, 114, 2664–2668 CrossRef CAS.
- S. Xiao, S. A. Edwards and F. A. Gräter, New transferable forcefield for simulating the mechanics of CaCO3 crystals, J. Phys. Chem. C, 2011, 115, 20067–20075 CrossRef CAS.
- W. L. Jorgensen, D. S. Maxwell and J. Tirado-Rives, Development and testing of the OPLS all-atom force field on conformational energetics and properties of organic liquids, J. Am. Chem. Soc., 1996, 118, 11225–11236 CrossRef CAS.
- W. L. Jorgensen, J. Chandrasekhar, J. D. Madura, R. W. Impey and M. L. Klein, Comparison of simple potential functions for simulating liquid water, J. Chem. Phys., 1983, 79, 926–935 CrossRef CAS.
- S. Miyamoto and P. A. Kollman, Settle: An analytical version of the SHAKE and RATTLE algorithm for rigid water models, J. Comput. Chem., 1992, 13, 952–962 CrossRef CAS.
- B. Hess, H. Bekker, H. J. C. Berendsen and J. G. E. M. Fraaije, LINCS: A linear constraint solver for molecular simulations, J. Comput. Chem., 1997, 18, 1463–1472 CrossRef CAS.
- H. J. C. Berendsen, D. Van der Spoel and R. Vandrunen, GROMACS – A message-passing parallel molecular dynamics implementation, Comput. Phys. Commun., 1995, 91, 43–56 CrossRef CAS.
- D. Van der Spoel, E. Lindahl, B. Hess, G. Groenhof, A. E. Mark and H. J. C. Berendsen, GROMACS: Fast, flexible, and free, J. Comput. Chem., 2005, 26, 1701–1718 CrossRef CAS PubMed.
- B. Hess, C. Kutzner, D. Van der Spoel and E. Lindahl, GROMACS 4: Algorithms for highly efficient, load-balanced, and scalable molecular simulation, J. Chem. Theory Comput., 2008, 4, 435–447 CrossRef CAS PubMed.
- S. A. Nosé, Unified formulation of the constant temperature molecular dynamics methods, J. Chem. Phys., 1984, 81, 511–519 CrossRef.
- G. Bussi, D. Donadio and M. Parrinello, Canonical sampling through velocity rescaling, J. Chem. Phys., 2007, 126, 014101 CrossRef PubMed.
- H. J. C. Berendsen, J. P. M. Postma and W. F. Van Gunsteren, Molecular dynamics with coupling to an external bath, J. Chem. Phys., 1984, 81, 3684–3690 CrossRef CAS.
-
J. B. Maxwell, Data book on hydrocarbons: Application to process engineering, Van Nostrand, New York, 1950 Search PubMed.
- G. Kresse and D. Joubert, From ultrasoft pseudopotentials to the projector augmented-wave method, Phys. Rev. B: Condens. Matter Mater. Phys., 1999, 59, 1758–1775 CrossRef CAS.
- P. E. Blöchl, Projector augmented-wave method, Phys. Rev. B: Condens. Matter Mater. Phys., 1994, 50, 17953–17979 CrossRef PubMed.
- S. Grimme, J. Antony, S. Ehrlich and H. Krieg, A consistent and accurate ab initio parametrization of density functional dispersion correction (DFT-D) for the 94 elements H-Pu, J. Chem. Phys., 2010, 132, 154104 CrossRef PubMed.
- W. Tang, E. Sanville and G. Henkelman, A grid-based Bader analysis algorithm without lattice bias, J. Phys.: Condens. Matter, 2009, 21, 084204 CrossRef CAS PubMed.
- P. Raiteri, J. D. Gale, D. Quigley and P. M. Rodger, Derivation of an accurate force-field for simulating the growth of calcium carbonate from aqueous solution: A new model for the calcite-water interface, J. Phys. Chem. C, 2010, 114, 5997 CrossRef CAS.
- R. Polly, F. Heberling, B. Schimmelpfennig and H. Geckeis, Quantum chemical investigation of the selenite incorporation into the calcite {104} surface, J. Phys. Chem. C, 2017, 121, 20217–20228 CrossRef CAS.
- J. Peng, D. Cao, Z. He, J. Guo, P. Hapala, R. Ma, B. Cheng, J. Chen, W. J. Xie, X. Z. Li, P. Jelínek, L. M. Xu, Y. Q. Gao, E. G. Wang and Y. Jiang, The effect of hydration number on the interfacial transport of sodium ions, Nature, 2018, 557, 701–705 CrossRef CAS PubMed.
Footnote |
| † Electronic supplementary information (ESI) available: The convergence behavior of the MD simulation of deionized water on the calcite {104} surface is shown in Fig. S1. The arrangement of water molecules on the calcite {104} surface is shown in Fig. S2. A side view of the calcite slab used in the first-principles simulations is shown in Fig. S3. First-principles optimized structures of hydrated Cl− on the calcite {104} surface are shown in Fig. S4. Top views of the less favorable binding geometries for one, two, and three water molecules on the calcite {104} surface are shown in Fig. S5. The convergence behavior of the MD simulations of NaCl/water, MgCl2/water, CaCl2/water, Na2SO4/water, smart water, and sea water on the calcite {104} surface is shown in Fig. S6–S11. Representative structures of hydrated divalent salt ions are shown in Fig. S12. The effect of the charge transfer reported in Table 3 on the density of states is shown in Fig. S13. See DOI: 10.1039/d0cp01715a |
|
| This journal is © the Owner Societies 2020 |
Click here to see how this site uses Cookies. View our privacy policy here. 
 Open Access Article
 This Open Access Article is licensed under a Creative Commons Attribution-Non Commercial 3.0 Unported Licence
 *b
*b