 Open Access Article
The interaction of two-dimensional α- and β-phosphorus carbide with environmental molecules: a DFT study†
Andrey A.
Kistanov
 *a,
Elena A.
Korznikova
b,
Marko
Huttula
a and
Wei
Cao
 a
a
aNano and Molecular Systems Research Unit, University of Oulu, 90014 Oulu, Finland. E-mail: andrey.kistanov@oulu.fi
bInstitute for Metals Superplasticity Problems, Russian Academy of Sciences, Ufa 450001, Russia
First published on 7th May 2020
Abstract
The recently fabricated two-dimensional phosphorus carbide (PC) has been proposed for application in different nanodevices such as nanoantennas and field-effect transistors. However, the effect of ambient molecules on the properties of PC and, hence, the productivity of PC-based devices is still unknown. Herein a first-principles investigation is performed to study the most structurally stable α- and β-PC allotropes upon their interaction with environmental molecules, including NH3, NO, NO2, H2O, and O2. It is predicted that NH3, H2O, and O2 are physisorbed on α- and β-PC while NO and NO2 may easily form a covalent bond with the PC. Importantly, NO and NO2 possess low adsorption energies on PC which compared to these on graphene and phosphorene. Moreover, both molecules are strong acceptors to PC with a giant charge transfer of ∼1 e per molecule. For all the considered molecules PC is found to be more sensitive compared to graphene and phosphorene. The present work provides useful insight into the effects of environmental molecules on the structure and electronic properties of α- and β-PC, which may be important for their manufacturing, storage, and application in gas sensors and electronic devices.
Introduction
Despite great breakthroughs in the synthesis and characterization of 2D materials,1–5 commercial applications of these materials on the global stage remain challenging. Due to their high surface-to-volume ratio, ultrathin thickness, and weak electronic screening, most 2D materials possess high chemical activity, which adversely affects their structural stability and properties under the exposure of environmental conditions.6–18 The number of experimentally and theoretically discovered 2D materials is constantly growing. For example, in the last few years, a family of group V 2D materials called pnictogens which are phosphorene, antimonene, arsenene, and bismuthene has been discovered. Due to their buckled structure, 2D pnictogens actively interact with external adsorbates, which, however, can also affect their structure integrity and electronic and optical properties.19–22 On the other hand, it is also known that a promoted interaction of 2D materials with environmental atoms and molecules allow their use in manufacturing of sensitive, highly selective, and environmentally stable gas detecting and storage devices.23–26Recently, there has been a great demand for the investigation of 2D hybrid structures that successfully combine the best properties of their individual components.27–29 A notable example of a hybrid structure is a monolayer boron carbide (BC)30–32 – a mixture of carbon and boron atoms. This material has been found to be an efficient collector of toxic gases.33 Other new exotic 2D hybrids are nitrophosphorene34 and GeP3 monolayers.35,36 Several modifications of nitrophosphorene have been found to be semiconductors with a wide and either direct or indirect band gap.29 In turn, GeP3 monolayer has a small indirect band gap of 0.55 eV and high electron and hole mobilities.35
Graphene17 and graphene-based hybrids such as C2N and C3N4 show high catalytic activity towards the CO and O2 molecules and possess high potential as CO oxidation catalyst with relatively low energy barriers.37 Despite the unique structure and properties of the above mentioned 2D hybrids, the most attention is currently being paid to 2D phosphorus carbide (PC), a compound analogue of graphene and phosphorene.28,38,39
The PC has several allotropes which can be metallic, semi-metallic with an anisotropic Dirac cone, or direct band gap semiconductor.38 Among these allotropes α- and β-PC show the highest structural stability. It has already been shown that PC is a very promising candidate for application in optoelectronics.39 Another study has reported on the high-performance PC-based field-effect transistor with extremely high hole mobility.28 Due to the efficient excitation of hybrid plasmon mode at deep subwavelength-scale in the nanostructured PC layer, it has been proposed for applications in biosensors, single-photon source, nanoantenna, and subwavelength resolution imaging.27
Based on previous works where graphene reported as a structurally stable to the negative environmental effects40 and considering the extremely high sensitivity of phosphorene to external molecules21,41,42 it is necessary to obtain systematic knowledge on the interaction of environmental molecules and gases with 2D PC.
In this work, first-principles calculations were performed to study the interaction of semiconductor α- and β-PC allotropes with environmental molecules such as NH3, NO, NO2, H2O, and O2. Particularly, the geometry and energetics, charge transfer ability, band structure, and workfunction of the considered PC allotropes with these molecules were investigated. Superior chemical activities of α- and β-PC allotropes over graphene and phosphorene demonstrate a promising application of the PC in ambient gas detections.
Computational details
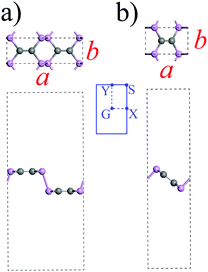
The first-principles calculations based on the spin-polarized density functional theory were implemented via the Vienna ab initio simulation package (VASP).43 For the analysis of non-covalent chemical functionalization of phosphorus carbide (PC) by small molecules, a well-proven generalized gradient approximation (GGA) with the Perdew–Burke–Ernzerhof functional (PBE)44 supplemented by the van der Waals-corrected functional with Becke88 optimization was used. The geometry of the molecules was completely optimized until the total energy and atomic forces become less than 10−8 eV and 10−3 eV Å−1. A plane wave cut-off of 400 eV and a 6 × 6 × 1 k-mesh grid was adopted. To avoid the interaction with spurious replica images, the thickness of the vacuum region was greater than 15 Å. The studied structures which are α- and β-PC named according to the classification introduced in the pioneer work predicted these materials.38 The optimized unicells of the considered α- and β-PC are shown in Fig. 1. The calculated lattice constants of α- and β-PC considered in this work were a = 8.563 Å and b = 2.870 Å and a = 4.759 and b = 2.950, respectively. Our calculated results are in good agreement with the previously reported ones.38,45 Despite the band gap size is usually underestimated in PBE GGA calculations, it has been found that the PBE GGA method predicts qualitatively similar band structures of α- and β-PC to calculated ones using more accurate hybrid functional.38 To compromise computational efficiency and accuracy, results here were obtained using the PBE GGA approach.The adsorption energy Ea of a molecule on PC were calculated as
| Ea = EPC+mol − EPC − Emol | (1) |
The Bader analysis46 was used to estimate the charge transfer between the PC surface and small molecules. The workfunction WF which is the minimum energy required to remove an electron from the surface of a solid was calculated as follows
| WF = V∞ − EFermi. | (2) |
Results and discussion
This study presents the analysis of the adsorption of NH3, NO, NO2, H2O, and O2 molecules on the surface of α- and β-PC. The lowest-energy configuration for each molecule was determined by examination of their possible positions on the highly symmetric sites of α- and β-PC surface, including both above the puckered hexagon and the zigzag trough with the molecules being aligned either parallel or perpendicular to the surface.The data on the adsorption energy Ea, the charge transfer Δq from the molecule to the α- and β-PC surface, and the distance d from the molecule to the α- and β-PC surface for the lowest-energy configuration for each molecule is collected in Table 1. Several other examined configurations of the considered molecules on α- and β-PC with the comparably low adsorption energy are shown in Fig. S1–S5 (see ESI†). The calculated values of the band gap size and workfunction of the pure and molecule-adsorbed α- and β-PC surfaces are collected in Table 2. It is worth noting that the workfunction of pure α- and β-PC is 4.87 and 4.95 eV, respectively, which is larger than that of graphene (4.33 eV)48 while slightly less than that of phosphorene (5.04–5.16 eV).49
| Material | NH3 | NO | NO2 | H2O | O2 | |
|---|---|---|---|---|---|---|
| α-PC | E a, eV | −0.29 | −0.36 | −0.73 | −0.24 | −0.59 |
| d, Å | 2.91 | 2.14 | 1.67 | 1.77 | 2.87 | |
| Δq, e (role) | −0.029 (donor) | 0.220 (acceptor) | 1.023 (strong acceptor) | 0.038 (acceptor) | 0.075 (acceptor) | |
| β-PC | E a, eV | −0.30 | −0.06 | −0.59 | −0.31 | −0.18 |
| Δd, Å | 2.29 | 2.72 | 1.38 | 2.92 | 2.21 | |
| Δq, e (role) | −0.013 (donor) | −0.058 (donor) | 1.013 (strong acceptor) | 0.026 (acceptor) | 0.067 (acceptor) | |
| Graphene50,51 | E a, eV | −0.03 | −0.29 | −0.67 | −0.27 | −0.04 |
| Phosphorene20,22,49 | E a, eV | −0.18 | −0.32 | −0.5 | −0.14 | −0.27 |
| Material | α-PC | β-PC | ||
|---|---|---|---|---|
| E g, eV | WF, eV | E g, eV | WF, eV | |
| Pure | 0.59 | 4.87 | 0.62 | 4.95 |
| NH3 | 0.62 | 4.74 | 0.62 | 4.85 |
| NO | 0.53 | 4.63 | 0.62 | 4.84 |
| NO2 | 0.66 | 5.07 | 0.66 | 4.61 |
| H2O | 0.62 | 4.87 | 0.62 | 5.13 |
| O2 | 0.62 | 4.96 | 0.61 | 4.98 |
NH3 adsorption
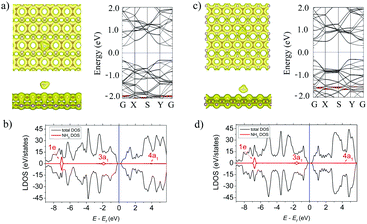
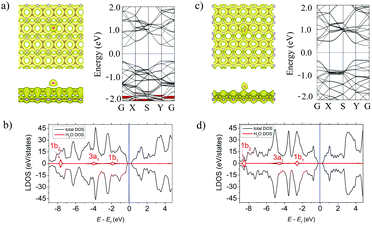
Fig. 2a and c (left panels) show the lowest-energy atomic geometries of the NH3 molecule on the α- and β-PC surface, respectively. For the α-PC one, the NH3 molecule is located at d = 2.91 Å with the N atom above the center of the hollow hexagon and the three H atoms directed away from the surface. The adsorption energy Ea is −0.29 eV and the lengths of all the three N–H bonds are equal to 1.02 Å, comparable to the value (1.01 Å) of a free NH3 gas molecule. In case of β-PC, the NH3 molecule is located at d = 2.29 Å with the N atom above the C–C bond, one H atom directed out from the surface, and the other two H atoms are almost parallel to the surface. The Ea is −0.30 eV and the lengths of the N–H bonds are also 1.02 Å. It should be noted, that Ea of the NH3 molecule on both α- and β-PC is ∼10 times more negative than that of graphene (Ea = −0.03 eV)50 and about 2 times than that of phosphorene (Ea = −0.18 eV).22,51Fig. 2a and c (left panels) show the total electron density for the NH3 molecule on the α- and β-PC surface, respectively. In both cases, the zero-electron density at the interface region between the molecule and the surface suggests the NH3 molecule does not form a covalent bond with PC upon adsorption. The Bader analysis predicted that the NH3 molecule is a donor for α- and β-PC, similarly to graphene50 and phosphorene.21,51 A small charge transfer of 0.029 and 0.013 e per molecule was revealed from the NH3 molecule to the α- and β-PC surfaces, respectively.
Fig. 2b and d show the local density of states (LDOS) plots for the NH3 molecule adsorbed on α- and β-PC. In both cases, the 1e state is significantly below the Fermi level while the non-bonding 3a1 state appears in the vicinity of the valence band maximum (VBM), which is also seen in the band structure plots (Fig. 2a and c, right panel). However, the band structure analysis revealed no significant changes in the band's alignment after the NH3 adsorption on α- and β-PC. Therefore, the fundamental band gap only slightly increases from 0.59 to 0.62 eV for α-PC and remains unchanged for β-PC (Table 2). In addition, adsorption of the NH3 molecule leads to a slight decrease of the workfunction of α-PC (from 4.87 to 4.74 eV) and β-PC (from 4.95 to 4.85 eV).
NO adsorption
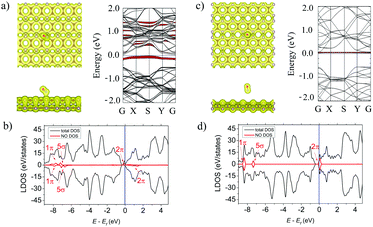
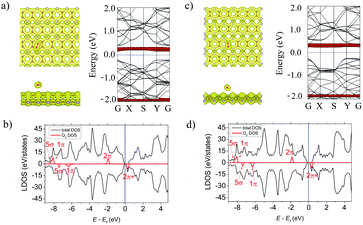
As shown in Fig. 3a (left panel) the NO molecule is tilted to the α-PC surface and is located above the C–P bond at d = 2.14 Å. The N–O bond length of the adsorbed molecule is 1.18 Å which is comparable to that of a free NO molecule (1.16 Å). The Ea of the NO molecule on α-PC is −0.36 eV which is about 12 times more than that of graphene (Ea = −0.03 eV)50 and almost similar to the one of phosphorene (Ea = −0.32 eV).22,42 For the β-PC surface, the NO molecule is located at d = 2.72 Å above the center of the hollow hexagon and the N–O bond is almost perpendicular the surface. The bond length of the adsorbed NO molecule is 1.16 Å, which slightly larger compared to that of a free NO gas molecule (1.01 Å). The Ea = −0.06 eV in this case is about 5 times less than that of graphene (Ea = −0.29 eV)50 and that of phosphorene (Ea = −0.32 eV).22,42The total electron density plot for the α-PC surface adsorbed with the NO molecule (Fig. 3a, left panel) suggests a strong interaction of the molecule and the surface. The formation of a covalent bond between the molecule and the nearest P atom is found. A zero-electron density at the interface region between the NO molecule and the β-PC surface in Fig. 3c, left panel implies non-covalent interaction between the molecule and the surface. Based on the Bader analysis, the NO molecule acts as an acceptor to α-PC and as a donor to β-PC. Particularly, a large amount (0.200 e) of charge transferred from the α-PC surface to the NO molecule and tiny charge transfer (0.058 e) from the NO molecule to the β-PC surface were found. Interestingly, that NO has been predicted to be an acceptor on phosphorene22 similarly to the case of α-PC, while on graphene50 NO is a donor similarly to the case of β-PC.
The LDOS analysis for the NO-adsorbed α-PC surface, presented in Fig. 3b, depicted the half-filled doubly degenerated 2π frontier and 5σ and 1π spin-split orbitals of NO. Such an orbital hybridization of NO with phosphorus orbitals allows strong charge transfer between the molecule and the surface as confirmed by the Bader analysis. According to the band structure (Fig. 3a, right panel), the singly occupied HOMO state of NO is below the Fermi level and the conduction band minimum (CBM) shifts closer to the Fermi level signifying enhanced interaction on the molecule and the surface. The workfunction of the α-PC surface adsorbed with the NO molecule decreases from 4.87 to 4.63 eV. The LDOS (Fig. 3c) and the band structure (Fig. 3c, right panel) plots of the NO-adsorbed β-PC show additional molecule-induced states in the vicinity of CBM. The fundamental band gap of β-PC remains unchanged (Table 2) and the workfunction decreases from 4.95 to 4.84 eV.
NO2 adsorption
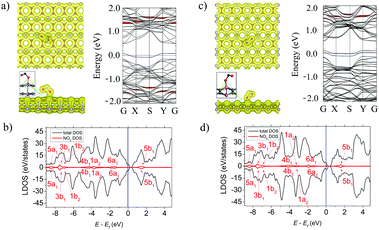
Among all the considered molecules NO2 has the strongest adsorption ability to α- and β-PC. The molecule occupies the position at d = 1.67 (α-PC) and d = 1.38 (β-PC) Å above the C–P bond with two O atoms directed to the surface plane. In both cases (Fig. 4a and c, left panel), the N–O bond located closer to the surface is significantly elongated (up to 1.40 Å) compared to that of a free NO2 gas molecule (1.20 Å). The adsorption energy of NO2 on α-PC (Ea = −0.73 eV) is lower than that of graphene (Ea = −0.67 eV)50 and that of phosphorene (Ea = −0.50 eV),22,42 while for β-PC the Ea = −0.59 is almost equal to that of phosphorene.The strong molecule–surface interaction was also confirmed by the total electron density plot for the NO2-adsorbed α- and β-PC surfaces (Fig. 4a and c, left panel). The NO2 molecule tends to form a covalent bond with the nearest P atom on both the α- and β-PC surfaces. Moreover, as it is shown in the insets of Fig. 4a and c (see the green circle in left panel), the P atom bonded to the molecule is lifted from the surface due to the interaction with the molecule, which suggests significant distortion of the surface in the contact area. The NO2 molecule was found to be a strong acceptor to both α- and β-PC. The Bader analysis revealed a giant charge transfer of 1.023 and 1.013 e from the molecule to the α- and β-PC surfaces, respectively.
The LDOS graphs of NO2-adsorbed α- and β-PC surfaces are presented in Fig. 4b and d, respectively. Both results indicate that the 6a1 orbital is split into two levels, while all other orbitals are significantly broadened and coincide with the states of the host material. Such mixing and hybridization of NO2 orbitals explain the facilitated charge transfer between the molecule and the α- and β-PC surfaces. The band structure analysis (Fig. 4a and c, right panel) uncovered the effect of atomic disorders induced by NO2 adsorption on the bands’ alignment of the host material. More specifically, the structural transformation induces localized states originated from the lifted P atom within the fundamental band gap of the host materials. The workfunction of NO2-adsorbed α-PC increases from 4.95 to 5.07 eV, while in case of β-PC the workfunction decreases to 4.61 eV (Table 2), which can be explained by a large impact of the defect states in the VBM of the host material.
H2O adsorption
The H2O molecule is adsorbed at d = 1.77 Å above the α-PC surface and is located above the P–P bond with two H–O bonds directed to the surface. In case of β-PC, the molecule is located so that the H atom's position is at d = 2.92 Å above the center of the hollow hexagon, one H–O bond is tilted away from the surface and one H–O bond is almost perpendicular to the surface plane (Fig. 5a, left panel). The adsorption energy of H2O on α-PC (Ea = −0.24 eV) and β-PC (Ea = −0.31 eV) is about 2 times lower than that of phosphorene (Ea = −0.14 eV)22 and almost the same as that of graphene (Ea = −0.27 eV).50The noncovalent bond between H2O and the α- and β-PC surfaces is predicted by a zero-electron density at the interface region as shown in Fig. 5a and c, left panel. A comparably weak interaction of H2O with α- and β-PC was also confirmed by the Bader analysis which differentiate the low charge transfer of 0.038 (α-PC) and 0.026 e (β-PC) from the surface to the molecule.
Based on the LDOS plots in Fig. 5b and d, the 3a1 highest occupied molecular orbital of H2O is greatly broadened and has the largest orbital mixing with the states of the host material, which responsible for the charge transfer between the molecule and the α- and β-PC surfaces. According to Fig. 5a and c, right panel, similarly to graphene50 and phosphorene,22 α- and β-PC has no localized states originating from H2O within the fundamental band gap. In addition, the workfunction of H2O-adsorbed α-PC (4.87 eV) is equal to that of pure PC (4.87 eV), while the workfunction of β-PC increases from 4.95 to 5.13 eV upon the H2O adsorption.
O2 adsorption
The O–O bond of the oxygen molecule is forming an angle of around 30° with the surface and is located at d = 2.87 Å above the center of the hollow hexagon for the α-PC. The O–O bond increases from 1.22 Å (for a free O2 molecule) to 1.24 Å. The Ea of the O2 molecule on α-PC is −0.59 eV which is about 12 times lower than that of graphene (Ea = −0.04 eV)52 and about 2 times lower than that of phosphorene (Ea = −0.27 eV).21 On the β-PC surface, the O2 molecule adopts tilted position with the O–O bond located at d = 2.21 Å above the P–P bond. The Ea = −0.18 eV of the O2 molecule on β-PC is about 4 times lower than that of graphene (Ea = −0.04 eV)52 but larger than that of phosphorene (Ea = −0.27 eV).22The isosurface plots in Fig. 6a and c, left panel show noncovalent bonding between O2 and both α- and β-PC. The Bader analysis showed an acceptor role of the O2 molecule for both α- and β-PC with the amount of charge transferred of 0.075 and 0.067 e, respectively. The LDOS (Fig. 6b and d) and band structure (Fig. 6a and c) reflect the half-filled 2π state of O2 within the band gap of both α- and β-PC.
It worth noting that predicted here non-covalent interaction of O2 with α- and β-PC suggests the molecule is physisorbed on the PC surfaces. For the phosphorene, it has been shown that O2 can be chemisorbed if the energy barrier is overcome.7 The energy barrier and the detailed pathway from the initial state (IS), to the transition state (TS) and to the final state (FS) for oxidation of α- and β-PC by O2 are shown in Fig. S6 (ESI†). The calculated energy barriers for α- and β-PC are 0.29 and 0.59 eV, respectively. Therefore, the O2 molecule may experience an energy barrier from the physisorption to chemisorption on the PC surface. Based on this, PC is considered to behave similarly to antimonene where oxygen species preferably attached above the surface.53 To investigate the joint effect of water and oxygen54 on the structural stability of α- and β-PC, the ab initio molecular dynamics simulations at room temperature (300 K) are performed. The simulated snapshots in Fig. S7 and Movies S1, S2 (ESI†) show the H2O molecule, initially placed in close contact with the O species on the pre-oxidized α- and β-PC surfaces, randomly walks above the surface. This suggests high resistance of α- and β-PC to H2O and explains their stability under the environment conditions.55,56
Potentials in gas censoring
It is found that NH3, H2O and O2 are physisorbed on α- and β-PC surfaces. Importantly, as it has been found for phosphorene,22,42 the adsorbed O2 molecule also induces partially occupied states within the band gap of α- and β-PC, which facilitates the creation of recombination centers for excitons in PC.The NO molecule forms a covalent bond with the α-PC surface, while noncovalent bonding is typical for the β-PC surface. This significantly modifies the band structure of NO-adsorbed PC. Particularly, chemisorbed NO induces unoccupied states below the Fermi level and within the band gap of α-PC, while NO physisorbed on β-PC induces partially unoccupied states above the Fermi level and within the band gap. This also explains the acceptor role of NO on α-PC and donor nature on β-PC. Non-trivial adsorption behaviour of NO on α- and β-PC can be attributed to the different mechanisms of the interaction of the molecule with surfaces of different phases. The sp3 bonding of phosphorus atom in α-PC allows a covalent interaction of NO with the surface, as confirmed by a strong mixing of NO states with the 3s states of phosphorus atom. In turn, the sp2 bonding between carbon atoms in β-PC weakens the interaction of NO with the surface.
The NO2 molecule has the strongest effect on the structure and properties of α- and β-PC. Its chemisorption on the PC surface accounts for the local distortions in the contact area between the molecule and the surface. These distortions are responsible for the formation of the defect on the PC surface. The defect induces localized states within the band gap of α- and β-PC is responsible for the giant charge transfer from the surface to NO2 and splitting and hybridization of NO2 orbitals. Noticeably, NO2 is a more oxidative species compared to the other studied molecules due to the high chemical states of the nitrogen. Similar phenomenal absorption of the NO2 molecule is predicted for C3N monolayer.57 This explains the strongest adsorption ability of NO2 compared to other considered molecules.
In addition, adsorption of NO2 and O2 on α-PC and H2O on β-PC increases their workfunction, while in other cases the workfunction of α- and β-PC slightly decreases or remains unchanged. Fig. 7 shows the comparison of the adsorption energies of the considered molecules on α- and β-PC and graphene and phosphorene. It can be concluded that the obtained results indicate the advantage of α- and β-PC over graphene and phosphorene in terms of sensitivity to NH3, NO, NO2, H2O, and O2 molecules. This is mostly due to the different bonding nature in graphene, phosphorene and PC.38,58 The case study on that is discussed in ESI† and is presented in Fig. S8 (ESI†).
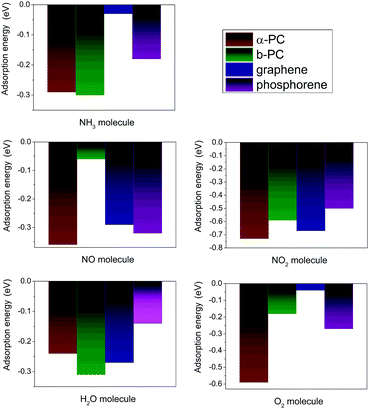 | ||
| Fig. 7 The comparison of the adsorption energy of NH3, NO, NO2, H2O, and O2 on α- and β-PC and graphene50,51 and phosphorene.20,22,49 | ||
Conclusions
Our work predicts high sensitivity of α- and β-PC to the most common environmental molecules which open up possibilities of fabrication of PC-based gas sensor devices. The remarkable transfer of electrons between PC and NO, NO2, and O2 suggests molecular adsorption as a useful tool for tuning the carrier density of PC. In addition, the Raman spectroscopy has shown that the strength of interatomic bonds can be altered in graphene and phosphorene due to the charge flow induced by environmental molecules.22,59 Our results on NO2 adsorption show that the charge transfer between environmental molecules and α- and β-PC can also alter the strength of its bonds. Moreover, the observed modification in the band structure of α- and β-PC upon physisorption of environmental molecules make the use of photoluminescence or current flow possible as a detection tool. It is important to note, that the surface coverage of PC by environmental molecules may cause a decrease of its workfunction, which in turn could affect the charge injection from the electrode to the channel layer and, consequently, the performance of PC-based devices.Conflicts of interest
There are no conflicts to declare.Acknowledgements
The author acknowledges CSC – IT Center for Science, Finland, for computational resources. For A. A. Kistanov, M. Huttula, and W. Cao the financial support is provided by the Academy of Finland (grant no. 311934).References
- H. G. Kim and H. B. R. Lee, Chem. Mater., 2017, 299, 3809 CrossRef.
- R. H. J. Vervuurt, W. M. M. Kessels and A. A. Bol, Adv. Mater. Interfaces, 2017, 4, 1700232 CrossRef.
- J. Zhang, H. Shin and W. Lu, Chem. Commun., 2019, 55, 2601 RSC.
- K. Kostarelos and K. S. Novoselov, Nat. Nanotechnol., 2014, 9, 744 CrossRef CAS PubMed.
- D. S. Schulman, A. J. Arnold and S. Das, Chem. Soc. Rev., 2018, 47, 3037 RSC.
- J. O. Island, G. A. Steele, H. S. J. van der Zant and A. Castellanos-Gomez, 2D Mater., 2015, 2, 011002 CrossRef.
- A. A. Kistanov, Y. Cai, K. Zhou, S. V. Dmitriev and Y. W. Zhang, 2D Mater., 2017, 4, 015010 CrossRef.
- N. Liu and S. Zhou, Nanotechnology, 2017, 28, 175708 CrossRef PubMed.
- S. Kuriakose, T. Ahmed, S. Balendhran, V. Bansal, S. Sriram, M. Bhaskaran and S. Walia, 2D Mater., 2018, 5, 032001 CrossRef.
- S. A. Wells, A. Henning, J. T. Gish, V. K. Sangwan, L. J. Lauhon and M. C. Hersam, Nano Lett., 2018, 18, 7876–7882 CrossRef CAS PubMed.
- X. Wei, C. Dong, A. Xu, X. Li and D. D. Macdonald, Phys. Chem. Chem. Phys., 2018, 20, 2238–2250 RSC.
- A. A. Kistanov, Y. Cai, K. Zhou, S. V. Dmitriev and Y. W. Zhang, J. Mater. Chem. C, 2018, 6, 518–525 RSC.
- J. Kang, S. A. Wells, V. K. Sangwan, D. Lam, X. Liu, J. Luxa, Z. Sofer and M. C. Hersam, Adv. Mater., 2018, 30, 1802990 CrossRef PubMed.
- S. Zhang, S. Guo, Z. Chen, Y. Wang, H. Gao, J. Gomez-Herrero, P. Ares, F. Zamora, Z. Zhu and H. Zeng, Chem. Soc. Rev., 2018, 47, 982–1021 RSC.
- W. Cao, V. Pankratov, M. Huttula, X. Shi, S. Saukko, Z. Huang and M. Zhang, Mater. Chem. Phys., 2015, 158, 89 CrossRef CAS.
- K. P. Katin, V. S. Prudkovskiy and M. M. Maslov, Phys. Lett. A, 2017, 381, 2686–2690 CrossRef CAS.
- V. S. Prudkovskiy, K. P. Katin, M. M. Maslov, P. Puech, R. Yakimova and G. Deligeorgis, Carbon, 2016, 109, 221–226 CrossRef CAS.
- K. S. Grishakov, K. P. Katin, V. S. Prudkovskiy and M. M. Maslov, Appl. Surf. Sci., 2019, 463, 1051–1057 CrossRef CAS.
- A. A. Kistanov, S. Kh. Khadiullin, K. Zhou, S. V. Dmitriev and E. A. Korznikova, J. Mater. Chem. C, 2019, 7, 9195–9202 RSC.
- A. A. Kistanov, Y. Cai, Y. W. Zhang, S. V. Dmitriev and K. Zhou, J. Phys.: Condens. Matter, 2017, 29, 095302 CrossRef PubMed.
- S. Nahas, B. Ghosh, S. Bhowmick and A. Agarwal, Phys. Rev. B, 2016, 93, 165413 CrossRef.
- Y. Cai, Q. Ke, G. Zhang and Y. W. Zhang, J. Phys. Chem. C, 2015, 119, 3102–3110 CrossRef CAS.
- L. Takahashi and K. Takahashi, Phys. Chem. Chem. Phys., 2015, 17, 21394–21396 RSC.
- A. Abbasi and J. J. Sardroodi, Phys. E, 2019, 108, 382–390 CrossRef CAS.
- P. Garg, I. Choudhuri and B. Pathak, Phys. Chem. Chem. Phys., 2017, 19, 31325–31334 RSC.
- A. A. Kistanov, Y. Cai, D. R. Kripalani, K. Zhou, S. V. Dmitriev and Y. W. Zhang, J. Mater. Chem. C, 2018, 6, 4308–4317 RSC.
- X. Huang, et al. , ACS Photonics, 2018, 5, 3116–3123 CrossRef.
- W. C. Tan, et al. , Adv. Mater., 2017, 29, 1700503 CrossRef PubMed.
- L. Zhao, W. Yi, J. Botana, F. Gu and M. Miao, J. Phys. Chem. C, 2017, 21, 28520–28526 CrossRef.
- H. Yanagisawa, T. Tanaka, Y. Ishida, M. Matsue, E. Rokuta, S. Otani and C. Oshima, Phys. Rev. Lett., 2004, 93, 177003 CrossRef CAS PubMed.
- D. Tománek, R. M. Wentzcovitch, S. G. Louie and M. L. Cohen, Phys. Rev. B: Condens. Matter Mater. Phys., 1988, 37, 3134 CrossRef PubMed.
- T. Xinxin, X. Xiaoyu, Y. Meng, M. Yuewen, L. Hai-Gang, Z. Zhuhua and L. Si-Dian, Nanoscale, 2019, 11, 11099–11106 RSC.
- M. S. Mahabal, M. D. Deshpande, T. Hussain and R. Ahuja, ChemPhysChem, 2015, 16, 3511–3517 CrossRef CAS PubMed.
- S. Ma, C. He, L. Sun, H. Lin, Y. Li and K. Zhang, Phys. Chem. Chem. Phys., 2015, 17, 32009–32015 RSC.
- Y. Jing, Y. Ma, Y. Li and T. Heine, Nano Lett., 2017, 17, 1833–1838 CrossRef CAS PubMed.
- C. Zhang, Y. Jiao, T. He, F. Ma, L. Kou, T. Liao, S. Bottle and A. Du, Phys. Chem. Chem. Phys., 2017, 19, 25886–25890 RSC.
- B. Liu and K. Zhou, Prog. Mater. Sci., 2019, 100, 99–169 CrossRef CAS.
- J. Guan, D. Liu, Z. Zhu and D. Tománek, Nano Lett., 2016, 16, 3247–3252 CrossRef CAS PubMed.
- G. Wang, R. Pandey and S. P. Karna, Nanoscale, 2016, 8, 8819–8825 RSC.
- F. Schedin, A. K. Geim, S. V. Morozov, E. W. Hill, P. Blake, M. I. Katsnelson and K. S. Novoselov, Nat. Mater., 2007, 6, 652 CrossRef CAS PubMed.
- S. Cui, H. Pu, S. A. Wells, Z. Wen, S. Mao, J. Chang, M. C. Hersam and J. Chen, Nat. Commun., 2015, 6, 8632 CrossRef CAS PubMed.
- A. A. Kistanov, Y. Cai, K. Zhou, S. V. Dmitriev and Y. W. Zhang, J. Phys. Chem. C, 2016, 120, 6876–6884 CrossRef CAS.
- G. Kresse and J. Furthmüller, Phys. Rev. B: Condens. Matter Mater. Phys., 1996, 54, 11169 CrossRef CAS PubMed.
- A. D. Becke, Phys. Rev. A: At., Mol., Opt. Phys., 1988, 38, 3098 CrossRef CAS PubMed.
- W. Zhang, J. Yin, P. Zhang, X. Tang and Y. Ding, J. Mater. Chem. A, 2018, 6, 12029–12037 RSC.
- R. F. W. Bader, Atoms in Molecules – A Quantum Theory, Oxford University Press, New York, 1990 Search PubMed.
- G. S. Rao, T. Hussain, M. S. Islam, M. Sagynbaeva, D. Gupta, P. Panigrahi and R. Ahuja, Nanotechnology, 2016, 27, 015502 CrossRef CAS PubMed.
- W. Geng, X. Zhao, H. Liu and X. Yao, J. Phys. Chem. C, 2013, 117, 10536–10544 CrossRef CAS.
- Y. Cai, G. Zhang and Y. W. Zhang, Sci. Rep., 2014, 4, 6677 CrossRef CAS PubMed.
- O. Leenaerts, B. Partoens and F. Peeters, Phys. Rev. B: Condens. Matter Mater. Phys., 2008, 77, 125416 CrossRef.
- F. Safari, M. Moradinasab, M. Fathipour and H. Kosina, Appl. Surf. Sci., 2019, 464, 153–161 CrossRef CAS.
- F. Mehmood, R. Pachter, W. Lu and J. J. Boeckl, J. Phys. Chem. C, 2013, 117, 10366–10374 CrossRef CAS.
- S. Ma, D. Yuan, Y. Wang and Zh. Jiao, J. Mater. Chem. C, 2018, 6, 8082–8091 RSC.
- C. Gibaja, D. Rodriguez-San-Miguel, P. Ares, J. Gomez-Herrero, M. Varela, R. Gillen, J. Maultzsch, F. Hauke, A. Hirsch, G. Abellan and F. Zamora, Angew. Chem., Int. Ed., 2016, 55, 14345–14349 CrossRef CAS PubMed.
- X. Huang, et al. , ACS Photonics, 2018, 5, 3116–3123 CrossRef.
- W. C. Tan, et al. , Adv. Mater., 2017, 29, 1700503 CrossRef PubMed.
- D. Ma, J. Zhang, X. Li, C. Heb, Z. Lu, Z. Lu, Z. Yang and Y. Wang, Sens. Actuators, B, 2018, 266, 664–673 CrossRef CAS.
- S. A. Shcherbinin, K. Zhou, S. V. Dmitriev, E. A. Korznikova, A. R. Davletshin and A. A. Kistanov, J. Phys. Chem. C, 2020, 124, 10235–10243 CrossRef CAS.
- D. Choudhury, B. Das, D. D. Sarma and C. N. R. Rao, Chem. Phys. Lett., 2010, 497, 66–69 CrossRef CAS.
Footnote |
| † Electronic supplementary information (ESI) available. See DOI: 10.1039/d0cp01607a |
| This journal is © the Owner Societies 2020 |

