 Open Access Article
Creative Commons Attribution 3.0 Unported Licence
Solvent similarity index†
Mark D.
Driver
 and
Christopher A.
Hunter
 *
*
Department of Chemistry, University of Cambridge, Lensfield Road, Cambridge CB2 1EW, UK. E-mail: herchelsmith.orgchem@ch.cam.ac.uk; Tel: +44 (0)1223 336710
First published on 15th May 2020
Abstract
The Solvent Similarity Index (SSI) is a quantitative parameter we introduce for the comparison of the solvation properties of any solvent or solvent mixture. The Surface Site Interaction Model for Liquids at Equilibrium (SSIMPLE) was used to calculate the free energy of solvation of a single Surface Site Interaction Point (SSIP) on a solute. The SSIP representation of molecular surfaces was used to calculate the free energy of solvation for all possible solute polarities, generating a unique solvation profile for any solvent or solvent mixture. Quantitative comparison of the solvation profiles of two solvents was used as the basis for calculating the solvation similarity index. Values of SSI were calculated for all pairwise comparisons of 261 pure solvents at 298 K, and the results were used to classify solvents into groups according to their solvation properties. Applications to understanding the solvation properties of binary solvent mixtures and for identification of alternative solvents are illustrated.
1 Introduction
Solvent selection is a key issue for a very wide range of chemical processes.1,2 The reaction medium plays a key role in synthesis of pharmaceutics and agrochemicals, and solvent properties are fundamental to formulation of surface coatings, paints, and personal care products.3–10 There are many considerations in choosing the best solvent, including cost and environmental effects, but the fundamental requirement is that the solvent makes the required interaction with solutes, leading to dissolution, precipitation, stabilisation or destabilisation. A combination of environmental and availability issues have encouraged the search for new alternative solvents.1,2,11–14 A range of scales have been devised to quantify and classify solvent properties. Many are based on experimental measurement of the strength of interactions with solutes or more indirectly the effect on the spectroscopic properties of solutes,4,15 and others are based on more qualitative descriptors such as the environmental impact of the solvent.1,2,11–14 The commonly used Hansen solubility parameter is based on miscibility, which is based on the idea that like dissolves like and so miscible solvents should also dissolve the same solutes.4Calculation of solvation free energies has been extensively explored with multiple different approaches:16–18 empirical functions, implicit solvation simulations or explicit solvation simulations. Empirical methods consist of parameterised functions that use the correlation of molecular properties to experimental measurement. These functions either use the summation of information for individual fragments in the chemical structure in group contribution type methods,19–31 or quantitative structure property relationships (QSPR) where molecular descriptors are used.32–37 For implicit solvation methods the solvent medium is treated as a dielectric continuum.38–40 Parameterised relationships are then used to convert the activity coefficients generated from such calculations to free energies.41–46 Full atomic simulations are required for explicit solvation models, using molecular dynamics (MD) or Monte Carlo (MC) frameworks to propagate a system in phase space. Calculation of free energies requires summation of the free energy components of interactions between solute and solvent.47–54
Here we describe a new solvent similarity index, which quantifies the similarity between two solvents based on calculation of solvation free energies using the Surface Site Interaction Model for Liquids at Equilibrium (SSIMPLE).55
Solvent–solute interactions play an important role in dissolution and solvation of compounds. Solvents are used in several industries, as a medium for reactions to synthesise compounds such as in the pharmaceutical and agrochemical industries, or for the application of surface coatings and paints. Finding the solvent with the correct properties to solvate the required components is therefore important. Multiple solvents may possess similar efficacy at solvation, so secondary factors such as cost and environmental effects also play a role in selection. With the increasing desire to reduce environmental impact and improve efficiency in processes, the concept of ‘green’ chemistry56 is becoming more prominent, with scales to assess the environmental impact of solvents developed.11–14 This has led to the use of alternative solvents with lower environmental impact in pharmaceutical companies.11,57
2 The SSIMPLE approach
The approach is based on description of molecules as a set of Surface Site Interaction Points (SSIPs), which can be used to describe all of the non-covalent interactions that the molecule makes with the environment, e.g. the solvent. Each SSIP is assigned an interaction parameter (referred to as an SSIP value in this work), εi, which is equivalent to the experimentally measured hydrogen bond donor parameter (α) for positive sites or the hydrogen bond acceptor parameter (−β) for negative sites.58 These experimental hydrogen bond parameters were originally derived from the αH2 and βH2 scales developed by Taft and Abraham,9,59–61 who used experimental measurements of association constants for formation of a wide variety of 1![[thin space (1/6-em)]](https://www.rsc.org/images/entities/char_2009.gif) :
:![[thin space (1/6-em)]](https://www.rsc.org/images/entities/char_2009.gif) 1 hydrogen bonded complexes in non-polar solvents. Murray and Politzer62–64 have shown that non-covalent interactions can be rationalised based on the properties of calculated molecular electrostatic potential surfaces (MEPS). We have shown that the experimentally determined hydrogen bond parameters correlate rather well with the calculated MEPS, and this correlation forms the basis for the SSIP approach described here. The assignment of the calculated SSIP values is done by footprinting of the ab initio calculated MEPS of the isolated molecule in the gas phase as described previously.65
1 hydrogen bonded complexes in non-polar solvents. Murray and Politzer62–64 have shown that non-covalent interactions can be rationalised based on the properties of calculated molecular electrostatic potential surfaces (MEPS). We have shown that the experimentally determined hydrogen bond parameters correlate rather well with the calculated MEPS, and this correlation forms the basis for the SSIP approach described here. The assignment of the calculated SSIP values is done by footprinting of the ab initio calculated MEPS of the isolated molecule in the gas phase as described previously.65
To describe a liquid, SSIP interactions are treated in a pairwise manner, such that the association constant for interaction between the ith and jth SSIP, Kij, is given by eqn (1).
 | (1) |
The interaction energy is made up of a polar term, εiεj, and a non-polar term, EvdW, which is the energy of the van der Waals interaction between two SSIPs. For repulsive interactions (i.e. εi and εj have the same sign), it is assumed that a state can be found where the polar sites are misaligned such that only non-directional van der Waals interactions are made, and the polar interaction term, εiεj, is set to zero. As we have shown previously,55,66 van der Waals interactions between non-polar molecules are a linear function of surface area, so by choosing a description that gives all SSIPs the same area footprint on the van der Waals surface of a molecule, a constant value can be used for EVdW. The standard state used to ensure Kij is dimensionless is the maximum theoretical density of SSIPs, cmax = 300 M. The value of cmax is based on the volume an SSIP, 5 Å3, that was defined using the volume enclosed by the van der Waals surface of a water molecule, which is represented by 4 SSIPs.55 The speciation of all SSIP contacts in the liquid phase can then be calculated.
The free energy of solvation of an SSIP that represents a solute, ΔGS, can be calculated by considering the concentration of this SSIP that is not bonded to a solvent SSIP ([1nb]). ΔGS in eqn (2) is the free energy of transfer of the solute SSIP from a reference state, which corresponds to a dilute gas where there are no SSIP interactions.
 | (2) |
The first term in eqn (2) describes the interactions made by the solute SSIP with the solvent SSIPs. The second term in eqn (2) corrects for the increased probability of interaction between SSIPs when they are confined to a condensed phase.55 The confinement energy is derived by considering a phase with an SSIP concentration of θ, in which all pairwise SSIP contacts have an equilibrium constant Kij of one.
3 Results
The SSIP representation of 261 solvent molecules was described previously (see ESI† for full list of solvents).67 These representations were used to calculate solvation free energies for all solute SSIP values between −10 and +5 in increments of 0.1. Plotting the results gives a unique solvation profile for each solvent, which describes the non-covalent interactions the solvent would make with any solute taking into account the polarity and the concentration of the interaction sites present in the solvent. Note that the effects of charge–charge interactions between ionic solutes is not described by SSIMPLE, so dielectric constant would be an important additional parameter for describing the solvation properties of ionic or ionisable solutes. The calculation of SSIP values was parameterised using experimentally determined free energy changes for formation of 1![[thin space (1/6-em)]](https://www.rsc.org/images/entities/char_2009.gif) :
:![[thin space (1/6-em)]](https://www.rsc.org/images/entities/char_2009.gif) 1 hydrogen bonded complexes at 298 K, so all of the calculations described here were also carried out at 298 K.
1 hydrogen bonded complexes at 298 K, so all of the calculations described here were also carried out at 298 K.
3.1 Solvation profiles
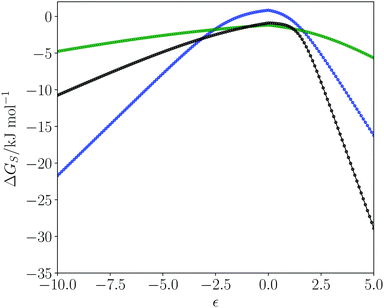
Fig. 1 shows plots of solvation free energies (ΔGS) as a function of solute SSIP value (ε) for three solvents. Toluene is a non-polar solvent, so has poor interactions with hydrogen bond donors and acceptors, leading to low solvation energies for all solutes, and the solvation profile is a relatively shallow curve. Dimethyl sulfoxide (DMSO) is a polar aprotic solvent. It has a strong hydrogen bond acceptor, so it solvates donors very strongly, with large negative values of ΔGS for positive SSIPs. DMSO is a weak donor, so it solvates acceptors poorly with small negative values of ΔGS for negative SSIPs. Water is a polar protic solvent with both hydrogen bond donors and acceptors. Thus water solvates hydrogen bond donor and hydrogen bond acceptor solutes reasonably well, leading to large negative values of ΔGS for strong hydrogen bond donors and acceptors. However, the value of ΔGS is positive for water when the value of the solute SSIP is zero (+0.8 kJ mol−1). The reason is that solvation of non-polar solutes requires breaking of water–water hydrogen bonds, and the loss of these polar interactions is not compensated by new polar interactions made with the solute. The solvation of non-polar solutes is therefore unfavourable for water, but favourable in the other two solvents, which have non-polar interaction sites available for interaction with a non-polar solute. We have previously shown that the solvation energies calculated using the SSIMPLE model provide an accurate quantitative description of the hydrophobic effect as measured by phase transfer free energies.553.2 The solvent similarity index
Comparison of the solvation profiles of different solvents requires definition of a metric which describes the distance between two curves for all possible solute SSIP values. The root mean square deviation (RMSD) between the solvation profiles for two solvents S1 and S2 is given by eqn (3). | (3) |
If the summation were carried out over the full curve then the RMSD would be dominated by the large solvation energy differences for the extreme ends of the ε scale and would not capture the smaller differences in the non-polar region, which represents the most common hydrocarbon features of organic molecules. To avoid this issue, the curves were partitioned, and each domain was given an equal weighting after normalisation. The six domains given by eqn (4) were chosen to represent strong, moderate and weak donors and acceptors.
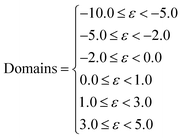 | (4) |
The values of RMSD for each domain were scaled so that they carry equal weight. The normalisation factor for the jth domain, ηj, is defined as the maximum RMSD between any two solvents in the set of all solvents for the domain. This results in scaled values between 0 and 1 for each domain, where 0 means the domains are identical, and a value of 1 means the domains are the most dissimilar of all pairings of solvents. We define the Solvent Similarity Index (SSI) as the mean of the scaled values of all domains (eqn (5)).
 | (5) |
The values of SSI depend on the values of ηj, which depend on which set of solvents is used to calculate them. Thus the definition of SSI provides a qualitative guide to similarity within a collection of solvent profiles. A quantitative measure can be created by defining normalisation factors, ηj based on a standard reference set of solvents at a specified temperature. The set of 261 pure solvent molecules listed in the ESI† were chosen as this reference set, with solvation calculations undertaken at 298 K, and the solvents defining the extreme ranges are shown in Table 1. Hydrogen fluoride has the strongest hydrogen bond donor SSIP in the set of solvents and appears as an extreme solvent for solvation of strong and moderate hydrogen bond acceptors. Hexamethyl phosphoramide (HMPA) has the strongest hydrogen bond acceptor SSIP in the set of solvents and appears as an extreme solvent for solvation of strong and moderate hydrogen bond donors. Water is an extreme solvent for the solvation of non-polar domains, due to the hydrophobic effect. The solvents at the other ends of these extremes in Table 1 are a more heterogeneous collection that represent a complex function of the SSIP composition. Glycerol appears twice, which suggests that this solvent has some rather unique properties.
| Domain | Extreme solvents |
|---|---|
| −10.0 ≤ ε < −5.0 | Hydrogen fluoride and n-dodecane |
| −5.0 ≤ ε < −2.0 | Hydrogen fluoride and glycerol |
| −2.0 ≤ ε < 0.0 | Thionyl chloride and water |
| 0.0 ≤ ε < 1.0 | Glycerol and water |
| 1.0 ≤ ε < 3.0 | HMPA and perfluoromethylcyclohexane |
| 3.0 ≤ ε < 5.0 | HMPA and perfluoromethylcyclohexane |
3.3 Solvent similarities
SSI values were calculated for all pairwise combinations of all 261 solvents in the reference set. A dendrogram showing the results is presented in Fig. 2. This diagram provides an overview of the similarities for all solvents in the set. Branch nodes in the dendrogram can be used to select threshold SSI values for classifying solvents into clusters with similar properties. The numbered branch nodes highlighted in Fig. 2 were used to define 14 distinct solvent regions (see ESI† for full details).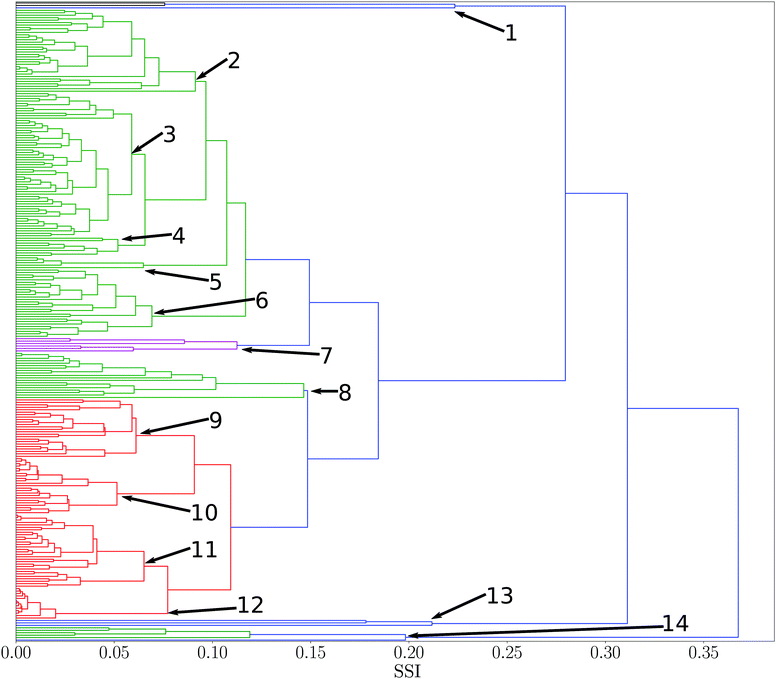 | ||
| Fig. 2 Dendrogram showing solvent similarity indices (SSI) for 261 pure solvents at 298 K using UPGMA clustering algorithm to group solvents. Numbers correspond to nodes used for partitions into smaller subsets. Solvent clusters with a normalised distance between nodes of less than two fifths of the maximum distance was used as a threshold to colour different clusters (see ESI† for full details of the solvents in each of the 14 nodes). | ||
Many of the solvent similarity clusters in the dendrogram in Fig. 2 coincide with standard functional group classifications. For example, Fig. 3 shows region 12. The alkane solvents are all clustered together in one branch of this region. The second branch in region 12 contains the other two very non-polar solvents in the set, tetramethylsilane and carbon disulfide. The remaining non-polar solvents are found in regions 10 and 11. Region 10 has two distinct branches: the aromatic hydrocarbons are clustered in one group, and aryl ethers and sulfides make up the other. Region 11 contains the haloalkanes.
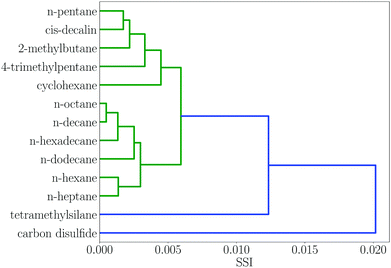 | ||
| Fig. 3 Dendrogram showing solvent similarity indices (SSI) at 298 K for solvents to the left of node 12 in Fig. 2. | ||
All of the solvents in region 2 are alcohols with the exception of N-methyl formamide, which has a good hydrogen bond donor and a good acceptor SSIP with similar values to the most polar alcohol SSIPs. The ketones, esters and ethers are all clustered together in region 3, because they have very similar hydrogen bond acceptor properties and the only hydrogen bond donors are the alkyl CH groups. Region 5 has two branches: carboxylic acids are clustered in one group, and the other branch is the only pyrrole in the set of solvents.
Some regions in the dendrogram in Fig. 2 contain mixtures of solvents with a more diverse set of functional groups. For example, Fig. 4 shows the solvents in region 13. The feature that water, hydrogen peroxide and formamide have in common is that they all have high concentrations of good hydrogen bond donors and good hydrogen bond acceptors, which means that solvophobic effects are uniquely important for solvation of non-polar solutes in these solvents. Region 14 contains the solvents which have the strongest hydrogen bond donors. The strongest hydrogen bond acceptor, hexamethylphosphoric triamide (HMPA), is found in region 1. Region 1 has two branches, but HMPA is unique in that it has the highest value of SSI at which the dendrogram branches to a single solvent.
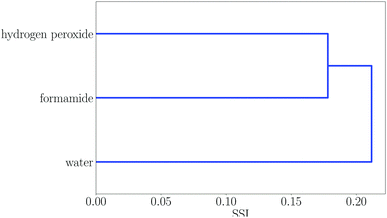 | ||
| Fig. 4 Dendrogram showing solvent similarity indices (SSI) at 298 K for solvents to the left of node 13 in Fig. 2. | ||
3.4 Distribution of SSI
The distribution of SSI values for all pairwise comparisons of solvents is shown in Fig. 5. The maximum theoretical SSI for two solvents is 1.0, which would be obtained if a pair of solvents have the greatest dissimilarity in all six domains. The maximum value of SSI for the set of 261 solvents is 0.79, for hydrogen fluoride and HMPA. Hydrogen fluoride contains a very good hydrogen bond donor, but poor hydrogen bond acceptors, so solvates hydrogen bond acceptors well and hydrogen bond donors poorly, whereas HMPA has the best hydrogen bond acceptor of any solvent but poor hydrogen bond donors, so exhibits the opposite solvation behaviour to hydrogen fluoride.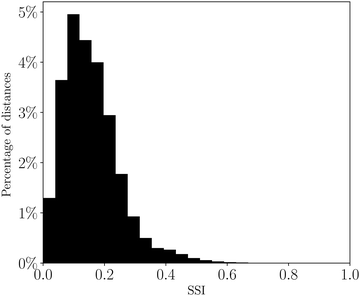 | ||
| Fig. 5 Distribution of solvent similarity indices (SSI) at 298 K for all pairwise comparisons of 261 solvents plotted as a percentage of the total number of solvent pairs. | ||
3.5 Solvent mixtures
By combining different solvents together as a mixture, a new solvent system with different properties is created. These mixtures possess properties that are a composite of the constituent parts. Comparison of the similarity of the solvent mixtures to the pure solvents provides a method to quantitatively measure the change in behaviour on mixing the solvents. Comparison of solvent mixtures with pure solvents can be used to develop a method based on SSI values for finding mixtures that might be used as substitutes for a specific pure solvent.Table 2 shows the closest solvent for different water–ethanol compositions. As might be expected from the dendrogram in Fig. 4, hydrogen peroxide and formamide are the closest solvents to the water-rich mixtures, due to the solvophobic properties. However, the minimum value of SSI for pure water is relatively high compared with the distribution in Fig. 5 (0.2 for hydrogen peroxide), highlighting the unique properties of aqueous solutions. For ethanol-rich mixtures, other short chain alcohols most closely resemble the mixed solvent, because there are similar concentrations of hydroxyl and alkyl SSIPs. Fig. 6 shows how the contributions from the 6 domains, which make up the value of SSI, vary with composition. The difference between the solvents is dominated by solvation of the non-polar SSIPs and varies uniformly with composition. Ethanol solvates non-polar functional groups well, due to preferential interactions with the solvent ethyl group. Water has no non-polar SSIPs, so the value of ΔGS for non-polar groups is positive for water.
| Ethanol volume% | Closest solvent | SSI |
|---|---|---|
| 0 | Hydrogen peroxide | 0.194 |
| 5 | Hydrogen peroxide | 0.171 |
| 10 | Hydrogen peroxide | 0.152 |
| 15 | Hydrogen peroxide | 0.137 |
| 20 | Hydrogen peroxide | 0.126 |
| 25 | Hydrogen peroxide | 0.119 |
| 30 | Formamide | 0.111 |
| 35 | Formamide | 0.096 |
| 40 | Formamide | 0.083 |
| 45 | Formamide | 0.071 |
| 50 | Formamide | 0.060 |
| 55 | Formamide | 0.052 |
| 60 | Formamide | 0.047 |
| 65 | Formamide | 0.048 |
| 70 | Formamide | 0.055 |
| 75 | Formamide | 0.065 |
| 80 | Aminoethanol | 0.053 |
| 85 | Aminoethanol | 0.039 |
| 90 | Aminoethanol | 0.033 |
| 95 | Allyl alcohol | 0.017 |
| 100 | 1-Propanol | 0.015 |
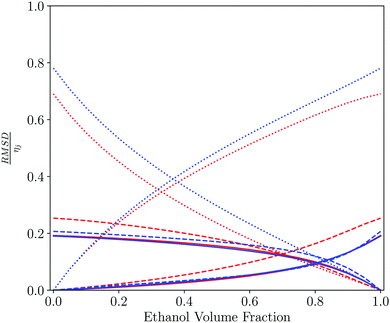 | ||
| Fig. 6 Pairwise comparison of water–ethanol solvent mixtures with each of the pure components plotted as a function of the solvent composition of the mixture. Contribution to the total solvent similarity index (SSI) by domain, plotted as the normalised RMSD between the solvation profile of the mixture and the pure solvent, RMSD/ηij as defined in eqn (3) and (4): strong acceptors (red solid line), moderate acceptors (red dashed line), weak acceptors (red dotted line), weak donors (blue dotted line), moderate donors (blue dashed line) and strong donors (blue solid line). | ||
Table 3 and Fig. 7 show a similar analysis for mixtures of tetrahydrofuran (THF) and chloroform. In this case, a more diverse range of pure solvents give the closest match to the solvation properties of the mixtures. THF has a moderate hydrogen bond acceptor and no strong hydrogen bond donors, whereas chloroform has a moderate hydrogen bond donor and no strong hydrogen bond acceptors. Thus the THF-rich mixtures are most similar to solvents with a moderate hydrogen bond acceptor and no hydrogen bond donors, whereas the chloroform-rich mixtures are most similar to solvents that also have polar CH groups. The contributions from each of the 6 domains used to calculate the SSI values for THF–chloroform mixtures are shown in Fig. 7. The major difference between the solvents is due to the way in which they solvate hydrogen bond donors.
| Chloroform volume% | Closest solvent | SSI |
|---|---|---|
| 0 | Morpholine | 0.028 |
| 5 | Morpholine | 0.021 |
| 10 | Morpholine | 0.016 |
| 15 | Morpholine | 0.018 |
| 20 | Morpholine | 0.024 |
| 25 | Cyclohexanone | 0.023 |
| 30 | Cyclohexanone | 0.017 |
| 35 | Cyclohexanone | 0.022 |
| 40 | Quinoline | 0.024 |
| 45 | 3,3-Dimethyl-2-butanone | 0.024 |
| 50 | Benzyl methyl ketone | 0.026 |
| 55 | 2-Bromopyridine | 0.024 |
| 60 | 2-Bromopyridine | 0.022 |
| 65 | 3-Bromopyridine | 0.029 |
| 70 | 3-Bromopyridine | 0.035 |
| 75 | Benzonitrile | 0.037 |
| 80 | Phenylacetonitrile | 0.039 |
| 85 | Phenylacetonitrile | 0.045 |
| 90 | Aniline | 0.047 |
| 95 | 1,1,2-Trichloroethane | 0.046 |
| 100 | Pentachloroethane | 0.017 |
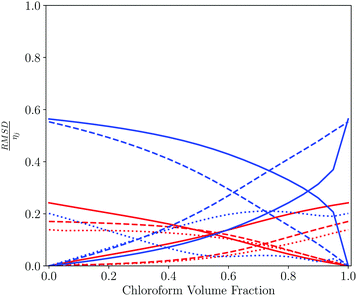 | ||
| Fig. 7 Pairwise comparison of THF–chloroform solvent mixtures with each of the pure components plotted as a function of the solvent composition of the mixture. Contribution to the total solvent similarity index (SSI) by domain, plotted as the normalised RMSD between the solvation profile of the mixture and the pure solvent, RMSD/ηij as defined in eqn (3) and (4): strong acceptors (red solid line), moderate acceptors (red dashed line), weak acceptors (red dotted line), weak donors (blue dotted line), moderate donors (blue dashed line) and strong donors (blue solid line). | ||
3.6 New solvents
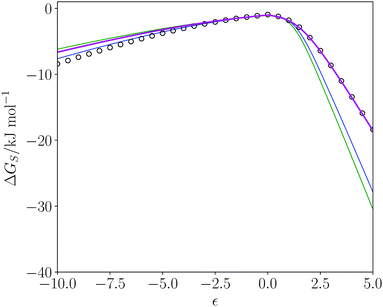
The SSI analysis provides a method for predicting the properties and potential utility of new solvents. Dihydrolevoglucosenone ((1R)-7,8-dioxabicyclo[3.2.1]octan-2-one, commercially known as cyrene) has been suggested as a green replacement for dimethyl formamide (DMF) and N-methyl pyrrolidine (NMP).68 Cyrene is produced from cellulose69 so the feedstock required can be supplied from a sustainable source of plant biomass. At the end of the lifecycle, the solvent can be incinerated without the release of NOx or SOx. Cyrene has been shown to be a useable solvent for Sonogashira cross-coupling, Cacchi-type annulation70 and urea synthesis71 but has some sensitivity to basic conditions.70Cyrene was included in the dendrogram of pure solvents and appears in region 4 (Fig. 2). DMF and NMP appear in region 6, and Fig. 8 shows a comparison of the solvation profiles. It is clear that solvation of hydrogen bond donors is not as good in cyrene compared with NMP or DMF. Table 4 shows the closest solvents to cyrene in rank order of SSI value. The SSI values in Table 4 are all significantly lower than the SSI to DMF (0.089) and to NMP (0.138). Cyrene, most closely matches 2,4-pentanedione. Fig. 8 illustrates the match between the solvation profiles for cyrene and acetone, which is one of the more common solvents in Table 4. Obviously, there are factors in addition to solvation properties that will come into play in solvent selection for a specific application: for example, the boiling points of cyrene and acetone are quite different.
| Solvent | SSI |
|---|---|
| 2,4-Pentanedione | 0.018 |
| Methyl formate | 0.020 |
| Ethyl formate | 0.023 |
| 4-Methoxybenzaldehyde | 0.025 |
| Pyrimidine | 0.027 |
| 1-Methyl-2-pyrrolidinethione | 0.027 |
| Dimethylcyanamide | 0.029 |
| Ethyl acetoacetate | 0.029 |
| Dimethyl carbonate | 0.031 |
| Cinnamaldehyde | 0.031 |
| Methyl acetate | 0.032 |
| Acetophenone | 0.033 |
| Dimethylphthalate | 0.033 |
| 2-Bromopyridine | 0.034 |
| Acetone | 0.036 |
| Diethyl malonate | 0.036 |
| Benzyl methyl ketone | 0.037 |
| 4-Methyl-2-pentanone | 0.040 |
| Diethyl sulfite | 0.040 |
| Propionaldehyde | 0.040 |
| Diethyl carbonate | 0.040 |
| Ethyl acetate | 0.040 |
| Ethyl phenyl ketone | 0.041 |
| 2,3-Butanedione | 0.043 |
| 3-Bromopyridine | 0.043 |
4 Conclusion
A key property in the selection of a solvent for a chemical transformation or formulation is the strength of the interactions with solute molecules, which in turn determines how the solutes will behave. The Surface Site Interaction Model for Liquids at Equilibrium (SSIMPLE) provides a method for calculating the free energy of solvation of a specific interaction site on the surface of a solute. The solvent is described as a set of Surface Site Interaction Points (SSIP), which describe the non-covalent interactions that can be made at any point on the molecular surface, and the solute is described as one SSIP, which would correspond to a single hydrogen bond donor or acceptor site on the surface of a polar solute. This representation can be used to calculate the free energy of solvation for all possible solute polarities, generating a unique solvation profile for any solvent or solvent mixture. These solvation profiles provide a quantitative tool for comparison of the solvation properties of two solvents, which we define as the Solvation Similarity Index. Values of SSI were calculated for all pairwise comparisons of 261 pure solvents at 298 K, and the results were used to classify solvents into groups according to their solvation properties. Application of the SSI for understanding the solvation properties of binary solvent mixtures and for identification of alternative solvents are demonstrated. The SSI represents a new quantitative parameter that can be applied to complex solvent environments of arbitrary complexity and should have applications in assessing the expected properties of candidates for new solvents from sustainable sources.Conflicts of interest
There are no conflicts to declare.Acknowledgements
We acknowledge financial support from the Engineering and Physical Sciences Research Council (EPSRC) for an EPSRC doctoral training studentship (grant code EP/M506485/1) for M. Driver.Notes and references
- D. Prat, J. Hayler and A. Wells, Green Chem., 2014, 16, 4546–4551 RSC.
- F. P. Byrne, S. Jin, G. Paggiola, T. H. M. Petchey, J. H. Clark, T. J. Farmer, A. J. Hunt, C. Robert McElroy and J. Sherwood, Sustainable Chem. Processes, 2016, 4, 7 CrossRef.
- T. Lindvig, M. L. Michelsen and G. M. Kontogeorgis, Fluid Phase Equilib., 2002, 203, 247–260 CrossRef CAS.
- C. M. Hansen, Hansen Solubility Parameters: A User's Handbook, CRC Press, 2nd edn, 2007 Search PubMed.
- J. Lu, F. Yan and J. Texter, Prog. Polym. Sci., 2009, 34, 431–448 CrossRef CAS.
- Y. Kim, C. J. Cramer and D. G. Truhlar, J. Phys. Chem. A, 2009, 113, 9109–9114 CrossRef CAS PubMed.
- W. R. Fawcett and J. S. Jaworski, J. Phys. Chem., 1983, 87, 2972–2976 CrossRef CAS.
- E. D. Hughes and C. K. Ingold, J. Chem. Soc., 1935, 244 RSC.
- M. H. Abraham, Pure Appl. Chem., 1985, 57, 1055–1064 CAS.
- B. S. Akpa, C. D'Agostino, L. F. Gladden, K. Hindle, H. Manyar, J. McGregor, R. Li, M. Neurock, N. Sinha, E. H. Stitt, D. Weber, J. A. Zeitler and D. W. Rooney, J. Catal., 2012, 289, 30–41 CrossRef CAS.
- R. K. Henderson, C. Jiménez-González, D. J. C. Constable, S. R. Alston, G. G. A. Inglis, G. Fisher, J. Sherwood, S. P. Binks and A. D. Curzons, Green Chem., 2011, 13, 854 RSC.
- K. Alfonsi, J. Colberg, P. J. Dunn, T. Fevig, S. Jennings, T. A. Johnson, H. P. Kleine, C. Knight, M. A. Nagy, D. A. Perry and M. Stefaniak, Green Chem., 2008, 10, 31–36 RSC.
- C. Jimenez-Gonzalez, C. S. Ponder, Q. B. Broxterman and J. B. Manley, Org. Process Res. Dev., 2011, 15, 912–917 CrossRef CAS.
- M. Tobiszewski, J. Namieśnik and F. Pena-Pereira, Green Chem., 2017, 19, 1034–1042 RSC.
- J. H. Hildebrand and R. L. Scott, Solubility of non-electrolytes, Reinhold Pub, 1936 Search PubMed.
-
R. Mannhold, G. I. Poda, C. Ostermann and I. V. Tetko, Calculation of molecular lipophilicity: State-of-the-art and comparison of log P methods on more than 96
![[thin space (1/6-em)]](https://www.rsc.org/images/entities/char_2009.gif) 000 compounds, 2009 Search PubMed.
000 compounds, 2009 Search PubMed. - C. Nieto-Draghi, G. Fayet, B. Creton, X. Rozanska, P. Rotureau, J.-C. de Hemptinne, P. Ungerer, B. Rousseau and C. Adamo, Chem. Rev., 2015, 115, 13093–13164 CrossRef CAS PubMed.
- R. E. Skyner, J. L. McDonagh, C. R. Groom, T. van Mourik and J. B. O. Mitchell, Phys. Chem. Chem. Phys., 2015, 17, 6174–6191 RSC.
- G. Klopman, J.-Y. Li, S. Wang and M. Dimayuga, J. Chem. Inf. Model., 1994, 34, 752–781 CrossRef CAS.
- W. M. Meylan and P. H. Howard, J. Pharm. Sci., 1995, 84, 83–92 CrossRef CAS PubMed.
- W. M. Meylan and P. H. Howard, J. Pharm. Sci., 1995, 84, 83–92 CrossRef CAS PubMed.
- A. Leo, P. Y. C. Jow, C. Silipo and C. Hansch, J. Med. Chem., 1975, 18, 865–868 CrossRef CAS PubMed.
- P. Japertas, R. Didziapetris and A. Petrauskas, Quant. Struct.-Act. Relat., 2002, 21, 23–37 CrossRef CAS.
- P. Myrdal, G. H. Ward, R.-M. Dannenfelser, D. Mishra and S. H. Yalkowsky, Chemosphere, 1992, 24, 1047–1061 CrossRef CAS.
- S. Pinsuwan, P. B. Myrdal, Y. C. Lee and S. H. Yalkowsky, Chemosphere, 1997, 35, 2503–2513 CrossRef CAS.
- A. K. Ghose and G. M. Crippen, J. Comput. Chem., 1986, 7, 565–577 CrossRef CAS.
- M. Waldherr-Teschner, T. Goetze, W. Heiden, M. Knoblauch, H. Vollhardt and J. Brickmann, Advances in Scientific Visualization, Springer Berlin Heidelberg, Berlin, Heidelberg, 1992, pp. 58–67 Search PubMed.
- S. Wildman and G. Crippen, J. Chem. Inf. Model., 1999, 39, 868–873 CrossRef CAS.
- R. Wang, Y. Fu and L. Lai, J. Chem. Inf. Model., 1997, 2338, 615–621 CrossRef.
- M. Junghans and E. Pretsch, Fresenius' J. Anal. Chem., 1997, 359, 88–92 CrossRef CAS.
- L. H. Hall and L. B. Kier, J. Chem. Inf. Model., 1995, 35, 1039–1045 CrossRef CAS.
- M. H. Abraham, J. Phys. Org. Chem., 1993, 6, 660–684 CrossRef CAS.
- M. H. Abraham, H. S. Chadha, J. P. Dixon and A. J. Leo, J. Phys. Org. Chem., 1994, 7, 712–716 CrossRef CAS.
- I. V. Tetko, V. Y. Tanchuk and A. E. P. Villa, J. Chem. Inf. Model., 2001, 41, 1407–1421 CrossRef CAS PubMed.
- R. Liu and D. Zhou, J. Chem. Inf. Model., 2008, 48, 542–549 CrossRef CAS PubMed.
- H.-F. Chen, Chem. Biol. Drug Des., 2009, 74, 142–147 CrossRef CAS PubMed.
- I. V. Tetko, I. Sushko, A. K. Pandey, H. Zhu, A. Tropsha, E. Papa, T. Öberg, R. Todeschini, D. Fourches and A. Varnek, J. Chem. Inf. Model., 2008, 48, 1733–1746 CrossRef CAS PubMed.
- J. Tomasi, B. Mennucci and R. Cammi, Chem. Rev., 2005, 105, 2999–3094 CrossRef CAS PubMed.
- W. C. Still, A. Tempczyk, R. C. Hawley and T. Hendrickson, J. Am. Chem. Soc., 1990, 112, 6127–6129 CrossRef CAS.
- W. D. Cornell, P. Cieplak, C. I. Bayly, I. R. Gould, K. M. Merz, D. M. Ferguson, D. C. Spellmeyer, T. Fox, J. W. Caldwell and P. A. Kollman, J. Am. Chem. Soc., 1995, 117, 5179–5197 CrossRef CAS.
- A. V. Marenich, R. M. Olson, C. P. Kelly, C. J. Cramer and D. G. Truhlar, J. Chem. Theory Comput., 2007, 3, 2011–2033 CrossRef CAS PubMed.
- C. J. Cramer and D. G. Truhlar, Acc. Chem. Res., 2008, 41, 760–768 CrossRef CAS PubMed.
- A. Klamt and G. Schüürmann, J. Chem. Soc., Perkin Trans. 2, 1993, 799–805 RSC.
- A. Klamt, J. Phys. Chem., 1995, 2224–2235 CrossRef CAS.
- S.-T. Lin and S. I. Sandler, Ind. Eng. Chem. Res., 2002, 899–913 CrossRef CAS.
- S.-T. Lin and S. I. Sandler, Ind. Eng. Chem. Res., 2004, 43, 1322 CrossRef CAS.
- N. M. Garrido, I. G. Economou, A. J. Queimada, M. Jorge and E. A. Macedo, AIChE J., 2012, 58, 1929–1938 CrossRef CAS.
- N. M. Garrido, A. J. Queimada, M. Jorge, E. A. Macedo and I. G. Economou, J. Chem. Theory Comput., 2009, 5, 2436–2446 CrossRef CAS PubMed.
- D. L. Mobley and J. P. Guthrie, J. Comput.-Aided Mol. Des., 2014, 28, 711–720 CrossRef CAS PubMed.
- O. Beckstein, A. Fourrier and B. I. Iorga, J. Comput.-Aided Mol. Des., 2014, 28, 265–276 CrossRef CAS PubMed.
- G. Duarte Ramos Matos, G. Calabrò and D. L. Mobley, J. Chem. Theory Comput., 2019, 15, 3066–3074 CrossRef CAS PubMed.
- P. A. Kollman, I. Massova, C. Reyes, B. Kuhn, S. Huo, L. Chong, M. Lee, T. Lee, Y. Duan, W. Wang, O. Donini, P. Cieplak, J. Srinivasan, D. A. Case and T. E. Cheatham, Acc. Chem. Res., 2000, 33, 889–897 CrossRef CAS PubMed.
- B. R. Miller, T. D. McGee, J. M. Swails, N. Homeyer, H. Gohlke and A. E. Roitberg, J. Chem. Theory Comput., 2012, 8, 3314–3321 CrossRef CAS PubMed.
- S. Genheden and U. Ryde, J. Comput. Chem., 2010, 31, 837–846 CAS.
- C. A. Hunter, Chem. Sci., 2013, 4, 1687–1700 RSC.
- P. Anastas and J. Warner, Green Chemistry: Theory and Practice, Oxford University Press, 2000 Search PubMed.
- D. Prat, O. Pardigon, H. W. Flemming, S. Letestu, V. Ducandas, P. Isnard, E. Guntrum, T. Senac, S. Ruisseau, P. Cruciani and P. Hosek, Org. Process Res. Dev., 2013, 17, 1517–1525 CrossRef CAS.
- C. A. Hunter, Angew. Chem., Int. Ed., 2004, 43, 5310–5324 CrossRef CAS PubMed.
- D. Gurka and R. W. Taft, J. Am. Chem. Soc., 1969, 91, 4794–4801 CrossRef CAS.
- R. W. Taft, D. Gurka, L. Joris, P. R. Schleyer and J. W. Rakshys, J. Am. Chem. Soc., 1969, 91, 4801–4808 CrossRef CAS.
- M. H. Abraham and J. A. Platts, J. Org. Chem., 2001, 66, 3484–3491 CrossRef CAS PubMed.
- P. Politzer, J. S. Murray and Z. Peralta-Inga, Int. J. Quantum Chem., 2001, 85, 676–684 CrossRef CAS.
- J. S. Murray and P. Politzer, Wiley Interdiscip. Rev.: Comput. Mol. Sci., 2011, 1, 153–163 CAS.
- J. S. Murray and P. Politzer, Wiley Interdiscip. Rev.: Comput. Mol. Sci., 2017, 7, 1–10 Search PubMed.
- C. S. Calero, J. Farwer, E. J. Gardiner, C. A. Hunter, M. Mackey, S. Scuderi, S. Thompson and J. G. Vinter, Phys. Chem. Chem. Phys., 2013, 15, 18262–18273 RSC.
- C. A. Hunter, Chem. Sci., 2013, 4, 834–848 RSC.
- M. D. Driver, M. J. Williamson, J. Cook and C. A. Hunter, Chem. Sci., 2020, 11, 4456–4466 RSC.
- J. Sherwood, M. De bruyn, A. Constantinou, L. Moity, C. R. McElroy, T. J. Farmer, T. Duncan, W. Raverty, A. J. Hunt and J. H. Clark, Chem. Commun., 2014, 50, 9650–9652 RSC.
- F. Cao, T. J. Schwartz, D. J. McClelland, S. H. Krishna, J. A. Dumesic and G. W. Huber, Energy Environ. Sci., 2015, 8, 1808–1815 RSC.
- K. L. Wilson, A. R. Kennedy, J. Murray, B. Greatrex, C. Jamieson and A. J. B. Watson, Beilstein J. Org. Chem., 2016, 12, 2005–2011 CrossRef CAS PubMed.
- L. Mistry, K. Mapesa, T. W. Bousfield and J. E. Camp, Green Chem., 2017, 19, 2123–2128 RSC.
Footnote |
| † Electronic supplementary information (ESI) available: PDF file containing SSIP normalisation domains, a list of solvents used in this study, and details of the solvent clusters from the dendrogram in Fig. 2, and a csv file of pure solvent SSI values. See DOI: 10.1039/d0cp01570a |
| This journal is © the Owner Societies 2020 |

