
 Open Access Article
 This Open Access Article is licensed under a Creative Commons Attribution-Non Commercial 3.0 Unported Licence
Spectroscopic characterisation of radical polyinterhalogen molecules†
Joe
Gregory
*a,
Jan R. R.
Verlet
 b and
James N.
Bull
a
b and
James N.
Bull
a
aSchool of Chemistry, Norwich Research Park, University of East Anglia, Norwich NR4 7TJ, UK. E-mail: james.bull@uea.ac.uk
bDepartment of Chemistry, Durham University, South Road, Durham DH1 3LE, UK
First published on 3rd April 2020
Abstract
Spectroscopic characterisations of the radical polyinterhalogen molecules IF2 and I2F are reported using anion photoelectron spectroscopy. The corresponding parent anions, IF2− and I2F−, are common products formed in hard Ar–CF3I plasmas and are relevant in the semiconductor manufacture industry. The I2F− species, which is present as the [I–I–F]− isomer, is a “non-classical” polyinterhalogen.
The propensity for halide anions to combine and form polyhalogen anions, such as I3−, has been known for around 200 years.1 However, examples and spectroscopic characterisation of polyinterhalogen molecules, particularly open-shell species, have proven to be elusive.2 To date, most spectroscopic characterisations of polyinterhalogen anions are as crystallised solids or have been performed in matrix isolation with a counter cation.2–4 There are no known vibrationally-resolved spectroscopic determinations of radical (open-shell) polyinterhalogen molecules. On the other hand, closed-shell polyinterhalogen molecules such as IF3, IF5, IF7 and I2F4 are relatively stable compounds. Polyinterhalogen anions and their corresponding radical neutrals are appealing targets for gas-phase spectroscopy due to being textbook examples for valence-shell electron pair repulsion (VSEPR) theory and the Rundle–Pimentel scheme for hypervalency.5,6 They are also desirable systems to benchmark high-level quantum chemical calculations due to challenges associated with describing heavy atoms.7,8
This paper reports a combined photoelectron spectroscopy and electronic structure theory study on the IF2−, I2F−, IF2 and I2F species. There have been several reports of synthesis, crystallography and spectroscopic characterisation of IF2− embedded in a solid state matrix,9,10 and computational studies on IF2− and I2F− and related species,7,10–14 however, a recent review by Riedel and co-workers2 noted “Thus far,… [I2F]− have not been detected experimentally.” While this statement might be true for condensed phases, I2F− appears to be a common product formed in hard Ar–CF3I plasmas.
There are only a handful of examples of gas-phase spectroscopic studies on polyhalogen species, mostly targeting I3−. A series of pioneering investigations by Neumark and co-workers15–18 applied anion photoelectron spectroscopy with different laser sources to characterise vibronic properties of the radical neutral I3, and photodissociation dynamics of the parent anion. Several other studies have focussed on photodissociation dynamics.19–22 There have been two investigations on I2Br− probing the dissociation dynamics, with one of these studies providing a single-colour photoelectron spectrum at 267 nm.23,24 In the present work, we have coupled a jet-cooled plasma discharge source with time-of-flight mass spectrometry and anion photoelectron spectroscopy. This strategy allows for generation and mass selection of IF2− and I2F−, and determination of spectroscopic properties of the radical neutral IF2 and I2F species.
Intriguingly, radical polyinterhalogen molecules may have a significant bearing in industrial plasma processes. In particular, in the present study we produced the IF2− and I2F− species through plasmisation of an Ar–CF3I mixture; this mixture and process is relevant in the semiconductor manufacture industry. In this industry, dry-etching plasma processes utilise the reaction between silicon wafers, which are the substrate for semiconductor and microprocessors, and fluorine atoms and CF3 radicals to etch the substrate at specific locations on the wafer.25 Conventionally, these radical species are produced in a plasma consisting of an inert carrier gas seeded with CF4 or C3F8. In recent years, there has been growing interest in the use of CF3I as an alternative to CF4 because the use of CF4 is restricted in many countries by the Montreal Protocol due to the molecule's high global warming potential (GWP).26,27 For example, even though CF3I is infrared active, CF3I has an atmospheric residence life of ≈1 day and corresponding GWP ≈ 1.28,29 In contrast, CF4 has a residence life of ≈50![[thin space (1/6-em)]](https://www.rsc.org/images/entities/char_2009.gif) 000 years and corresponding GWP ≈ 6000.29,30 Furthermore, although iodine atoms formed through UV photodissociation of CF3I are exceptionally destructive towards stratospheric ozone,31 the short residence time of CF3I released at terrestrial altitudes means that these molecules do not reach the stratosphere and contribute to ozone destruction. Ultimately, modelling and tuning of the etching process allows maximisation of process efficiency and minimisation of unwanted by-products. Theoretical plasma models require a detailed qualitative and quantitative understanding of the rich ion–molecule and electron–molecule chemistry that occurs in dry-etching plasmas (particularly the chemistry associated with fluorine-containing radicals).32–36
000 years and corresponding GWP ≈ 6000.29,30 Furthermore, although iodine atoms formed through UV photodissociation of CF3I are exceptionally destructive towards stratospheric ozone,31 the short residence time of CF3I released at terrestrial altitudes means that these molecules do not reach the stratosphere and contribute to ozone destruction. Ultimately, modelling and tuning of the etching process allows maximisation of process efficiency and minimisation of unwanted by-products. Theoretical plasma models require a detailed qualitative and quantitative understanding of the rich ion–molecule and electron–molecule chemistry that occurs in dry-etching plasmas (particularly the chemistry associated with fluorine-containing radicals).32–36
IF2− & IF2
Photoelectron spectra for IF2− are shown in Fig. 1, revealing a clear vibrational progression with spacing 600 ± 50 cm−1. The adiabatic detachment energy (ADE), assigned as the lowest energy discernible detaching vibration in the hν = 4.13 eV spectrum, is ADE = 4.03 ± 0.02 eV. The vertical detachment energy (VDE), determined as the most intense vibration in the hν = 4.66 eV photoelectron spectrum, is VDE = 4.23 ± 0.04 eV. These ADE and VDE values are most consistent with the calculated values (Table 1) for the [F–I–F]− isomer shown in Fig. 2; there was no evidence for the [F–F–I]− isomer, which was calculated to lie 2.74 eV (264 kJ mol−1) higher in energy. Calculated ADE and VDE values for [F–I–F]− at the CCSD(T)//def2-TZVPD level of theory (Table 1) are both ≈4% larger than the experimental values (similar to the result for I− given in the ESI†). Increasing the basis set to def2-QZVPD gave calculated values that were ≈6% larger than the experimental values (Table 1). The better agreement with the smaller basis set is presumably a fortuitous cancellation of errors with some fraction of this associated with heavy atom/relativistic effects.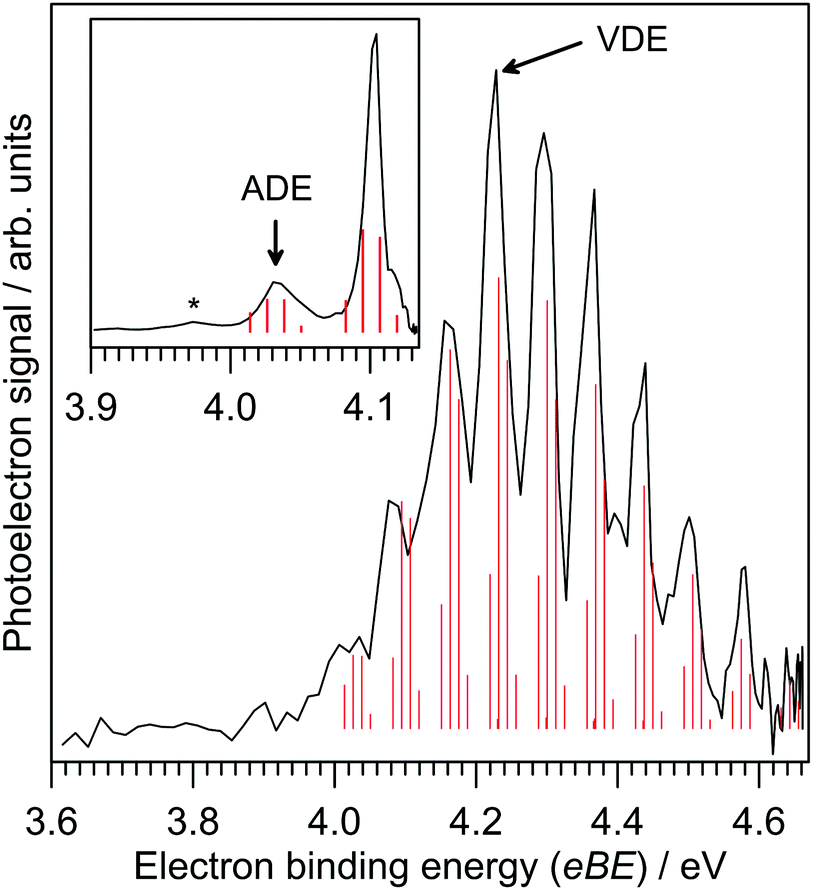 | ||
| Fig. 1 Photoelectron spectra for IF2− at hν = 4.66 eV and 4.13 eV (inset) and Franck–Condon simulation (red sticks) of the D0 ← S0 detaching transition for the [F–I–F]− isomer. Electron binding energy (eBE) and electron kinetic energy (eKE) are related by eBE = hν − eKE, where hν is the photon energy. | ||
| [F–I–F]− | [F–F–I]− | [I–I–F]− | [I–F–I]− | |
|---|---|---|---|---|
| ADEe | 4.03 ± 0.02 | — | 4.04 ± 0.06 | — |
| VDEe | 4.23 ± 0.04 | — | 4.23 ± 0.04 | — |
| ADEc | 4.14 (4.15) | 3.17 | 4.22 (4.28) | 3.19 (3.38) |
| VDEc | 4.40 (4.50) | 3.88 | 4.40 (4.55) | 3.96 (4.08) |
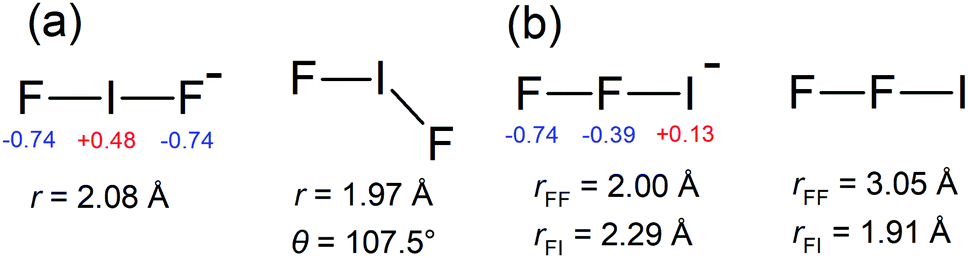 | ||
| Fig. 2 Calculated equilibrium geometries at the CCSD(T)//def2-TZVPD level of theory for: (a) [F–I–F]− and [F–I–F], and (b) [F–F–I]− and [F–F–I]. NBO charges (red and blue font) are given for the anions. The lowest energy isomer, [F–I–F]− has D∞h symmetry, and [F–I–F] has C2v symmetry. | ||
A Franck–Condon simulation of the photoelectron spectrum for the [F–I–F]− configuration is shown in Fig. 1 and has good agreement with the experimental spectrum. The simulation suggests that the vibrational progression is dominated by detaching transitions to the ν2 (asymmetric stretch) and ν3 (symmetric stretch) vibrations of the [F–I–F] radical neutral species; calculated frequencies suggest that these two vibrations are nearly degenerate – see Table 2. We can therefore assign the experimental value of ν2/ν3 at 600 ± 50 cm−1 for the [F–I–F] species. The small feature denoted by * in the inset in Fig. 1 is probably a hot band from vibrationally-excited ions produced in the plasma (see ESI†). The ADE assignment to the 0–0 transition should be robust based on alignment of the VDE with the Franck–Condon simulation. It is worth noting that a Franck–Condon simulation of the photoelectron spectrum for the [F–F–I]− isomer (see vibrational frequencies for [F–F–I] in Table 2) is inconsistent with the experimental spectra, lending support to the above isomer assignment.
Calculated vertical excitation energies for the [F–I–F]− isomer are given in Table S1 in the ESI.† These data show that although an excited state resonance is energetically accessible with a hν = 4.66 eV photon, oscillator strengths are zero and therefore the photoelectron spectra in Fig. 1 should be described by direct photodetachment to the ground electronic state of the neutral. Calculated vertical excitation energies for neutral [F–I–F], i.e. electronic excited states of [F–I–F] at the [F–I–F]− equilibrium geometry, suggested that only the ground electronic state is accessible using the photon energies in Fig. 1, consistent with a single vibrational progression.
I2F− & I2F
Photoelectron spectra for I2F− at three photon energies are shown in Fig. 3a, revealing two detachment bands. The lower binding energy band has ADE = 4.04 ± 0.06 eV and VDE = 4.23 ± 0.04 eV. There is no clear vibrational structure. The higher binding energy band has ADE2 = 4.60 ± 0.04 eV and VDE2 = 4.68 ± 0.04 eV, and vibrational spacing of 550 ± 100 cm−1.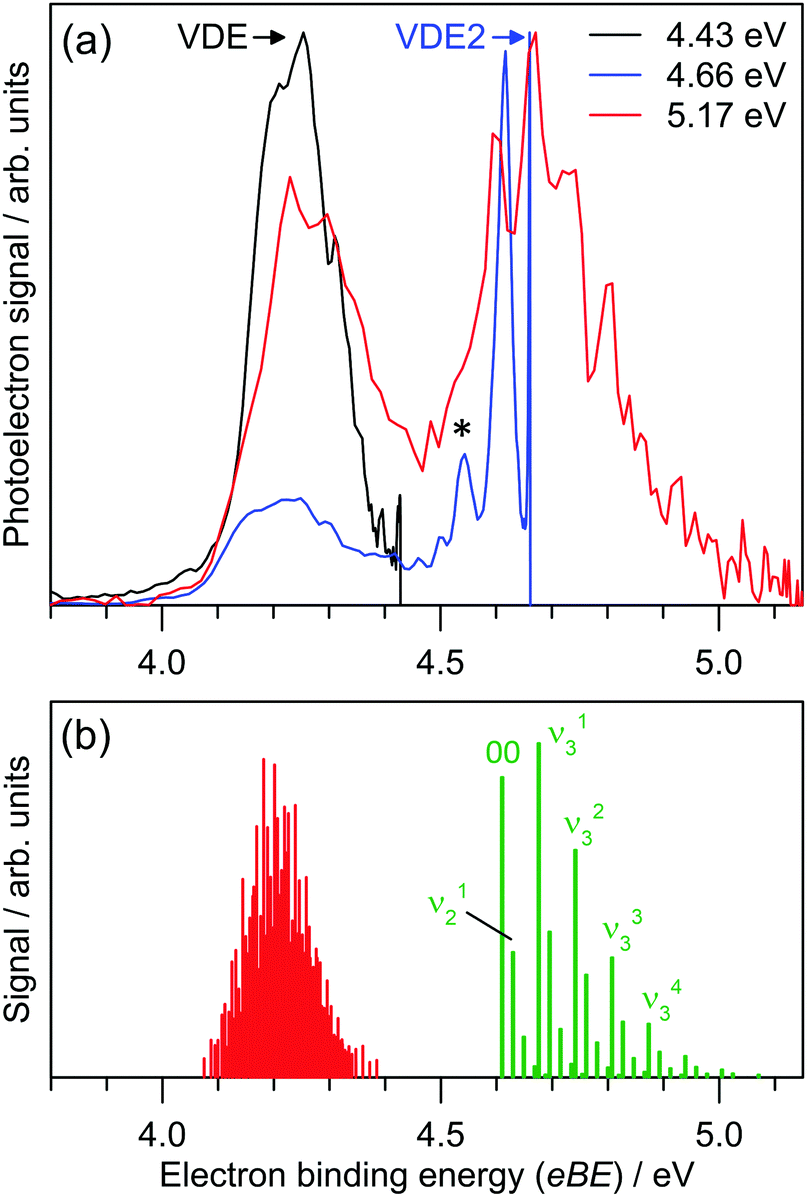 | ||
| Fig. 3 (a) Photoelectron spectra for I2F− at hν = 4.43, 4.66 and 5.17 eV. Electron binding energy (eBE) and electron kinetic energy (eKE) are related by eBE = hν − eKE, where hν is the photon energy. (b) Franck–Condon simulation of direct photodetachment to the D0 and A1-symmetry neutral electronic states. The simulations suggest that the D0 ← S0 detaching transition is dominated by low frequency modes and combination bands. See ESI† for Franck–Condon simulations at higher temperatures which assign the feature denoted by * to a hot band. | ||
The ADE and VDE parameters for the lower energy band are consistent with the calculated values for the [I–I–F]− isomer (Table 1), again with a small overestimation by theory. The two bands in Fig. 3a are thus assigned to detaching transitions to the ground and excited electronic states of the [I–I–F] radical neutral. Equilibrium geometries for the I2F− and I2F isomers are shown in Fig. 4; the [I–I–F]− isomer is more stable by 1.35 eV (130 kJ mol−1), consistent with it being the predominant isomer formed in the plasma. There was no evidence for the [I–F–I]− isomer when photoelectron spectra were recorded at photon energies below the ADE for the [I–I–F]− isomer. A Franck–Condon simulation of the photoelectron spectrum to give the ground electronic state of the neutral (red in Fig. 3b) shows no clear vibrational structure, consistent with experimental spectrum. Calculated vibrational frequencies are given in Table 3.
 | ||
| Fig. 4 Calculated equilibrium geometries at the CCSD(T)//def2-TZVPD level of theory for: (a) [I–I–F]− and [I–I–F], and (b) [I–F–I]− and [I–F–I]. NBO charges (red and blue font) are given for the anions. The lowest energy isomer, [I–I–F]− has C∞h symmetry, and [I–I–F] has Cs symmetry. | ||
The second, higher binding energy photodetachment band in Fig. 3a was assigned to direct photodetachment to the A1 state of the [I–I–F] species. Geometry optimisation of this state at the EOM-CCSD//def2-TZVPD level of theory produced a linear (C∞h symmetry) structure with rII = 3.02 Å and rIF = 1.96 Å. Using this structure, ADE2 was calculated at 4.79 eV (term energy, Te, of 0.57 eV which is close to the experimental value of Te = 0.56 ± 0.08 eV), which is again ≈4% larger than experiment. Calculated vibrational frequencies for the A1 state are ν1 = 109 cm−1 (bend), ν2 = 157 cm−1 (symmetric stretch) and ν3 = 530 cm−1 (asymmetric stretch). A Franck–Condon simulation of the photoelectron spectrum associated with formation of the A1 state of the neutral is shown in green in Fig. 3b, and predicts that the vibrational structure is predominantly from the ν3 = 530 cm−1 mode. The feature denoted by * in Fig. 3a at eBE = 4.56 eV is assigned to hot band signal (see ESI†).
Calculated vertical excitation energies for the I2F− isomers are given in Table S1 in the ESI.† For the [I–I–F]− isomer, the first few electronic states have very low oscillator strengths and the photoelectron spectra for photon energies <5 eV should be dominated by direct photodetachment. There is, however, a bright A1-symmetry resonance with a calculated vertical excitation energy in the 5.1–5.2 eV range (see ESI†). Fortunately, the photoelectron spectra for both of these species are at lower binding energies and should not interfere with the spectra shown in Fig. 3. It is worth noting that the issue of bright excited state resonances in the detachment continuum is more serious for I3− (ref. 15–18) and larger polyinterhalogen anions due to an increased density of electronic states.
Polyinterhalogen molecules can be divided into two categories, classical and non-classical.3 The former is defined as containing an electropositive central atom surrounded by electronegative halogen atoms, e.g. [F–I–F]−. In contrast, for a non-classical polyinterhalogen molecule, the central halide is more electronegative than the coordinating dihalogen or interhalogen molecules, e.g. Cl(I2)4− in which four I2 molecules coordinate a Cl−.3,37 Interestingly, the [I–I–F]− species satisfies the non-classical criterion, possessing covalent-like bond lengths and a terminal F− coordinated to an I2 molecule (see NBO charges in Fig. 4). Similar arguments have been made about the [I–I–Cl]− species in the solid state.3,38 Finally, it is worth noting that Mabbs et al.23 reported a 267 nm photoelectron spectrum of I2Br−, which presumably exists as the [I–I–Br]− isomer and also is an example of a non-classical polyinterhalogen, however, their photoelectron spectrum showed no vibrational structure.
Our experiments suggest that IF2−, I2F− and most likely the corresponding neutrals are amongst the major products formed in a hard Ar–CF3I plasma. In the semiconductor manufacture industry, radical neutrals including IF2 and I2F formed in the etching plasma may collide and react with etchant substrates. In this context, the bond dissociation energy (BDE) to produce a fluorine atom is related to etching efficiency – a lower BDE gives enhanced etching capacity. For the [F–I–F] and [I–I–F] isomers, BDEs for fluorine atoms were calculated at 1.74 eV and 1.35 eV, respectively, using the CCSD(T)//def2-TZVPD level of theory. For comparison, the calculated BDE for a fluorine atom from the CF3 radical is 3.51 eV, which is substantially larger than that for the [F–I–F] and [I–I–F] isomers and suggests that polyinterhalogen radicals formed in hard Ar–CF3I plasmas are important etching species.
In summary, this paper has reported a combined photoelectron spectroscopy and electronic structure theory study on the IF2−, IF2, IF2− and I2F species, determining the gas-phase structures and electron detachment parameters for the anions and vibrational structure of the neutrals. This determination provides the first vibrationally-resolved spectroscopic characterisation of isolated polyinterhalogen radicals. Whereas IF2− as the [F–I–F]− isomer is a classical polyinterhalogen molecule, IF2− as the [I–I–F]− isomer is a non-classical polyinterhalogen molecule. Theoretical modelling of these species has shown that the CCSD(T)//def2-TZVPD level of theory, on average, predicts ADE and VDE parameters to within ≈4% of experiment, however, this level of theory suffers from some degree of Pauling-point agreement. The IF2 and I2F radicals may play an important role in plasma etching processes due to having low bond dissociation energies to give fluorine atoms.
Conflicts of interest
There are no conflicts to declare.Acknowledgements
Funding was provided by a University of East Anglia start-up allowance (to JNB) and the European Research Council (Starting Grant 306536 to JRRV). Electronic structure calculations were carried out on the High Performance Computing Cluster supported by the Research and Specialist Computing Support service at the University of East Anglia. Prof. Dr Sebastian Riedel, Freie Universität Berlin, is thanked for insightful discussions.Notes and references
- J. Pelletier and J. B. Caventou, Ann. Chim. Phys., 1819, 10, 142–176 Search PubMed.
- K. Sonnenberg, L. Mann, F. A. Redeker, B. Schmidt and S. Riedel, Angew. Chem., Int. Ed., 2020, 59, 5464–5493 CrossRef CAS PubMed.
- H. Haller and S. Riedel, Z. Anorg. Allg. Chem., 2014, 640, 1281–1291 CrossRef CAS.
- P. H. Svensson and L. Kloo, Chem. Rev., 2003, 103, 1649–1684 CrossRef CAS PubMed.
- R. J. Hach and R. E. Rundle, J. Am. Chem. Soc., 1951, 73, 4321–4324 CrossRef CAS.
- G. C. Pimente, J. Chem. Phys., 1951, 19, 446–448 CrossRef.
- G. A. Landrum, N. Goldberg and R. Hoffmann, J. Chem. Soc., Dalton Trans., 1997, 3605–3613 RSC.
- P. Pyykkö, Annu. Rev. Phys. Chem., 2012, 63, 45–64 CrossRef PubMed.
- X. Zhang and K. Seppelt, Z. Anorg. Allg. Chem., 1997, 623, 491–500 CrossRef CAS.
- K. O. Christe, W. W. Wilson, G. W. Drake, M. A. Petrie and J. A. Boatz, J. Fluorine Chem., 1998, 88, 185–189 CrossRef CAS.
- Y. Ogawa, O. Takahashi and O. Kikuchi, THEOCHEM, 1998, 429, 187–196 CrossRef CAS.
- D. A. Dixon, D. J. Grant, K. O. Christe and K. A. Peterson, Inorg. Chem., 2008, 47, 5485–5494 CrossRef CAS PubMed.
- K. S. Thanthiriwatte, M. Vasiliu, D. A. Dixon and K. O. Christe, Inorg. Chem., 2012, 51, 10966–10982 CrossRef CAS PubMed.
- F. A. Redeker, A. Kropman, C. Müller, S. E. Zewge, H. Beckers, B. Paulus and S. Riedel, J. Fluorine Chem., 2018, 216, 81–88 CrossRef CAS.
- T. R. Taylor, K. R. Asmis, M. T. Zanni and D. M. Neumark, J. Chem. Phys., 1999, 110, 7607–7609 CrossRef CAS.
- M. T. Zanni, B. J. Greenblatt, A. V. Davis and D. M. Neumark, J. Chem. Phys., 1999, 111, 2991–3003 CrossRef CAS.
- H. Choi, R. T. Bise, A. A. Hoops and D. M. Neumark, J. Chem. Phys., 2000, 113, 2255 CrossRef CAS.
- H. Choi, T. R. Taylor, R. T. Bise, A. A. Hoops and D. M. Neumark, J. Chem. Phys., 2000, 113, 8608 CrossRef CAS.
- L. Zhu, K. Takahashi, M. Saeki, T. Tsukuda and T. Nagata, Chem. Phys. Lett., 2001, 350, 223–239 CrossRef.
- A. A. Hoops, J. R. Gascooke, A. E. Faulhaber, K. E. Kautzman and D. M. Neumark, J. Chem. Phys., 2004, 120, 7901–7909 CrossRef CAS PubMed.
- R. Nakanishi, N. Saitou, T. Ohno, S. Kowashi, S. Yabushita and T. Nagata, J. Chem. Phys., 2007, 126, 204311 CrossRef PubMed.
- J. A. Gibbard and R. E. Continetti, Faraday Discuss., 2019, 217, 203–219 RSC.
- R. Mabbs, K. Pichugin, E. Surber and A. Sanov, J. Chem. Phys., 2004, 121, 265 CrossRef CAS PubMed.
- P. E. Crider, A. W. Harrison and D. M. Neumark, J. Chem. Phys., 2011, 134, 134306 CrossRef PubMed.
- J. W. Coburn and H. F. Winters, J. Vac. Sci. Technol., 1979, 16, 391–403 CrossRef CAS.
- P. Forster, V. Ramaswamy, P. Artaxo, T. Berntsen, R. Betts, D. W. Fahey, J. Haywood, J. Lean, D. C. Lowe, G. Myhre, J. Nganga, R. Prinn, G. Raga, M. Schulz and R. Van Dorland, Changes in Atmospheric Constituents and in Radiative Forcing, in Climate Change 2007: The Physical Science Basis. Contribution of Working Group I to the Fourth Assessment Report of the Intergovernmental Panel on Climate Change, ed. S. Solomon, D. Qin, M. Manning, Z. Chen, M. Marquis, K. Averyt, M. Tignor and H. Miller, Cambridge University Press, Cambridge, United Kingdom, 2007, ch. 2, p. 141 Search PubMed.
- Ø. Hodnebrog, M. Etminan, J. S. Fuglestvedt, G. Marston, G. Myhre, C. J. Nielsen, K. P. Shine and T. J. Wallington, Rev. Geophys., 2013, 51, 300–378 CrossRef.
- S. Solomon, J. B. Burkholder, A. R. Ravishankara and R. R. Garcia, J. Geophys. Res., 1994, 99, 20929 CrossRef.
- A. K. Jain, B. P. Briegleb, K. Minschwaner and D. J. Wuebbles, J. Geophys. Res.: Atmos., 2000, 105, 20773–20790 CrossRef CAS.
- C. M. Roehl, D. Boglu, C. Brühl and G. K. Moortgat, Geophys. Res. Lett., 1995, 22, 815–818 CrossRef CAS.
- S. Solomon, R. R. Garcia and A. R. Ravishankara, J. Geophys. Res., 1994, 99, 20491 CrossRef.
- L. G. Christophorou and J. K. Olthoff, J. Phys. Chem. Ref. Data, 2000, 29, 553–569 CrossRef CAS.
- J. N. Bull, M. Bart, C. Vallance and P. W. Harland, Phys. Rev. A: At., Mol., Opt. Phys., 2013, 88, 062710 CrossRef.
- J. N. Bull, J. W. L. Lee and C. Vallance, Phys. Rev. A, 2017, 91, 022704 CrossRef.
- G. Mensa-Bonsu, D. J. Tozer and J. R. R. Verlet, Phys. Chem. Chem. Phys., 2018, 21, 13977–13985 RSC.
- H. Köckert, D. Heathcote, J. W. L. Lee, W. Zhou, V. Richardson and C. Vallance, Phys. Chem. Chem. Phys., 2019, 21, 14296–14305 RSC.
- C. Walbaum, M. Richter, U. Sachs, I. Pantenburg, S. Riedel, A. Mudring and G. Meyer, Angew. Chem., Int. Ed., 2013, 125, 12965–12968 CrossRef.
- Y.-Q. Wang, Z.-M. Wang, C.-S. Liao and C.-H. Yan, Acta Crystallogr., Sect. C: Cryst. Struct. Commun., 1999, 55, 1503–1506 CrossRef.
Footnote |
| † Electronic supplementary information (ESI) available: Experimental methods, theoretical methods, calculated vertical excitation energies, further Franck–Condon simulations. See DOI: 10.1039/d0cp01311k |
| This journal is © the Owner Societies 2020 |