
 Open Access Article
 This Open Access Article is licensed under a Creative Commons Attribution-Non Commercial 3.0 Unported Licence
Fine structure in the solution state 13C-NMR spectrum of C60 and its endofullerene derivatives†
George Razvan
Bacanu
*,
Gabriela
Hoffman
,
Michael
Amponsah
,
Maria
Concistrè
,
Richard J.
Whitby
 and
Malcolm H.
Levitt
and
Malcolm H.
Levitt
Departament of Chemistry, University of Southmapton, Southampton SO17 1BJ, UK. E-mail: g.r.bacanu@soton.ac.uk; mhl@soton.ac.uk; Tel: +44 (0)23 80596753
First published on 13th May 2020
Abstract
The 13C NMR spectrum of fullerene C60 in solution displays two small “side peaks” on the shielding side of the main 13C peak, with integrated intensities of 1.63% and 0.81% of the main peak. The two side peaks are shifted by −12.6 ppb and −20.0 ppb with respect to the main peak. The side peaks are also observed in the 13C NMR spectra of endofullerenes, but with slightly different shifts relative to the main peak. We ascribe the small additional peaks to minor isotopomers of C60 containing two adjacent 13C nuclei. The shifts of the additional peaks are due to a secondary isotope shift of the 13C resonance caused by the substitution of a 12C neighbour by 13C. Two peaks are observed since the C60 structure contains two different classes of carbon–carbon bonds with different vibrational characteristics. The 2![[thin space (1/6-em)]](https://www.rsc.org/images/entities/char_2009.gif) :1 ratio of the side peak intensities is consistent with the known structure of C60. The origin and intensities of the 13C side peaks are discussed, together with an analysis of the 13C solution NMR spectrum of a 13C-enriched sample of C60, which displays a relatively broad 13C NMR peak due to a statistical distribution of 13C isotopes. The spectrum of 13C-enriched C60 is analyzed by a Monte Carlo simulation technique, using a theorem for the second moment of the NMR spectrum generated by J-coupled spin clusters.
:1 ratio of the side peak intensities is consistent with the known structure of C60. The origin and intensities of the 13C side peaks are discussed, together with an analysis of the 13C solution NMR spectrum of a 13C-enriched sample of C60, which displays a relatively broad 13C NMR peak due to a statistical distribution of 13C isotopes. The spectrum of 13C-enriched C60 is analyzed by a Monte Carlo simulation technique, using a theorem for the second moment of the NMR spectrum generated by J-coupled spin clusters.
1 Introduction
The 13C solution NMR spectrum of C60 fullerene is widely believed to contain a single peak. Indeed the observation of a single 13C peak in the solution NMR of C60 was one of the key pieces of evidence for its highly symmetrical structure.1,2 All sixty 13C sites are chemically equivalent and have an identical chemical shift, as opposed to less symmetrical fullerenes such as C70 which displays 5 peaks in the 13C spectrum.1Nevertheless, close examination of the high resolution 13C spectrum of C60 in solution reveals two small additional peaks at a slightly lower chemical shift with respect to the main peak, in an intensity ratio of 2:1 (Fig. 1). Pairs of side peaks are also observed in the 13C solution NMR spectrum of endofullerenes, in which the C60 cages encapsulate guest molecules such as H2 and H2O (Fig. 2). The 13C chemical shifts of the fullerene cage sites are perturbed by the endohedral guests within the cavity of C60, leading to two main peaks (for empty and filled fullerene molecules) and two pairs of small side peaks, each with an amplitude ratio of 2:1.
 | ||
| Fig. 1 (a) 13C NMR spectrum of 25 mM C60 in deuterated orthodichlorobenzene (ODCB-d4), at a magnetic field of 16.45 T and a temperature of 295 K (sum of 856 transients). The main C60 peak is at 142.818 ppm relative to TMS. (b) Expanded view of the base of the main C60 peak, showing the assignment of the side peaks to 13C pairs sharing either a HP (hexagon–pentagon) or a HH (hexagon–hexagon) bond. The secondary 13C isotope shifts are 1Δ ≃ 12.6 ppb for a HP 13C2 pair and 1Δ ≃ 20.0 ppb for a HH 13C2 pair. | ||
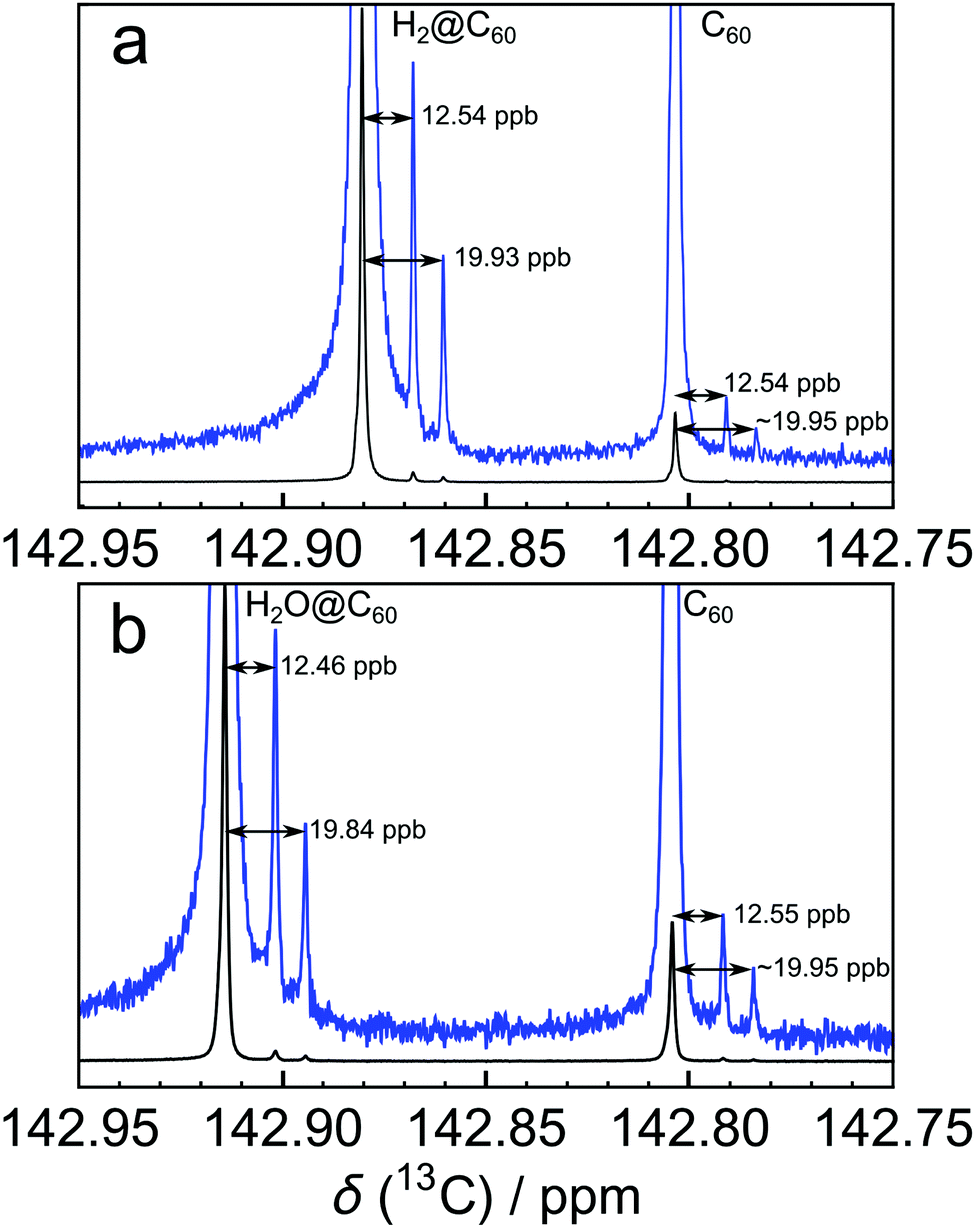 | ||
| Fig. 2 13C NMR spectra of ∼25 mM solutions of (a) H2@C60 (filling factor 87.7%, sum of 416 transients) and (b) H2O@C60 (filling factor 78.6%, sum of 272 transients) in ODCB-d4 at a temperature of 298 K. For each species, a pair of side peaks on the shielding side of the main 13C peak is clearly visible. | ||
The pairs of side peaks may be attributed to minor isotopomers of C60 with two 13C nuclei in neighbouring carbon sites. The substitution of the abundant 12C isotope at a particular site by the heavier 13C isotope leads to secondary isotope shifts in the resonance frequencies of neighbouring 13C sites.3–8 This shift arises since the vibrational wavefunctions of the participating nuclei are perturbed by the introduction of a nuclide with an increased mass. Since the structure of C60 contains two different classes of carbon–carbon bond with different vibrational characteristics, the 13C spectrum of C60 and its derivatives contains two side peaks. As discussed below, the 2:1 intensity ratio of the two side peaks reflects the relative abundance of the C–C bond types in C60. Note that the side peak structure is not caused by 13C–13C J-couplings, since the two 13C nuclei in 13C2 isotopomers of C60 are magnetically equivalent.
The aim of this paper is to provide an interpretation of the observed spectral structure in the 13C NMR of C60 fullerene and its endofullerene derivates. The 13C NMR spectrum of 13C-enriched C60 is also presented, and analyzed using an approximate Monte Carlo simulation method exploiting a theorem for the second moment of the NMR spectra of J-coupled spin clusters.
2 Methods
Fullerene C60 was purchased from Materials Technologies Research Ltd (Cleveland, Ohio, USA) and purified by sublimation in-house. A solution was prepared by dissolving 23.4 mg of sublimed C60 powder in ∼1.1 mL of ortho-dichlorobenzene-d4 (ODCB-d4, Sigma-Aldrich), adding ∼10 μL of tetramethylsilane (TMS) for chemical shift referencing and ∼100 μL of tris(trimethylsilyl)silane for temperature calibration.9 The solution was filtered to remove any undissolved impurities and degassed by bubbling O2-free N2 gas through the solution for 10 min.The endofullerenes H2@C60 and H2O@C60 were prepared by molecular surgery techniques.10–14Fig. 2(a) shows the 13C NMR spectrum of H2@C60 in ODCB-d4, with a “filling factor” (i.e. fraction of filled cages) of 87.7%. The solution of H2O@C60 in ODCB-d4 used for Fig. 2(b) contained H2O@C60 with a filling factor of 78.6%.
The 13C-enriched fullerene was purchased as 20–30% 13C-enriched powder from MER Corporation (Tucson, Arizona, USA) and sublimed in-house. 15.5 mg of sublimed powder was dissolved in 1 mL of ODCB-d4 plus ∼10 μL of TMS. The solution was filtered to remove undissolved impurities and degassed by O2-free N2 bubbling for 10 min.
All NMR experiments were performed at a field of 16.45 T in a Bruker Ascend 700 NB magnet fitted with a Bruker TCI prodigy 5 mm liquids cryoprobe and a Bruker AVANCE NEO console.
3 Results
The 13C solution NMR spectrum of C60 is shown in Fig. 1. The two side peaks are at Δδ1 = −12.6 ppb and Δδ2 = −20.0 ppb relative to the main 13C peak. In all measurements presented the widths of peaks (main and side peaks) at half-maximum height are between 0.128 Hz and 0.272 Hz, the bulk of measurements having line widths under 0.200 Hz. The integrated amplitudes of the side peaks, relative to the main 13C peak, are a1/a0 = 1.63 ± 0.15% and a2/a0 = 0.81 ± 0.08% respectively (see the ESI† for the fitting procedure). The ratio of the integrated amplitudes for the two side peaks is given by a1/a2 = 2.02 ± 0.01. Solutions of endofullerenes display an identical fine structure in their 13C NMR peaks, as shown in Fig. 2.The shifts of the side peaks relative to the main peak have a weak temperature-dependence, as shown in Fig. 3. The temperature-dependent shifts fit well to a linear model over the explored temperature range, of the form Δδi = Δδ0i + (dΔδi/dT)T with i ∈ {1,2}. The fit parameters for C60 and two endofullerenes are given in Table 1. The outer side peak has a stronger temperature dependence than the inner peak and is slightly more affected by the presence of an endohedral molecule.
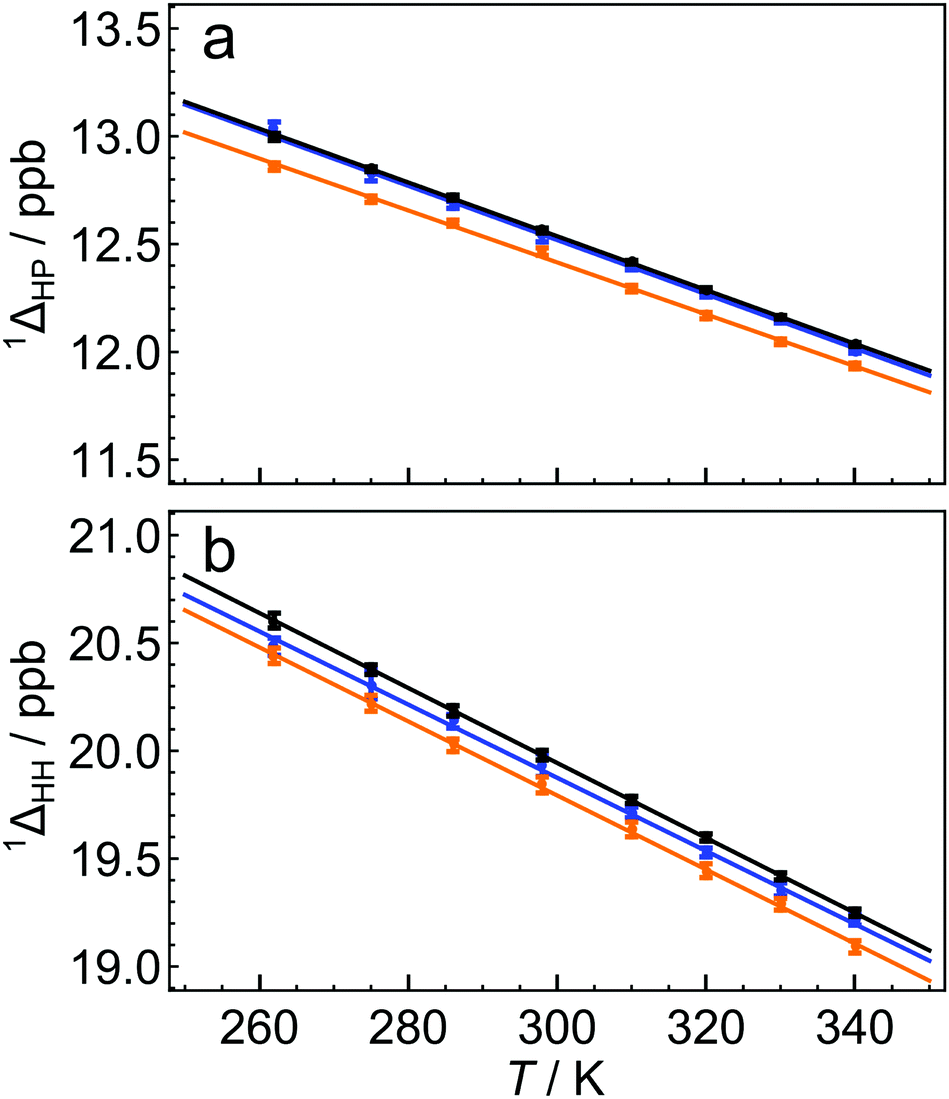 | ||
| Fig. 3 Temperature dependence of secondary 13C isotope shifts for C60 (black), H2@C60 (blue) and H2O@C60 (orange), for (a) HP the first side peak, and (b) HH the second side peak. The solid lines are best linear fits of the form 1Δ(T) = 1Δ0 + (d1Δ/dT)T, where the fit parameters are given in Table 1. The side peak shifts Δδ1 and Δδ2 are related to the isotope shifts by a sign change (see eqn (3)). | ||
| Parameter | C60 | H2@C60 | H2O@C60 |
|---|---|---|---|
| 1ΔHP(298 K)/ppb | 12.56 ± 0.01 | 12.54 ± 0.03 | 12.46 ± 0.02 |
| 1Δ0HP/ppb | 16.28 ± 0.05 | 16.29 ± 0.11 | 16.03 ± 0.06 |
| (d1ΔHP/dT)/10−3 ppb K−1 | −12.47 ± 0.15 | −12.56 ± 0.34 | −12.04 ± 0.20 |
| 1ΔHH(298 K)/ppb | 19.98 ± 0.02 | 19.93 ± 0.05 | 19.84 ± 0.04 |
| 1Δ0HH/ppb | 25.16 ± 0.10 | 24.96 ± 0.18 | 24.94 ± 0.14 |
| (d1ΔHH/dT)/10−3 ppb K−1 | −17.38 ± 0.30 | −16.96 ± 0.58 | −17.17 ± 0.44 |
Enrichment of C60 with 13C obscures the side peak structure. A 13C NMR spectrum of a solution of 20–30% 13C-enriched C60 in ODCB-d4 is shown in Fig. 4(b). Instead of two discrete side peaks, a relatively broad lineshape is observed with a width of about 40 ppb. The broad peak exhibits a distinct shoulder on the deshielding (“downfield”) side of the peak, at a chemical shift corresponding to the main 13C peak in natural-abundance C60 (see ESI† for chemical shift referencing).
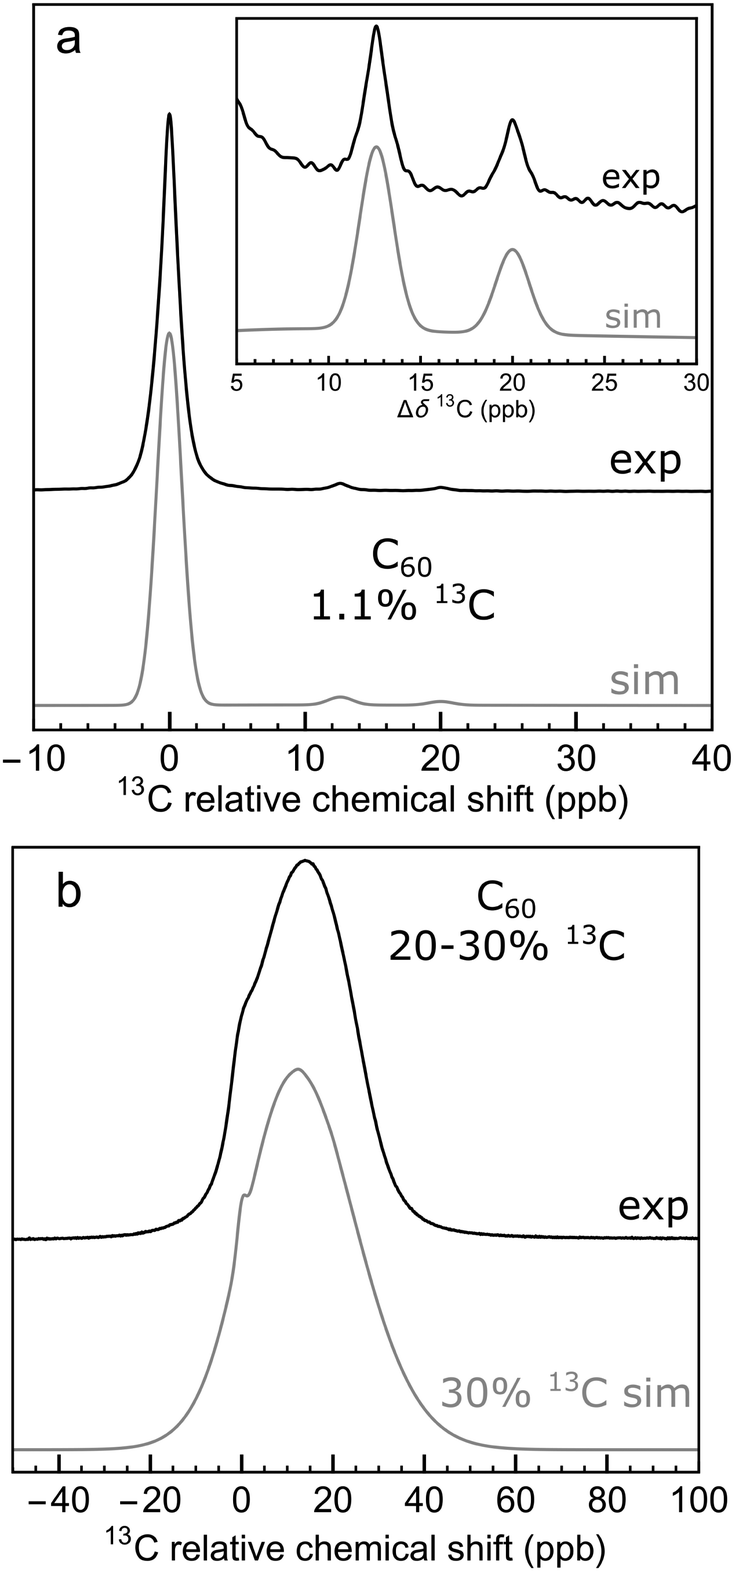 | ||
| Fig. 4 (a) 13C NMR spectrum of 25 mM solution of C60 in ODCB-d4 (sum of 856 transients); (b) 13C NMR spectrum of 20 mM of 13C-enriched C60 (20–30% 13C) in ODCB-d4 (sum of 16 transients). Spectra are taken at 16.45 T and 295 K. Black lines show experimental data. The grey lines show the results of Monte Carlo simulations using a 13C abundance of (a) 1.1% and (b) 30%. The horizontal axes depict the 13C chemical shift relative to that of the main C60 peak. | ||
The 13C relaxation time constants T1 were also measured (see ESI†). The 13C T1 of the natural-abundance C60 sample was determined to be 16.6 ± 0.3 s at a temperature of 295 K and magnetic field of 16.45 T. The 13C T1 of the 20–30% 13C-enriched sample was found to be slightly shorter under the same conditions (14.8 ± 0.2 s).
4 Discussion
4.1 Natural abundance spectra
The molecular structure of C60 is composed of sixty carbon atoms at the vertices of a truncated icosahedron (see Fig. 5). The carbon atoms are arranged in 20 hexagonal and 12 pentagonal rings. There are two distinct types of carbon–carbon bonds, with different bond lengths.15–18 There are 30 carbon–carbon bonds which are on the shared edges of two hexagons, and which are called here HH bonds.19,20 The HH bonds are significantly shorter than the 60 bonds which are shared between a hexagon and a pentagon, and which are called here HP bonds.19,20 | ||
| Fig. 5 Three isotopomers of C60, with the positions of 13C sites marked by a filled circle: (a) [13C1]-C60; (b) [HP-13C2]-C60; (c) [HH-13C2]-C60. The hexagonal and pentagonal carbon rings are marked. (d-f) Simulations of the associated 13C spectra at a magnetic field of 16.45 T, using artificial Lorentzian lineshapes and secondary isotope shifts taken from experiment (Fig. 1). The spectral amplitudes contributed by each 13C2 molecule is twice as large as for each 13C1 molecule. The 13C–13C J-coupling does not influence the spectra of the 13C2 isotopomers, since the 13C nuclei are in magnetically equivalent sites. | ||
The internuclear distances for the two bond types are estimated to be rHH = 139.5 ± 0.5 pm and rHP = 145.2 ± 0.2 pm, as determined by X-ray diffraction,15 gas-phase electron diffraction,16 solid-state NMR,17 and neutron diffraction.18
The structure of C60 provides a ready qualitative interpretation of the natural abundance 13C spectrum. The three species contributing most of the intensity to the natural abundance 13C spectrum are denoted [13C1]-C60, [HP-13C2]-C60, and [HH-13C2]-C60 (see Fig. 5). [13C1]-C60 molecules contain 13C sites with no immediate 13C neighbours, while [HP-13C2] −C60 and [HH-13C2]-C60 molecules contain 13C2 pairs separated by a HP bond and a HH bond respectively. On average, there are twice as many [HP-13C2]-C60 molecules as [HH-13C2]-C60 molecules, since there are twice as many HP bonds as HH bonds.
The [13C1]-C60 isotopomer contributes a single 13C peak to the 13C spectrum, at the main peak chemical shift (Fig. 5d). The 13C2 pairs in the [HP-13C2]-C60 and [HH-13C2]-C60 isotopomers also contribute a single peak each (see Fig. 5e and f), since the 13C sites are magnetically equivalent by symmetry. The 13C–13C J-coupling between magnetically equivalent spins has no direct spectral consequences in isotropic solution.21 The spectral contribution from each [HP-13C2]-C60 and [HH-13C2]-C60 molecule is twice as large as the contribution from each [13C1]-C60 molecule.
The frequencies of the [HP-13C2]-C60 and [HH-13C2]-C60 peaks are influenced by secondary isotope shifts. The substitution of a 12C nucleus by a more massive 13C nucleus modifies the vibrational wavefunctions of the molecule and influences the chemical shift of neighbouring 13C nuclei. The primary mechanism of secondary isotope shifts is as follows:3–7 The chemical shift of a nucleus depends on the molecular electronic wavefunction which is a function of internuclear distances; the distances between bonded atoms oscillate because of vibrational motions and, within the Born–Oppenheimer approximation, the electronic wavefunction adjusts rapidly to the changing positions of the nuclei. The observed chemical shift is an average over the internuclear distances explored by the nuclear vibrational wavefunction. However, nuclear vibrational wavefunctions depend on the nuclear mass; heavier nuclei possess wavefunctions which are more strongly localised towards the potential minimum of the vibrational coordinate whereas lighter nuclei explore a wider range of vibrational coordinates. If the vibration is anharmonic, the mean nuclear position also depends on the nuclear mass. Hence, one-bond isotope shifts depend on the frequency and anharmonicity of the relevant vibrational mode. Since the two types of bonds in C60 have different bond lengths and vibrational frequencies, it is not surprising that the associated isotope shifts are different as well. The experimental results indicate that the secondary isotope shift is larger for two 13C nuclei separated by the shorter HH bond, than when the nuclei are separated by the longer HP bond.
Unfortunately, the most widely used definition of the secondary isotope shift6 suffers from a counter-intuitive sign convention. Nevertheless, we persist with it in this article. The secondary isotope shift of a 13C site induced by swapping the “light” isotope LA of a neighbouring atom A with a “heavy” isotope HA is defined as follows:6
| 1Δ13C (A) = δ13C (LA) − δ13C (HA) | (1) |
The following condensed notation is introduced for the one-bond secondary isotope shifts in fullerenes:
| 1ΔHP = δ13C ([13C1]-C60) − δ13C ([HP-13C2]-C60) |
| 1ΔHH = δ13C ([13C1]-C60) − δ13C ([HH-13C2]-C60) | (2) |
The chemical shifts of the two side peaks, relative to the main 13C peaks, are therefore given by
| Δδ1 = −1ΔHP |
| Δδ2 = −1ΔHH | (3) |
The HP and HH peak assignments are shown in Fig. 1 and 5. The amplitudes of the two side peaks are in the ratio 2:1 since C60 contains twice as many HP bonds as HH bonds. This is in agreement with experiment.
The interpretation of the natural-abundance 13C spectrum of C60 therefore appears to be straightforward. The main 13C peak derives from 13C1 isotopomers of C60, while the two side peaks derive from the two types of 13C2 isotopomers, which have abundances in the ratio of 2:1. However, closer inspection reveals one small point that is not so easy to explain. The ratio of the integrated amplitude of the outer (HH) side peak to that of the main peak is observed to be a2/a0 = 0.81 ± 0.08%. What explains this intensity ratio? A naive theory runs as follows: The outer side peak is attributed solely to the [HH-13C2]-C60 isotopomer, and the main peak to the [13C1]-C60 isotopomer. Consider two neighbouring carbon sites in C60, separated by a HH bond. The probability of a carbon atom having a 13C nucleus is x, while the probability of the carbon having a 12C nucleus is 1 − x. The probability of either one of the two sites being 13C is therefore given by 2x(1 − x). Both 13C1 isotopomers contribute to the intensity of the main 13C peak. The probability of both sites being 13C, on the other hand, is x2. The 13C resonance of these 13C2 isotopomers is subject to the secondary isotope shift and hence they contribute to the intensity of the HH side peak. Since a 13C2 isotopomer contributes twice the spectral intensity of a 13C1 isotopomer, the amplitude ratio of the HH side peak to the main peak is predicted by this argument to be 2 × x2/2x(1 − x) = x/(1 − x). This is given approximately by x for small x. Since the natural abundance of 13C is x ≃ 1.1%, the predicted amplitude ratio is also 1.1%. However, this prediction is outside the confidence limits of the observed a2/a0 ratio, which is 0.81 ± 0.08%. The discrepancy is significant.
As shown below, a more sophisticated theory of the spectral structure is required to explain the observed intensity ratio of the side peaks to the main peak. Alternative combinatorial approach is given in the ESI.†
Fig. 3 shows that the isotope shifts 1ΔHP and 1ΔHH decrease as the temperature is increased. This may be attributed to the increased representation of excited vibrational states as the temperature is increased; excited vibrational wavefunctions are less influenced by the mass of the vibrating particles than the ground vibrational state.5 It is not fully understood why the HH bond exhibits a stronger temperature-dependence than the HP bond. This may be due to the fact that the HH bond is shorter than the HP bond and has a higher force constant. The vibrational excited states of the HH bond are therefore less accessible, causing an increase in temperature to have a proportionately higher effect on the populations of excited vibrational wavefunctions.
Fig. 3 and Table 1 show that the isotope shifts are slightly reduced in magnitude when an endohedral molecule is present. The larger the endohedral molecule, the larger the change in the isotope shift. The mechanism of this effect is currently unknown, but it may be associated with a modification of the C60 vibrational modes by the endohedral moiety, an effect which has been detected in Raman spectroscopy.22
4.2 13C-enriched fullerene and spectral simulations
The 13C NMR spectrum of 13C-enriched C60 is shown in Fig. 4(b) and displays a relatively broad lineshape with a shoulder on the deshielding side of the peak. The position of the shoulder coincides with the position of the main peak in natural abundance C60 (see ESI†).There is a small difference in the spin–lattice relaxation rate constants of the natural-abundance and 13C-enriched samples (see ESI†). This difference is presumably due to the role of 13C–13C dipole–dipole couplings. However, the small relaxation rate difference is insufficient to explain the spectral broadening in the 13C spectrum of 13C-enriched C60. The broad lineshape originates from coherent interactions, such as secondary isotope shifts and 13C–13C J-couplings.
A detailed understanding of this spectral structure presents a formidable theoretical and computational challenge. At an enrichment level of 30%, the most abundant isotopomers of C60 contain around 19 13C nuclei.25 An accurate simulation of even a single spin system of this size is at the very limit of current computational techniques. An accurate simulation would require the calculation of an astronomical number of such spectra, some of which involve much larger spin systems.
Nevertheless, the rather featureless lineshape in Fig. 4(b) indicates that a detailed lineshape analysis is unnecessary in this case. It is possible to achieve a reasonable qualitative understanding of the lineshape through a Monte Carlo technique aided by plausible approximations and assumptions.
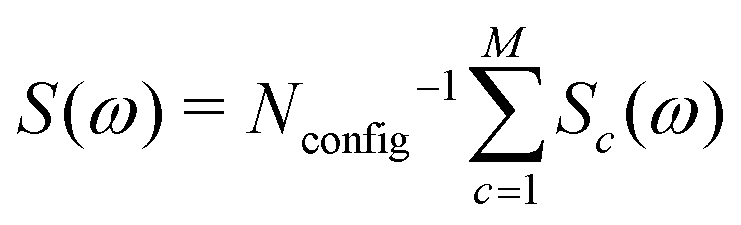
The simulation technique involves the following steps: (i) generation of a computer representation of an ensemble of 13C configurations, distributed according to the desired 13C abundance; (ii) identification of one or more distinct 13C clusters within each configuration; (iii) prediction of spin interaction parameters (chemical shifts and J-couplings) for each 13C cluster; (iv) calculation of the spectral lineshape for an individual 13C cluster with the predicted interaction parameters; (v) summation of the simulated lineshapes over all 13C clusters, leading to the total NMR spectrum:
 | (4) |
The details of the individual steps are as follows:
(1) Generation of an ensemble of 13C configurations. The atomic coordinates and bonding network for C60 are set up in the Mathematica symbolic software platform.26 A 13C or 12C nucleus is randomly assigned to each of the 60 carbon sites using a stochastic function with probability x for 13C and 1 − x for 12C. Typical calculations involve around Nconfig = 10000 random configurations. This is far smaller than the total number of possible configurations but sufficient to define the main features of the NMR spectrum.
(2) Identification of 13C clusters. The next step is to identify 13C clusters within each computer-generated configuration, by which we mean groups of 13C spins which interact sufficiently strongly with each other to be treated as distinct spin systems, while interactions between spins in different clusters are ignored. Quantum chemistry calculations on C60 have predicted that the JCC coupling between all pairs of 13C nuclei separated by more than 3 bonds are smaller than 1 Hz.23,24 Since 1 Hz corresponds to ∼6 ppb for 13C in a magnetic field of 16.45 T, which is smaller in magnitude than the one-bond secondary isotope shifts, we define a 13C cluster as follows: a set of 13C nuclei for which (i) each nucleus is connected to at least one other member of the cluster by no more than 3 bonds, and (ii) for which every nucleus is at least 4 bonds away from any 13C nuclei which are outside the cluster. For example, the configurations sketched in Fig. 6(a) and (b) each contain one 13C cluster (containing 3 and 4 13C nuclei respectively), while the configuration in Fig. 6(c) contains one cluster of 2 13C nuclei and a second cluster of 4 13C nuclei. Note that a cluster does not necessarily consist of 13C atoms which are directly bonded to each other. The number of 13C nuclei in an individual cluster c is denoted Nc.
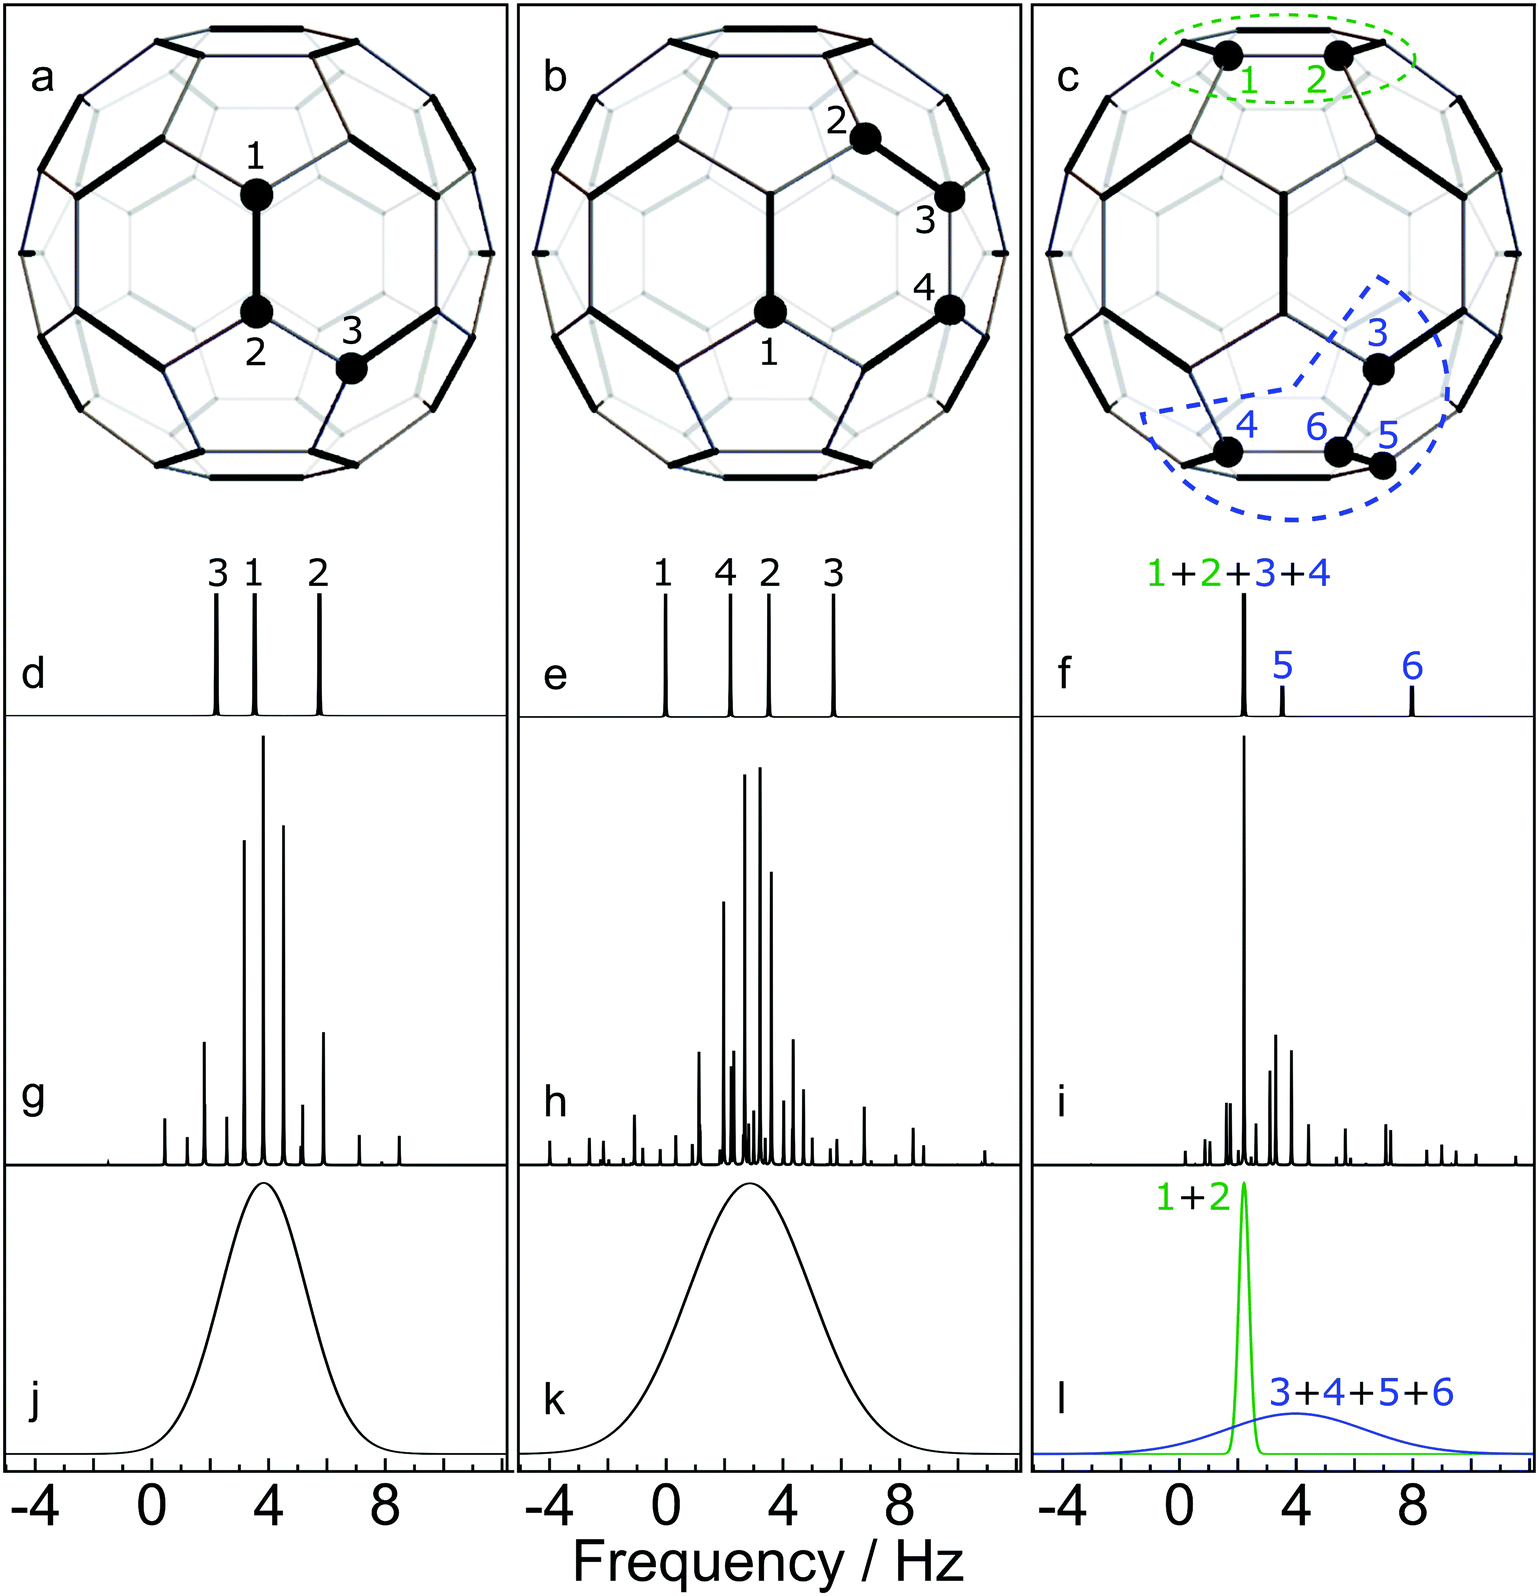 | ||
| Fig. 6 Simulated NMR spectra for three selected C60 configurations, at a magnetic field of 16.45 T. 13C nuclei are shown by filled circles. Cases (a) and (b) contain a single 13C cluster. Case (c) contains two 13C clusters. (d–f) Stick spectra showing the predicted 13C chemical shifts, perturbed by the one-bond secondary isotope shifts from neighbouring 13C nuclei; (g and h) Accurate spin dynamical computations of the NMR spectra, including the predicted chemical shifts and J-couplings from quantum chemistry calculations.23,24 (i)–(l) Approximate simulations of the NMR spectra for each cluster using eqn (7). All vertical scales are arbitrary. | ||
(3) Spin interaction parameters for a 13C cluster. Simulation of the NMR spectrum of a 13C cluster requires knowledge of the spin interaction parameters (chemical shifts and J-couplings). For the J-couplings between pairs of 13C in the cluster we use the results of published quantum chemistry calculations.24 For the chemical shifts, an additive model is assumed for the one-bond secondary isotope shifts. Suppose that a given 13C site i has nHP(i) 13C neighbours separated by a HP bond, where nHP(i) ∈ {0,1,2}, and nHH(i) 13C neighbours separated by a HH bond, where nHH(i) ∈ {0,1}. The total secondary isotope shift of the given 13C site is assumed to be given by
| 1Δi ≃ nHP(i)1ΔHP + nHH(i)1ΔHH | (5) |
The isotope shift of each 13C site i may be converted into a frequency shift relative to the main 13C peak by using the relationship
| Ωi = −1Δi × ω0 | (6) |
4. Spectral lineshape for a 13C cluster. Having identified a 13C cluster and estimated all chemical shifts and J-couplings, the next step is to simulate the 13C spectrum.
In the case of small cluster dimension Nc, it is possible to use accurate simulation techniques, such as those used in the SpinDynamica software package.27 Some results are shown in the middle row of Fig. 6. In each case the simulations show a complex spectrum containing many individual peaks.
Accurate simulations of this type are not feasible for large values of Nc, and in any case this level of spectral detail is unresolved in the experimental spectra of 13C-enriched C60. We therefore use an approximate expression for the 13C cluster spectrum Sc(ω), which derives from a moment analysis of the NMR spectrum, as described in the Appendix. The cluster spectrum is approximated by the following Gaussian function:
 | (7) |
 | (8) |
 | (9) |
Eqn (7) evaluates very rapidly even for large cluster dimension Nc.
Fig. 6 compares some cluster spectra simulations using eqn (7) (lower row) with exact spin-dynamical simulations (middle row). The approximate method omits the fine details of the spectra but represents the centre frequency and width of the cluster spectra accurately. The great advantage of this approximation technique is that it is computationally feasible for large numbers of clusters each containing many 13C nuclei, which is out of the question for accurate spin-dynamical techniques.
Eqn (8) predicts a zero-width Gaussian when all 13C nuclei in the cluster have identical chemical shifts (magnetic equivalence). A small empirical line-broadening term is included in this case, matching the experimental linewidth of the natural-abundance C60 peak.
The 13C NMR spectrum of C60 may therefore be treated approximately, for any 13C probability x, by generating a large number of configurations using a Monte Carlo method, and summing the cluster contributions to the spectrum according to
 | (10) |
Fig. 7(a) shows the result for x = 1.1%, which corresponds to the incidence of 13C at natural abundance. The two side peaks are just visible, and are seen more clearly in the expanded view of Fig. 4(a), where the simulated and experimental spectra are compared. The correspondence is good.
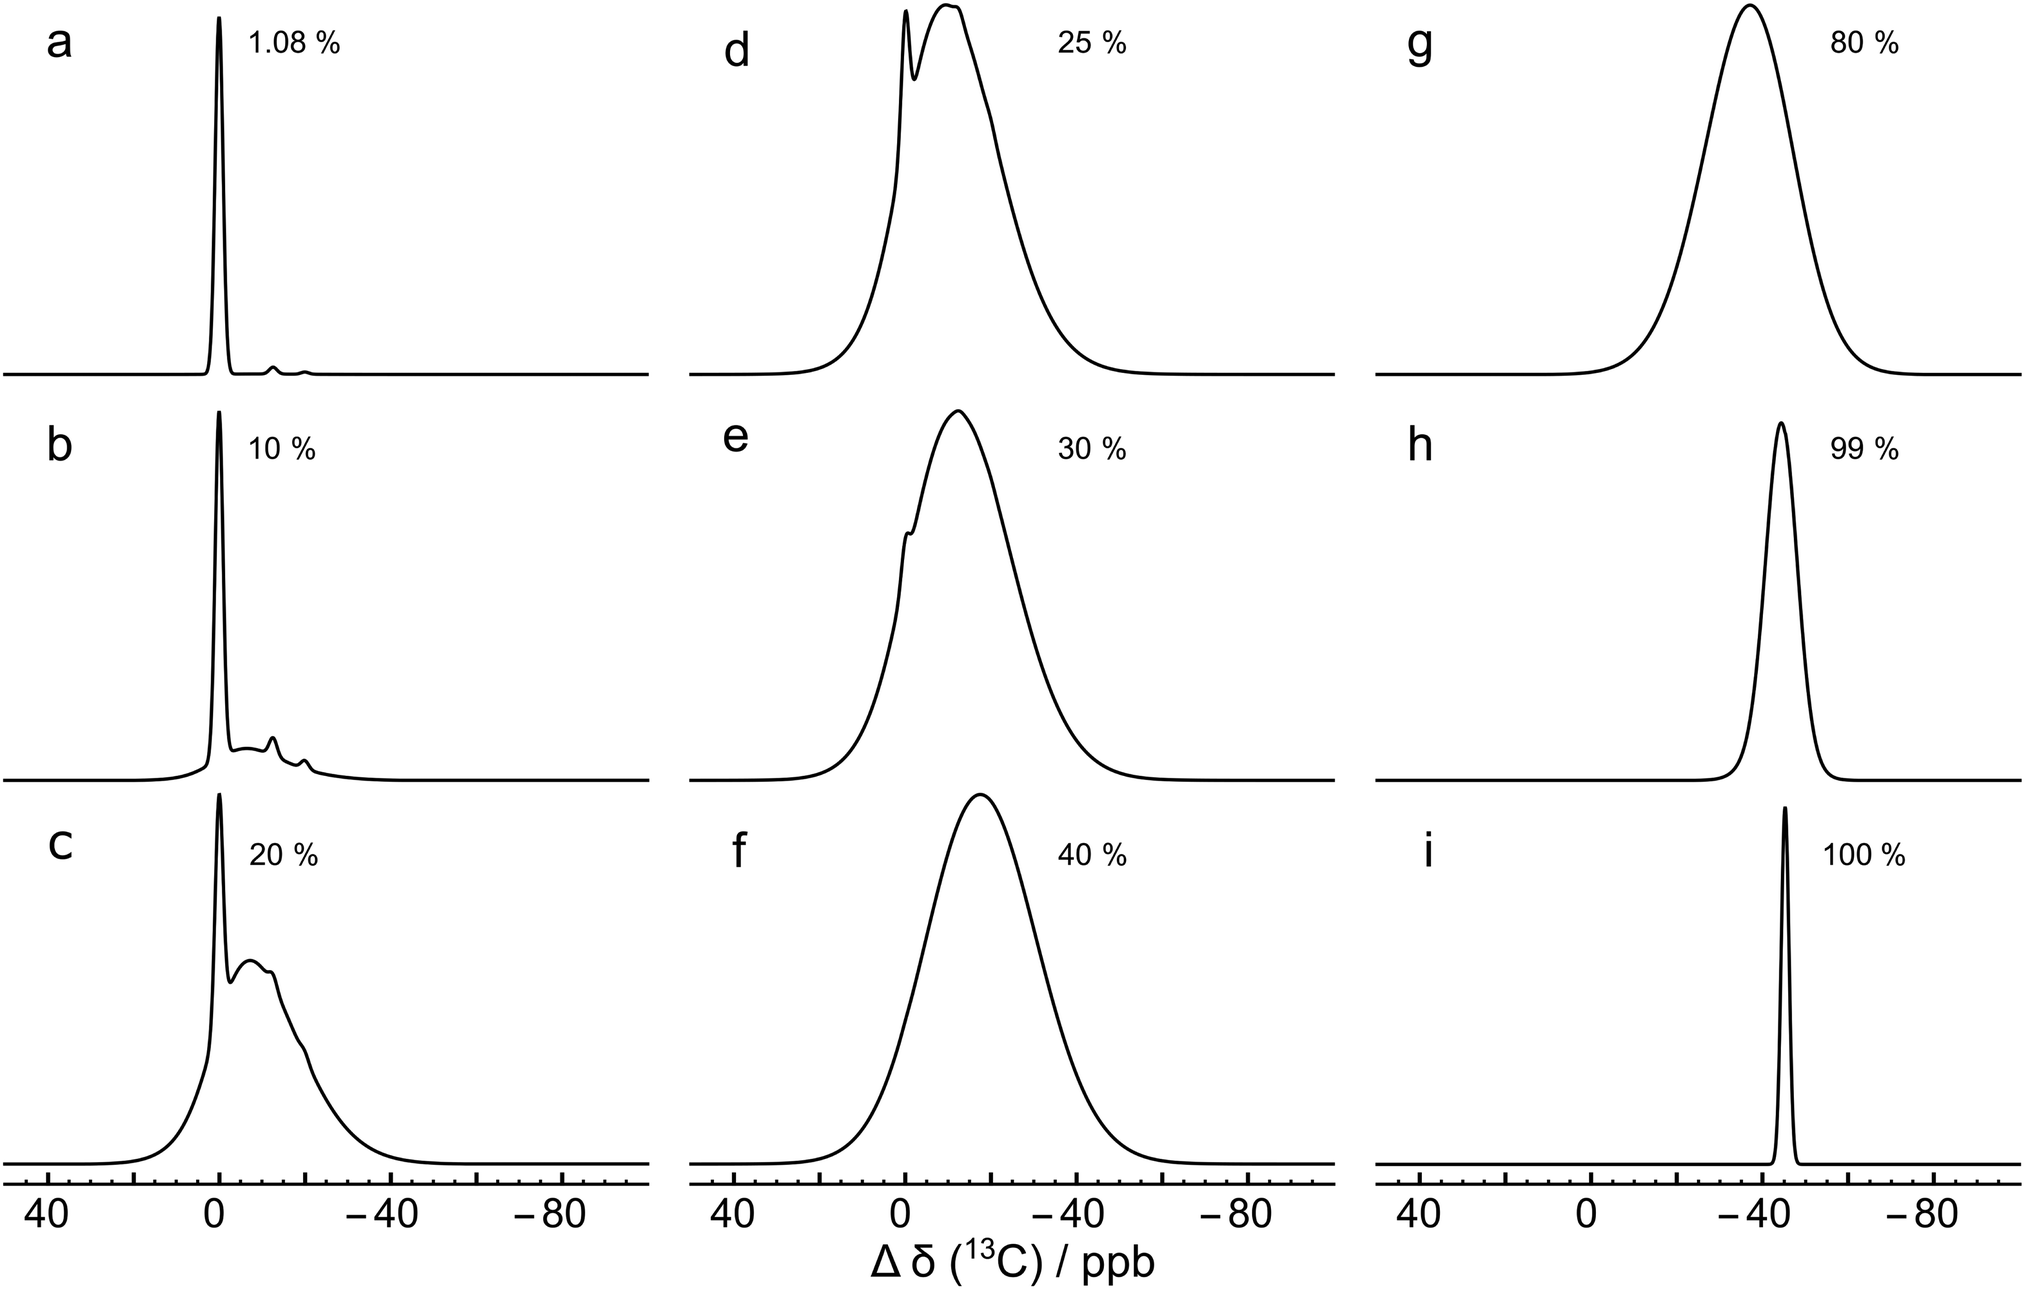 | ||
| Fig. 7 Monte Carlo simulations of the 13C NMR spectra of C60 with different values of the 13C probability x, using eqn (10), at a magnetic field of B0 = 16.45 T. Each simulation was performed by analyzing 10000 random C60 configurations. The spectra are normalised to the same peak height for clarity. Simulations for more values of x are shown in the ESI.† | ||
Why is the ratio between the main 13C peak and the second side peak not equal to x ≃ 1.1%, as expected by a naive argument (see above)? The cluster analysis explains this by considering the role of the random 13C occupancy of carbon sites which are 2 or 3 bonds away from the sites of interest. There are several ways to perform this analysis, all requiring care: the argument given below predicts the correct ratio using relatively few logical steps, but requires delicate reasoning. An alternative analysis is given the ESI,† this considers the relative abundances of C60 isotopomers containing up to three 13C nuclei, and provides an estimate of the peak ratio which is close, but not exactly equal, to the experimental ratio. The residual discrepancy is attributed to isotopomers with more than three 13C nuclei.
Consider the main 13C peak. This derives predominantly from isolated 13C nuclei. In the C60 structure, there are 3 carbon sites which are one bond away from a given site, 6 sites which are 2 bonds away, and 8 sites which are 3 bonds away. Assuming that a given carbon site is occupied by 13C, there is a probability of 14x ≃ 15% that at least one of the sites that are 2 or 3 bonds away are also occupied by 13C. The two 13C nuclei would, by the definition used in this article, belong to the same cluster. However, the spectral consequences of these additional 13C nuclei are minor, since the additional nuclei will (most likely) not have direct one-bond 13C neighbours themselves. Hence, the additional 13C nucleus does not experience a significant secondary isotope shift, and the cluster of two 13C nuclei has the same chemical shift as an isolated 13C nucleus, within the approximations used here. The amplitude of the 13C main peak is therefore largely unaffected by random pairs of 13C nuclei which are 2 or 3 carbon–carbon bonds distant from each other.
The situation is different for the 13C2 pairs that give rise to the side peaks. A 13C2 pair separated by a HH bond has 4 carbon sites which are one bond away, 8 sites which are 2 bonds away, and 8 sites which are 3 bonds away. There is a probability of 16x ≃ 18% that at least one of the sites that are 2 or 3 bonds away are also occupied by 13C. Unlike the case of isolated 13C nuclei, an additional 13C nucleus 2 or 3 bonds away has a large effect on the spectrum. The three 13C nuclei form a single cluster, which has a broadened and shifted spectrum, relative to the spectrum of the isolated 13C2 pair. This is because the additional 13C nucleus does not itself have a directly-bonded neighbouring 13C (except in rare circumstances), and therefore experiences a different secondary isotope shift to the directly-bonded 13C2 pair. Hence about 18% of the intensity of a given side peak is transferred into a broadened and shifted resonance. The result is a depletion in the intensity of the sharp side peak by ∼18%. This argument accounts accurately for the observed ratio in the relative intensities of the side peaks and the main peak in natural abundance C60.
This effect is seen more clearly in Fig. 7(b), which shows a simulation for a 13C probability of x = 10%. The broad resonance between the main peaks and the side peaks is obvious in this case.
Fig. 7 shows that as the 13C probability increases, the 13C spectrum broadens and shifts in the shielding direction, with a shoulder at the main peak position persisting up to about x = 30%. The shoulder is generated by 13C nuclei that have no directly bonded 13C partners themselves and which are also at least 3 bonds away from directly-bonded groups of 13C nuclei. A simulation for x = 30% matches the experimental spectrum of the 13C-enriched C60 well, as shown in Fig. 4(b). This is in agreement with the enrichment level determined by mass spectrometry, which is also x ∼ 30% (see ESI†).
Fig. 7 shows that the simulated spectra become narrower again when x exceeds 50%. This is because the isotope shifts of the 13C sites become more uniform when most carbon sites in C60 are occupied by 13C. In the extreme case of x = 100%, the simulated spectrum is very sharp, since all 13C sites have three 13C neighbours, and experience the same secondary isotope shift of 21ΔHP + 1ΔHH = 45.2 ppb. All sixty 13C nuclei are magnetically equivalent in this case.
5 Conclusion
The observation of a single, sharp 13C NMR peak for solutions of C60 is one of the strongest pieces of evidence for its highly symmetrical molecular structure.1 Our observations show that the solution-state 13C NMR of C60 also displays two small side peaks, in the intensity ratio of 2:1. We interpret the side peaks as the signals from 13C2 isotopomers, which are displaced from the main 13C peak by secondary isotope shifts. Two peaks arise since the C60 structure contains two types of carbon–carbon bonds, also in the incidence ratio of 2:1. Indeed the presence of two side peaks in the solution 13C spectrum of C60 proves the presence of two different types of C–C bonds – a fact which was originally established by X-ray diffraction,15 gas-phase electron diffraction,16 neutron diffraction18 and low-temperature solid-state NMR of 13C labelled material.17
13C side peaks of similar origin are also observed for other symmetrical molecular compounds, such as ferrocene.28
The secondary isotope shifts become smaller when the temperature is increased. The positions of the side peaks are also influenced by the presence of an endohedral molecule, with the magnitude of the perturbation roughly correlated with the size of the endohedral moiety.
The solution 13C NMR spectrum of 13C-enriched C60 is broader than that of the natural abundance material. We have developed an algorithm for the simulation of C60 NMR spectra at arbitrary levels of 13C enrichment. This uses a Monte Carlo approach, combined with a cluster identification algorithm, and an approximate spectral treatment based on a second moment analysis. This technique allows rapid approximate calculations of the NMR spectra of J-coupled spin clusters, even for large numbers of coupled spins, and might be adapted to other problems in solution and solid-state NMR. The simulations agree well with the experimental spectrum of the 13C-enriched sample. This analysis also explain why the outer side peak in natural-abundance C60 has an amplitude of 0.81% of the main peak, instead of the natural abundance ratio of 1.1%, which would be predicted by a naive argument.
We expect that the 13C NMR spectra of higher fullerenes such as C70 will also display additional spectral structure due to 13C2 isotopomers. In this case, more complex phenomena are anticipated since there are several groups of chemically inequivalent sites.
Conflicts of interest
There are no conflicts to declare.Appendix
Approximate NMR spectrum of J-coupled spin clusters
Consider a cluster c containing Nc J-coupled spins-1/2, with chemical shifts δi and J-couplings Jij, where i,j ∈ {1…N}. The rotating-frame spin Hamiltonian in isotropic solution is given by| H = HCS + HJ | (11) |
 | (12) |
| Ωi = −γB0(δi − δref) | (13) |
The Hamiltonian may be written as follows:
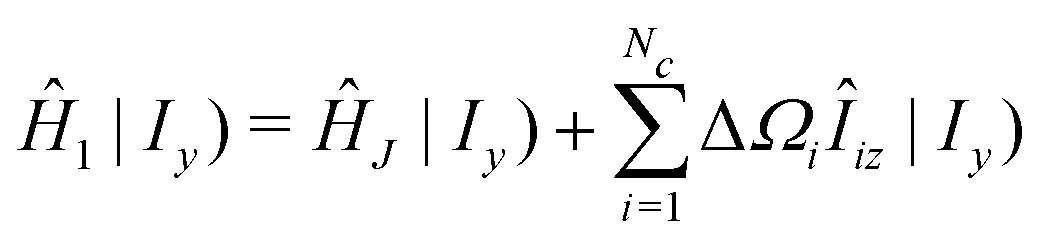
| H = H0 + H1 | (14) |
H0 = ![[capital Omega, Greek, macron]](https://www.rsc.org/images/entities/char_e0c0.gif) cIz cIz | (15) |
The term H1 is given by
 | (16) |
| ΔΩi = Ωi − c | (17) |
The NMR signal for the cluster (free-induction decay) is given by
| sc(t) = (Qobs|exp(−iĤt)ρ(0)) | (18) |
| (A|B) = Tr{A†B} | (19) |
Since the Hamiltonian terms H0 and H1 commute, the cluster NMR signal may be written
| sc(t) = (Qobsexp(+iĤ0t)|exp(−iĤ1t)ρ(0)) | (20) |
The spin density operator at the start of signal detection is denoted ρ(0) and the observable operator is denoted Qobs. In an ordinary single-pulse NMR experiment, using quadrature detection, it is convenient to define these operators as follows:21
| ρ(0) = −Iy |
| Qobs = −iI− | (21) |
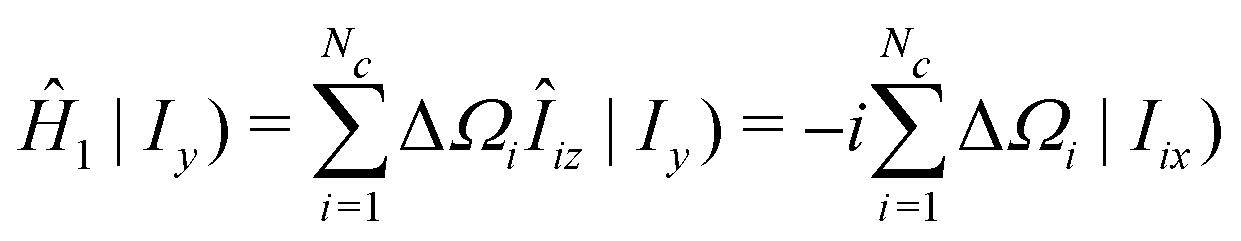
With this choice of observable operator the following commutation relationship holds:
| Ĥ0|Qobs) = −c|Qobs) | (22) |
| exp(−iĤ1t)|Qobs) = exp(+ict)|Qobs) | (23) |
This leads to the following expression for the cluster NMR signal:
| sc(t) = gc(t)exp(ict) | (24) |
| gc(t) = (Qobs|exp(−iĤ1t)ρ(0)) | (25) |
The NMR spectrum of the cluster is given by the one-sided Fourier transform of the NMR signal:
 | (26) |
Sc(ω) = Gc(ω − ![[capital Omega, Greek, macron]](https://www.rsc.org/images/entities/i_char_e0c0.gif) c) c) | (27) |
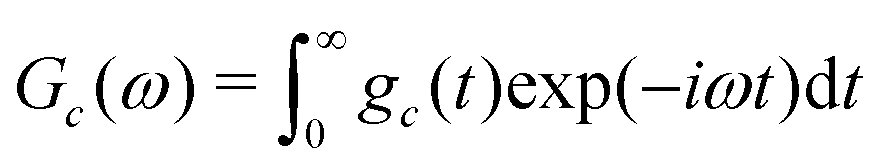 | (28) |
Eqn (27) shows that the cluster spectrum Sc(ω) may be derived from the function Gc(ω) by a simple frequency shift. The function Gc(ω) is centred around ω = 0, while the spectrum Sc(ω) is centered around the mean resonance offset c.
An approximate expression for Gc(ω) is developed by a moment analysis. The use of spectral moments is known to be a powerful technique in broad-line solid-state NMR,30 but has rarely been used for solution NMR. The nth moment M(n)c of the real part of the function Gc(ω) is defined as follows:
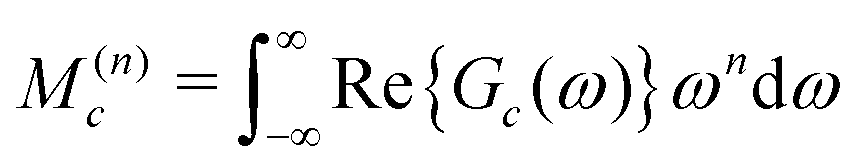 | (29) |
From the properties of the Fourier transform,31 the nth moment of the real part of the spectrum is proportional to the nth derivative of the time-domain signal at the time origin:
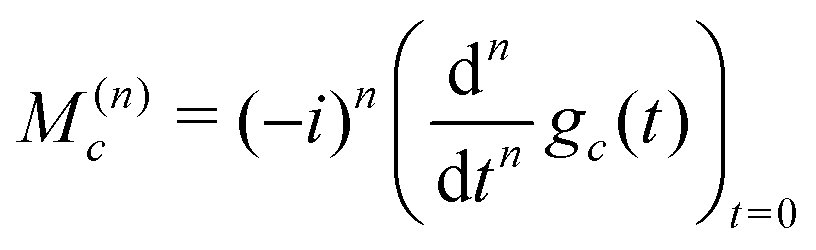 | (30) |
Repeated differentiation of eqn (25) leads to the expression
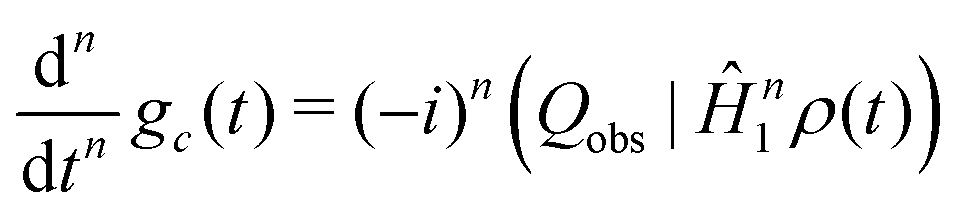 | (31) |
| M(n)c = −i(−1)n(I−|Ĥ1nIy) | (32) |
For example, the n = 0 moment, which is equal to the integral of the spectrum, evaluates to:
| M(0)c = −i(+i)(Iy|Iy) =Nc2Nc−2 | (33) |
The expression for the first moment of Gc(ω) involves the following terms:
 | (34) |
The first term vanishes since the J-coupling Hamiltonian commutes with the total angular momentum operator along an arbitrary axis:
| [Ii·Ij,Iiy + Ijy] = 0 | (35) |
The commutation properties of the angular momentum operators lead to the following expression for the second term:
 | (36) |
Hence the first spectral moment is given by
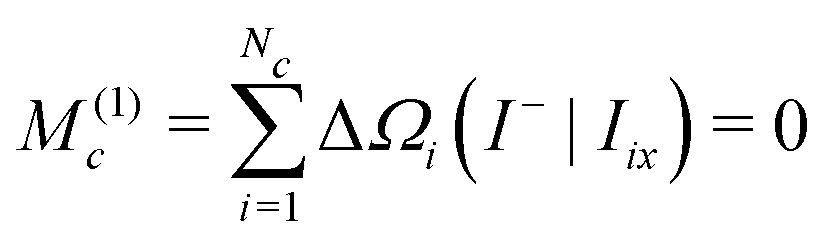 | (37) |
The first moment of Gc(ω) vanishes since each bracketed term is identical, and the sum of the resonance offsets, relative to the mean frequency of the cluster, is zero by definition:
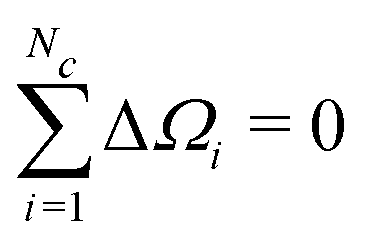 | (38) |
The second moment is conveniently evaluated by rearranging eqn (32) for n = 2:
| M(2)c = −i(I−Ĥ1|Ĥ1Iy) | (39) |
All terms involving the J-coupling term HJ vanish through the commutation relationship in eqn (35). This leads through eqn (36) to the expression
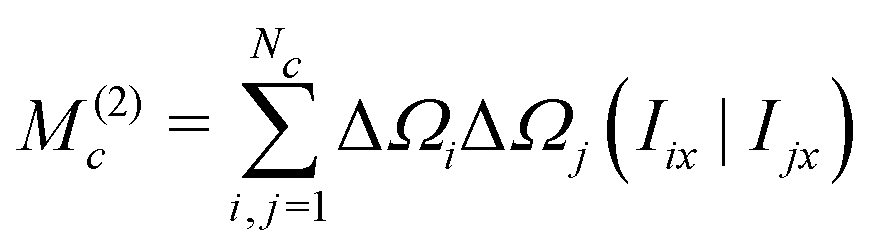 | (40) |
Since the angular momentum operators of different spins are orthogonal, we get
 | (41) |
The normalized second moment, defined as the ratio of the second and zeroth moments, is given by
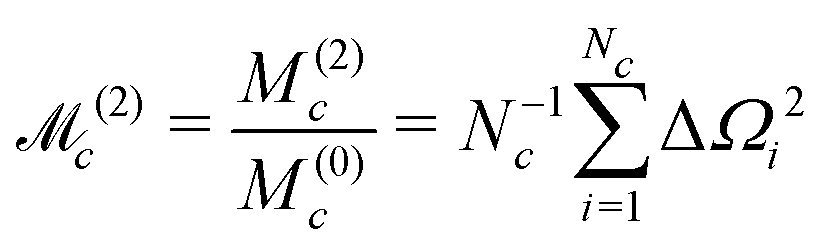 | (42) |
Note that the J-couplings do not appear in the expression for the second moment. The second moment of the NMR spectrum of a given J-coupled spin cluster may therefore be calculated extremely rapidly using only the chemical shift values for all spins in the cluster. The situation is different for the case of dipole–dipole coupled solids,30 since a commutation relationship of the type given in eqn (35) does not apply for the dipole–dipole Hamiltonian.
The algorithm used in this paper uses the following Gaussian function as an approximation to the function Gc(ω):
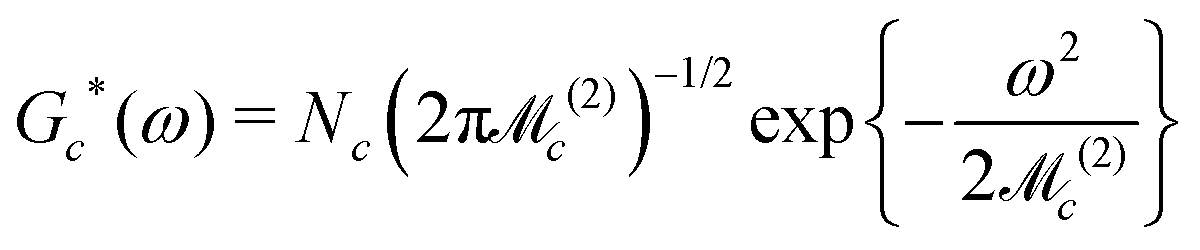 | (43) |
Acknowledgements
We thank Sally Bloodworth for experimental help. This research was supported by EPSRC (UK), grant codes EP/P009980/1, EP/P030491/1, EP/K00509X/1 and EP/T004320/1.References
- R. Taylor, J. P. Hare, A. K. Abdul-Sada and H. W. Kroto, J. Chem. Soc., Chem. Commun., 1990, 1423–1425 RSC.
- H. W. Kroto, A. W. Allaf and S. P. Balm, Chem. Rev., 1991, 91, 1213–1235 CrossRef CAS.
- H. Batiz-Hernandez and R. A. Bernheim, Prog. Nucl. Magn. Reson. Spectrosc., 1967, 3, 63–85 CrossRef CAS.
- W. T. Raynes, A. M. Davies and D. B. Cook, Mol. Phys., 1971, 21, 123–133 CrossRef CAS.
- C. J. Jameson, J. Chem. Phys., 1977, 66, 4983–4988 CrossRef CAS.
- P. E. Hansen, Prog. Nucl. Magn. Reson. Spectrosc., 1988, 20, 207–255 CrossRef CAS.
- M. Saunders, K. E. Laidig and M. Wolfsberg, J. Am. Chem. Soc., 1989, 111, 8989–8994 CrossRef CAS.
- P. Vujanić, Z. Meić and D. Vikić-Topić, Spectrosc. Lett., 1995, 28, 395–405 CrossRef.
- W. H. Sikorski, A. W. Sanders and H. J. Reich, Magn. Reson. Chem., 1998, 36, S118–S124 CrossRef CAS.
- K. Komatsu, M. Murata and Y. Murata, Science, 2005, 307, 238–240 CrossRef CAS PubMed.
- K. Kurotobi and Y. Murata, Science, 2011, 333, 613–616 CrossRef CAS PubMed.
- A. Krachmalnicoff, M. H. Levitt and R. J. Whitby, Chem. Commun., 2014, 50, 13037–13040 RSC.
- A. Krachmalnicoff, R. Bounds, S. Mamone, S. Alom, M. Concistrè, B. Meier, K. Kouřil, M. E. Light, M. R. Johnson, S. Rols, A. J. Horsewill, A. Shugai, U. Nagel, T. Rõõm, M. Carravetta, M. H. Levitt and R. J. Whitby, Nat. Chem., 2016, 8, 953–957 CrossRef CAS PubMed.
- S. Bloodworth, G. Sitinova, S. Alom, S. Vidal, G. R. Bacanu, S. J. Elliott, M. E. Light, J. M. Herniman, G. J. Langley, M. H. Levitt and R. J. Whitby, Angew. Chem., Int. Ed., 2019, 58, 5038–5043 CrossRef CAS PubMed.
- W. I. F. David, R. M. Ibberson, J. C. Matthewman, K. Prassides, T. J. S. Dennis, J. P. Hare, H. W. Kroto, R. Taylor and D. R. M. Walton, Nature, 1991, 353, 147–149 CrossRef CAS.
- K. Hedberg, L. Hedberg, D. S. Bethune, C. A. Brown, H. C. Dorn, R. D. Johnson and M. D. Vries, Science, 1991, 254, 410–412 CrossRef CAS PubMed.
- C. S. Yannoni, P. P. Bernier, D. S. Bethune, G. Meijer and J. R. Salem, J. Am. Chem. Soc., 1991, 113, 3190–3192 CrossRef CAS.
- F. Leclercq, P. Damay, M. Foukani, P. Chieux, M. C. Bellissent-Funel, A. Rassat and C. Fabre, Phys. Rev. B: Condens. Matter Mater. Phys., 1993, 48, 2748–2758 CrossRef CAS PubMed.
- B. Masenelli, F. Tournus, P. Mélinon, A. Pérez and X. Blase, J. Chem. Phys., 2002, 117, 10627–10634 CrossRef CAS.
- S. Díaz-Tendero, F. Martín and M. Alcamí, Comput. Mater. Sci., 2006, 35, 203–209 CrossRef.
- M. H. Levitt, Spin Dynamics. Basics of Nuclear Magnetic Resonance, Wiley, Chichester, 2nd edn, 2007 Search PubMed.
- F. Cimpoesu, S. Ito, H. Shimotani, H. Takagi and N. Dragoe, Phys. Chem. Chem. Phys., 2011, 13, 9609–9615 RSC.
- M. Jaszuński, K. Ruud and T. Helgaker, Mol. Phys., 2003, 101, 1997–2002 CrossRef.
- L. B. Krivdin and R. H. Contreras, Annual Reports on NMR Spectroscopy, Academic Press, 2007, vol. 61, pp. 133–245 Search PubMed.
- M. S. Dresselhaus, G. Dresselhaus and P. C. Eklund, Science of Fullerenes and Carbon Nanotubes, Academic Press, New York, 1996 Search PubMed.
- S. Wolfram, Mathematica: A System for Doing Mathematics by Computer, Addison-Wesley, New York, 1991 Search PubMed.
- C. Bengs and M. H. Levitt, Magn. Reson. Chem., 2018, 56, 374–414 CrossRef CAS PubMed.
- P. S. Nielsen, R. S. Hansen and H. J. Jakobsen, J. Organomet. Chem., 1976, 114, 145–155 CrossRef CAS.
- J. Jeener, Advances in Magnetic and Optical Resonance, Academic Press, 1982, vol. 10, pp. 1–51 Search PubMed.
- M. Mehring, High Resolution NMR Spectroscopy in Solids, Springer-Verlag, Berlin Heidelberg, 1976 Search PubMed.
- R. N. Bracewell, The Fourier Transform and Its Applications, McGraw Hill, New Delhi, 3rd edn, 2014 Search PubMed.
Footnote |
| † Electronic supplementary information (ESI) available: Fitting procedure, spin–lattice relaxation, chemical shift referencing, mass spectrometry. See DOI: 10.1039/d0cp01282c |
| This journal is © the Owner Societies 2020 |