 Open Access Article
Creative Commons Attribution 3.0 Unported Licence
Screening of highly charged ions in an ionic liquid; when will ion pairs form?†
Ruth M.
Lynden-Bell

Department of Chemistry, University of Cambridge, Cambridge, UK. E-mail: rmlb@cam.ac.uk; Fax: +1 (0)44 1223 336362; Tel: +1 (0)44 1223 336535
First published on 29th April 2020
Abstract
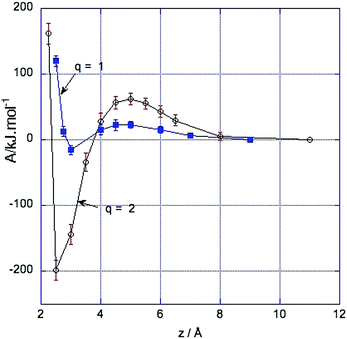
The properties of pairs of doubly charged solute ions are studied as a function of their separation in the ionic liquid, dimethylimidazolium chloride ([dmim][Cl]). Free energy (potential of mean force) profiles show that, as for singly charged ions, there is a barrier to oppositely charged ion pairs forming a contact ion pair. However for doubly charged ions this barrier is about twice as large (45 ± 10 kJ mol−1 rather than 20 ± 5 kJ mol−1). Contact ion pairs form when the short range repulsive force balances the direct interaction plus the screening force, and hence depend on the sizes of the solute ions. In order to understand the existence of the barrier and the extent of screening, local charge density distributions and various contributions to the energetics were examined. The barrier arises when the decrease in stabilisation of individual ions by their own solvation shells is balanced by the increase in other screening effects and the direct solute–solute interaction.
1 Introduction
For the last decade or more there has been considerable interest in the use of ionic liquids as solvents for chemical synthesis1 and atomistic simulation has proved to be helpful in understanding the interactions between the solvent ionic liquid and the reacting species (solutes).2–4 For most reactions the mechanism in an ionic liquid is found to be similar to that in a polar liquid, but Welton and co-workers5 found a different pathway for the SN2 reaction between charged solutes in an ionic liquid compared to that in molecular solvents. This they identified as a true ionic liquid effect. Following this I used atomistic simulation to investigate the free energy profile, energetics and local liquid structure for a model system of two spherical ions at different separations in an ionic liquid. That work4 showed that the ionic liquid provided effective screening of the solutes until they were quite close where they formed a contact ion pair. There was a small barrier in the free energy profile hindering the approach to this state. In that study the ionic liquid the ions had charges of ±1; the anion was Cl− and the cation was N,N′-dimethylimidazolium chloride ([dmim][Cl]). The two solute ions were the same size as the anion, but with charges of +1 and −1. An interesting question is whether doubly charged solute ions in an ionic liquid with singly charged solvent ions would behave in the same way, or whether the behaviour would be similar to a pair of singly charged solute ions in a zero charged solvent (a molecular solvent). In this work we study a pair of doubly charged solute ions in the same [dmim][Cl] ionic liquid used before.4 We find that the behaviour is similar to the system of singly charged solute ions studied previously4 except that the increased charges mean that the interactions are stronger. This leads to a higher free energy barrier and greater solvent structure around the ions.The ionic liquid environment is, in many ways, very different from that of an aqueous electrolyte. This is illustrated by the values of the two lengths often used in discussions of electrolytes. The value of the Debye screening length in the ionic liquid [dmim][Cl] at the temperature and density of the simulation is 0.016 nm while the Bjerrum length is 33.4 nm. This shows that in the Debye screening model screening would occur on a short length scale relative to the intermolecular separation (≈0.4 nm) while the energy of a pair of ions equals kT at the Bjerrum distance which is much greater than the separation. We shall see that charged solutes are well screened by the ionic liquid.
2 Methods
Using a modified version of the package DL_POLY,6 simulations were carried out on a cubic box containing 192 [dmim][Cl] (N,N′-dimethylimidazolium chloride) ion pairs and two spherical charged solutes, C and D, with charges +2e and −2e respectively, and Lennard-Jones interaction with σ = 3.49 Å and ε = 1.009 kJ mol−1. A NVT ensemble was used with cubic periodic boundary conditions and a fixed box size of (34.4 Å)3. As a high temperature must be used to ensure the ionic liquid remains liquid, a temperature of 500 K was maintained by a Berendsen thermostat with relaxation time of 0.01 ps. The electrostatic interactions were treated with an Ewald summation with precision 10−5 (α = 0.199 Å−1, kmax = 7). The program was modified to output the difference of total forces on these solutes acting along the line of centres between them at regular intervals, and to output the average energy of interaction of each species with its surroundings. In some runs the distance between the solute ions was maintained by a corrector step after each time step., while in others the freeze option was used. No difference was found between these two methods. A time step of 2 fs was used. Because the system may have a net dipole moment if screening is incomplete the Yeh–Berkowitz correction for periodic boundaries was applied.7 This was found to make small differences to the forces and energies, but the qualitative results for the free energies and energies were unaffected.Apart from the increased charges on the solute ions (±2e rather than ±1e) the force field parameters were the same as in our earlier work.4 As in that work the size and Lennard-Jones parameters of the solute ions were the same as used in much of our earlier work on single ions,8–11 while the ionic liquid was modelled by the force field of Hanke, Price and Lynden-Bell.12 The force field parameters are given in ESI.†
Simulations were carried out at a series of fixed separations z of the solute ions for several runs of 1 ns, and the average force along the line of centres between them, ΔFCD(z) = (FC − FD)·![[r with combining circumflex]](https://www.rsc.org/images/entities/i_char_0072_0302.gif) CD determined at each separation. The free energy profile A(z) was then found by integration of this force using
CD determined at each separation. The free energy profile A(z) was then found by integration of this force using
 | (1) |
3 Results
3.1 Free energy profile
Fig. 1 shows the changes in free energy of two oppositely charged ions as a function of the distance between them. The free energy profiles of pairs of ions with charges q = ±2e and q = ±1e are shown. The results for pairs of ions with charges ±1 are taken from our earlier work.4 In both cases at large distances the free energy is constant, rising to a barrier at a separation of about 4.5 Å, although the barrier is significantly higher for a ±2 pair than a ±1 pair, being 45 ± 10 kJ mol−1 (≈11kT) for the former and 20 ± 5 kJ mol−1 (≈4.5kT) for the latter. At sufficiently large distances the ions are completely screened by their solvation shells and do not interact. As the distance between the ions is decreased the free energy initially increases, but at short distances it decreases rapidly as screening is no longer complete. This initial increase followed by the steep decrease gives rise to a barrier at about 4.5 Å.Near contact, the short range repulsive forces overcome the electrostatic interaction to give sharp minima, corresponding to contact ion pairs. The depth and position of these minima are depend on the ion size which determines the short range repulsive forces. In neither case are there minima corresponding to solvent-separated ion pairs. For an isolated pair of ions C2+ and D2− with the interaction parameters given above, the repulsive force from the Lennard-Jones term balances the attractive force due to the electrostatic term when z = 2.54 Å while for singly charged pair of ions the two terms balance at 2.88 Å.
This profile is the main result of this paper; the rest of the paper is directed towards understanding the screening between the ions and the existence of a barrier.
3.2 Energetics and screening
The free energy profile A(z) as a function of the separation z between the two solute ions is made up of energetic and entropic terms.| A(z) − A(z0) = [U(z) − U(z0)] − T[S(z) − S(z0)]. | (2) |
| Uel,dir(z) = −(q2/z) × (e2/(4πε0)), | (3) |
 | (4) |
The latter two terms give the solvation energy, that is the difference in energy of the system due to the presence of the ionic liquid.
The Born model with a infinitesimal shell of compensating charge is obviously an oversimplification. And the solvent response is only approximately linear. We shall see in the next section that the solvation shells have a thickness which is different for positive and negative solute ions. In earlier work as part of a study on the applicability of Marcus theory to redox reactions in ionic liquids we obtained data on the linearity of the solvent response to changes in the ion charge of a single solute ions and to changes in its size in two ionic liquids and a polar liquid. One of the two ionic liquids was [dmim][Cl]. The reference Lennard-Jones parameters for the solute ions was the same as used here, that is the same as the model Cl− ion.8,9,16 The solvent response was approximately linear, with significant deviations at high charges (see for example Fig. 1 of ref. 8). There is a difference in the slopes for positive and negative ions which can be attributed to a difference in the radius of the solvation shells formed by Cl− and [dmim]+.
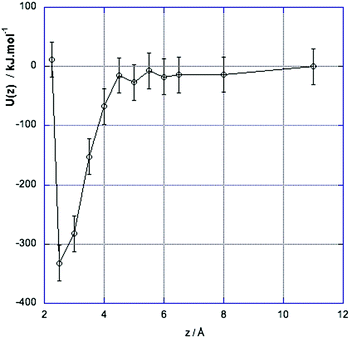
Fig. 2 shows the changes in the interaction energy, U(z), shifted to zero at z = 11 Å. This plot shows that when the charged solutes are more than about 4.5–5 Å apart the solvation energy balances the direct interaction and the solutes are well screened from each other. At shorter distances the interaction energy decreases rapidly as the direct electrostatic energy overcomes the solvation energy, until at sufficiently short separations the Lennard-Jones repulsion comes into effect, leading to minima in energy and free energy corresponding to the formation of a contact ion pair. The difference between the curves for free energy A(z) (Fig. 1) and U(z) (Fig. 2) contains both entropic terms and non-linear terms in the energy of polarisation of the solvent.
3.3 Solvation shells and local structure
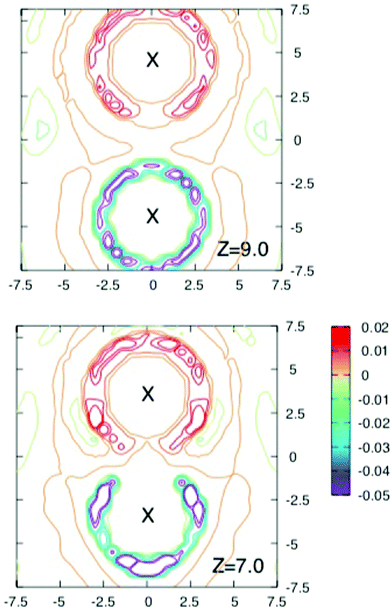
To obtain more insight into the source of the barrier and the extent of screening the interaction energy of the ions with their solvation shells and the average local charge distribution around the solute ion pair were investigated in a series of runs where configurations were stored every 40 fs for further analysis.Fig. 3 and 4 shows contours of charge density around the solute ion pair with various separations. When z = 9 Å each ion has an oppositely charged spherical solvation shell. At such large distances the results in Fig. 2 show that the ions are screened from each other. At shorter separations the shells become distorted (as shown for z = 7 Å) until they coalesce at the shortest separations and the screening energy is lower.
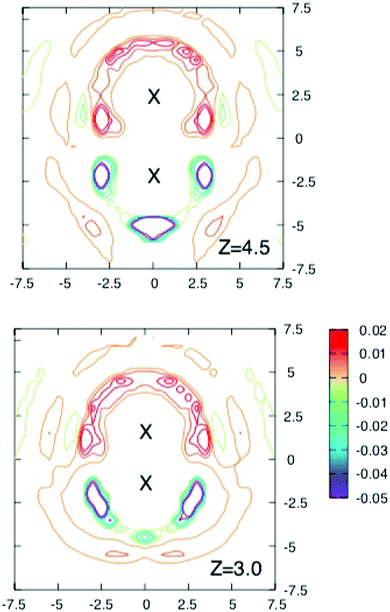 | ||
| Fig. 4 Cross sections through the three dimensional charge densities around ions separated by 4.5 Å (above) and 3 Å (below). Contours are drawn as in Fig. 3. Note how the solvation shells which are spherical for the largest separation in Fig. 3 and become distorted and gradually coalesce as the separation decreases. Although the free energy barrier occurs near z = 4.5 Å, there is no obvious change in the charge density at this separation. | ||
The initial increase in A(z) as the ions approach does not show up in the plot of screening energy shown in Fig. 2. It is possible that it is due to an decrease in entropy of solvation but we would expect an increase in entropy as the solvation shells become less ordered. However there is uncertainty in the values of the solvation energy due to the linear approximation used for the solvent–solvent energy, as well as uncertainty in the energetic measurements. A possible explanation for the initial rise in free energy is that as the separation decreases, the distortion of the solvation shells decreases the magnitude of the solute ion interaction with its own shell. At closer separations the interactions of each ion with the other ion and its solvation shell become more important. Although at large distances each solute ion is completely screened by its shell, as these are distorted the screening is less complete and the solute–solute energy becomes more negative.
The maximum in the free energy profile occurs at a separation of about 4.5 Å, where the shells have joined and become more localised. However as the upper panel in Fig. 4 shows, there is nothing particular to indicate that there is a barrier at this separation. The lower panel of this figure shows the charge density around a contact ion pair. Here the ions each have half shells which still provide significant shielding (about 171 kJ mol−1).
It should be noted that the charge in the first solvation shell, which is clearly seen in these figures, overcompensates the charge on the solute ion. For example the first shell of the positive ion with charge q = 2 contains on average 5.3 chloride ions from the solvent and even when the solute ions are in contact there are 4 such ions. This overcompensation leads to successive solvation shells with alternating charge.8,9
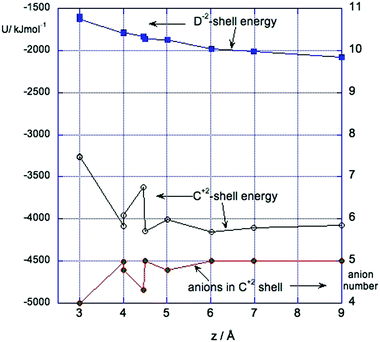
Fig. 5 shows the energy of interaction of the positive solute (C2+) and the negative solute (D2−) with their respective first solvation shells (up to 4.5 Å). Note that where the solvation shells overlap, they are divided into C and D parts by the plane bisecting the CD vector. In both cases the solvation energy is most negative at long distances where the solvation shells are intact, and decreases as the shells are disrupted. The interaction energy of the positive solute with its shell is about twice as large as that of the negative solute. This is not surprising as the ionic liquid anion in these simulations is much smaller than the cation. The bottom curve in this figure shows the average numbers of anions in the shell of the positive solute during runs of 1 ns which ranges from 5 for separated solutes to 4 near contact. The fluctuations in the energy of the positive solute at separations between 4 Å and 5 Å are the results of changes in the number of anions in the first solvation shell. This is discussed further in Section 3.4.
3.4 Evidence for two solvation states
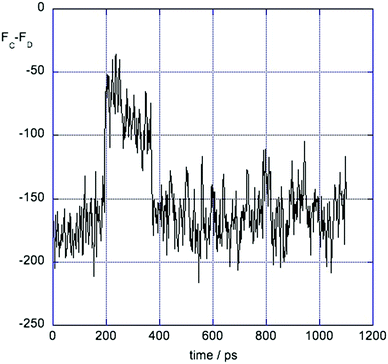
At some separations – in particular z = 4 Å and z = 4.5 Å, the force ΔFCD shows two types of fluctuation. An example is shown in Fig. 6. There are small rapid fluctuations about a mean and occasional large changes in this mean. Examination of snapshots from the simulation showed that these correspond to two states of local solvation of the positive solute at this separation. In the state with more negative force the first solvation shell of the positive solute contained 4 Cl− ions while the states with the less negative value for the force was better screened and had 5 Cl− in its first shell. At shorter distances the first shell of the positive solute contains 4 Cl− ions, while at larger distances it had 5 Cl− ions.3.5 Comparison with q = ±1 ion pair
In our earlier work4 we investigated the free energy profile of singly charged two solute ions approaching each other in [dmim][Cl]. We found that for a solute pair with charges ±1 there was a free energy barrier at about 4.5 Å and a contact minimum. Although the results for a ±2 pair are similar there are important differences. The free energy barrier is higher and the contact minimum lower (see Fig. 1). This is not surprising as the solute–solute electrostatic interaction is four times greater and the solute–ionic liquid ion electrostatic interaction is twice as large. The barrier is slightly more than twice as large (≈45 kJ mol−1 as opposed to ≈20 kJ mol−1). The depth of the contact minimum is significantly lower for the ±2 pair than for the ±1 pair and it is at a shorter distance. Comparing the solvation shells in the two cases, the maximum charge in the first shells of the solute ions is larger in magnitude in the ±2 example than in the ±1 example.4 Discussion
The number of ion pairs formed depends on the concentrations of the solute ions and on depth of the contact minimum in the free energy profile. This minimum occurs where the force due to the electrostatic attraction between the two partially screened solute ions is balanced by the short range repulsive forces between the ions in contact, which in this model lies at a separation of about 2.5 Å. However the solute ions in these calculations are not large; larger solute molecular ions would not be able to approach closely enough before the repulsive forces between them balanced the electrostatic attraction, leading to a shallower minimum (or even no minimum), and so fewer ion pairs. Ion pairs would only form in this model if the solutes could approach more closely than 3.8 Å where the interaction free energy becomes negative. A comparable solution of solutes with ±1 charges would have fewer ion pairs as the free energy minimum would be smaller.The system being studied by Welton and co-workers17 comprises a charge transfer salt with a large solute cation with two delocalised charges and a doubly charged anion. Preliminary results18 for such a salt in 1-hexyl-3-methylimidazolium trifluoroacetate suggest that there are few if any ion pairs. The anion was tetrathiosquarate ((CS)42−). The crystal structure of salts containing this ion have been determined by Beck et al. (ref. 19) to give an ion diameter of approximately 9 Å. From Fig. 1 it can be seen that in [dmim][Cl] an ion of this size would not approach a cation closely enough to form an ion pair.
The existence of a barrier to formation of ion pairs does not affect the equilibrium numbers, but could slow down any reaction. However most reactions (e.g. SN2 substitutions), have high reaction barriers, which would make the solvation barrier unimportant. However it is the existence of this barrier which prevents the interaction free energy decreasing monotonically as the ions approach each other and allow us to say that there are no ion pairs unless the separation is less than the critical separation where the free energy curve changes sign – in this case 3.8 Å.
5 Conclusion
We conclude that ionic liquids provide very effective electrostatic screening between charged solute molecules, whether singly charged or doubly charged. The simulations described in this paper suggest that the observed lack of ion pairs in the experimental study is due to the small electrostatic attraction at contact. Although our model system would have ion pairs, if the solutes were larger this would not be true.Conflicts of interest
There are no conflicts of interest to declare.Acknowledgements
I thank Tom Welton and Paricia Hunt for useful discussions and for suggesting this investigation and a referee for pointing out the importance of using the Yeh Berkowitz correction.Notes and references
- J. Hallett and T. Welton, Chem. Rev., 2011, 111, 3508–3576 CrossRef CAS PubMed.
- G. M. Arantes and M. C. C. Ribeiro, J. Chem. Phys., 2008, 128, 114503 CrossRef.
- W. Zhao, F. Leroy, B. Heggen, S. Zahn, B. Kirchner, S. Balasubramanian and F. Mueller-Plathe, J. Am. Chem. Soc., 2009, 131, 15825–15833 CrossRef CAS.
- R. M. Lynden-Bell, Phys. Chem. Chem. Phys., 2010, 12, 1733–1740 RSC.
- J. P. Hallett and T. Welton, J. Org. Chem., 2009, 74, 1864–1868 CrossRef CAS.
- W. Smith, T. Forester and I. Todorov, The DL POLY Classic User Manual, STFC Daresbury Laboratory, 2012 Search PubMed.
- I. Yeh and M. Berkowitz, J. Chem. Phys., 1999, 111, 3155–3162 CrossRef CAS.
- R. M. Lynden-Bell, Electrochem. Comm., 2007, 9, 1857–1861 CrossRef CAS.
- R. M. Lynden-Bell, J. Phys. Chem. B, 2007, 111, 10800–10806 CrossRef CAS.
- I. Streeter, R. M. Lynden-Bell and R. G. Compton, J. Phys. Chem. C, 2008, 112, 14538–14544 CrossRef CAS.
- R. M. Lynden-Bell, M. G. Del Popolo, T. G. A. Youngs, J. Kohanoff, C. G. Hanke, J. B. Harper and C. C. Pinilla, Acc. Chem. Res., 2007, 40, 1138–1145 CrossRef CAS PubMed.
- C. G. Hanke, S. L. Price and R. M. Lynden-Bell, Mol. Phys., 2001, 99, 801–809 CrossRef CAS.
- C. J. F. Böttcher, Theory of Electric Polarisation, Elsevier, 1973 Search PubMed.
- R. M. Lynden-Bell, Simulation and Theory of Electrostatic Interactions in Solutions, AIP Conf. Proc., 1999, 492, 3–16 CAS.
- G. Hummer, L. R. Pratt, A. E. Garcia and M. Neumann, Simulation and Theory of Electrostatic Interactions in Solutions, AIP Conf. Proc., 1999, 492, 84–103 CAS.
- R. M. Lynden-Bell, J. Chem. Phys., 2008, 129, 204503 CrossRef CAS PubMed.
- T. Welton and E. Bakis, 2020, work in progress.
- E. Bakis, PhD thesis, Imperial College London, 2019.
- J. Beck, R. Glaum, P. Koegerler, M. Speldrich and Y. Ben-Amer, Z. Anorg. Allg. Chem., 2009, 635, 1991–1996 CrossRef CAS.
Footnote |
| † Electronic supplementary information (ESI) available: [Force field parameters] and calculation of uncertainties in free energis. See DOI: 10.1039/d0cp01228a |
| This journal is © the Owner Societies 2020 |

