
 Open Access Article
 This Open Access Article is licensed under a Creative Commons Attribution-Non Commercial 3.0 Unported Licence
Temperature reversible synergistic formation of cerium oxyhydride and Au hydride: a combined XAS and XPDF study†
Adam H.
Clark
 *a,
Nadia
Acerbi
bc,
Philip A.
Chater
d,
Shusaku
Hayama
d,
Paul
Collier
c,
Timothy I.
Hyde
c and
Gopinathan
Sankar
*a
*a,
Nadia
Acerbi
bc,
Philip A.
Chater
d,
Shusaku
Hayama
d,
Paul
Collier
c,
Timothy I.
Hyde
c and
Gopinathan
Sankar
*a
aDepartment of Chemistry, University College London, 20 Gordon Street, London WC1H 0AJ, UK. E-mail: adam.clark@psi.ch; g.sankar@ucl.ac.uk
bWolfson Catalysis Centre, Inorganic Chemistry Laboratory, University of Oxford, South Parks Road, Oxford, OX1 3QR, UK
cJohnson Matthey Technology Centre, Blount's Court, Sonning Common, Reading RG4 9NH, UK
dDiamond Light Source, Harwell Science & Innovation Campus, Didcot, Oxfordshire OX11 0DE, UK
First published on 20th April 2020
Abstract
In situ studies on the physical and chemical properties of Au in inverse ceria alumina supported catalysts have been conducted between 295 and 623 K using high energy resolved fluorescence detection X-ray absorption near edge spectroscopy and X-ray total scattering. Precise structural information is extracted on the metallic Au phase present in a 0.85 wt% Au containing inverse ceria alumina catalyst (ceria/Au/alumina). Herein evidence for the formation of an Au hydride species at elevated temperature is presented. Through modelling of total scattering data to extract the thermal properties of Au using Grüneisen theory of volumetric thermal expansion it proposed that the Au Hydride formation occurs synergistally with the formation of a cerium oxyhydride. The temperature reversible nature, whilst remaining in a reducing atmosphere, demonstrates the activation of hydrogen without consumption of oxygen from the supporting ceria lattice.
Introduction
Ceria is widely used, particularly within auto-exhaust catalysis,1–4 due to enhanced oxygen storage capacity. The nature of cerium ions within the fluorite ceria phase to be stable in both Ce(III) and Ce(IV) oxidation states allowing for the storage and release of oxygen for oxidation reactions, often promoted by supported noble metal nanoparticles.5–8 The promotion of the ceria reduction by platinum group metals (PGMs) has been explained by various mechanisms: (1) the spill-over of hydrogen from the PGM surface onto the ceria,9–11 (2) reverse oxygen spill-over from the ceria towards the PGM ceria interface,12–14 (3) direct metal–support interactions, either through the strong metal support interaction15–17 or electronic metal support interaction.18–20The strong metal–support interaction has long been studied for its ability to change the chemisorption properties of platinum group metals (PGM) supported on metal oxide supports, commonly SiO2, ZnO, CeO2 or TiO2.15–17,21–25 In many systems the interaction between metallic particles and the support directly influences their catalytic behavior. The term strong metal–support interaction has also been related to the electronic metal–support interaction18–20 whereby there can be a small transfer of electrons from the support to metal or vice versa. This δ± charge can play an important role in the catalytic reactivity through van der Waals interactions. In the work of Acerbi et al.26–28 the strong metal support interaction on ceria coated, alumina supported PGMs was modelled using Junction theory. They proposed that the PGM promotes the formation of oxygen vacancies in ceria by the donation of electrons to the supported PGM Fermi level. With increasing work function of the PGM, the barrier for oxygen-vacancy formation was demonstrated to decrease. The role of alumina has also been noted to stabilise ceria, and ceria–zirconia solid solutions.29–31 In particular the inhibition of the ceria sintering has been observed resulting in the stabilization of highly dispersed ceria.32
While Au is classically described as a noble metal due to its relative inert behaviour towards oxidation or the absorption of gas phase molecules, Au nanoparticles have shown to be catalytically active particularly when supported on oxide supports.33–40 The interaction with the support materials has been demonstrated to result in a partial electron transfer from the support to the supported Au41,42 and can lead to the anchoring of Au onto the surface.43 During oxidative dehydrogenation catalysis on ceria-supported catalysts, Au hydride formation has previously been proposed to be an important intermediate. However, the characterisation of solid phase Au hydride presents a significant challenge.44 Previously Au hydrides have been only shown to be stable as a diatomic molecule with limited evidence for the presence of a stable solid phase hydride under catalytic conditions.33,34,41
Au materials have recently found interest for gas sensing applications where embedded Au ceria alumina materials have shown to be highly sensitive to gas phase hydrogen in localised surface plasmon resonance studies.45–47 The dissociation of hydrogen on Au has also been observed resulting in previous work identifying a metastable Au-hydride.46 Whilst the optical properties of Au and NiO nanoparticles supported on SiO2 have suggested an interaction between H2 and Au causing a change in optical transmittance at elevated temperatures in a H2 containing atmosphere.48
Previously, attempts have been made to determine the interaction of hydrogen with Au using XAS demonstrating a limited sensitivity to the bonding of hydrogen to Au.49 Elsewhere, IR experiments, after H/D exchange have suggested that hydrogen dissociates only on under coordinated Au(0)50 sites. Inelastic neutron scattering (INS) experiments have shown the presence of Ce hydride51 like species and proposed the presence of Au hydrides on ceria supported catalysts.52,53 However, INS studies necessitate the quenching of the sample to low temperatures. Our previous work on the formation of a cerium oxyhydride species demonstrated that this species is lost upon cooling.54
Whilst there have been numerous studies that point towards the potential formation of complex hydride species in Au and ceria containing materials, to date there are very limited examples of studies probing the dynamic structure of such materials. Therefore, to gain further understanding of the reactivity of supported Au catalysts we have used a combined XAS, at the Ce L3-edge and X-ray total scattering study. By extracting the difference X-ray pair distribution function (dxPDF), the dynamic local structural evolution of supported Au catalysts can be elucidated during interaction with hydrogen. Using dxPDF in combination with high energy resolution fluorescence detection X-ray absorption near edge structure (HERFD-XANES) at the Ce L3-edge, we give evidence for the co-formation of a metastable cerium oxyhydride and Au hydride phases within a hydrogen atmosphere. The presence of a high temperature Au hydride is demonstrated through the application of Grüneisen model55 to volumetric lattice expansion.
Experimental
The 15 wt% ceria/0.85 wt% Au/alumina inverse catalyst and 15 wt% ceria/alumina support material used in this study are the same as reported in an earlier publication where details of the catalyst preparation and temperature programmed reduction are given.27 The catalyst composition is assumed from the synthesis procedure. Estimates of the sample composition has also been obtained from XRD analysis given in ESI† S1 and T1 which agrees with the intended composition.To monitor the oxidation state of the cerium phase present within the ceria phase of the sample HERFD-XANES at the Ce L3 edge was employed. The high energy resolution of the technique allows for the accurate determination of the fraction of the reduced state Ce(III) present within the sample to be extracted. HERFD-XANES measurements at the Ce L3 edge were conducted at I20-scanning beam-line at the Diamond Light Source56 on the ceria/Au/alumina systems through monitoring the intensity of the Ce Lα1 photo emission line with the X-ray emission spectrometer fixed at 4840 eV. The incident beam was monochromatised using a Si(111) 4-bounce monochromator with a spot size on the sample of 400 × 300 μm (H × V). The incident energy was scanned between 5680 and 5850 eV. A Rh coated collimating mirror was used with subsequent harmonic rejection was achieved using a Si coated mirror. The X-ray emission spectrometer operated in the Johann configuration with a 1 m diameter Rowland circle and was equipped with 3 spherically bent analyser crystals of 100 mm diameter. In a typical experiment, about 12 mg of the sample was mixed with 50 mg of fumed silica, pressed into a pellet and loaded in to an in situ cell. The in situ reaction chamber used for the XAS work is very similar to the one published by Nguyen et al.57 This cell is made of quartz glass which has beam entry exit for transmission geometry and another port at 90 degrees for fluorescence measurements. All these ports contain sealed Kapton windows. The sample is loaded into the cell from the top which is sealed by a KF40 flange. The sample holder and a port for the thermocouple were attached to the top of the flange along with ports for gas in and gas out. Pellet samples are mounted onto the sample holder, with the thermocouple placed strategically close to the sample and not interfering with the beam. Once the sample is loaded, N2 gas was used to flush out all the gases present in the system for 30 min. Subsequently the system was equilibrated under 3.5% H2/N2 gas for 30 min prior to heating to 623 K at K min−1 followed by cooling to room temperature under the same atmosphere.
X-ray total scattering were conducted at ID15-1 beam-line at the Diamond Light Source. Measurements were performed at refined sample to detector distance of 198.3 mm with a photon energy of 76.69 keV. A 2D PerkinElmer image plate detector with each frame being collected for 1 s and with 5 frames were averaged together in post-processing. Conversion to integrated line spectra being performed with DAWN58,59 and Fourier Transformation performed using xPDFsuite.60 Samples were loaded into fused quartz capillaries with an internal diameter of 0.9 mm. A hot air blower directly below the sample was used to heat to 623 K at a ramp rate of 10 K min−1. Samples were then cooled at 10 K min−1 to room temperature. The recorded measurement of temperature was taken from the hot air blower and logged throughout the experiments. A flow rate of 30 ml min−1 of 5% H2/He through the capillary was utilised throughout and controlled using Gilmont Accucal flowmeters. In both experiments leak testing of all Swagelok connections was performed using Swagelok Snoop® liquid leak detector with an inert gas flow. The sample powder was pressed and sieved with a sieve fraction of 100–150 μm prior to loading into the quartz capillary without dilution.
Results and discussion
Analysis of the Ce L3-edge XAS experiments
Experiments following the oxidation state of cerium were performed using the HERFD-XANES technique on the ceria/Au/alumina sample by measuring the excitation of the 2p3/2 electrons to unoccupied 4f and 5d states. The XAS spectra collected at room temperature, prior to heating, at 623 K and at final room temperature, after heating in hydrogen are shown in Fig. 1. Analysis of the XANES structure was performed using a peak fitting methodology. While peak fitting examples for the Ce L3 edge XANES is commonly employed for standard transmission XANES analysis,61–64 such an approach has not routinely been employed for analysis of HERFD-XANES. The association of the peaks to Ce(III) and Ce(IV) species was made in comparison to a NIST ceria reference material and previously reported associations and electronic transitions in the literature,54,64–66 and illustrated in Fig. 1. Here feature A is a pre-edge feature associated to the partially occupied 4f electron within the fluorite ceria structure while B and C are associated to the crystal-field splitting within the cubic fluorite structure of the 2p → 4f0,5d transition. D1 and D2 relate to the unscreened excited states exhibiting crystal field splitting, and E, to a singlet for the 2p → 4f15d for Ce(III) ion. The fraction of Ce(III) is then calculated from the ratio of associated peak areas.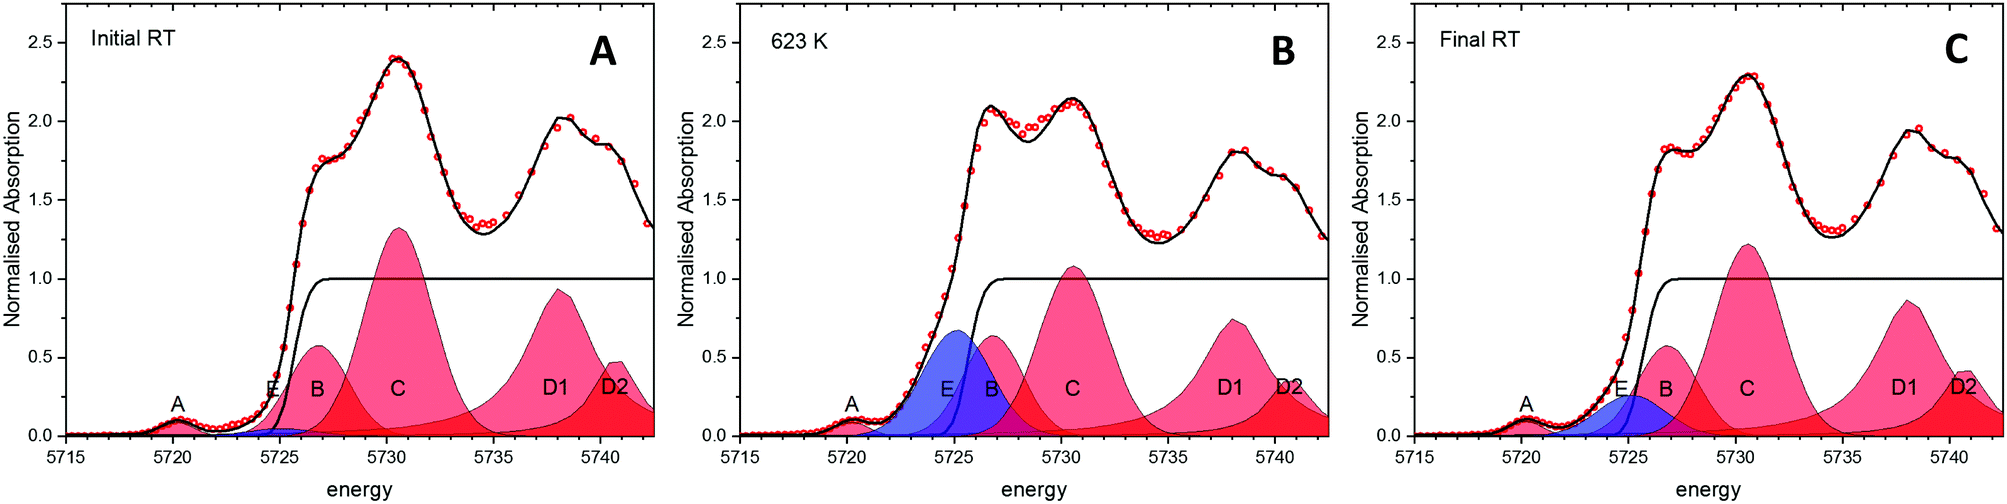 | ||
| Fig. 1 Experimental HERFD-XANES spectra and results relating to partially reduced ceria. Example of the peak fitting methodology undertaken on the normalised HERFD-XANES spectra of ceria samples. The red peaks give the Ce(IV) contribution whilst the blue gives the Ce(III) contribution during heating and cooling in a 3.5% H2/He atmosphere. The three spectra relate to the initial starting material at room temperature (A), at 623 K (B) and after cooling back to room temperature (C) of the ceria/Au/alumina sample. | ||
The initial starting material was assigned as almost fully Ce(IV). The presence of substantial Ce(III) as a result of heating the sample in a H2 containing atmosphere is shown by the peak growing centred around 5725 eV, illustrated as peak E shaded blue. Therefore it can be noted that the exposure to hydrogen leads to the formation of Ce(III). However, as with our previous findings on a high surface area ceria material,54 upon cooling the majority of formed Ce(III) is re-oxidised to Ce(IV) without the presence of an oxidising atmosphere. This effect can be clearly seen by the fact that area of peak E, shaded blue, at 623 K is greater than after cooling to RT. The degree of formation of Ce(III) is estimated by consideration of the ratio of peak areas of the Ce(III) and Ce(IV) associated contributions.
 | (1) |
From this method the initial proportion of Ce(III) is found to be 1%, whilst at 623 K 26 ± 2% Ce(III) is formed. These results are in line with our previous publication54 suggesting a stoichiometry of HCe4O8 at 623 K. After cooling in H2 there is approximately 7% of the Ce(III) remaining. This may be due to remaining a partial extraction of oxygen from the ceria lattice or by remaining surface or subsurface hydroxyl groups. However, it can be noted that the majority of the Ce(III) formation (∼19%) is due to a temperature reversible process and therefore not as a consequence of reduction by removal of oxygen from the lattice.
Analysis of the xPDF experiments
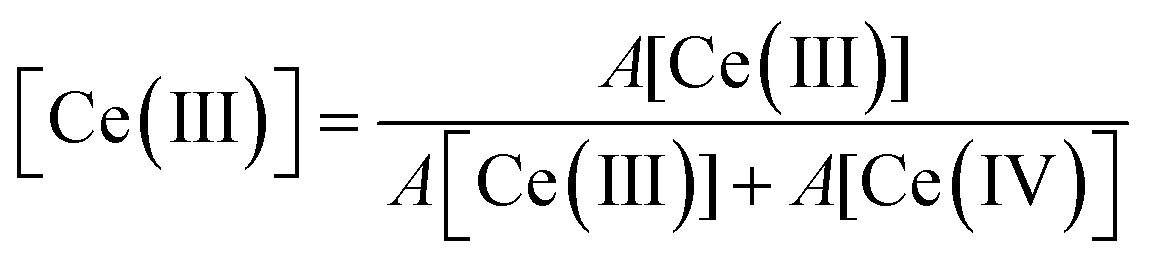
To probe the correlation between the expansion of the ceria lattice and the effect of supported Au, xPDF experiments were performed on the ceria coated alumina supported Au sample and a similar sample without the presence of Au. Due to the complexities of accurately refining the Bragg diffraction data with the alumina phase, correction by subtraction of an alumina diffraction pattern collected under the sample experimental conditions was performed prior to Fourier transform to the real space. The temperature of each measurement was matched to within 0.1 K and subtracted from the integrated total scattering data, as illustrated in Fig. 2A. Subtraction of the Ceria phase from the integrated total scattering data is not possible due to the dynamically changing nature of ceria under a reducing atmosphere; partial reduction of ceria results in an expanded fluorite lattice structure. As such a fitting model was created to accurately refine the ceria and metallic Au phases. Fitting was performed between 1.7 and 20 Å in real space using PDFGui.67 The lattice parameters and atomic displacement parameters were refined during the fitting procedure. A typical fit to the initial room temperature differential xPDF dataset using a biphasic metallic Au and fluorite ceria phases is shown in Fig. 2B, here the Au component is explicitly shown at the bottom to illustrate its contribution to the differential pair distribution function G(r). The remaining peaks in the dxPDF pattern are given by the ceria phase contribution, which as expected dominates the pattern after removing the alumina component. By this method it is possible to follow the evolution of the respective Au and ceria components during heating and cooling in the 5% H2/He atmosphere. Typical fits for several temperatures are shown in the ESI† S2–S10. A plot comparing the Ceria and Au lattice parameters and the rw for all fitted data sets for the ceria/Au/alumina is shown as Fig. S11 (ESI†).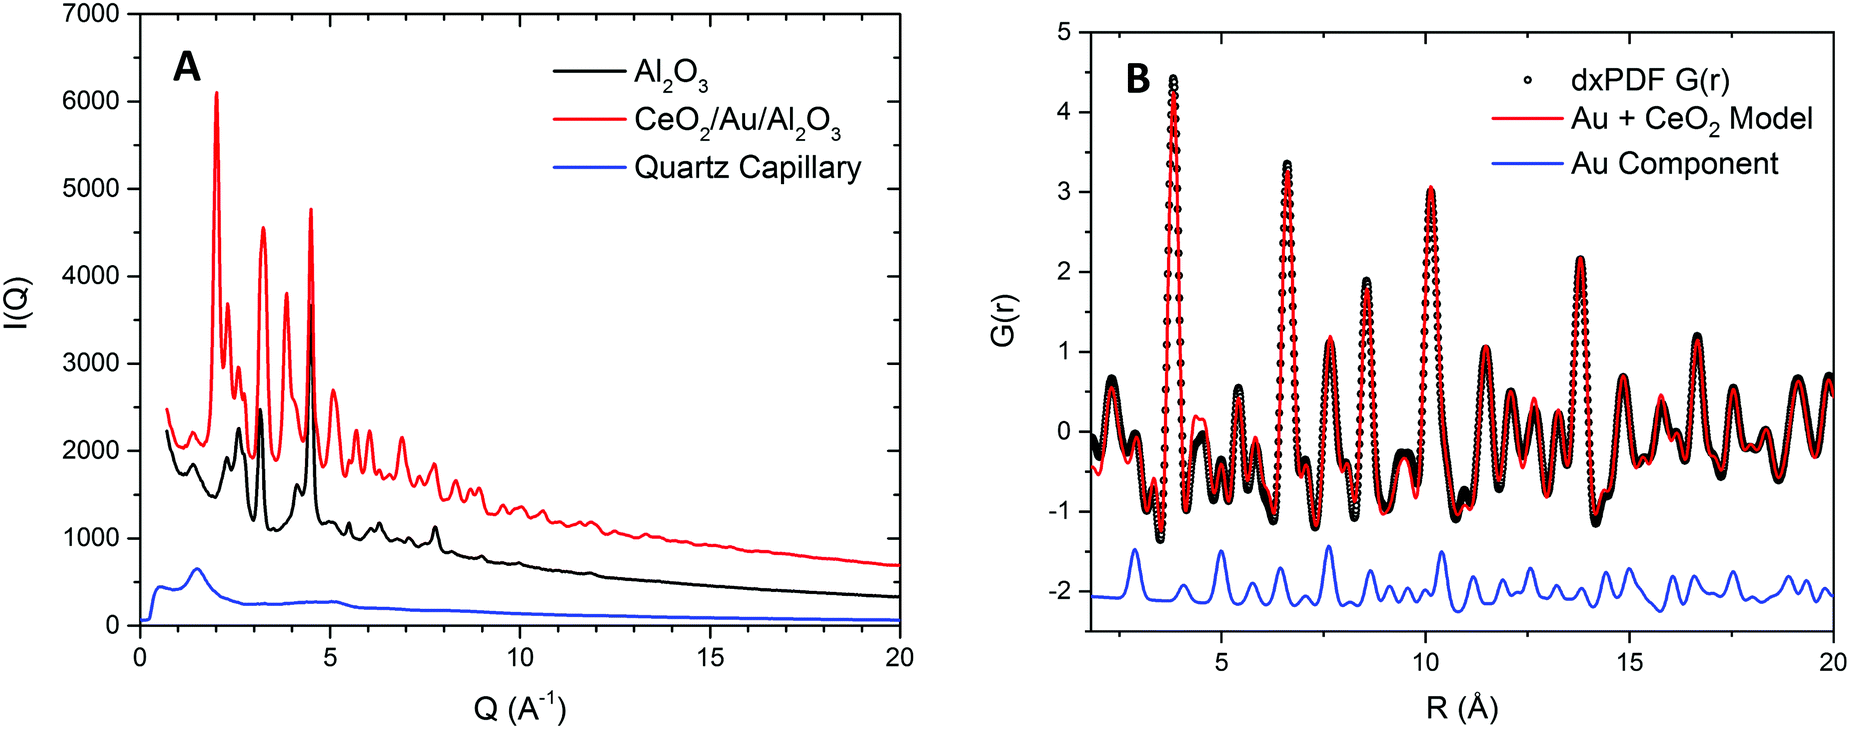 | ||
| Fig. 2 Experimental DxPDF patterns, alumina subtraction and Fourier Transformation recorded at room temperature. (A) Integrated total scattering pattern relating to: a ceria alumina support Au inverse catalyst sample, a gamma alumina support and fused quartz capillary sample environment; illustrating the process for correction to arrive at the differential xPDF containing the fluorite ceria and metallic Au components. (B) Example fit to the initial differential xPDF G(r) for a biphase model containing fluorite ceria and metallic Au components over a fitting region of 1.8 to 20 Å. The metallic Au component contribution is highlighted below the data to illustrate the presence of the metallic Au phase within the extracted differential xPDF G(r). Typical fit residual, rw = 0.1. | ||
The extracted ceria lattice parameters are shown in Fig. 3 for the ceria/alumina and ceria/Au/alumina samples demonstrating a noticeable expansion in the ceria lattice is found heating above 450 K. The expansion seen in the ceria lattice can be rationalised by two competing processes. Firstly, linear thermal expansion of the fluorite lattice and secondly by the formation of Ce(III) ions within the fluorite lattice.
 | ||
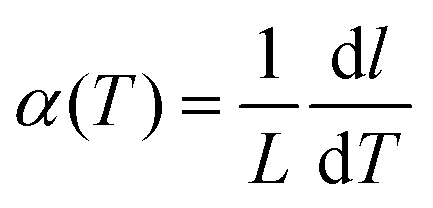
| Fig. 3 Experimental DxPDF results showing the extracted ceria lattice parameter. The ceria/alumina and ceria/Au/alumina ceria lattice parameter refinements are given in black and red respectively for experiments conducted during heating in a 5% H2/He atmosphere for the heating (A) and cooling (B) in 5% H2/He (C) instantaneous expansion coefficient during heating and cooling for the ceria/alumina (dotted lines) and ceria/Au/alumina (solid lines) samples. Dashed lines give the expected thermal expansion coefficient of ceria, α = 10 × 10−6 K−1, expansion in excess is associated to chemical change of the sample. | ||
The latter causes expansion due to the fact that Ce(III) ions are larger than Ce(IV) ions. Fig. 3A gives the ceria lattice parameter, as a function of temperature, during heating in 5% H2/He atmosphere for both samples. Here it can be seen that during heating in hydrogen, there is a significant inflection in the ceria lattice parameter at approximately 475 K for both the ceria/Au/alumina and ceria/alumina samples. This behaviour has been associated to the formation of Ce(III) ions within the ceria lattice due to the interaction with hydrogen.54 A non-linear lattice expansion cannot be explained solely by thermal expansion of the ceria lattice. However, the rate of the Ce(III) formation is noted to be somewhat faster for the Au containing sample. As such, it can be proposed that the presence of Au promotes the formation of Ce(III) ions within the ceria lattice. However direct estimation of the Ce(III) fraction not possible from dxPDF and is more precisely determined from the Ce L3 edge XAS experiments.
When considering the cooling cycle, shown in Fig. 3B, it is evident that the ceria lattice contracts to near its initial starting conditions for both the ceria/Au/alumina and ceria/alumina samples. Coupled with the findings from XAS that there is substantial reoxidation of the Ce(III) to Ce(IV) during cooling we propose that there is a formation of a meta-stable cerium oxyhydride phase induced by the interaction of hydrogen with the ceria lattice in the same mechanism as previously reported.54 Our previous study demonstrated that the formation of Ce(III) formation in ceria under mild conditions by the interaction with hydrogen does not necessitate the removal of oxygen from the lattice.
The calculation of the instantaneous lattice expansion coefficient is given in Fig. 3C. The instantaneous expansion coefficient is defined by;
Application of the Debye model for internal energy
Whilst the cerium L3 edge XAS and the lattice parameter refinements form xPDF provide extensive information on the nature of the ceria component of the support, we also exploited the xPDF data to extract further information on the behavior of the Au phase. Modelling of the thermal dependence on the Au unit cell volume expansion through consideration of the Debye temperature can be achieved by employing a Grüneisen model.70–72 The unit cell volume for the Au phase can be expressed as;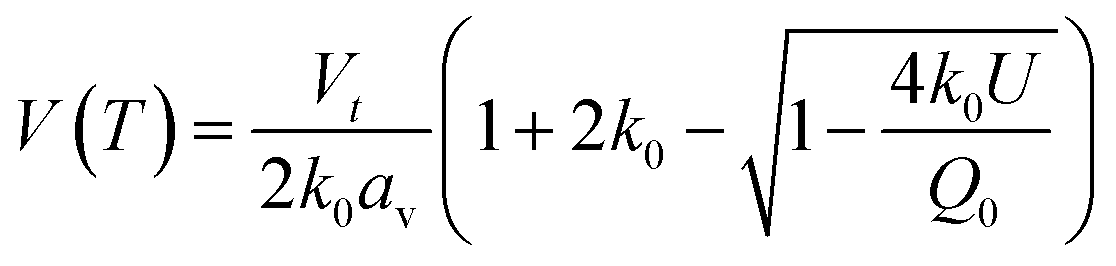 | (2) |
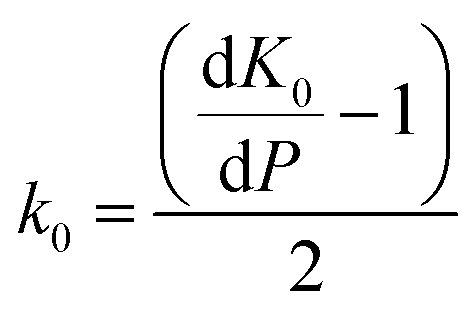 | (3) |
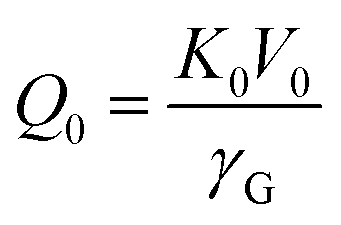 | (4) |
 has been set from Dewaele et al.73 at 6 giving k0 to be 2.5. The internal energy is determined for consideration of the Debye model and is described by the eqn (5) where θG is the Debye temperature, R the gas constant, n is given by the number of atoms in the formula unit, T describes the temperature on absolute scale.
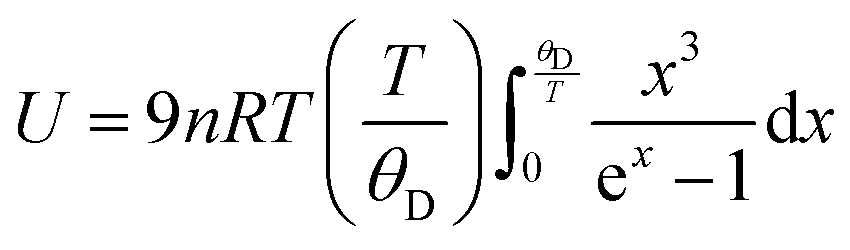 | (5) |
Extension of this allows for the Debye temperature to be used directly to determine the dynamic contribution to the atomic displace parameter of Au, given in eqn (6).72,74
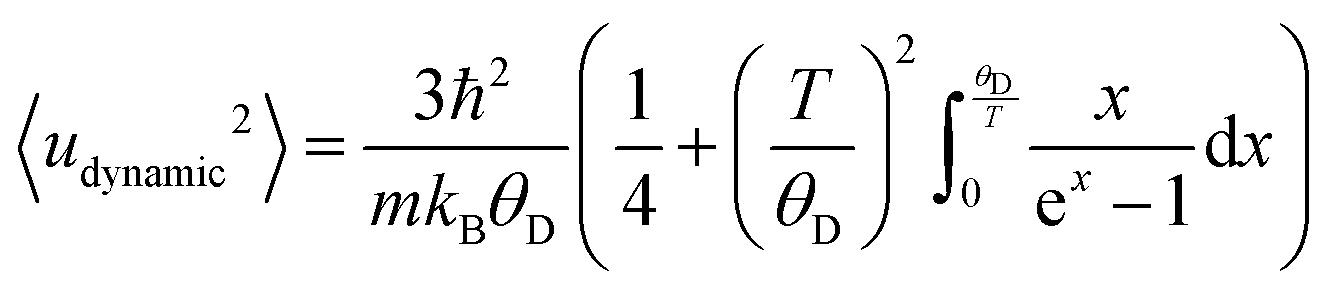 | (6) |
| Uiso = 〈udynamic2〉 + 〈ustatic+instrumental2〉. | (7) |
Modelling of the lattice volume expansion of Au as a function of temperature using the Grüneisen model, eqn (2), demonstrates a strong agreement between the expansion determined from the experimental scattering data and theoretically determined lattice volume. The Debye temperature, θD, was refined to be 170 ± 4 K, as shown in Fig. 4A. This value is in close agreement to previous experimental work demonstrating a Debye temperature for Au of 165 K.75–77
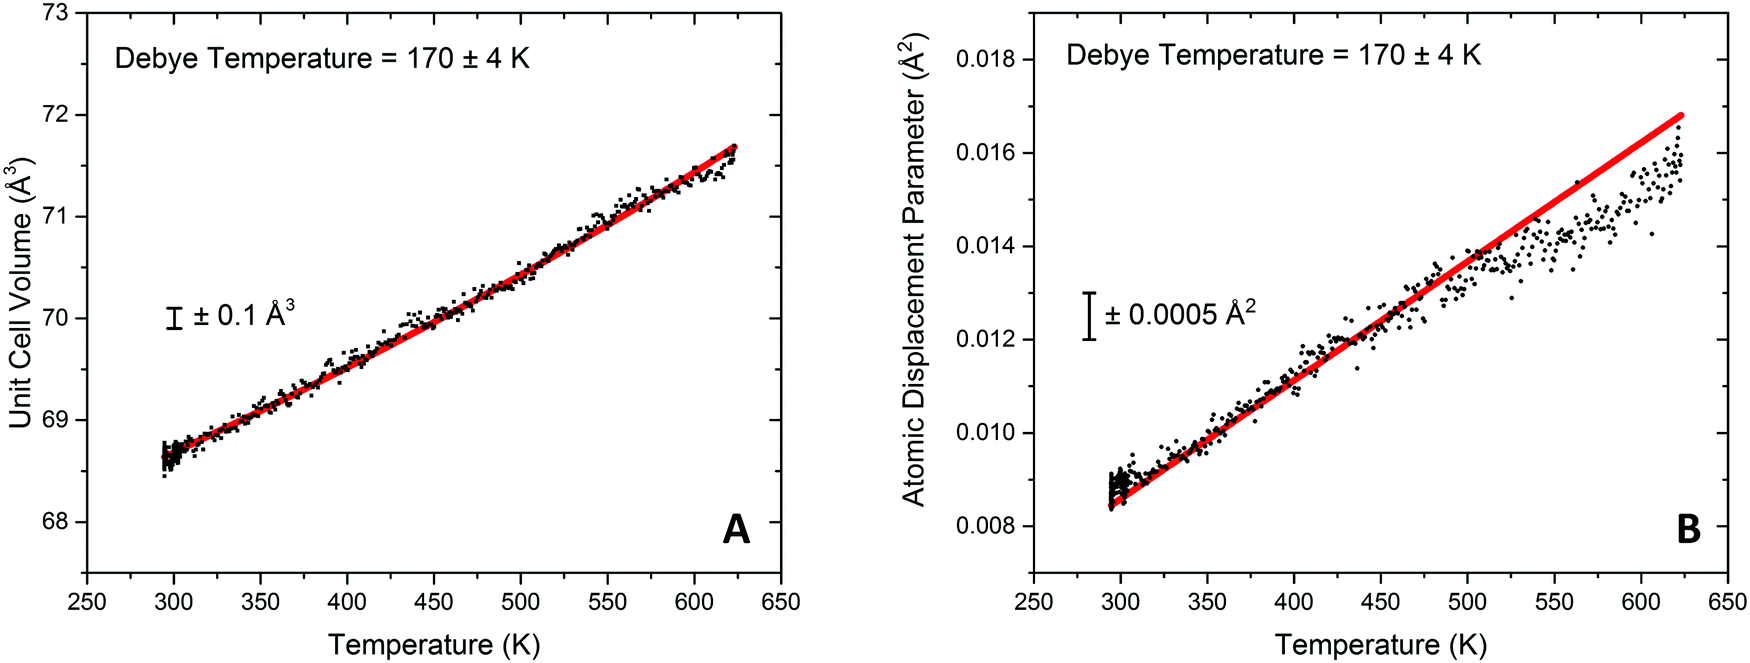 | ||
| Fig. 4 Fitting of unit cell volume and atomic displacement parameters extracted from differential xPDF analysis relating to the metallic Au component. (A) Fitting of the Au unit cell volume during heating of the ceria/Au/alumina sample using Grüneisen model for the volumetric thermal expansion is shown in red. The extracted Au Debye temperature, 170 ± 4 K, is indicated on the plot. (B) Illustration of the fitting to the atomic displacement parameter extracted from differential xPDF analysis is shown in red. The dynamic contribution is accounted for through the Debye model. | ||
In addition to these findings, it was possible to refine the value of V0 from the modelling of the volumetric lattice expansion. Here it is determined that V0 is equal to 66.6 Å3, or a lattice parameter of 4.05 Å which is contracted as compared to bulk Au (4.078 Å). Elsewhere it has been noted that there is a large contraction in the lattice volume in the surface of fcc nanocrystals78,79 and as such this would indicate that the Au is present in nanocrystalline form in this sample.
Through the modelling of refined atomic displacement parameter it can be shown that there is a strong agreement between the Debye model for internal energy and the atomic displacement parameter between 293 and 475 K, shown in Fig. 4B. Above this there can be seen to be a deviation from the model which results in a lower than predicted Uiso value; this implies a higher Debye temperature in this region and is proposed to be due to the formation of an Au hydride species. Typically hydride species have elevated Debye temperatures when considered against their metallic counterparts.80 Evidence for surface gold hydride species has also previously been reported elsewhere in Au/ceria catalysts42,52,53,81 and therefore it could be taking place at the Au surface or the Au–ceria interface. For the Au containing sample is was previously reported that the H2 dissociation rate on the Au metal surface is readily possible at temperature in excess of 420 K27 and that the noted temperature where H2 can be dissociated by the Au surface corresponded well with an observed peak of hydrogen update in TPR measurements. The findings from the DxPDF analysis would suggest that the dissociation of hydrogen leads to physical changes in the structure of the Au lattice.
Further to these results, there can be seen to be a remarkable agreement in the temperature between the formation of the metastable cerium oxyhydride phase54 and the proposed formation of the surface Au hydride species at approximately 475 K. This finding and the comparison with the ceria lattice parameter refinements during heating, shown in Fig. 3A, suggests that the proposed Au hydride forms coincidental to the cerium oxyhydride phase. As such, it can be proposed that Au promotes the formation of cerium oxyhydride species through the interaction of hydrogen with the supported Au nanoparticles.
Analysis of the cooling phase of the experiment was also undertaken in a similar way and is shown in Fig. 5. Here the fitting was truncated to be between 375 K and 623 K due to the inflection in both the lattice parameter data and the refined atomic displacement parameter at approximately 375 K. It should be noted that whilst in the heating data no significant deviation from the Grüneisen model for the lattice volume was observed, a clear step resulting in a decrease in the lattice volume can be seen on cooling.
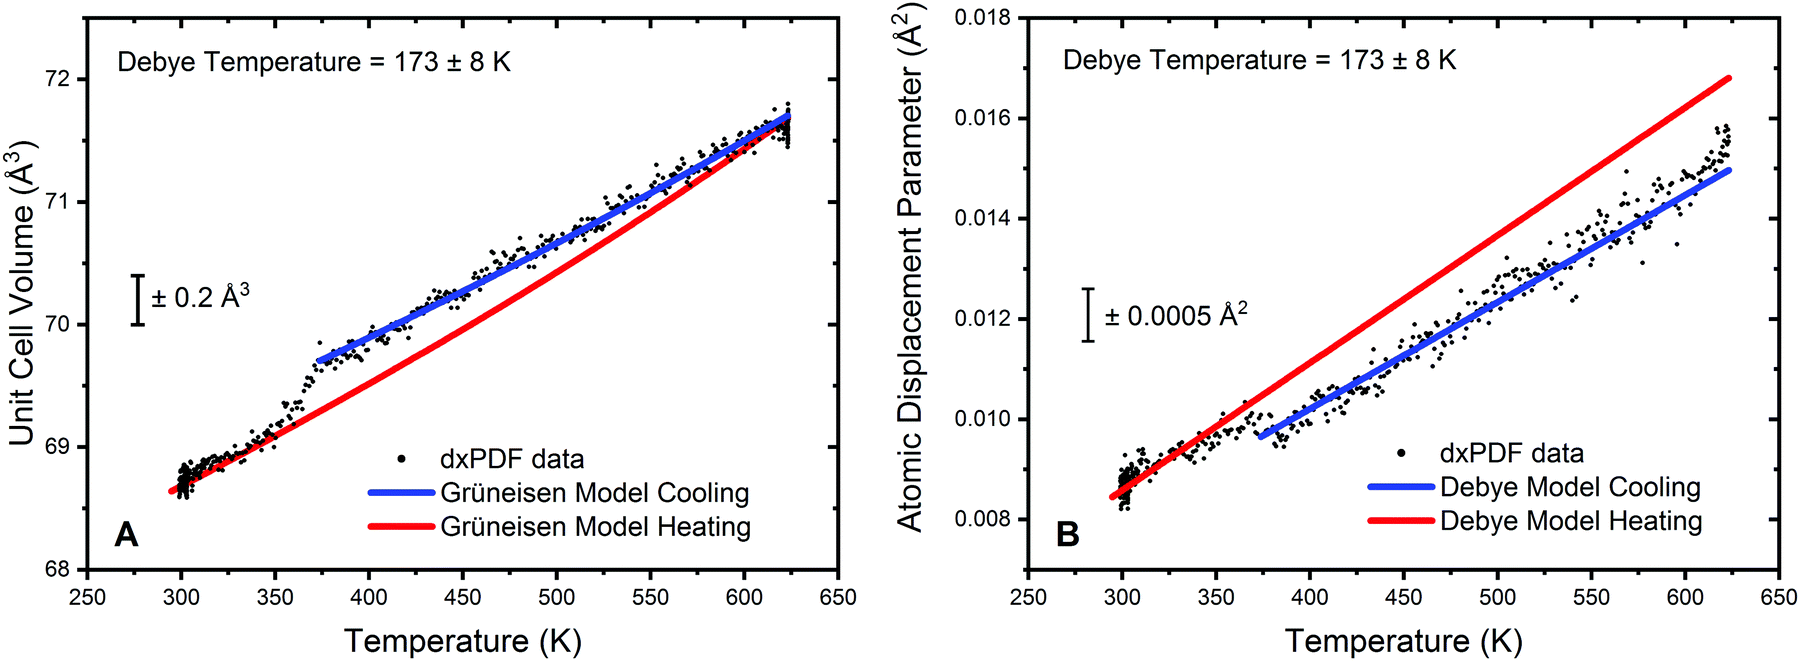 | ||
| Fig. 5 Fitting of unit cell volume and atomic displacement parameters extracted from differential xPDF analysis relating to the metallic Au component. (A) Fitting of the Au unit cell volume during cooling of the ceria/Au/alumina sample using Grüneisen model for the volumetric thermal expansion is shown in blue. The model refined from the heating data is given superimposed in red. The extracted Au Debye temperature from the cooling in 5% H2/He, 173 ± 8 K, is indicated on the plot. (B) Illustration of the fitting to the atomic displacement parameter extracted from cooling differential xPDF analysis is shown in blue. The model for the heating data is show superimposed in red. The dynamic contribution to the atomic displacement parameter is accounted for through the Debye model. | ||
The gradient of the cooling prior to 375 K can also be observed to be significantly different from the heating data. For clarity Fig. 5A displays the model for the heating data in red superimposed upon the cooling data; the blue curve gives the fitting to the truncated cooling data. Furthermore, it can be noted that below 350 K the lattice volume follows very closely the model of the heating data. This would suggest that changes in the lattice volume are not an effect of particle sintering of the Au phase. Refinement of V0 from the modelling of the volumetric lattice expansion yields a lattice volume of 67.6 Å3, or a lattice parameter of 4.07 Å. This is a noted increase as compared to the value of V0 obtained from the heating data and would further indicate that there is a formation of an Au hydride species on exposure to hydrogen at elevated temperatures. The refinement of the Debye temperature yields a slightly elevated value, 173 K. However, the uncertainty on this is relatively high due to the truncation of the data range and as such can only tentatively be noted as increased in respect to the cooling data.
Analysis of the atomic displacement parameter reveals a step like change in disorder when cooling and is shown in Fig. 5B. The modelling of the data for the cooling phase is truncated due to the step increase in the refined atomic displacement parameter observed at approximately 350 K. From Fig. 5B it can be observed that the dynamic contribution to the atomic displacement parameter during cooling is marginally lower than the heating phase and can be modelled by an increase in the Debye temperature. The static contribution (and instrumental contribution) to the atomic displacement parameter is the same for both heating and cooling data. Therefore, the decrease in disorder is suggested to be well modelled by a slight increase in the refined Debye temperature and further alludes to an Au hydride species being present. Below 350 K, the data is seen to closely follow the refined model of the heating portion of the experiment. Therefore, it can be proposed that the formation of Au hydride is only stable in this system above approximately 350 K.
Conclusions
In summary, we have shown how analysis of lattice and atomic displacement parameters from differential X-ray total scattering methods combined with the element specificity of HERFD-XANES can be exploited to provide significant insight into the interactions of hydrogen with the ceria/Au/alumina catalysts studied here. Using dxPDF to probe the physical and chemical properties of individual phases present within a complex multiphase material elucidates the role of Au in promoting the formation of a cerium oxyhydride species. The application of the Grüneisen model for volumetric lattice expansion and the Debye model we have determined the Debye temperature of Au to be 170 ± 4 K. Furthermore, whilst modelling of the refined atomic displacement parameter through consideration of the internal energy using the Debye model, a clear deviation from the atomic displacement model occurs at temperatures exceeding 475 K under a partial H2 atmosphere. This has been interpreted as arising from the formation of an Au hydride species.The interplay between the structural changes in the Au and support ceria has been explored through consideration of the ceria lattice expansion and the formation of Ce(III) ions upon heating in the reducing 5% H2/He atmosphere between 293 and 623 K. Above 475 K, the lattice parameter of the ceria is observed to expand non-linearly. This is associated initially to the formation Ce(III) ions within the fluorite lattice by the inclusion of hydrogen to form a metastable cerium oxyhydride species. Upon cooling, in a reducing atmosphere the reduced Ce(III) species revert almost completely back to Ce(IV) concurrent with the apparent loss of the Au hydride.
The formation the cerium oxyhydride species was demonstrated to be promoted in the presence of Au and to form coincidentally to the proposed Au hydride species. These findings may explain why Au/ceria materials have been demonstrated to be active in hydrogenation and hydrochlorination reactions.
Conflicts of interest
There are no conflicts to declare.Acknowledgements
We thank Diamond Light Source for access to beamline I15-1 (EE15696) and beamline I20-scanning (SP16508) that contributed to the results presented here. We thank EPSRC and Johnson Matthey Plc for a Case Award (AHC EPSRC: 1635837).Notes and references
- A. Bueno-López, Appl. Catal., B, 2014, 146, 1–11 CrossRef.
- A. Trovarelli, C. De Leitenburg, M. Boaro and G. Dolcetti, Catal. Today, 1999, 50, 353–367 CrossRef CAS.
- J. Kašpar, P. Fornasiero and N. Hickey, Catal. Today, 2003, 77, 419–449 CrossRef.
- R. J. Farrauto and R. M. Heck, Catal. Today, 1999, 51, 351–360 CrossRef CAS.
- S. E. Golunski, H. A. Hatcher, R. R. Rajaram and T. J. Truex, Appl. Catal., B, 1995, 5, 367–376 CrossRef CAS.
- F. Morfin, T.-S. Nguyen, J.-L. Rousset and L. Piccolo, Appl. Catal., B, 2016, 197, 2–13 CrossRef CAS.
- Z. Mohamed, V. D. B. C. Dasireddy, S. Singh and H. B. Friedrich, Appl. Catal., B, 2016, 180, 687–697 CrossRef CAS.
- T.-S. Nguyen, F. Morfin, M. Aouine, F. Oise Bosselet, J.-L. Rousset and L. Piccolo, Catal. Today, 2015, 253, 106–114 CrossRef CAS.
- G. Dutta, U. V. Waghmare, T. Baidya and M. S. Hegde, Chem. Mater., 2007, 19, 6430–6436 CrossRef CAS.
- Y. Yao and D. W. Goodman, J. Mol. Catal. A: Chem., 2014, 383–384, 239–242 CrossRef CAS.
- V. Sharma, P. A. Crozier, R. Sharma and J. B. Adams, Catal. Today, 2012, 180, 2–8 CrossRef CAS.
- F. R. Negreiros and S. Fabris, J. Phys. Chem. C, 2014, 118, 21014–21020 CrossRef CAS.
- G. N. Vayssilov, Y. Lykhach, A. Migani, T. Staudt, G. P. Petrova, N. Tsud, T. Skála, A. Bruix, F. Illas, K. C. Prince, V. Matolín, K. M. Neyman and J. Libuda, Nat. Mater., 2011, 10, 310–315 CrossRef CAS PubMed.
- Y. Men, H. Gnaser, C. Ziegler, R. Zapf, V. Hessel and G. Kolb, Catal. Lett., 2005, 105, 35–40 CrossRef CAS.
- A. Bruix, J. A. Rodriguez, P. J. Ramírez, S. D. Senanayake, J. Evans, J. B. Park, D. Stacchiola, P. Liu, J. Hrbek and F. Illas, J. Am. Chem. Soc., 2012, 134, 8968–8974 CrossRef CAS PubMed.
- S. J. Tauster, S. C. Fung and R. L. Garten, J. Am. Chem. Soc., 1978, 100, 170–175 CrossRef CAS.
- S. J. Tauster, Acc. Chem. Res., 1987, 20, 389–394 CrossRef CAS.
- Z. Ma, X. Xiong, C. Song, B. Hu and W. Zhang, RSC Adv., 2016, 6, 51106–51110 RSC.
- P. Hu, Z. Huang, Z. Amghouz, M. Makkee, F. Xu, F. Kapteijn, A. Dikhtiarenko, Y. Chen, X. Gu and X. Tang, Angew. Chem., Int. Ed., 2014, 53, 3418–3421 CrossRef CAS PubMed.
- C. T. Campbell, Nat. Chem., 2012, 4, 597–598 CrossRef CAS PubMed.
- T. Lunkenbein, J. Schumann, M. Behrens, R. Schlögl and M. G. Willinger, Angew. Chem., Int. Ed., 2015, 54, 4544–4548 CrossRef CAS PubMed.
- Y. Lykhach, S. M. Kozlov, T. Skála, A. Tovt, V. Stetsovych, N. Tsud, F. Dvořák, V. Johánek, A. Neitzel, J. Mysliveček, S. Fabris, V. Matolín, K. M. Neyman and J. Libuda, Nat. Mater., 2016, 15, 284–288 CrossRef CAS PubMed.
- X. Y. Shi, W. Zhang, C. Zhang, W. T. Zheng, H. Chen and J. G. Qi, J. Microsc., 2016, 262, 203–215 CrossRef CAS PubMed.
- L. Deng, H. Miura, T. Shishido, S. Hosokawa, K. Teramura and T. Tanaka, Chem. Commun., 2017, 53, 6937–6940 RSC.
- H. Tang, Y. Su, B. Zhang, A. F. Lee, M. A. Isaacs, K. Wilson, L. Li, Y. Ren, J. Huang, M. Haruta, B. Qiao, X. Liu, C. Jin, D. Su, J. Wang and T. Zhang, Sci. Adv., 2017, 3, e1700231 CrossRef PubMed.
- N. Acerbi, S. C. Tsang, S. Golunski and P. Collier, Chem. Commun., 2008, 1578–1580 RSC.
- N. Acerbi, S. C. E. Tsang, G. Jones, S. Golunski and P. Collier, Angew. Chem., Int. Ed., 2013, 52, 7737–7741 CrossRef CAS PubMed.
- N. Acerbi, S. Golunski, S. C. Tsang, H. Daly, C. Hardacre, R. Smith and P. Collier, J. Phys. Chem. C, 2012, 116, 13569–13583 CrossRef CAS.
- R. Di Monte and J. Kašpar, J. Mater. Chem., 2005, 15, 633–648 RSC.
- A. Piras, A. Trovarelli and G. Dolcetti, Appl. Catal., B, 2000, 28, L77–L81 CrossRef CAS.
- E. C. Su, C. N. Montreuil and W. G. Rothschild, Appl. Catal., 1985, 17, 75–86 CrossRef CAS.
- M. Fer Andez-García, A. Martínez-Arias, A. Iglesias-Juez, C. Belver, A. B. Hungría, J. C. Conesa and J. Soria, J. Catal., 2000, 194, 385–392 CrossRef.
- H.-J. Zhai, B. Kiran and L.-S. Wang, J. Chem. Phys., 2004, 121, 8231 CrossRef CAS PubMed.
- X. Wu, Z. Qin, H. Xie, R. Cong, X. Wu, Z. Tang and H. Fan, J. Chem. Phys., 2010, 133, 044303 CrossRef PubMed.
- M. Shekhar, J. Wang, W. S. Lee, W. D. Williams, S. M. Kim, E. A. Stach, J. T. Miller, W. N. Delgass and F. H. Ribeiro, J. Am. Chem. Soc., 2012, 134, 4700–4708 CrossRef CAS PubMed.
- R. Si, J. Tao, J. Evans, J. B. Park, L. Barrio, J. C. Hanson, Y. Zhu, J. Hrbek and J. A. Rodriguez, J. Phys. Chem. C, 2012, 116, 23547–23555 CrossRef CAS.
- D. Tibiletti, A. Amieiro-Fonseca, R. Burch, Y. Chen, J. M. Fisher, A. Goguet, C. Hardacre, P. Hu and D. Thompsett, J. Phys. Chem. B, 2005, 109, 22553–22559 CrossRef CAS PubMed.
- Z. K. Han, Y. G. Wang and Y. Gao, Chem. Commun., 2017, 53, 9125–9128 RSC.
- W. Deng and M. Flytzani-Stephanopoulos, Angew. Chem., Int. Ed., 2006, 45, 2285–2289 CrossRef CAS PubMed.
- G. M. Mullen, E. J. Evans, I. Sabzevari, B. E. Long, K. Alhazmi, B. D. Chandler and C. B. Mullins, ACS Catal., 2017, 7, 1216–1226 CrossRef CAS.
- A. Sanchez, S. Abbet, U. Heiz, W. D. Schneider, H. Häkkinen, R. N. Barnett and U. Landman, J. Phys. Chem. A, 1999, 103, 9573–9578 CrossRef CAS.
- X. Wang and L. Andrews, Angew. Chem., Int. Ed., 2003, 42, 5201–5206 CrossRef CAS PubMed.
- N. Ta, J. Liu, S. Chenna, P. A. Crozier, Y. Li, A. Chen and W. Shen, J. Am. Chem. Soc., 2012, 134, 20585–20588 CrossRef CAS PubMed.
- M. Wang, F. Wang, J. Ma, M. Li, Z. Zhang, Y. Wang, X. Zhang and J. Xu, Chem. Commun., 2014, 50, 292–294 RSC.
- N. A. Joy, M. I. Nandasiri, P. H. Rogers, W. Jiang, T. Varga, S. V. N. T. Kuchibhatla, S. Thevuthasan and M. A. Carpenter, Anal. Chem., 2012, 84, 5025–5034 CrossRef CAS PubMed.
- D. Sil, K. D. Gilroy, A. Niaux, A. Boulesbaa, S. Neretina and E. Borguet, ACS Nano, 2014, 8, 7755–7762 CrossRef CAS PubMed.
- C. Wadell, S. Syrenova and C. Langhammer, ACS Nano, 2014, 8, 11925–11940 CrossRef CAS PubMed.
- D. Buso, G. Busato, M. Guglielmi, A. Martucci, V. Bello, G. Mattei, P. Mazzoldi and M. L. Post, Nanotechnology, 2007, 18, 7 CrossRef.
- N. Guo, B. R. Fingland, W. D. Williams, V. F. Kispersky, J. Jelic, W. N. Delgass, F. H. Ribeiro, R. J. Meyer and J. T. Miller, Phys. Chem. Chem. Phys., 2010, 12, 5678–5693 RSC.
- M. Boronat, P. Concepción and A. Corma, J. Phys. Chem. C, 2009, 113, 16772–16784 CrossRef CAS.
- Z. Wu, Y. Cheng, F. Tao, L. Daemen, G. S. Foo, L. Nguyen, X. Zhang, A. Beste and A. J. Ramirez-Cuesta, J. Am. Chem. Soc., 2017, 139, 9721–9727 CrossRef CAS PubMed.
- I. P. Silverwood, S. M. Rogers, S. K. Callear, S. F. Parker, C. R. A. Catlow, D. Andreeva, J. El Fallah, L. Hilaire, F. Le Normand, E. Quemere, G. N. Sauvion and O. Touret, Chem. Commun., 2016, 52, 533–536 RSC.
- R. Juárez, S. F. Parker, P. Concepción, A. Corma and H. García, Chem. Sci., 2010, 1, 731–738 RSC.
- A. H. Clark, K. A. Beyer, S. Hayama, T. I. Hyde and G. Sankar, Chem. Mater., 2019, 31, 7744–7751 CrossRef CAS.
- E. Grüneisen, Ann. Phys., 1912, 344, 257–306 CrossRef.
- S. Diaz-Moreno, S. Hayama, M. Amboage, A. Freeman, J. Sutter and G. Duller, J. Phys.: Conf. Ser., 2009, 190, 012038 CrossRef.
- H. K. D. Nguyen, G. Sankar and R. A. Catlow, J. Porous Mater., 2017, 24, 421–428 CrossRef CAS.
- M. Basham, J. Filik, M. T. Wharmby, P. C. Y. Chang, B. El Kassaby, M. Gerring, J. Aishima, K. Levik, B. C. A. Pulford, I. Sikharulidze, D. Sneddon, M. Webber, S. S. Dhesi, F. Maccherozzi, O. Svensson, S. Brockhauser, G. Náray and A. W. Ashton, J. Synchrotron Radiat., 2015, 22, 853–858 CrossRef PubMed.
- J. Filik, A. W. Ashton, P. C. Y. Chang, P. A. Chater, S. J. Day, M. Drakopoulos, M. W. Gerring, M. L. Hart, O. V. Magdysyuk, S. Michalik, A. Smith, C. C. Tang, N. J. Terrill, M. T. Wharmby and H. Wilhelm, J. Appl. Crystallogr., 2017, 50, 959–966 CrossRef CAS PubMed.
- X. Yang, P. Juhas, C. L. Farrow and S. J. L. Billinge, 2014, arXiv:1402.3163v3 [cond-mat], https://arxiv.org/abs/1402.3163, accessed 08 29, 2019.
- S. Phokha, S. Pinitsoontorn, P. Chirawatkul, Y. Poo-arporn and S. Maensiri, Nanoscale Res. Lett., 2012, 7, 425 CrossRef PubMed.
- V. Fernandes, I. L. Graff, J. Varalda, L. Amaral, P. Fichtner, D. Demaille, Y. Zheng, W. H. Schreiner and D. H. Mosca, J. Electrochem. Soc., 2011, 159, K27–K33 CrossRef.
- T. S. Wu, Y. Zhou, R. F. Sabirianov, W. N. Mei, Y. L. Soo and C. L. Cheung, Chem. Commun., 2016, 52, 5003–5006 RSC.
- H. R. Marchbank, A. H. Clark, T. I. Hyde, H. Y. Playford, M. G. Tucker, D. Thompsett, J. M. Fisher, K. W. Chapman, K. A. Beyer, M. Monte, A. Longo and G. Sankar, ChemPhysChem, 2016, 17, 3494–3503 CrossRef CAS PubMed.
- C. Paun, O. V. Safonova, J. Szlachetko, P. M. Abdala, M. Nachtegaal, J. Sa, E. Kleymenov, A. Cervellino, F. Krumeich and J. A. Van Bokhoven, J. Phys. Chem. C, 2012, 116, 7312–7317 CrossRef CAS.
- A. V. Soldatov, T. S. Ivanchenko, S. Della Longa, A. Kotani, Y. Iwamoto and A. Bianconi, Phys. Rev. B: Condens. Matter Mater. Phys., 1994, 50, 5074–5080 CrossRef CAS PubMed.
- C. L. Farrow, P. Juhas, J. W. Liu, D. Bryndin, E. S. Boin, J. Bloch, T. Proffen and S. J. L. Billinge, J. Phys.: Condens. Matter, 2007, 19, 335219 CrossRef CAS PubMed.
- T. Hisashige, Y. Yamamura and T. Tsuji, J. Alloys Compd., 2006, 408–412, 1153–1156 CrossRef CAS.
- S. Sameshima, M. Kawaminami and Y. Hirata, J. Ceram. Soc. Jpn., 2002, 110, 597–600 CrossRef CAS.
- D. G. Isaak, O. L. Anderson and H. Oda, Phys. Chem. Miner., 1992, 19, 10–120 CrossRef.
- I. Suzuki and O. L. Anderson, J. Phys. Earth, 1983, 31, 125–138 CrossRef.
- A. Nakatsuka, M. Shimokawa, N. Nakayama, O. Ohtaka, H. Arima, Ma. Okube and A. Yoshiasa, Am. Mineral., 2011, 96, 1593–1605 CrossRef CAS.
- A. Dewaele, P. Loubeyre and M. Mezouar, Phys. Rev. B: Condens. Matter Mater. Phys., 2004, 70, 094112 CrossRef.
- E. S. Božin, V. Petkov, P. W. Barnes, P. M. Woodward, T. Vogt, S. D. Mahanti and S. J. L. Billinge, J. Phys.: Condens. Matter, 2004, 16, S5091 CrossRef.
- K. Sadaiyandi, Mater. Chem. Phys., 2009, 115, 703–706 CrossRef CAS.
- A. Balerna and S. Mobilio, Phys. Rev. B: Condens. Matter Mater. Phys., 1986, 34, 2293–2298 CrossRef CAS PubMed.
- Y. D. Qu, X. L. Liang, X. Q. Kong and W. J. Zhang, Phys. Met. Metallogr., 2017, 118, 528–534 CrossRef CAS.
- S. Xiong, S. Y. Lee and I. C. Noyan, J. Appl. Crystallogr., 2019, 52, 262–273 CrossRef CAS.
- D. S. Q. Jiang, L. H. Liang and D. S. Zhao, J. Phys. Chem. B, 2001, 105, 6275–6277 CrossRef.
- I. Jacob, A. Wolfy and M. H. Y. Mintz, Solid State Commun., 1981, 40, 877–879 CrossRef CAS.
- M. Manzoli, A. Chiorino, F. Vindigni and F. Boccuzzi, Catal. Today, 2012, 181, 62–67 CrossRef CAS.
Footnote |
| † Electronic supplementary information (ESI) available. See DOI: 10.1039/d0cp00455c |
| This journal is © the Owner Societies 2020 |