Chemical ionization of glyoxal and formaldehyde with H3O+ ions using SIFT-MS under variable system humidity
Received
17th January 2020
, Accepted 14th April 2020
First published on 29th April 2020
Abstract
Glyoxal (C2H2O2) is a highly reactive molecule present at trace levels in specific gaseous environments. For analyses by chemical ionization mass spectrometry, it is important to understand the gas-phase chemistry initiated by reactions of H3O+ ions with C2H2O2 molecules in the presence of water vapour. This chemistry was studied at variable humidity using a selected ion flow tube, SIFT. The initial step is a proton transfer reaction forming protonated glyoxal C2H3O2+. The second step, in the presence of water vapour, is the association forming C2H3O2+(H2O) and interestingly also protonated formaldehyde CH2OH+. Hydrated protonated formaldehyde CH2OH+(H2O) was also observed. Relative signals of these four ionic products were studied at the end of the flow tube where the reactions took place during 0.3 ms in helium carrier gas (1.5 mbar, 300 K) as the water vapour number density varied up to 1014 cm−3. The data were interpreted using numerical kinetics modelling of the reaction sequences and the mechanisms and kinetics of the reaction steps were characterised. The results thus facilitate SIFT-MS analyses of glyoxal in humid air whilst drawing attention to ion overlaps with formaldehyde products.
1 Introduction
Glyoxal (C2H2O2) is the simplest dialdehyde. It can polymerize from an anhydrous monomeric form into a series of oligomers and its vapour is highly reactive, contributing to aerosol formation.1,2 Glyoxal plays a role in biological processes; it is known to be a cytotoxic metabolite of glucose, a product of lipid peroxidation and a marker of oxidation stress.3 In addition, recent studies have shown that glyoxal is an intermediate product in the photocatalytic reduction of carbon dioxide to methane.4,5 It is noteworthy that organic molecules present in the Earth's atmosphere can be transformed into glyoxal by oxidation or photo-oxidation.6 Such processes were observed for toluene,7–9 xylene,8–10 trimethylbenzene,9,10 isoprene11 and α-pinene.12 Daytime atmospheric glyoxal chemistry involves oxidation and may lead to the formation of secondary organic aerosols.13
Chemical ionization mass spectrometry (CIMS) is a useful tool for the detection of glyoxal since the high reactivity and short lifetime of glyoxal impede the use of gas chromatography (GC) techniques. Nölscher et al. measured the total OH reactivity of tropical forest air and compared it to the reactivity expected from volatile organic compounds (VOCs) determined via proton-transfer-reaction mass spectrometry (PTR-MS).14 The measured OH reactivity exceeded the calculated values, indicating that either PTR-MS underestimated VOC concentrations or that not all relevant species were accounted for. This can also be caused by the different OH reactivity of isomers (which cannot be separated by PTR-MS) or the presence of molecules with high reactivity and low proton affinity (PA) compared to the PA of water (protonated water, H3O+, is the most common reagent ion in PTR-MS).
The PA of glyoxal was previously estimated by HF and DFT calculations to be 675 kJ mol−1 and 690 kJ mol−1, respectively.15 Since the PA is very similar to the PA of water (691 kJ mol−1),16 proton transfer from hydronium (H3O+) ions may not proceed at a collisional rate.17 In addition, the reverse reaction could also take place:
| | | H3O+ + C2H2O2 ↔ C2H3O2+ + H2O. | (1) |
CIMS analysis of atmospheric glyoxal can be further hampered by isobaric molecules,
e.g. acetone or propanal. These are typically present at much higher concentrations, causing signal overlaps. Understanding the ion chemistry may help to distinguish these isobars.
Michel et al.18 previously studied reaction (1) using a selected ion flow tube (SIFT). The reported rate coefficient of 1.9 × 10⁻⁹ cm3 s−1 is between the collisional values of the two isomers trans-glyoxal (1.3 × 10⁻⁹ cm3 s−1) and cis-glyoxal (4.9 × 10⁻⁹ cm3 s−1). In this study, C2H3O2+ was found to decrease with increasing concentration of water vapour in the flow tube whilst protonated glyoxal hydrates did not increase in concentration and minority product ions CH2OH+ (m/z 31) and CH2OH+H2O (m/z 49) appeared. An increase in glyoxal ion concentration led to the increase of hydrated hydronium ions (H3O+H2O, m/z 37), presumably due to ligand switching reactions. The authors of a reported study18 concluded that:
“Further experiments are needed to unravel the complex H3O+/glyoxal chemistry in the presence of water vapour”.
A subsequent study19 with O2+ and NO+ reagent ions revealed that a combination of NO+ and H3O+ reagent ions is required to unravel individual concentrations of acetone, propanal and glyoxal.
In a recent PTR-MS study,20 CH2OH+ was also observed in addition to C2H3O2+. The ratio of these ions changed, with less CH2OH+ produced at increasing water vapour concentrations in the drift tube. The authors excluded the presence of neutral formaldehyde in the reagent mixture but did not discuss the mechanism leading to the formation of protonated formaldehyde. This unusual formation of CH2OH+ is a particularly interesting ion chemistry phenomenon. In the SIFT, it increases with water vapour concentration while in PTR-MS it decreases. It is thus important to get insight into the sequences of ion–molecule reactions that can be responsible for this effect.
Thus, we have carried out a detailed SIFT study with the aim to elucidate the influence of humidity on the glyoxal hydronium ion-chemistry. The experimental study was supplemented with the theoretical modelling of ion chemistry considering a sequence of individual ion–molecule reactions. We further studied the ion chemistry of formaldehyde under the same conditions to correctly account for the individual secondary reactions.
2 Experimental
2.1 Materials
Glyoxal was prepared from a 40% glyoxal solution (Sigma-Aldrich) using a method similar to the isolation from glyoxal trimeric dehydrate.18–21 10 ml of glyoxal solution was placed into a 250 ml flask and evacuated for 24 hours to remove the bulk of water. The resulting high viscose residuum was crystallised to bis(dioxolane) trimer.1 Crystals were crushed and covered by a layer of P2O5 (Sigma-Aldrich), separated by a 1 cm layer of 1 mm glass beads, to remove any remaining water, and slowly heated up to 150 °C until the yellow-green vapour characteristic for glyoxal appeared by thermal decomposition.22,23 Glyoxal vapour was re-crystalized in a cold trap, and cooled by dry ice. The glyoxal crystals were stored in a dry ice cooled box to minimise exposure to atmospheric water vapour.
Formaldehyde was prepared by heating a closed vial containing paraformaldehyde powder (Sigma-Aldrich) up to 150 °C. 9 ml of the released formaldehyde vapour was injected into an ∼4 l Nalophan bag, filled with synthetic air (Messer).
2.2 Selected ion flow tube, SIFT
A Profile 3 SIFT-MS instrument (Instrument Science, Crewe, UK, see Fig. 1)24–26 was used for the ion-chemistry study. Since SIFT-MS is described in detail in the literature, only a brief summary will be given here. A variety of reagent ions (H3O+, NO+ or O2+˙) is generated by the introduction of a water vapour/air mixture into a microwave discharge. Reagent ions are selected by a quadrupole mass filter and injected into the 5 cm long flow tube through which a He carrier gas flow was established (p = 1.5 mbar, T = 300 K). The neutral reactant gas mixture is injected at a known flow rate into the flow tube, where the ion–molecule reactions take place. Ions are subsequently separated using a quadrupole mass spectrometer and detected via a single channel electron multiplier (SCEM).
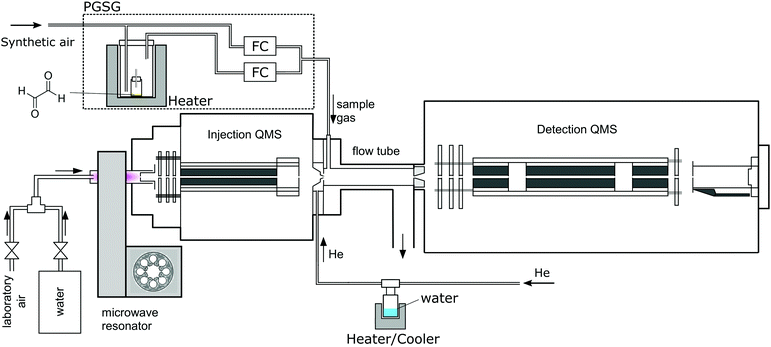 |
| | Fig. 1 Scheme of the experimental setup including a PGSG and a SIFT-MS instrument. | |
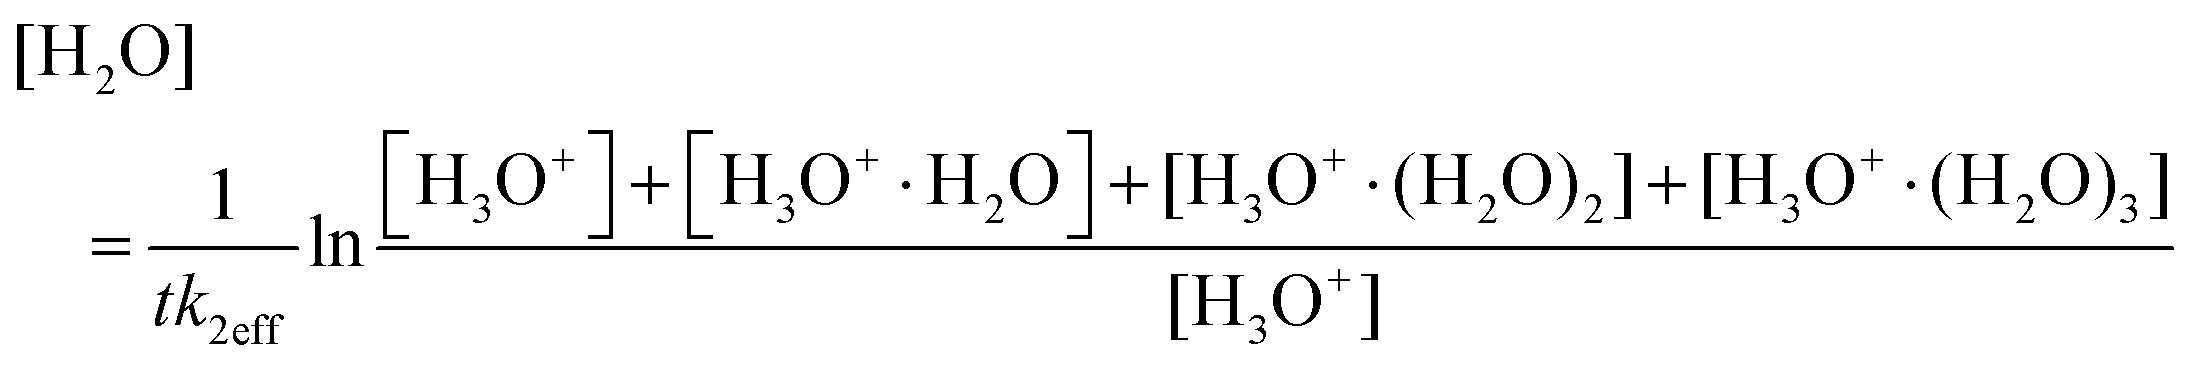
For glyoxal experiments, 2 mg of glyoxal crystals were placed into a 2 ml glass vial closed by a septum penetrated by a 5 cm long polyether ether ketone capillary (I.D. 0.25 mm), in a diffusion tube configuration.27 A precision gas standard generator (PGSG; 491M, Kin-Tek) was used at 50 °C to release glyoxal vapour and dilute it with synthetic air to reach the concentration of 15 ppmv, which was then introduced into the flow tube. The humidity of the carrier gas was varied using a reservoir containing 5 ml of water connected to the supply line, thus avoiding the interaction of water with glyoxal prior to its introduction to the SIFT. The water reservoir temperature was slowly increased from −78.5 °C to 60 °C, releasing H2O number densities in 1.5 mbar of He between 4 × 10¹² and 1014 cm−3 (corresponding to 0.3% to 7.5% sample humidity at a typical SIFT-MS sample flow). To study the influence of He carrier gas on the ion distribution, we varied the flow tube pressure from 0.5 to 2 mbar. Measurements were then carried out at two different water concentrations: H = 0.03 (3 × 1012 cm−3) and H = 0.08 (1 × 1013 cm−3), see (4), estimated under standard experimental conditions.
For formaldehyde experiments, a 4 l Nalophan bag containing 5 ppmv formaldehyde vapour in synthetic air was used. Humidity was varied by adding a few millilitres of water at room temperature.
The water vapour concentration in the flow tube was determined from the association reactions of (hydrated) H3O+ ions with H2O molecules,
| | | H3O+(H2O)n−1 + H2O + He ↔ H3O+(H2O)n + He | (2) |
where
n ≥ 1. The H
2O number density in the flow tube [H
2O] was calculated as
| | 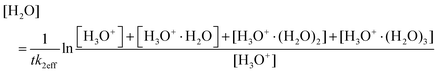 | (3) |
where
k2eff is the rate coefficient for
reaction (2) (
n = 1),
t is the reaction time, and the symbols in brackets correspond to respective ion count rates. Ion count rates were corrected for mass discrimination and for differential diffusion.
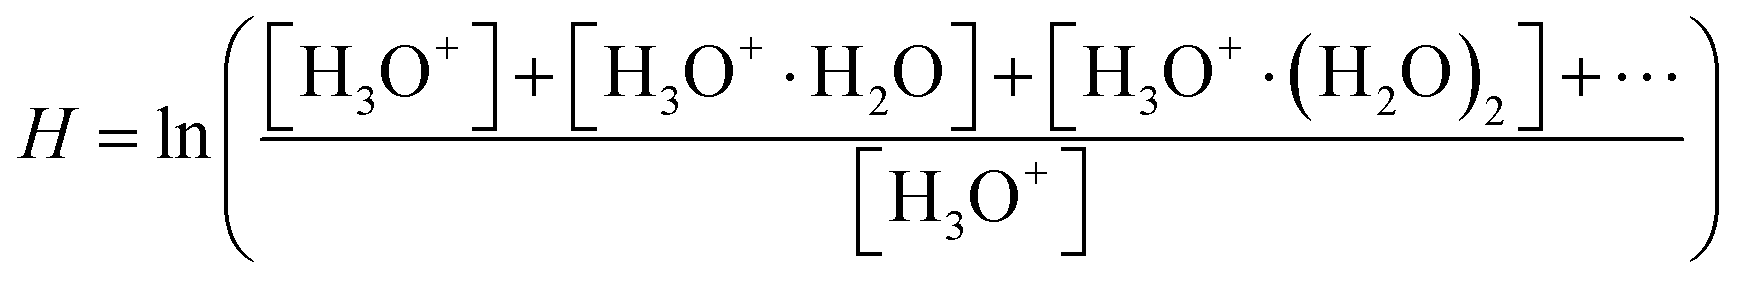
28 To compare the experimental results with the numerical model, it is useful to use the dimensionless logarithmic factor
| | 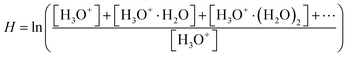 | (4) |
as a relative measure of water vapour concentration.
2.3 Numerical model KIMI
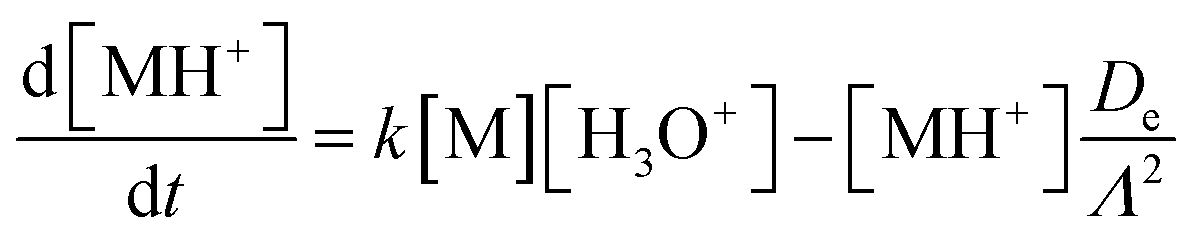
To model the ion-chemistry kinetics in a flow tube, we developed the Kinetics of Ion Molecular Interaction software (KIMI; using the Microsoft Visual Studio 2017, NET Framework 4.6.1). KIMI interactively solves sets of kinetic equations that describe the change in reagent and product ion concentrations along the axis of the flow tube and thus model ion concentrations at the end of the flow tube as a function of the reactant concentrations.
The input for the model is generated from a graphical interface that allows drawing reaction pathways and systems involving multiple ionic species. Each species has a defined initial concentration and each reaction path is described by a rate constant k. In addition, diffusion losses of ions are characterised by diffusion coefficients, De,29 and the characteristic radial diffusion length Λ. Concentrations of all species in the reaction system are calculated by solving a set of time dependent differential equations, exemplified by the proton transfer reaction
| |  | (5) |
using the Runge–Kutta method.
30,31 In the SIFT, the time coordinate directly corresponds to the axial position due to a constant ion velocity
vi, estimated from the carrier gas velocity
vg as
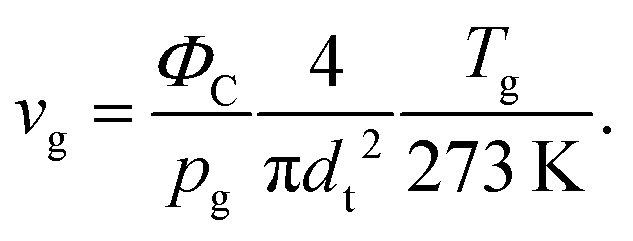
32vg can be calculated from the carrier gas flow rate,
ΦC, its pressure,
pg, temperature,
Tg (in K) and the internal flow tube diameter
dt as
| | 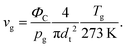 | (7) |
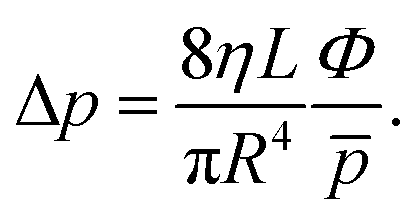
Tg is assumed to be in equilibrium with the flow tube (usually around 300 K). The pressure is measured at the end of the flow tube. The pressure inside the flow tube is somewhat higher due to its finite conductivity according to the Hagen–Poiseuille equation
| |  | (8) |
Under conditions of the experiments (
p = 1.5 mbar,
T = 300 K,
Φ = 880 sccm,
L = 5 cm, flow tube radius
R = 0.5 cm, and the dynamic viscosity of He
η = 2 × 10
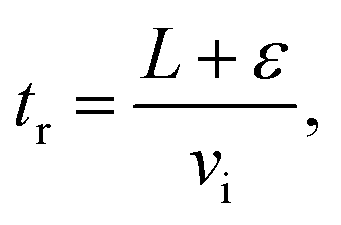
−5 Pa s at 300 K), the pressure difference is about 0.3 mbar. To estimate the average flow tube pressure, the measured pressure was thus increased by 0.15 mbar. The total flow rate was measured for several values of pressure in the flow tube. Under typical conditions, the gas bulk velocity according to
(7) is equal to 105 m s
−1 and thus the ion velocity calculated from
(6) is 157.5 m s
−1. The reaction time for the reaction length
L = 4 cm corrected by a positive “end correction”
32ε = 0.5 cm
| |  | (9) |
is thus 286 μs.
3 Results and discussion
3.1 Experimental observations in the SIFT
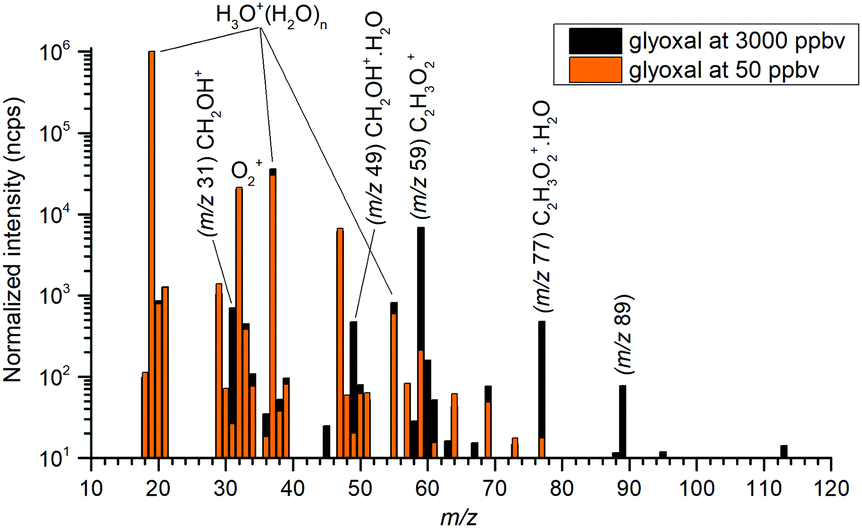
The mass spectra (see Fig. 2) showed protonated glyoxal (C2H3O2+, m/z 59) and its water cluster (C2H3O2+(H2O), m/z 77). The second water cluster (C2H3O2+(H2O)2, m/z 95) appeared only at higher water vapour concentrations. The ion at m/z 31, protonated formaldehyde (CH2OH+),20 was also observed together with its water cluster (CH2OH+(H2O), m/z 49). A small signal at m/z 89 corresponds to the association of protonated formaldehyde and glyoxal (CH2OH+·C2H2O2).
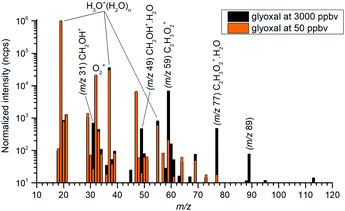 |
| | Fig. 2 Mass spectra of products of H3O+ reaction with glyoxal, normalized to 106 H3O+ reagent ions. Glyoxal concentrations are indicated by bar colour. The data were obtained for the lowest attainable water vapour concentration H = 0.03 (3 × 1012 cm−3). | |
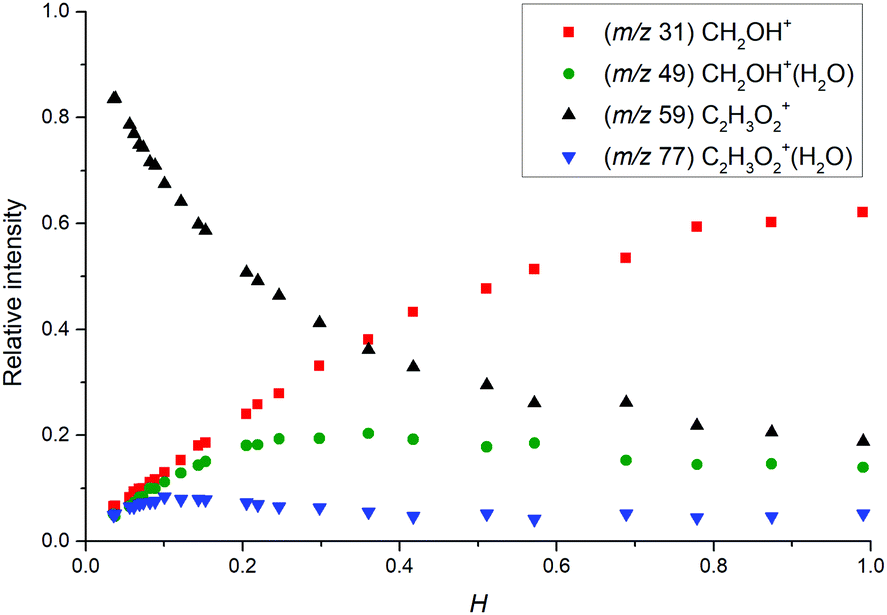
The change in the relative intensities of product ions as a function of relative water vapour concentration H is shown in Fig. 3. For the lowest humidity (H < 0.1), protonated glyoxal was dominant (>85%). With increasing humidity H > 0.4, protonated formaldehyde concentration rose and became dominant. It is interesting that both hydrated formaldehyde (m/z 49) and hydrated glyoxal (m/z 77) concentration remained below 20%. Water vapour thus removes the glyoxal containing ions and leads to the production of formaldehyde containing ions. This is in stark contrast to analogous acetone ion chemistry that is well understood to terminate under the same conditions in water cluster ions at m/z 77 and m/z 95.33
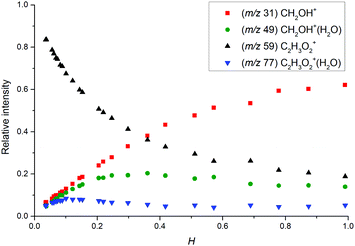 |
| | Fig. 3 Change in the relative intensities of product ions of the reaction of H3O+ with glyoxal for different carrier gas humidity. | |
Fig. 3 indicates that protonated formaldehyde is formed when H3O+ ions react with C2H2O2 at 300 K in the presence of water molecules, without requiring additional collision energy. Glyoxal and formaldehyde have PA(C2H2O2) = 675 to 690 kJ mol−1![[thin space (1/6-em)]](https://www.rsc.org/images/entities/char_2009.gif) 15 and PA(H2CO) = 713 kJ mol−1,16 both close to the PA of water, PA(H2O) = 691 kJ mol−1,16 but much lower than the PA of the water dimer, PA((H2O)2) = 808 kJ mol−1.34 Therefore, proton transfer is only possible from H3O+ (1) but not from H3O+(H2O)1,2,3.
15 and PA(H2CO) = 713 kJ mol−1,16 both close to the PA of water, PA(H2O) = 691 kJ mol−1,16 but much lower than the PA of the water dimer, PA((H2O)2) = 808 kJ mol−1.34 Therefore, proton transfer is only possible from H3O+ (1) but not from H3O+(H2O)1,2,3.
Protonated formaldehyde was not observed in the absence of H2O and thus must be formed in a secondary reaction of protonated glyoxal with water
| | | C2H3O2+ + H2O → H2COH+ + HCOOH. | (10) |
Alternatively, a reaction sequence can occur where an intermediate glyoxal water cluster may be formed by a ligand switching reaction
| | | H3O+(H2O) + C2H2O2 → C2H3O2+(H2O) + H2O. | (11) |
It is also possible that the intermediate glyoxal water cluster is formed by a three-body association reaction
| | | C2H3O2+ + H2O + He → C2H3O2+(H2O) + He. | (12) |
Reaction (11) and (12) may then yield protonated formaldehyde
via dissociation in a further reaction with H
2O
| | | C2H3O2+(H2O) + H2O → CH2OH+ + HCOOH + H2O. | (13) |
Energetics of
reactions (10)–(13) were calculated using the B3LYP/6-311G(p,d) level of theory in the Gaussian 09 software package as the change in the sum of the electronic and thermal free energies between optimized geometries of all reactants and products. According to this theory,
reaction (10) is exergonic, Δ
G = −64.81 kJ mol
−1, while
reaction (13) is endergonic, Δ
G = 43.85 kJ mol
−1. However, this can be overcome by internal excitation of the product C
2H
3O
2+(H
2O) of the highly exergonic
reaction (12), Δ
G = −108.66 kJ mol
−1. Such excitation is unlikely for the endergonic
reaction (11) (Δ
G = 31.4 kJ mol
−1). This set of possible reactions leading to the formation of protonated formaldehyde was numerically modelled to match the experimental data (see below in Section 3.2).
Additional data were also obtained for the NO+ and O2+˙ reactions with C2H2O2. It was observed that the NO+ reaction with glyoxal proceeds via charge transfer forming C2H2O2+˙ (m/z 58) and via association forming C2H2O2NO+ (m/z 88). For H ∼ 0.04, the relative abundance ratio was 0.3 for C2H2O2+˙ and 0.7 for C2H2O2NO+. For higher humidity (H > 0.4), C2H2O2NO+ was dominant (>0.95). O2+˙ reacts by charge transfer, forming C2H2O2+˙ (m/z 58); humidity did not have a significant effect and, interestingly, the CHO+ fragment (present in the electron ionisation mass spectra44) was not observed.
3.2 Numerical simulation of ion chemistry
3.2.1 Distribution of reagent ions.
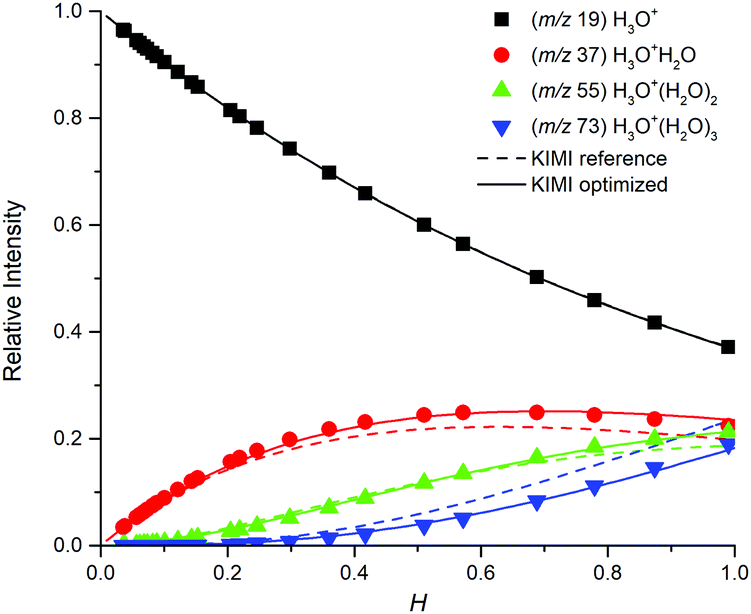
The H3O+ reagent ions form H3O+(H2O)1,2,3 in a sequence of three-body association reactions (2) with H2O in helium.37 The rate coefficients for these reactions obtained in previous studies are given in Table 1. The distribution of H3O+(H2O)1,2,3 in the SIFT is affected by the presence of O2 and N2 molecules; in the present experiment, 5% of the carrier gas. A trace amount of an organic sample (glyoxal or formaldehyde) does not affect the distribution. Effective values of kw1,2,3,4 under experimental conditions presented herein (p = 1.5 mbar, T = 300 K, [H2O] ≅ 1012–1014 cm−3, [He] = 3.62 × 1016 cm−3) were derived by fitting the data shown in Fig. 4 and are given in Table 2. These k values were then used for the modelling of formaldehyde and glyoxal ion chemistry.
Table 1 List of the ion–molecule reactions between hydronium ions (H3O+) and water or formaldehyde occurring in the flow tube followed by available rate constants
| Reaction |
Name |
k
|
k
reverse
|
| Nd – no data. From ref. 35 at 296 K. From ref. 36 at 300 K. From ref. 37 at 298 K. From ref. 38 at 298 K. From ref. 39 at 297 K in H2. From ref. 40 at 294 K. From ref. 41 at 300 K. From ref. 42 at 300 K and 0.05 eV kinetic energy. From ref. 43 at 300 K. Rate constants of bimolecular reactions are given in cm3 s−1 and in cm6 s−1 in the case of three-body reactions. |
| Water |
| H3O+ + H2O + He → |
H3O+(H2O) + He |
k
w1
|
6.65 × 10⁻²⁸a |
|
| 7.2 × 10⁻²⁸b |
| 5.8 × 10⁻²⁸c |
| H3O+(H2O) + H2O + He → |
H3O+(H2O)2 + He |
k
w2
|
1.51 × 10⁻²⁷a |
|
| 1.59 × 10⁻²⁷c |
| H3O+(H2O)2 + H2O + He → |
H3O+(H2O)3 + He |
k
w3
|
1.50 × 10⁻²⁷a |
4 × 10⁻¹⁵a |
| 1.73 × 10⁻²⁷c |
| H3O+(H2O)3 + H2O + He → |
H3O+(H2O)4 + He |
k
w4
|
nd |
nd |
|
|
| Formaldehyde |
| H3O+ + CH2O → |
CH2OH+ + H2O |
k
f1
|
3.4 × 10⁻⁹de |
5.6 × 10⁻¹³d |
| 3.3 × 10⁻⁹f |
2.3 × 10⁻¹²h |
| 3.0 × 10⁻⁹gi |
|
| H3O+(H2O) + CH2O → |
CH2OH+(H2O) + H2O |
k
f2
|
3.0 × 10⁻⁹d |
5.3 × 10⁻¹⁰d |
| 2.3 × 10⁻⁹f |
3.5 × 10⁻¹⁰h |
| CH2OH+ + H2O + He → |
CH2OH+(H2O) + He |
k
f3
|
2.3 × 10⁻²⁷g |
|
| 5.7 × 10⁻²⁸h |
 |
| | Fig. 4 Relative distribution of water clusters in the SIFT obtained by KIMI (lines) and SIFT analyses (points) of the glyoxal data set. The ion distribution calculated from literature k (dashed lines, ref. 37) does not fit the data well while the effective values given in Table 2 give good fits. | |
Table 2 List of rate constants (kn, k−n for reverse reactions) relevant to the formation of hydronium clusters as given in the literature and as obtained by fitting the observed distributions in the present formaldehyde and glyoxal experiments
|
K
|
Literature |
Formaldehyde |
Glyoxal |
|
Data added for the initial simulation of the H3O+(H2O)4 cluster with m/z 91.
From ref. 37.
From ref. 35.
|
|
k
w1
|
5.80 × 10⁻²⁸b |
6.80 × 10⁻²⁸ |
7.10 × 10⁻²⁸ |
|
k
w2
|
1.59 × 10⁻²⁷b |
1.59 × 10⁻²⁷ |
1.59 × 10⁻²⁷ |
|
k
w3
|
1.73 × 10⁻²⁷b |
1.40 × 10⁻²⁷ |
1.50 × 10⁻²⁷ |
|
k
w4
|
1.00 × 10⁻²⁸a |
2.50 × 10⁻²⁹ |
3.00 × 10⁻²⁹ |
|
k
w-3
|
4.00 × 10⁻¹⁵c |
4.00 × 10⁻¹⁵ |
4.00 × 10⁻¹⁵ |
|
k
w-4
|
1.00 × 10⁻¹⁵a |
1.00 × 10⁻¹⁵ |
1.00 × 10⁻¹⁵ |
3.2.2 Ion chemistry of formaldehyde.
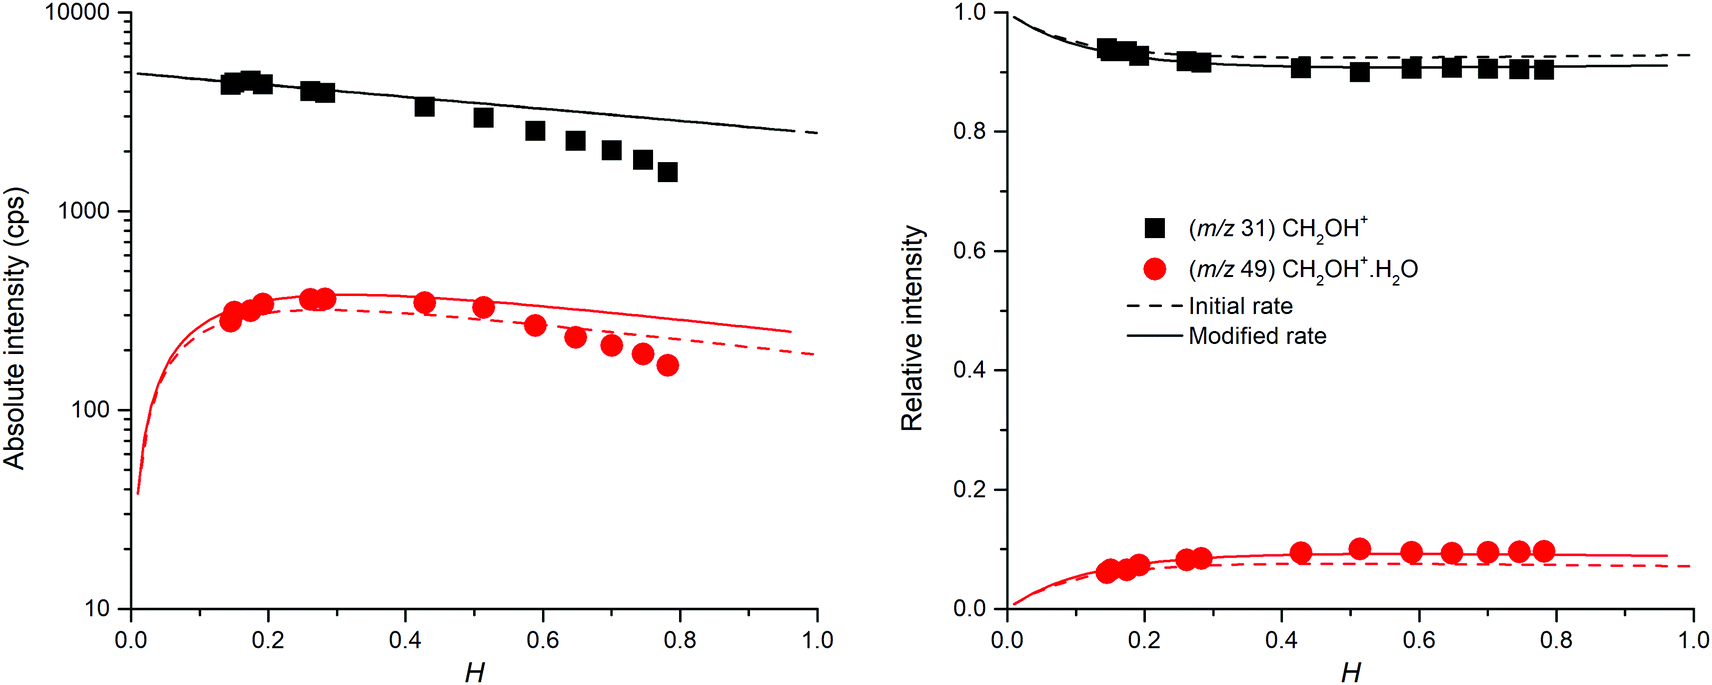
Table 1 summarizes the previous studies of the ion chemistry of formaldehyde.38–43 It is understood that the reverse reaction can take place due to the close PA of water and formaldehyde.45 A protonated formaldehyde water cluster CH2OH+(H2O) can be formed by ligand switching from the hydronium water cluster H3O+(H2O) with reaction rate kf3. As [H2O] ∼ 1013 cm−3 is much greater than [CH2O] ∼ 1010 cm−3 under the typical SIFT conditions, the reaction equilibrium favours the formation of hydronium water clusters H3O+(H2O) even though the process is slightly endothermic. Fig. 5 illustrates experimental and model results based on the literature values and the model results fitted to the data. Note that the absolute intensities of ions decrease faster with H compared to the model prediction; this may be due to the variation of the formaldehyde concentration with time during the experiment. Thus, the fitting was done to the relative ion intensities that are not affected by this instability. The fitted values (kf1 = 3.0 × 10⁻⁹ cm3 s−1, kf2 = 5.7 × 10⁻²⁸ cm6 s−1, kf3 = 3.0 × 10⁻⁹ cm3 s−1, and kf-3 = 4.0 × 10⁻¹⁰ cm3 s−1) were used for the modelling of formaldehyde ion chemistry observed in the glyoxal experiment.
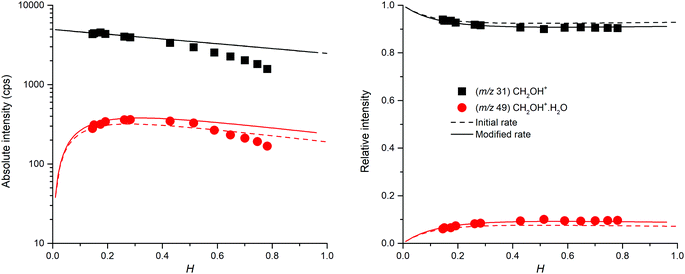 |
| | Fig. 5 Absolute (left) and relative (right) intensities of protonated formaldehyde CH2OH+ and its water cluster CH2OH+(H2O). The dashed line represents the reference set of selected rate constants. | |
3.2.3 Ion chemistry of glyoxal.
Ion kinetics of protonated glyoxal was modelled by considering two possible mechanisms leading to the formation of protonated formaldehyde: (10), or (12) and (13).
We were not able to determine the distribution of vibrational energy and potential barriers of the suggested reactions. Hence, we could not estimate whether the amount of internal energy stored within the association product of reaction (12) is sufficient for reaction (13) to proceed. Thus, the effect of dissociative association was explored numerically, testing whether C2H3O2+(H2O) can be formed in an excited state.
Dissociation may be unimolecular:
| |  | (14a) |
or induced by a collision with water molecules:
| |  | (14b) |
However, C
2H
3O
2+(H
2O)* can also be stabilized by collision with carrier gas or other neutral molecules and thus form a stable cluster similar to a three-body process:
| | | C2H3O2+(H2O)* + He → C2H3O2+(H2O) + He. | (15) |
The initial increase of C
2H
3O
2+(H
2O) concentration with
H observed in the experiments is followed by a slow decrease for
H > 0.15 (see
Fig. 3). The model explains these observations most appropriately by combining
reactions (12) and (13) with rate constants of 10
−27 cm
6 s
−1 and 10
−10 cm
3 s
−1, respectively. However, the data can also be modelled by
reaction (14b), forming a reaction intermediate C
2H
3O
2+(H
2O)* with a rate constant of 10
−10 cm
3 s
−1 followed by its reaction with water molecules at 10
−9 cm
3 s
−1 and
(15) at 10
−11 cm
3 s
−1.
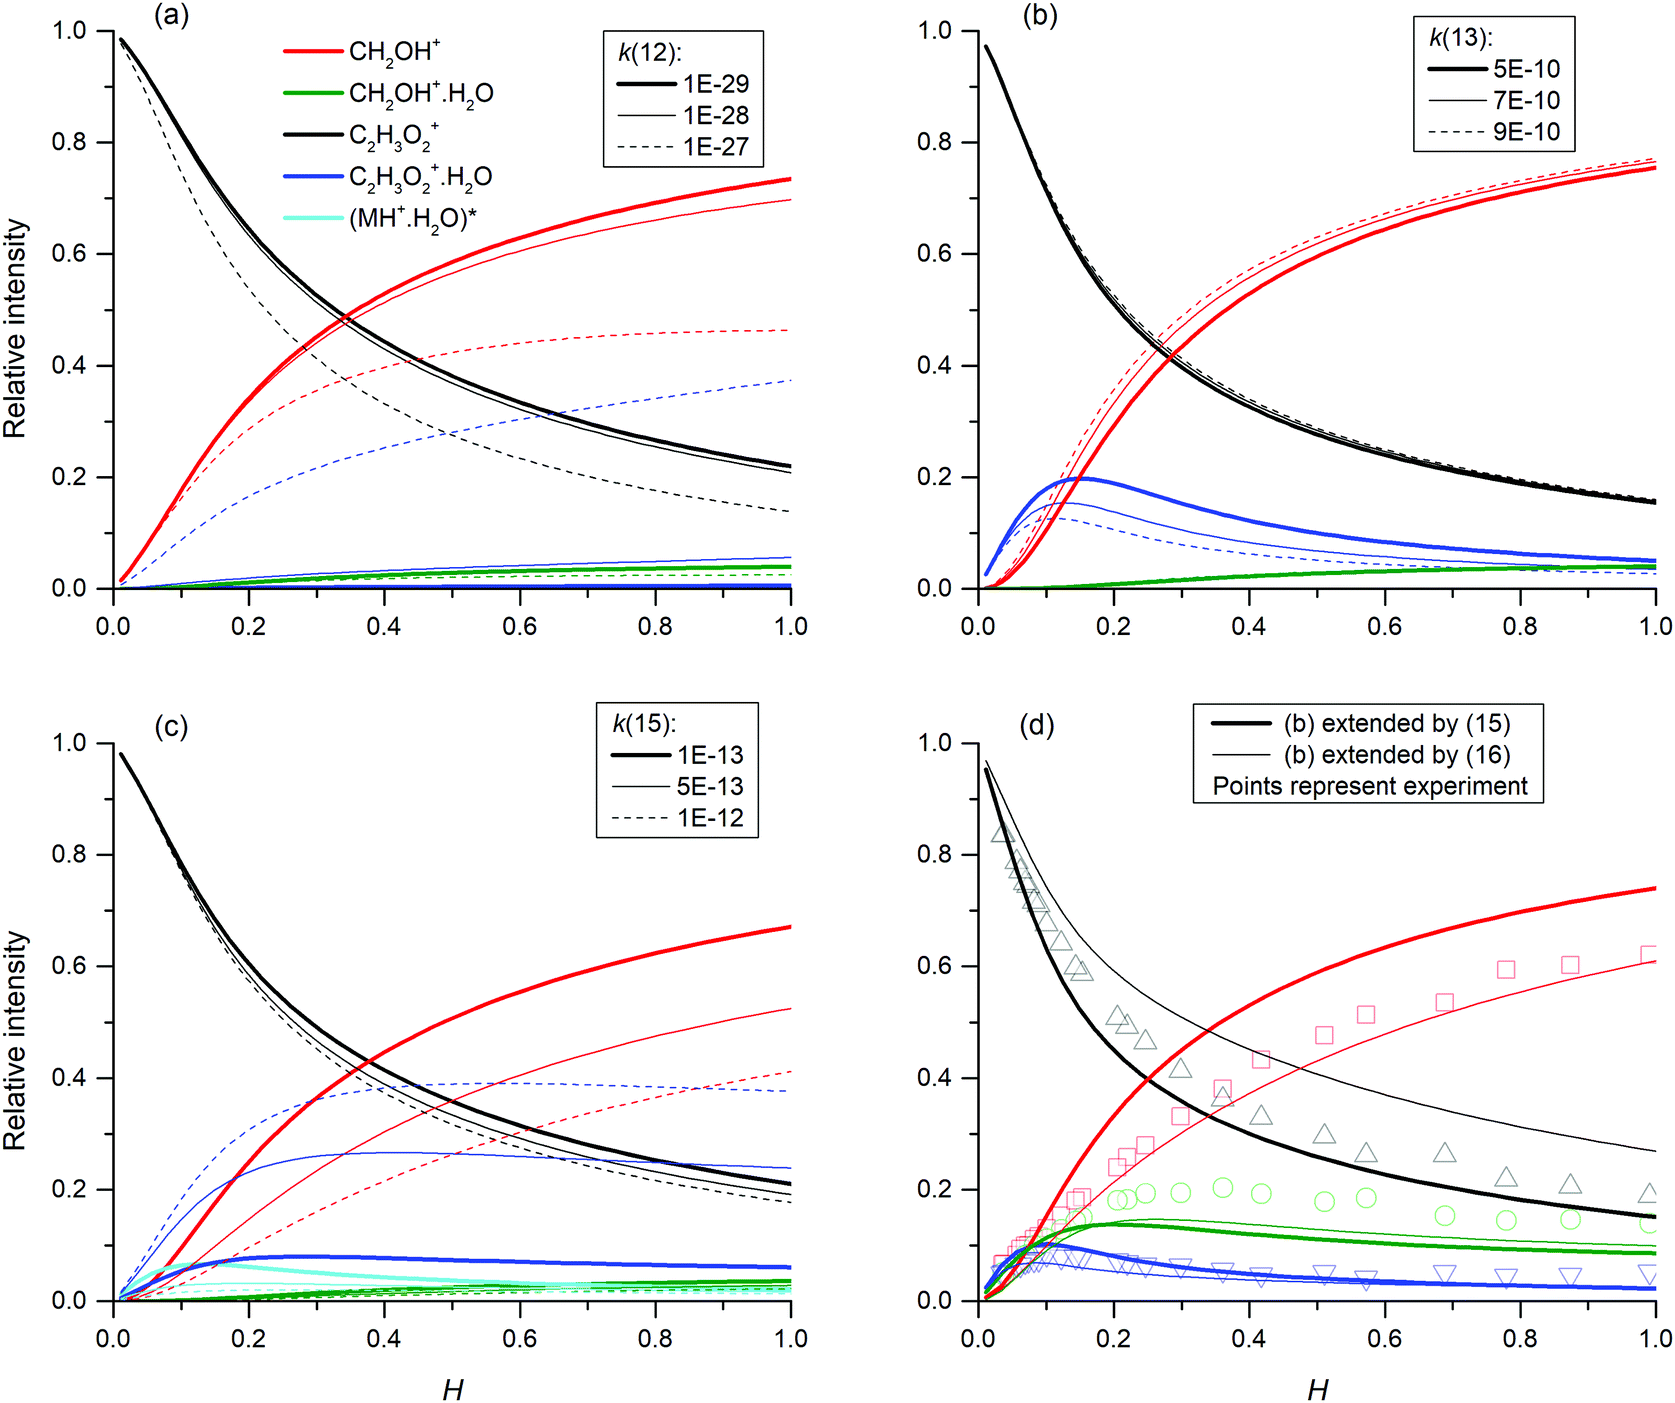
Fig. 6 shows model results for several combinations of rate constants.
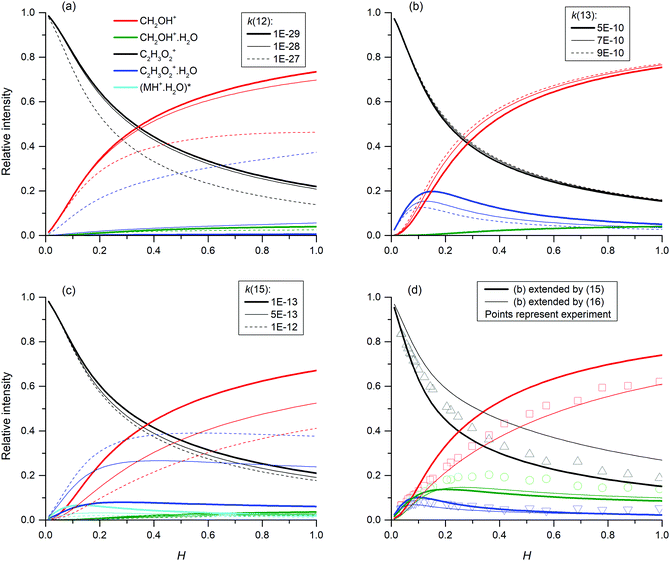 |
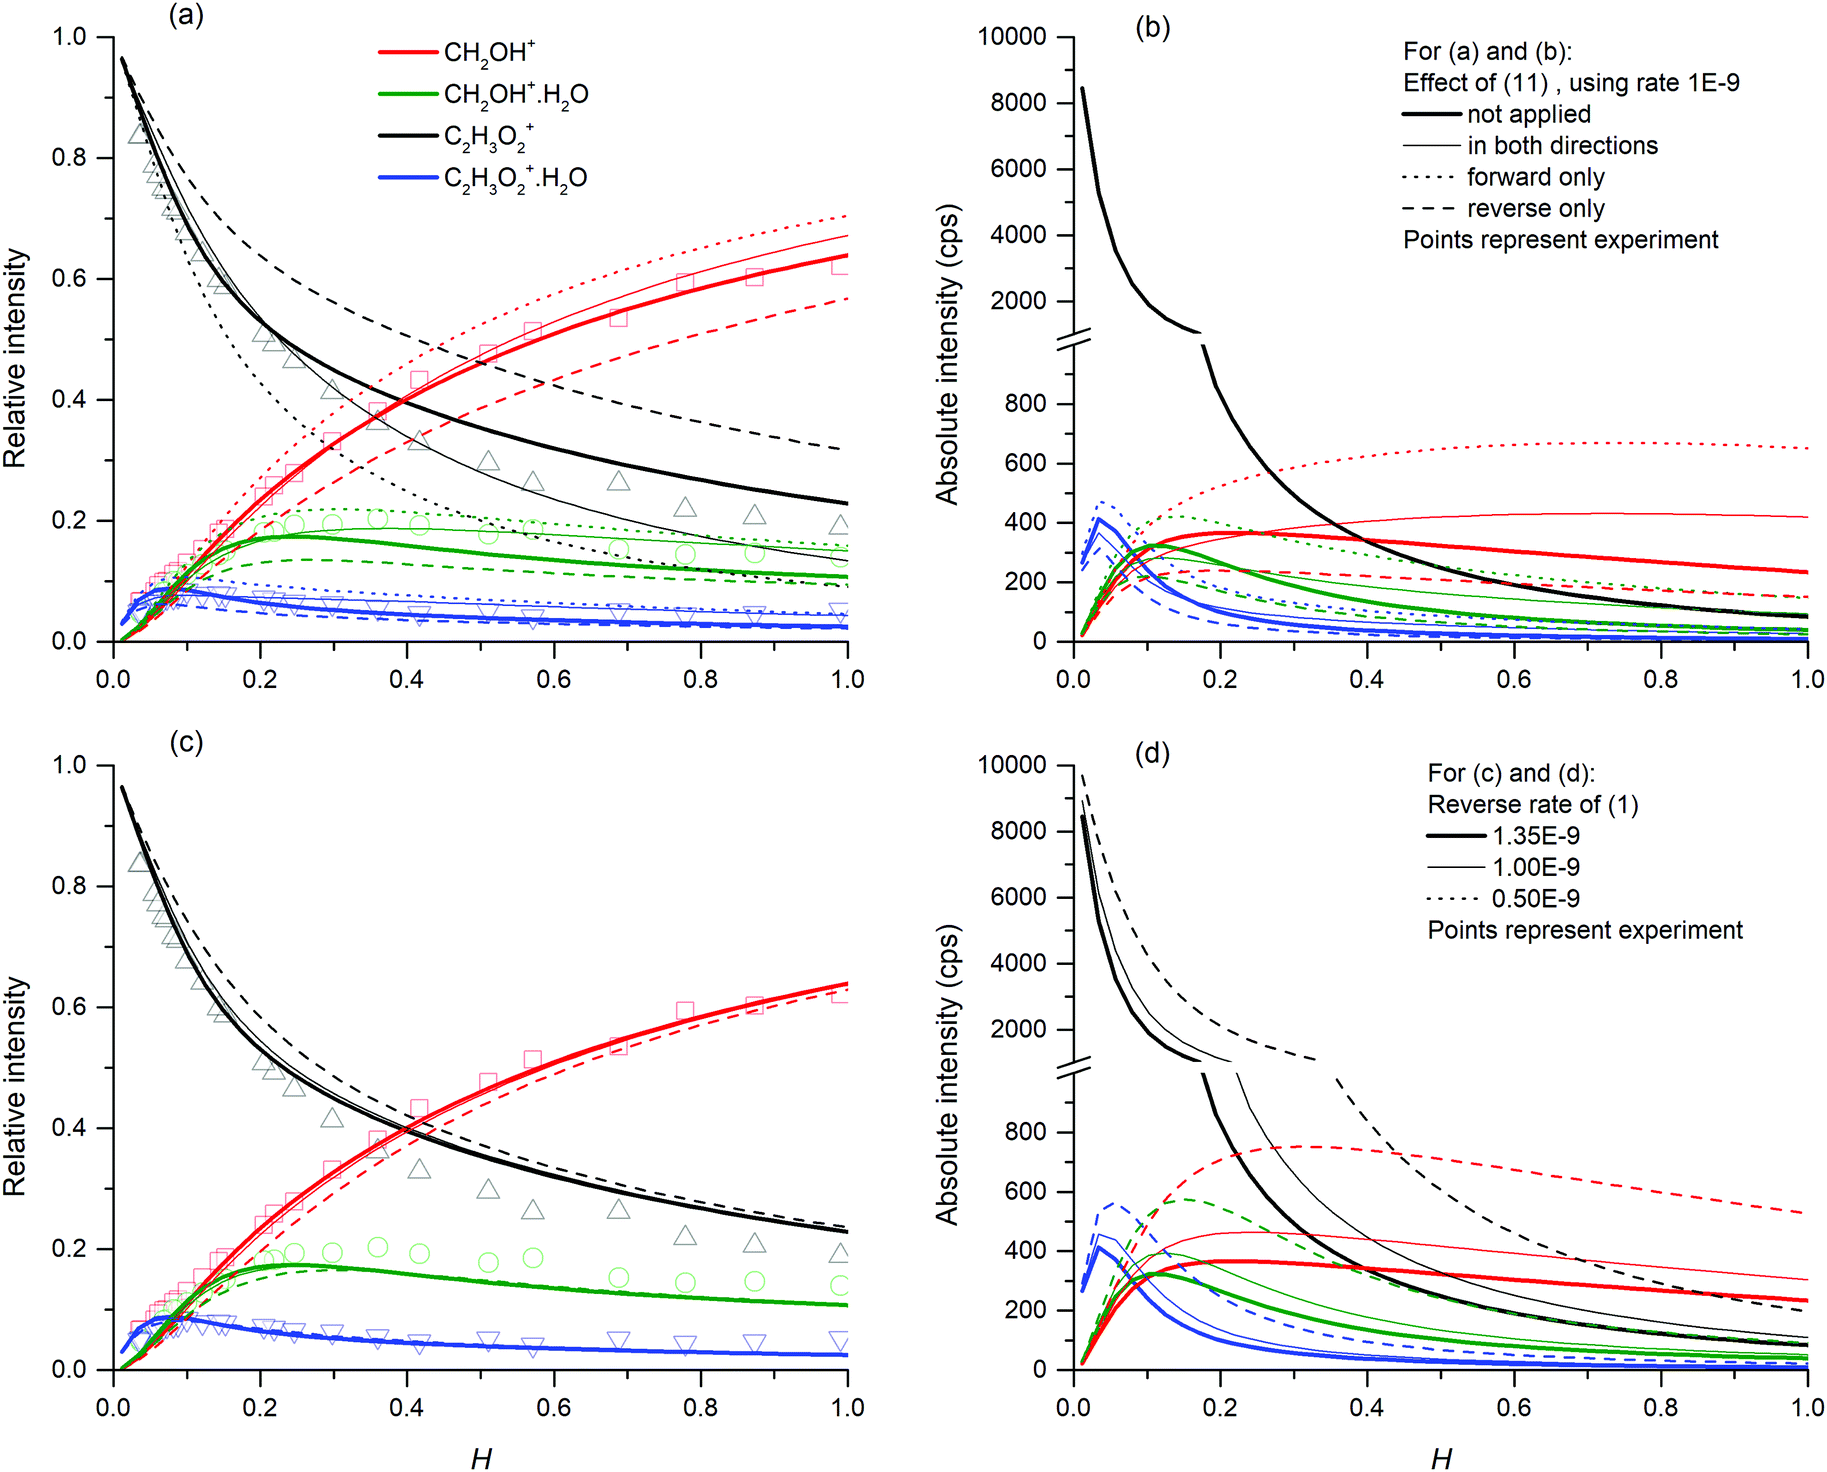
| | Fig. 6 Numerical modelling of possible reaction channels and their influence on relative ion distribution using different reactions and rate constants. In all presented simulations, protonated glyoxal was formed according to (1), using a reaction rate of 1.35 × 10⁻⁹ cm3 s−1 in both directions. (a): reaction (10) fixed at 1 × 10⁻¹⁰ cm3 s−1 and reaction (12) variable (units cm6 s−1) (b): reaction (12) fixed at 3.7 × 10⁻²⁷ cm6 s−1 and reaction (13) variable (units cm3 s−1) (c): reaction sequence (14b) fixed at the association rate 1 × 10⁻¹⁰ cm3 s−1 and the dissociation rate 1 × 10⁻⁹ cm3 s−1 to (15) variable. (units cm3 s−1) (d): reaction (13) at 1 × 10⁻⁹ cm3 s−1 followed by (16) at k = 1 × 10⁻¹⁰ cm3 s−1 (thick lines) and reaction (13) at 0.89 × 10⁻⁹ cm3 s−1 followed by (17) at 1 × 10⁻⁹ cm3 s−1. | |
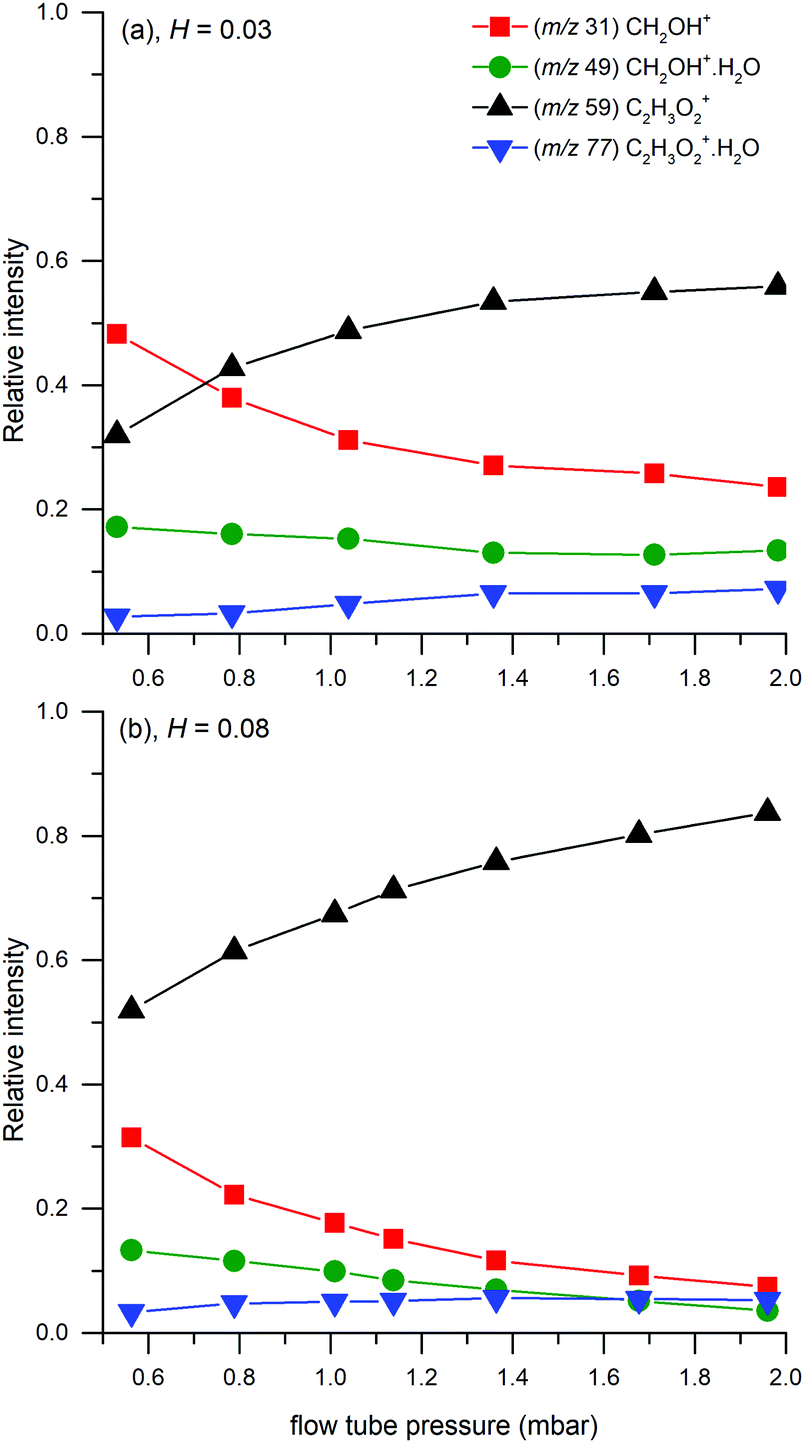
In addition, reactions (12) and (15) were studied under variable flow tube pressure (see Fig. 7) thus changing the He number density. For two different water concentrations, an increase in the carrier gas pressure leads to a decrease in the formation of protonated formaldehyde ions and a slight increase of C2H3O2+(H2O), as expected from (15). However, the water concentration was influenced by He pressure due to different He/H2O mixing ratios and also the diffusion of ions is accelerated at lower pressures. Therefore, these experiments cannot with certainty confirm three-body reactions, however they do not exclude them, either.
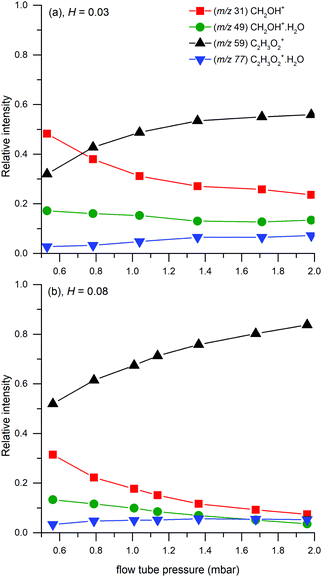 |
| | Fig. 7 Relative ion distribution as a function of the flow tube pressure. Experiments were done at H = 0.03 (3 × 1012 cm−3) for (a) and H = 0.08 (1 × 1013 cm−3) for (b) at 1.5 mbar. | |
The relative intensities of CH2OH+ and CH2OH+(H2O) observed in the glyoxal experiment differ from those observed in the formaldehyde experiment (Section 3.2.2). The association of protonated formaldehyde and water (see kf3 in Table 1) alone cannot explain this observation. An additional reaction channel forming hydrated protonated formaldehyde is therefore required. The following two reaction channels describe the relative intensities observed in the glyoxal experiment:
| | | C2H3O2+ + H2O → H2COH+(H2O) + CO, | (16) |
| | | C2H3O2+(H2O) + H2O → H2COH+(H2O) + HCOOH. | (17) |
Both reactions contribute similarly to the model curve (see
Fig. 5d) using rates of 10
−10 cm
3 s
−1 and 10
−9 cm
3 s
−1 for
(16) and (17), respectively. Based on numerical simulations, we cannot favour one of them and even their simultaneous contribution is possible.
Finally, we have modelled the endothermic ligand switching reaction (11). The high number density of neutral water molecules will shift the equilibrium in the direction of the protonated water dimer. Modelling with different reaction rate constants showed that the reaction does not affect trends in the formation of targeted species. However, it does affect the equilibrium between protonated glyoxal and protonated formaldehyde (see Fig. 8). The ligand switching reaction with water has a significant effect on the total abundance of ions, thus this effect was demonstrated together with the effect of different reaction equilibrium in (1).
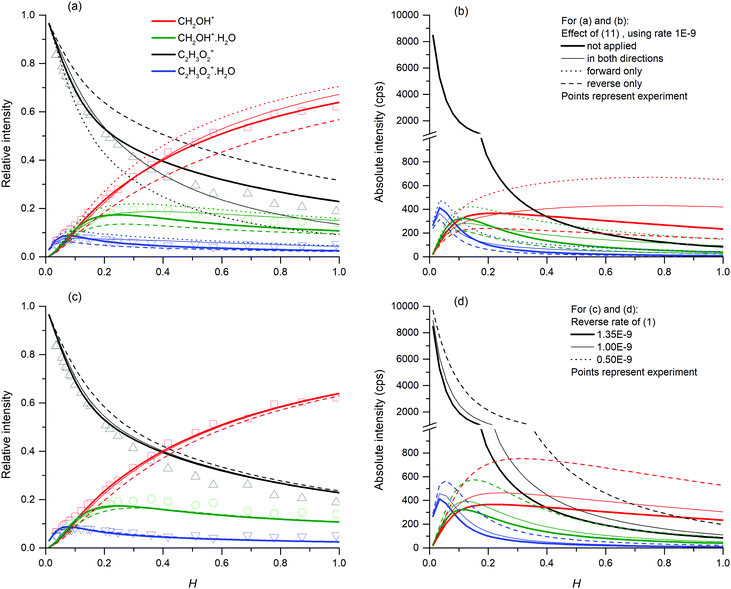 |
| | Fig. 8 Influence of (11) (top) and (1) (bottom) on the relative (left) and absolute (right) concentration of ions at the end of the flow tube. The simulation uses (13) (k = 10−9 cm3 s−1) and (12) (k = 5 × 10⁻²⁷ cm6 s−1) as the main reaction channels combined with (17) (k = 8 × 10⁻¹⁰ cm3 s−1). The demonstration of (11) (top) uses a reverse rate of (1) with k = 1.35 × 10⁻⁹ cm3 s−1. The variation of (1) (bottom) does not contain (11). The absolute scale simulation was provided using 1010 molecules cm−3 glyoxal and 2 × 10⁷ ions per cm3 hydronium particles as an initial condition. | |
The aim of the study was to describe the main reaction channels in the ion chemistry of glyoxal with hydronium in SIFT-MS. The final model of glyoxal ion chemistry consists of thirteen individual kinetic equations, combining the hydronium and formaldehyde ion chemistry given in Table 1 with eqn (1) and (11)–(13) extended by (16) and (17). Even though we carefully considered each rate constant, the final set of rate constants will not be the only solution modelling the experimental observations. It is quite possible that the resulting set can be additionally tuned to better fit the experimental data and the model does not have to be accurate on the absolute scale. Nevertheless, the modelling shows the dramatic effect of neutral water concentration on the ion chemistry of glyoxal.
4 Conclusions
We investigated the H3O+/glyoxal ion chemistry for variable humidity using a SIFT-MS instrument. The study confirmed the secondary formation of protonated formaldehyde with increasing water concentration. For concentrations over 1013 water molecules per cm3 in the flow tube, the protonated formaldehyde became the dominant product ion. The abundance of total product ions was very sensitive to water concentration, quickly decreasing for higher humidity.
The observed experimental behaviour was described using numerical simulation of ion kinetics. An additional study of hydronium water clusters and formaldehyde ion chemistry was carried out to supplement the study of glyoxal ion formation. The numerical study of glyoxal ion chemistry showed that protonated formaldehyde is formed through the reaction of C2H3O2+(H2O) with water molecules. Alternative reaction channels involving water are possible, forming a protonated formaldehyde water cluster CH2OH+(H2O) either from protonated glyoxal (16) or from the protonated glyoxal water cluster (17).
Modifications in the glyoxal interaction with hydronium and hydronium clusters affect the total ion abundance, while changes in the reaction rate with hydronium clusters affect the reaction equilibrium as well. However, in all cases, we may observe a quick dissipation of ion signals for higher water concentration. The ion dissipation is maintained by ligand switching between protonated formaldehyde water cluster CH2OH+(H2O) and neutral water, forming H3O+·H2O and neutral formaldehyde. This makes the measurement of glyoxal in moist environments using CIMS particularly difficult. In addition, measurements in moist environments are much more sensitive to the influence of formaldehyde. The amount of protonated formaldehyde produced from glyoxal at H2O concentrations greater than 1013 cm−3 corresponds to apparent 5% formaldehyde impurity in glyoxal.
Conflicts of interest
There are no conflicts to declare.
Acknowledgements
This project has received funding from the European Union's Horizon 2020 research and innovation programme under the Marie Skłodowska-Curie grant agreement No 674911.
Notes and references
-
G. Mattioda and A. Blanc, Glyoxal in Ullmann's Encyclopedia of Industrial Chemistry, 2000 Search PubMed.
- M. K. Hazra, J. S. Francisco and A. Sinha, J. Phys. Chem. A, 2014, 118, 4095–4105 CrossRef CAS PubMed.
- N. Shangari, W. R. Bruce, R. Poon and P. J. O'Brien, Biochem. Soc. Trans., 2003, 31, 1390–1393 CrossRef CAS PubMed.
- I. A. Shkrob, T. W. Marin, H. He and P. Zapol, J. Phys. Chem. C, 2012, 116, 9450–9460 CrossRef CAS.
- S. Civiš, M. Ferus, A. Knížek, P. Kubelik, L. Kavan and M. Zukalova, Opt. Mater., 2016, 56, 80–83 CrossRef.
- R. Volkamer, U. Platt and K. Wirtz, J. Phys. Chem. A, 2001, 105, 7865–7874 CrossRef CAS.
- M. Jang and R. M. Kamens, Environ. Sci. Technol., 2001, 35, 3626–3639 CrossRef CAS PubMed.
- E. C. Tuazon, R. Atkinson, H. Mac Leod, H. W. Biermann, A. M. Winer, W. P. Carter and J. N. Pitts, Environ. Sci. Technol., 1984, 18, 981–984 CrossRef CAS.
- J. Yu, H. E. Jeffries and K. G. Sexton, Atmos. Environ., 1997, 31, 2261–2280 CrossRef CAS.
- D. Smith, T. Kleindienst and C. McIver, J. Atmos. Chem., 1999, 34, 339–364 CrossRef CAS.
- J. Yu, H. E. Jeffries and R. M. Le Lacheur, Environ. Sci. Technol., 1995, 29, 1923–1932 CrossRef CAS PubMed.
- J. Fick, L. Pommer, C. Nilsson and B. Andersson, Atmos. Environ., 2003, 37, 4087–4096 CrossRef CAS.
- H. Akimoto, Monogr. Environ., Earth Planets, 2016, 4, 1–45 CrossRef.
- A. C. Nölscher, A. M. Yañez-Serrano, S. Wolff, A. C. de Araujo, J. V. Lavrič, J. Kesselmeier and J. Williams, Nat. Commun., 2016, 7, 10383 CrossRef PubMed.
- T. Wroblewski, L. Ziemczonek, A. M. Alhasan and G. P. Karwasz, Eur. Phys. J.-Spec. Top., 2007, 144, 191–195 CrossRef.
- E. P. L. Hunter and S. G. Lias, J. Phys. Chem. Ref. Data, 1998, 27, 413–656 CrossRef CAS.
- J. Zhao and R. Zhang, Atmos. Environ., 2004, 38, 2177–2185 CrossRef CAS.
- E. Michel, N. Schoon, C. Amelynck, C. Guimbaud, V. Catoire and E. Arijs, Int. J. Mass Spectrom., 2005, 244, 50–59 CrossRef CAS.
- C. Guimbaud, V. Catoire, A. Bergeat, E. Michel, N. Schoon, C. Amelynck, D. Labonnette and G. Poulet, Int. J. Mass Spectrom., 2007, 263, 276–288 CrossRef CAS.
- C. Stönner, B. Derstroff, T. Klüpfel, J. N. Crowley and J. Williams, J. Mass Spectrom., 2017, 52, 30–35 CrossRef PubMed.
- R. Volkamer, P. Spietz, J. Burrows and U. Platt, J. Photochem. Photobiol., A, 2005, 172, 35–46 CrossRef CAS.
-
R. A. Lewis and G. G. Hawley, Hawley's condensed chemical dictionary, John Wiley & Sons, 2016 Search PubMed.
-
D. R. Lide and G. W. A. Milne, CRC handbook of data on organic compounds, CRC Press, 1993 Search PubMed.
- P. Španěl and D. Smith, Med. Biol. Eng. Comput., 1996, 34, 409–419 CrossRef PubMed.
- D. Smith and P. Španěl, Mass Spectrom. Rev., 2005, 24, 661–700 CrossRef CAS PubMed.
- P. Španěl, K. Dryahina and D. Smith, Int. J. Mass Spectrom., 2006, 249–250, 230–239 CrossRef.
- R. Barratt, Analyst, 1981, 106, 817–849 RSC.
- P. Španěl, K. Dryahina and D. Smith, Int. J. Mass Spectrom., 2006, 249, 230–239 CrossRef.
- K. Dryahina and P. Španěl, Int. J. Mass Spectrom., 2005, 244, 148–154 CrossRef CAS.
- C. Runge, Mathematische Annalen, 1895, 46, 167–178 CrossRef.
- W. Kutta, Z. Math. Phys., 1901, 46, 435 Search PubMed.
- D. Smith and N. Adams, Adv. At. Mol. Phys., 1988, 24, 1–49 CAS.
- D. Smith, P. Spanel and K. Dryahina, Int. J. Mass Spectrom., 2019, 435, 173–180 CrossRef CAS.
- D. J. Goebbert and P. G. Wenthold, Eur. J. Mass Spectrom., 2004, 10, 837–845 CrossRef CAS PubMed.
- V. Bierbaum, M. Golde and F. Kaufman, J. Chem. Phys., 1976, 65, 2715–2724 CrossRef CAS.
- R. Bolden and N. Twiddy, Faraday Discuss. Chem. Soc., 1972, 53, 192–200 RSC.
- P. Španěl and D. Smith, J. Am. Soc. Mass Spectrom, 2001, 12, 863–872 CrossRef.
- D. Bohme, G. Mackay and S. D. Tanner, J. Am. Chem. Soc., 1979, 101, 3724–3730 CrossRef CAS.
- S. D. Tanner, G. I. Mackay and D. K. Bohme, Can. J. Chem., 1979, 57, 2350–2354 CrossRef CAS.
- A. J. Midey, S. T. Arnold and A. Viggiano, J. Phys. Chem. A, 2000, 104, 2706–2709 CrossRef CAS.
- N. Adams, D. Smith and D. Grief, Int. J. Mass Spectrom. Ion Phys., 1978, 26, 405–415 CrossRef CAS.
- A. Hansel, W. Singer, A. Wisthaler, M. Schwarzmann and W. Lindinger, Int. J. Mass Spectrom. Ion Processes, 1997, 167, 697–703 CrossRef.
-
Y. Ikezoe, S. Matsuoka and M. Takebe, Gas phase ion–molecule reaction rate constants through 1986, Ion reaction research group of the Mass spectroscopy society of Japan, 1987 Search PubMed.
- NIST Chemistry WebBook, NIST Standard Reference Database 69, U.S. Secretary of Commerce, National Institute of Standards and Technology, Gaithersburg, MD, http://webbook.nist.gov/chemistry/, cited November 2019.
- P. Španěl, D. Smith, T. A. Holland, W. A. Singary and J. B. Elder, Rapid Commun. Mass Spectrom., 1999, 13, 1354–1359 CrossRef.
|
| This journal is © the Owner Societies 2020 |
Click here to see how this site uses Cookies. View our privacy policy here. 
 Open Access Article
 This Open Access Article is licensed under a
  *ab,
Felix
Piel
*ab,
Felix
Piel