
 Open Access Article
 This Open Access Article is licensed under a
 Creative Commons Attribution 3.0 Unported Licence
Quantification of the amount of mobile components in intact stratum corneum with natural-abundance 13C solid-state NMR†
Quoc Dat
Pham
 *ab,
Göran
Carlström
c,
Olivier
Lafon
de,
Emma
Sparr
a and
Daniel
Topgaard
a
*ab,
Göran
Carlström
c,
Olivier
Lafon
de,
Emma
Sparr
a and
Daniel
Topgaard
a
aDivision of Physical Chemistry, Chemistry Department, Lund University, Lund, Sweden
bDepartment of Food Technology, Lund University, Lund, Sweden
cCentre for Analysis and Synthesis, Department of Chemistry, Lund University, Lund, Sweden
dUniv. Lille, CNRS, Centrale Lille, Univ. Artois, UMR 8181-UCCS-Unité de Catalyse et Chimie du Solide, F-59000 Lille, France
eInstitut Universitaire de France (IUF), Paris, France
First published on 4th March 2020
Abstract
The outermost layer of the skin is the stratum corneum (SC), which is mainly comprised of solid proteins and lipids. Minor amounts of mobile proteins and lipids are crucial for the macroscopic properties of the SC, including softness, elasticity and barrier function. Still this minor number of mobile components are not well characterized in terms of structure or amount. Conventional quantitative direct polarization (Q-DP) 13C solid-state NMR gives signal amplitudes proportional to concentrations, but fails to quantify the SC mobile components because of spectral overlap with the overwhelming signals from the solids. Spectral editing with the INEPT scheme suppresses the signals from solids, but also modulates the amplitudes of the mobile components depending on their values of the transverse relaxation times T2, scalar couplings JCH, and number of covalently bound hydrogens nH. This study describes a quantitative INEPT (Q-INEPT) method relying on systematic variation of the INEPT timing variables to estimate T2, JCH, nH, and amplitude for each of the resolved resonances from the mobile components. Q-INEPT is validated with a series of model systems containing molecules with different hydrophobicity and dynamics. For selected systems where Q-DP is applicable, the results of Q-INEPT and Q-DP are similar with respect to the linearity and uncertainty of the obtained molar ratios. Utilizing a reference compound with known concentration, we quantify the concentrations of mobile lipids and proteins within the mainly solid SC. By melting all lipids at high temperature, we obtain the total lipid concentration. These Q-INEPT results are the first steps towards a quantitative understanding of the relations between mobile component concentrations and SC macroscopic properties.
1. Introduction
The outer layer of the human skin, stratum corneum (SC), has a vital function of being an efficient permeability barrier.1,2 SC consists of dead keratin-filled cells, corneocytes, embedded in a multilamellar lipid matrix (Fig. 1). Although the main fraction of both lipids and proteins in SC are rigid at ambient conditions,3,4 the minor fraction of mobile lipids and protein components are crucial for the macroscopic material properties of the SC, including barrier function, mechanical properties and water-holding capacity.5–8 For example, increased mobility is expected to lead to higher solubility and higher diffusion coefficient for most added compounds, and thus increased SC permeability.5,7 Still there is limited quantitative information on the minor amount of mobile components in SC. Conventional quantitative direct polarization (Q-DP) 13C solid-state nuclear magnetic resonance (NMR) is not applicable to quantify the SC mobile components because of spectral overlap with the overwhelming signals from the solids. | ||
| Fig. 1 (A) The schematics illustrate the brick-and-mortar model of SC with corneocytes filled with keratin filaments, surrounded by a multilamellar lipid matrix. (B) Chemical structures with numbered segments of relevant SC lipids. (C and D) 13C MAS NMR spectra of SC with 40 wt% water and 0.5 wt% PDMS at 32 °C (C) and 90 °C (D). The remaining CP signals at 90 °C in (D) are from proteins since all the lipids are melted.30 | ||
Typical 13C NMR experiments on 13C natural abundance sample relies on 1H → 13C cross polarization (CP)9 or insensitive nuclei enhanced by polarization transfer (INEPT)10 to increase the signal. These polarization transfer steps have also been utilized to identify rigid and mobile 13C molecular segments in many different systems, including SC (Fig. 1C and D).4,11–13 Site-specific qualitative information about molecular mobility can be obtained by PT ssNMR (polarization transfer solid-state NMR),11,14 wherein comparing signal intensities acquired with DP, CP, and INEPT yields information about the rate and anisotropy of the C–H bond reorientation as presented by the correlation time τc and order parameter |SCH| (Fig. S1, ESI†). A signal in a CP experiment can be observed for “rigid” segments with slow and/or anisotropic reorientation, since the 1H–13C dipolar coupling mediating the CP polarization transfer is averaged to zero by fast isotropic reorientation. Conversely, the INEPT experiment only yields signal for “mobile” segments since 1H coherences of rigid segments rapidly dephase under 1H–1H dipolar couplings during the delays of the INEPT sequence. “Fast anisotropic” segments can be identified as peaks with identical chemical shifts and lineshapes in both CP and INEPT spectra. Segments with “fast isotropic” reorientation are visible only in INEPT. The PT ssNMR experiment is sensitive to mobile segments which are detected exclusively in the INEPT. This has been shown to be useful for systems with a minor fraction of mobile components, for example, SC.4,5,13 However, this experiment does not provide any quantitative information on the amount and the dynamics of the different fractions of the sample. For example, the INEPT scheme modulates the amplitudes of the mobile components depending on their values of the transverse relaxation times T2, scalar couplings JCH, and number of covalently bound hydrogens nH.15 It is a true methodological challenge to take these experiments further and actually quantify the amount of mobile carbon segments in 13C natural abundance samples.
In this study, we describe an NMR method to quantify the molar ratio of mobile 13C segments in 13C natural abundance samples using INEPT for 1H–13C polarization transfer, denoted as Q (quantitative)-INEPT (Fig. 2A). The employment of INEPT helps to enhance the signals of the 13C mobile components and also to filter out other components that are not mobile, which solves the overlap of mobile and rigid resonances that is encountered in the Q-DP experiment. This Q-INEPT method is based on variation of the INEPT timing variables to estimate T2, JCH, nH, and amplitude for each of the resolved resonances from the mobile components, whereas previous methods employing INEPT16,17 will give systematic errors if the T2 or JCH varies between different carbons. In addition, we can quantify the absolute amount of the mobile components in intact SC from Q-INEPT by adding an isotropic fluid reference compound that does not affect the molecular properties of SC. For this purpose, we use a high molecular-weight polydimethylsiloxane (PDMS). When the amount of one of the mobile components is known, the molar ratios obtained from Q-INEPT can be converted to the absolute amount. In addition, by melting all SC lipids at high temperature, we obtain the total lipid concentration in SC. Q-INEPT is validated with a series of model systems with known amounts of mobile components with different hydrophobicity, dynamics and anisotropy. We first studied two liquid crystalline phases in binary systems: the lamellar (Lα) phase composed of phospholipid, 1,2-dimyristoyl-sn-glycero-3-phosphocholine (DMPC) (Fig. 3B) and water,18 and the hexagonal (HI) phase composed of sodium dodecyl sulfate (SDS) (Fig. 3C) and water.19 Then, the same type of experiment was applied to a ternary system composed of 1,2-dipalmitoyl-sn-glycero-3-phosphocholine (DPPC), glycerol and water at two different temperatures where the lipids form either an Lα phase or a lamellar gel (Lgel) phase (Fig. 3D and E). For these model systems, we can detect fast isotropic glycerol at both temperatures, while the lipid acyl-chains go from rigid to mobile state with increasing temperature.20 The experiments on the lipid systems were performed on two different NMR spectrometers operating at different Larmor frequencies and equipped with different probes. In addition, we demonstrate the applicability of using PDMS and glycerol as reference chemicals in calibration experiments on systems composed of 1-palmitoyl-2-oleoyl-glycero-3-phosphocholine (POPC)–PDMS–glycerol–water at different ratios of POPC![[thin space (1/6-em)]](https://www.rsc.org/images/entities/char_2009.gif) :PDMS:glycerol (Fig. 3F and G).
:PDMS:glycerol (Fig. 3F and G).
 | ||
| Fig. 2 (A) NMR pulse sequence used for Q-INEPT. (B) Experimental data (symbol) of IINEPT/IeqINEPT of carbon C2 in the chain of DMPC in Q-INEPT experiment obtained on the 500 MHz spectrometer. The results obtained by fitting eqn (1) to the experimental data with five fit parameters including IeqINEPT, nH, JCH, RH2 and RC2 are shown by the solid lines. | ||
 | ||
| Fig. 3 (A) Chemical structures of different phospholipids, SDS and glycerol with numbered segments. (B–F) 13C MAS NMR spectra of DMPC Lα phase at 27 °C (B), SDS HI phase at 35 °C (C), DPPC–glycerol–water system at 35 °C (D) and 70 °C (E), and POPC–glycerol–PDMS–water system with molar ratio of POPC:glycerol:PDMS = 1:1:1 at 32 °C (F). The coexistence of INEPT and CP signals with the same line shape in (B), (C), (E) and (F) indicates fast anisotropic reorientation. The absence of INEPT signal in the lipid chain in (D) signifies rigid lipids. The resonances only observed in the INEPT spectra (B–F) imply fast isotropic motion. (G) 13C MAS DP NMR spectrum of POPC–glycerol–PDMS–water system with molar ratio of POPC:glycerol:PDMS = 1:1:1 at 32 °C recorded at τR = 50 s. | ||
2. Q-INEPT method description
The pulse sequence of the Q-INEPT experiment (Fig. 2A) is similar to the standard INEPT scheme, with the addition that both delay times τ1 and τ2 are varied.10,15 The intensity corresponding to the quantitative amount of mobile fraction IeqINEPT detected by INEPT, the 1H–13C through-bond scalar coupling JCH, and the effective 1H (13C) transverse dephasing rate, RH2 (RC2), can be obtained when the intensities of the peak IINEPT at different values of τ1 and τ2 are fitted to the following equation15 | (1) |
For all the model systems in Fig. 3 (Sections 3.1–3.3), the intensity corresponding to the number of mobile 13C i segment IeqINEPT,i can be converted to the intensity corresponding to the number of molecules containing this 13C segment. This is done by dividing IeqINEPT,i by the number, Ni, of chemically equivalent carbon atoms i in the molecule (for example, 3 for Cγ, 1 for Cα and 2 for C2 in DMPC molecule): IeqINEPT,i/Ni. This intensity should ideally be the same for different mobile 13C segments in the same molecule. Since the NMR intensity has no unit, we present the data as a normalized molar ratio CINEPT. This ratio of the lipid (surfactant) mobile i segment is calculated by the following equation:
 | (2) |
 is the average value of IeqINEPT,i/Ni over the number of measured lipid (surfactant) segments, nINEPT. The ideal value of the normalized molar ratio CINEPT of each 13C lipid (surfactant) segment is therefore equal to 1. The 90% confidence intervals of the average normalized molar ratio over nINEPT mobile lipid (surfactant) segments Cavg.INEPT is calculated from 1000·nINEPT values of CINEPT in which 1000 values of IeqINEPT,i of each i segment were previously obtained from the Monte Carlo analysis. For the model systems containing glycerol or PDMS (see Sections 3.2 and 3.3), CINEPT,i of i segment of glycerol or PDMS is given by
 | (3) |
:glycerol (PDMS) mixing molar ratio. In this way, the value of CINEPT,i of glycerol or PDMS is ideally 1 as the lipid.
For SC (see Section 3.4), the molar ratio of two mobile 13C segments i and j can be calculated as IeqINEPT,SCi/IeqINEPT,SCj. Since SC is a phase-segregated system with complex composition, this ratio is not expected to be 1 and we therefore want to know this molar ratio and eventually the fraction of the mobile segments. To convert the molar ratio to the amounts of mobile components compared with the total amount of SC, we added a known amount of reference compound that is an isotropic fluid, which was here chosen as a high molecular-weight PDMS. The reference compound was mixed with SC at a given weight ratio. We herein used mREF:mSC = 5.025 mg:1 g, which corresponds to 0.5 wt% PDMS in the water-free sample. The amount of mobile 13C segment i in mole per 1 g SC, xSCi, can then be calculated as
 | (4) |
3. Experimental results from Q-INEPT
3.1. Anisotropic liquid crystalline phases in binary amphiphile–water systems
Two different binary model systems both consisting of one single anisotropic liquid crystalline phase with fast motion were investigated: the DMPC Lα phase (35 wt% water at 27 °C)18 and SDS HI phase (50 wt% water at 35 °C)19 (Fig. 3B, C and Table 1). Fig. 4A shows normalized molar ratios of different resolved 13C segments of DMPC Lα phase obtained from fitting Q-INEPT data to eqn (1) (Fig. 5). The data were obtained from experiments on both 500 and 800 MHz NMR spectrometers. Some carbons, including Cα, Cβ, Cγ and C14 of DMPC, are only detected in INEPT spectra (Fig. 3B) as a result of fast isotropic reorientation with low |SCH| values,12,22 whereas the remaining carbons in glycerol backbone and lipid chains with more anisotropic reorientation are detected in both CP and INEPT spectra. The results obtained on both the 500 and 800 MHz NMR spectrometers are similar in respect of the spreading of the normalized molar ratios over different segments (Fig. 4A and Table 1) and the evolution of the signal intensities in Q-INEPT experiments (Fig. 5). In addition to the quantitative amount of the mobile components, Q-INEPT also provides profiles of the scalar coupling JCH and other relaxation rates (Fig. S2, ESI†), giving further insight into the differences between the different carbons in the DMPC molecule. For more detailed information about these differences, see supplementary Fig. S2 (ESI†). The influence of longitudinal relaxation was tested by performing Q-INEPT on this system at a shorter recycle delay τR. The results obtained at τR of 5 s and 10 s are quite similar, indicating that a τR of 5 s is already sufficient for longitudinal relaxation of the mobile segments that are detected in INEPT spectra.| Sample | Water content (wt%) | T (°C) | Spectrometer (MHz) | C avg.INEPT |
|---|---|---|---|---|
| DMPC Lα phase | 35 | 27 | 500 | 1.00 (0.76–1.19) |
| 800 | 1.00 (0.85–1.20) | |||
| SDS HI phase | 50 | 35 | 500 | 1.00 (0.84–1.15) |
| DPPC rigid lipid – fast isotropic glycerol (3 L/GLY) | 12 | 35 | 500 | 1.00 (0.84–1.15) |
| 800 | 1.00 (0.77–1.08) | |||
| DPPC Lα phase – fast isotropic glycerol (3 L/GLY) | 12 | 70 | 500 | 1.00 (0.88–1.19) |
| 800 | 1.00 (0.81–1.25) |
 | ||
| Fig. 4 Normalized molar ratios (median and 90% confidence intervals) obtained from Q-INEPT for DMPC Lα phase with 35 wt% water at 27 °C (A), DPPC–glycerol–water system with 12 wt% water and 3 lipid/glycerol at 35 °C (B) and 70 °C (C) measured on 500 and 800 MHz spectrometers. The molar ratios of glycerol were normalized against the lipid/glycerol mixing ratio (3:1) so that the values of glycerol segments are ideally 1 as the lipid. The spread of the normalized molar ratios over different segments obtained on the 500 and 800 MHz spectrometers is represented by grey and orange shaded areas, respectively. | ||
 | ||
| Fig. 5 Experimental (symbol) and fitted (line) data of IINEPT/IeqINEPT of different carbons in DMPC at 27 °C in Q-INEPT experiments obtained on 500 and 800 MHz spectrometers. | ||
The results obtained from Q-INEPT for SDS HI phase on the 500 MHz NMR spectrometer are shown in Table 1 and Fig. S3 (ESI†), indicating a spreading of the normalized molar ratios over different segments of 9%. It is also noted all relaxation rates of carbons in the acyl chain are lower in the SDS HI phase than in the DMPC Lα phase (compare Fig. S2 and S3, ESI†), a clear difference between the two anisotropic liquid crystalline phases. The concentration of counter ion Na+ in this SDS sample is quite high, and the conductivity of this sample hinders the experiments on the 800 MHz spectrometer due to problems that are more pronounced at the higher magnetic field strength including dielectric losses, higher pulse power, lower sensitivity and sample heating.23,24 The Q-INEPT data on the 800 MHz spectrometer are therefore not included.
In conclusion, Q-INEPT works adequately to quantify the mobile 13C segments within one compound at natural abundance. Although the spreading of the normalized molar ratios varies between the systems and the spectrometers (Table 1), this method is applicable for carbons with different JCH values and relaxation rates and gives further insight into the differences between the anisotropic liquid crystalline phases.
3.2. System composed of lamellar phases and fast isotropic glycerol
In this section, we investigate a ternary DPPC–glycerol–water system with 8 water molecules per lipid one (W/L) (or 12 wt% water) and 3 lipid molecules per glycerol one (L/GLY) at two different temperatures: 35 °C and 70 °C (Fig. 3D and E). At the lower temperature, the DPPC forms an Lgel phase with rigid acyl-chains, and at the higher temperature, an Lα phase with mobile acyl-chains.20 In both cases, glycerol is present in the water-rich regions in between the bilayers in the lamellar phases, and undergoes fast isotropic C–H bond reorientation as indicated by the INEPT signal and the absence of the CP signal (Fig. 3D and E).At 35 °C we only observe INEPT signal for Cγ of DPPC (Fig. 3D), implying that this carbon is only detected as a mobile and isotropic segment and can therefore be used to quantify the molar ratio of lipid and glycerol by Q-INEPT (Fig. 4B and Table 1). The normalized molar ratios of glycerol and Cγ of DPPC obtained from Q-INEPT on both spectrometers, presented in Fig. 4B, show that the results from Q-INEPT are in agreement with the L/GLY mixing ratio. The evolution of the signal intensities (Fig. S4, ESI†) and other extracted NMR parameters (Fig. 6) in Q-INEPT experiments obtained on both spectrometers for this DPPC Lgel phase are quite similar. It is noted that the values of RH2 and RC2 of Cγ in the Lgel phase are about 150 and 200 s−1, respectively (Fig. 6) and this carbon still can be quantified by Q-INEPT.
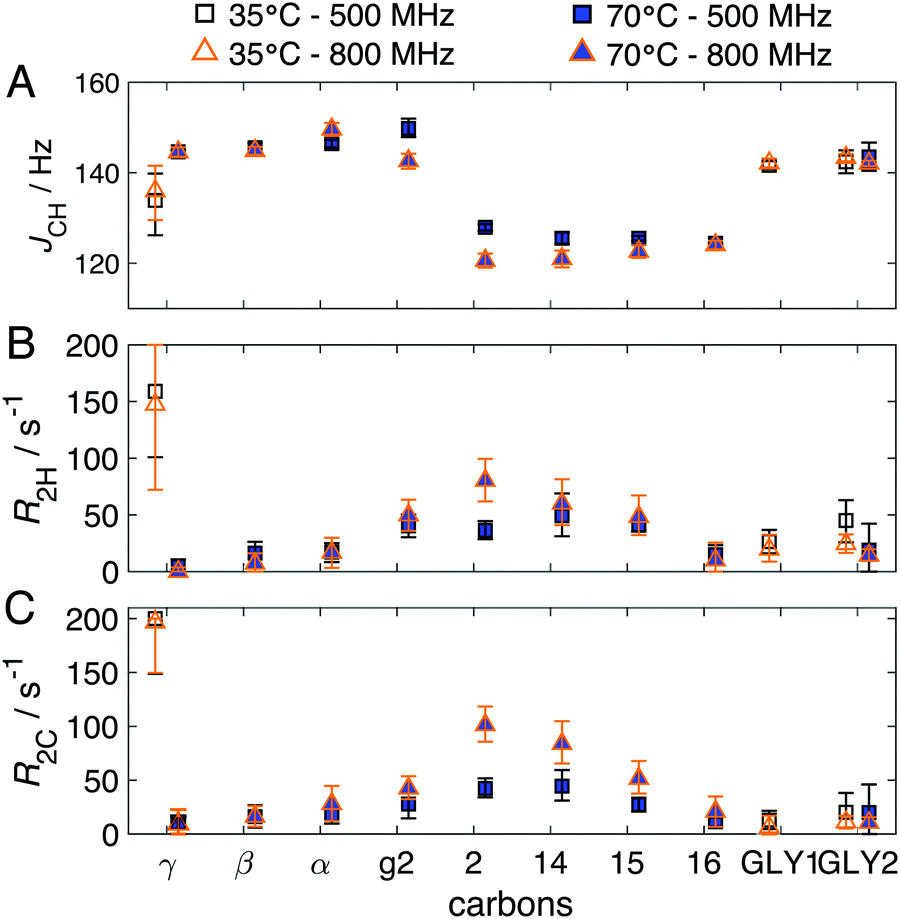 | ||
| Fig. 6 Results (median and 90% confidence intervals) obtained from Q-INEPT for DPPC–glycerol–water sample at 35 °C and 70 °C measured on the 500 and 800 MHz spectrometers: 1H–13C through-bond scalar coupling JCH (A) and effective 1H (B) and 13C (C) transverse dephasing rates, RH2 and RC2. The relaxation rates of Cg2 and some acyl-chain carbons including C2, C14 and C15 are higher at the higher Larmor frequency, as seen previously in the DMPC Lα phase in Fig. S2 (ESI†). | ||
The same DPPC–glycerol–water system was studied at high temperature (70 °C) where the lipids form an Lα phase with mobile acyl-chains,20 thus giving rise to INEPT and CP signals in glycerol backbone and most of the chain segments (Fig. 3E). The normalized ratios obtained from Q-INEPT are shown in Fig. 4C and the quantitative results are summarized in Table 1. Q-INEPT data for GLY1 are not shown since its signal overlaps with carbon g1 of DPPC in the INEPT spectrum (Fig. 3E). The molar ratio of glycerol and DPPC obtained from Q-INEPT on both spectrometers for the Lα phase, presented in Fig. 4C, is in good agreement with the L/GLY mixing ratio in the sample, and the normalized molar ratios from these different spectrometers are between 0.9–1.1 for most of the carbons. The agreement of the results obtained on these different spectrometers was also observed in the evolution of the signal intensities (Fig. S5, ESI†) and other extracted NMR parameters (Fig. 6) for most of the carbons. Some small differences are observed for certain carbons when comparing data from the two spectrometers, as seen previously in the DMPC Lα phase. When the DPPC changes from the Lgel to the Lα phase, the relaxation rates RH2 and RC2 of Cγ are noted to be significantly lower (Fig. 6) despite the fact that the reorientation of Cγ is fast isotropic in both phases (Fig. 3D and E).
From these experiments, it is concluded that Q-INEPT can be used to quantify the molar ratio of the lipid and glycerol when the lipid is in the Lgel or the Lα phases. The quantification of the Lgel phase would not be possible with the earlier methods16, 17 relying on T2 ≫ INEPT delays.
3.3. Calibration using references to quantify the amount of mobile components
Similar to other NMR methods, Q-INEPT only provides relative concentrations. In order to achieve absolute concentration determination, one generally needs to employ a reference that is present in the sample at a known concentration. As illustrated for the DPPC–glycerol–water system studied at different temperatures (Fig. 4B and C), one can make a quantification of the amount of mobile lipids based on the known L/GLY mixing ratio and the assumption that all glycerol molecules are present as one fast isotropic fraction. The results are consistent with that all DPPC molecules form a single Lα phase at the higher temperature, and a single Lgel phase at the lower temperature. In this section, we extend this analysis, and we present a calibration of Q-INEPT method to quantify the amount of mobile lipids in a mixed sample using two reference molecules with different hydrophobicity, i.e. glycerol and PDMS. We herein use a model system consisting of POPC–PDMS–glycerol–water at fixed water content (5 W/L) and fixed temperature (32 °C). We kept the same glycerol: PDMS molar ratio, and varied molar ratios of POPC:PDMS and POPC:glycerol ranging from 0.1 to 1.5 (Table 2). Here, the lipid systems form a single Lα phase with mobile acyl-chains for all concentrations of the reference compounds,25 as indicated by INEPT and CP signals in glycerol backbone and most of the chain segments (Fig. 3F and Fig. S6i, ESI†). It is also clear that both PDMS and glycerol are only present as mobile and isotropic segments as these reference molecules are only detected in INEPT spectra. We therefore can validate Q-INEPT based on the POPC:PDMS and POPC:glycerol ratios obtained from Q-INEPT and from the mixing. In addition, the conventional DP method with a sufficiently long recycle delay τR of 50 s, Q-DP, was performed on the same systems (Fig. 3G and Fig. S6ii, ESI†), allowing the comparison between Q-DP and Q-INEPT. The intensity of the peak in Q-DP spectrum corresponds to the number of 13C i segment in Q-DP IeqDP,i. The normalized molar ratio CDP of the lipids, glycerol and PDMS and the average normalized molar ratio of the lipid segments Cavg.DP obtained from Q-DP were calculated in the same way as being performed for Q-INEPT.
:PDMS:glycerol mixing molar ratios and measured at 32 °C on the 500 MHz spectrometer. The results are presented as median and 90% confidence intervals or median and standard deviation. The molar ratios of PDMS and glycerol were normalized against the mixing ratios so that their normalized molar ratios are ideally 1 as the lipid. The 90% confidence intervals of Cavg.INEPT of POPC and the standard deviations of Cavg.DP refer to the spread of the normalized molar ratios over different segments of lipids. The 90% confidence intervals of PDMS and glycerol in Q-INEPT are calculated from different fitted values of CINEPT obtained from Monte Carlo analysis, whereas the standard deviations of these molecules in Q-DP is from the standard deviations of eight values of the molar ratio of these molecules to each of the lipid segment
| POPC:glycerol:PDMS mixing molar ratio |
C avg.INEPT | C INEPT | C avg.DP | C DP | ||
|---|---|---|---|---|---|---|
| POPC | PDMS | Glycerol | POPC | PDMS | Glycerol | |
| 0.1:1:1 |
1.00 (0.75–1.22) | 0.85 (0.82–0.89) | 1.02 (0.98–1.04) | 1.00 ± 0.11 | 0.89 ± 0.11 | 1.02 ± 0.12 |
| 0.5:1:1 |
1.00 (0.56–1.43) | 0.96 (0.92–1.01) | 1.21 (1.17–1.25) | 1.00 ± 0.13 | 0.93 ± 0.11 | 1.14 ± 0.14 |
| 1:1:1 |
1.00 (0.88–1.21) | 0.90 (0.86–0.94) | 1.01 (0.95–1.07) | 1.00 ± 0.10 | 0.86 ± 0.08 | 1.10 ± 0.11 |
| 1.5:1:1 |
1.00 (0.88–1.16) | 0.91 (0.87–0.96) | 0.95 (0.89–1.01) | 1.00 ± 0.06 | 0.99 ± 0.06 | 1.12 ± 0.07 |
The normalized molar ratios obtained from Q-INEPT and Q-DP in different samples with different mixing ratios of POPC:PDMS and POPC:glycerol are shown in Table 2 and Fig. S7 (ESI†). In general, there is a good agreement between the results obtained from Q-INEPT and Q-DP and also between these NMR results and the mixing ratios, irrespective of the mixing ratios. The spreading of the normalized molar ratios of different carbons in the lipid obtained from Q-INEPT is higher than this spreading in Q-DP in most cases (Table 2). The noted high spreading in Q-INEPT in the sample of POPC:PDMS:glycerol = 0.5:1:1 (Table 2 and Fig. S7, ESI†) compared to the other samples is likely due to an increase in the relaxation rates at this particular mixing ratio (Fig. S8, ESI†), leading to a lower signal to noise. It is also noted that one of the sources of the differences between the measured molar ratios and the mixing molar ratios may come from a small variation in the actual sample composition in the NMR insert compared to the desired composition during weighing, mixing and transferring samples into the insert. Fig. 7 shows the measured molar ratios versus the mixing molar ratios of POPC:PDMS and POPC:glycerol, and linear regression onto these data yields slope and coefficient of determination R2 (Table 3). The results for Q-INEPT and Q-DP are similar and there is a linear relation between the measured ratio and the mixing ratio (R2 > 0.95) for both reference molecules, PDMS or glycerol. Taken together, the data presented in Fig. 7 confirm the validation of Q-INEPT that gives comparable results to the Q-DP as well as the applicability of glycerol and PDMS as reference chemicals.
 | ||
| Fig. 7 Measured molar ratios (median and 90% confidence intervals) of POPC:PDMS and POPC:glycerol obtained from Q-INEPT and Q-DP versus their mixing ratios for samples of POPC–PDMS–glycerol–water at 32 °C and measured on the 500 MHz spectrometer. The results obtained by linear regression onto these data are shown by the solid lines. | ||
| Method | Slope | R 2 | |
|---|---|---|---|
| POPC:PDMS |
Q-INEPT | 1.1052 (1.1052–1.1053) | 0.9559 (0.9559–0.9559) |
| Q-DP | 1.0598 (0.9964–1.1226) | 0.9681 (0.9565–0.9565) | |
| POPC:glycerol |
Q-INEPT | 1.0275 (1.0275–1.0276) | 0.9552 (0.9552–0.9552) |
| Q-DP | 0.8972 (0.8556–0.9368) | 0.9826 (0.9759–0.9765) |
By using the same experimental set-up for Q-DP and Q-INEPT, we can further compare IeqDP,i and IeqINEPT,i, the absolute intensities corresponding to the number of 13C i segment measured in Q-DP spectrum and the number of mobile 13C i segment obtained from Q-INEPT, respectively. These values should ideally be the same. However, the average value of the IeqINEPT/IeqDP ratio of different segments in the different samples is around 0.7 (Fig. S9, ESI†), suggesting a systematic deviation. The experimental set-up for Q-INEPT and Q-DP on the same 500 MHz spectrometer is exactly the same except the pulse sequences before recording the data and the recycle delay τR (τR = 10 s in Q-INEPT and τR = 50 s in Q-DP). This deviation is likely due to the dependence of the efficiency of the magnetization transfer in Q-INEPT experiments on the homogeneity of the radio frequency (RF) fields. Such difference may notably stem from the geometry of the RF coils that can lead to the different sample volumes that are excited by 1H and 13C pulses.26
3.4. Quantification of the amount of mobile components and of the total amount of lipids in intact stratum corneum using Q-INEPT
In this section, we perform Q-INEPT to quantify the molar ratio between the mobile components in intact SC. In order to quantify the amount of the mobile components compared with the total amount of SC (dry mass), we need a reference in the sample for which we know the exact amount. The reference molecule should be present in a single mobile state so that its total amount is observed in the Q-INEPT experiment. It can be chosen as a chemical that is of specific interest, for example, a penetration enhancer5 (a compound that can enhance penetration through skin) or a solvent13 for which one want to study the effect on SC.27 However, in many cases when a foreign substance is added to SC, the added compound can be present in more than one state or it might show reduced mobility due to interactions with the SC,13 and for these cases the added molecule is not suitable as a reference molecule. There are also cases that the added compound does not contain any C–H bond, for example water and urea, and these molecules do not give rise to any INEPT signal. It is therefore clear that there are several occasions when we need to introduce another reference component that is present in the samples as a separate isotropic fluid phase which can serve as a reference signal to enable quantification of the amount of other mobile components. The added reference compound should not penetrate SC or affect the molecular dynamics of the SC components. In this study, we added a large hydrophobic polymer, PDMS (silicone oil), which is an isotropic liquid at all water contents including the dry condition. This large polymer does not penetrate SC and does not influence SC molecular dynamics or water activity in the SC sample. Indeed, PT ssNMR experiments on samples composed of intact SC at different water contents together with varying amount of PDMS, showed no detectable changes in SC molecular mobility as compared to the corresponding PDMS-free samples (compare Fig. S10A and B, Fig. S10C and D, and Fig. S10E and F, ESI†). In addition, PDMS is mostly detected in the INEPT spectra for all conditions investigated, indicating that it mainly exists as an isotropic liquid in the spaces between the flakes of SC after mixing. The amount of PDMS actually needed for the Q-INEPT experiments is only ca. 0.5 wt% (Fig. 1C and D), which is much lower than the amount used for the illustration in Fig. S10 (ESI†). The concentration of PDMS of 0.5 wt% in Q-INEPT was chosen so that its INEPT intensity is in the same range as the other INEPT peaks from SC, and the intensity from PDMS in the Q-INEPT experiments thus corresponds to this known amount, making it a suitable reference molecule. PDMS is also noted to have a distinct chemical shift which does not interfere with the resonances of most chemicals in NMR spectra.The keratin-filled corneocytes are the major components of SC, and these are separated by the multilamellar extracellular lipids.28 The core of the keratin filament is enriched in leucine and lysine while its protruding terminal chains are rich in hydrophilic amino acids, e.g., glycine and serine (Fig. 1A).4 The extracellular SC lipids surrounding corneocytes mainly comprise ceramides (CERs), free fatty acids (FFAs), and cholesterol (CHOL) (Fig. 1B) in nearly equimolar proportions.28 In previous studies, we managed to assign the chemical shifts of all major peaks in the crowded 13C spectra to carbons in lipids and in amino acids in intact SC.4 In the analysis of the spectra, we here focus on representative SC lipid and protein molecular segments that are well-resolved in the INEPT spectra, as illustrated in Fig. 1C. These segments include Gly Cα and Ser Cβ of the terminal domains of the keratin filaments, the terminal ωCH3 and the beginning αCH2 of the acyl chains of fatty acids and ceramides, and CHOL 9 of cholesterol. Fig. 1C shows PT ssNMR data of SC with 0.5 wt% PDMS and 40 wt% water, corresponding to hydrated conditions.29 The spectra are dominated by the CP signal for most of the spectral range, implying that the majority of SC lipid and protein components are rigid. Still one can observe co-existing fractions of mobile lipids and proteins as inferred from the INEPT signals. Q-INEPT was performed on the samples of SC–water–PDMS with 0.5 wt% PDMS and of SC–water at the same water content of 40 wt% water (Fig. S11, ESI†) to quantify the mobile fractions in SC. The amount of the mobile components converted to mole per g dry SC and other fitted values of these two samples are shown in Fig. 8 and Fig. S12 (ESI†). In order to compare the results obtained for SC–water and SC–PDMS–water systems, IeqINEPT,i in a PDMS-free sample was converted to the amount in mole by assuming the amount of the mobile terminal of the lipid acyl chains ωCH3 is the same in both samples (Fig. 8). The Q-INEPT results for SC–PDMS–water and SC–water samples with the same water content are quite similar, confirming that PDMS does not affect the amount of SC mobile components and their dynamics (Fig. S11 and S12, ESI†). The difference in the amount of CHOL 9 in Fig. 8 is likely due to biological variation in chemical composition between different batches of SC. SC has complex composition with co-existing structures, and therefore the INEPT peaks may have contributions from chemically identical segments that are present in different mobile fractions, or from different types of molecules that contain the same segment. For example, the ωCH3 segment of the acyl chains originates both from fatty acids and ceramides with different chain lengths. From the Q-INEPT experiment, we only obtain apparent quantitative data of all mobile segments that resonate at the same chemical shift. Finally, we also confirmed the amount of the reference molecules PDMS in the SC samples using Q-INEPT by adding a known amount of a second reference compound, glycerol, to SC–PDMS mixture (Fig. S13, ESI†).
 | ||
Fig. 8 Amount of mobile segments (median and 90% confidence intervals) obtained from Q-INEPT for SC–PDMS–water (□) and SC–water (■) systems at 40 wt% water and at 32 °C and for SC–PDMS–water systems at 50 wt% water and 90 °C ( ) measured on the 500 MHz spectrometer. ) measured on the 500 MHz spectrometer. | ||
In a next step, we measure the total amount of lipids in SC by performing Q-INEPT on intact SC at 50 wt% water and 90 °C. At these conditions, all the lipids are molten,30 and they are only observed in the INEPT spectra (Fig. 1D). The total amount of lipids can therefore be quantified by Q-INEPT (Fig. 8). From the molar amount of lipids per 1 g dry SC in Fig. 8, we can then estimate that SC lipids comprise 0.030 g fatty acids, 0.060 g ceramide and 0.058 g cholesterol per 1 g dry SC. This estimation is based on some assumptions, including estimated average molecular weights of the different lipid classes (see ESI† for detailed information). The total amount of SC lipids was estimated to be 0.15 g per 1 g dry SC or 15 wt% of the total weight of dry SC. From this total amount, we can further estimate the fraction of the mobile segments of ωCH3 and CHOL 9 in SC at 40 wt% water and 32 °C in relation to the total amount of the same segment in SC to be 18 and 71 mol%, respectively (Table S1, ESI†). Such quantitative information on the amount of mobile SC lipid components has not been achievable before. One should note that there is likely a preferential melting of the shorter chain lipids, which can lead to an underestimation of the mass fraction of mobile SC lipids.
4. Discussion
The results of the molar ratio of the mobile components obtained from Q-INEPT in different model systems (Tables 1 and 2) show that the Q-INEPT method can be utilized to quantify the amounts of 13C mobile segments in natural abundance samples. The measured mobile segments can have different dynamics, anisotropy and JCH, whereas previous quantitative methods based on INEPT do not take into account T2 relaxation16 or require knowledge of JCH.17 In addition, Q-INEPT does not rely on T2 ≫ INEPT delays as the earlier methods16,17 do. Overall, the data obtained from Q-INEPT are comparable to the ones from the conventional Q-DP, when the Q-DP is applicable and comparisons can be made, in terms of the molar ratio, the spreading of the data and linearity (Tables 2, 3 and Fig. 7). It is also noted that the accuracy of the signal intensities measured for different carbons at different delays in Q-INEPT also contributes to the spreading of the data in Q-INEPT. As long as the amount of one of the mobile components is known, the molar ratio obtained from Q-INEPT can be converted to the absolute amount as illustrated here with systems of DPPC–glycerol–water, POPC–PDMS–glycerol–water and even SC, a biological sample with complex composition.By melting all the lipids, we can measure the total molar amount of lipids (Fig. 8) and then estimate that the total amount of lipids accounts for 15 wt% of the dry weight of pig ear SC. This is a completely new way to obtain the total amount of lipids in SC, which has previously been based on samples composed of extracted lipids, thereby relying on the efficiency of the extraction protocol. Gray et al.31 reported that the total amount of lipids extracted from pig ear SC is about 10 wt% of the dry mass of SC. The use of only two organic solvent mixtures of chloroform–methanol 1:1 and 2:1 (v/v) in that study is properly not sufficient to extract all the lipids in SC,32 including the lipids bound to the cornified envelope of the corneocytes. As the NMR experiments cannot distinguish between bound and unbound lipids, the total amount of lipids of 15 wt% of the total weight of dry SC should include both the extracellular lipids and the bound lipids. There is a long-standing question about the quantity and the composition of the mobile SC lipid components. This study is the first study to quantify the amount of the mobile components directly in intact SC (Fig. 8 and Table S1, ESI†). By comparing wide-angle X-ray scattering (WAXS) profile of SC with a profile obtained by subtracting WAXS profile of delipidized sample from that of SC, Doucet et al.33 estimated the relative amounts of crystallized lipids in the SC versus the amorphous lipids that have been removed by solvent extraction to be roughly 20:80. One should here note that the amorphous lipids may include both rigid and mobile lipids. In addition, as also discussed in that paper, there is a risk of incomplete lipid extraction as well as preferential extraction of more fluid lipids. There have been several 2H NMR studies employing deuterated lipids to quantify the amount of fluid lipids in SC model lipid mixtures,34–39 but not in intact SC. The amount of the mobile lipids obtained for studies of model mixtures naturally varies with the chosen lipid compositions. It is therefore an important progress that we are now able to directly quantify the amount of the mobile lipids inside intact SC. The quantitative information on mobile SC lipid components is essential to enable for the correlation between SC molecular properties and SC macroscopic properties. For example, it has previously been shown that increasing SC hydration leads to induced mobility in SC lipids and proteins, although the effects were not quantitative.4 These changes in SC lipid and protein molecular dynamics correlate well with changes in SC permeability, SC water uptake and skin elastic properties.6,8,40 Through the work presented here, it is now possible to quantify the amount of mobile components in intact SC at the 13C atomic level at the different conditions using Q-INEPT and PDMS as a reference molecule. As an alternative approach, the reference molecules can also be a compound of interest for which one would like to study the effects on SC molecular dynamics. It is also noted that as the amount of the mobile lipids in SC at ambient condition is minor, the addition of a hydrophobic chemical that is likely mixed with the SC mobile lipids will change the chemical composition of the SC mobile lipid domains remarkably (see ESI† for an example). In this way, even in the case that the added chemical does not melt more SC lipids, its incorporation into the SC mobile lipids still can change the amount ratio of the solid and mobile lipid domains in SC.
Beside the molar ratio of the mobile carbons, there is other valuable quantitative information that can be extracted from Q-INEPT including different relaxation rates and JCH.15 There is a clear difference between different anisotropic liquid crystalline phases i.e. DMPC Lα and SDS HI phases (compare Fig. S2 and S3, ESI†). One can also observe that the evolution profile of the signal intensity in Q-INEPT is very distinct for carbons with different multiplicities (e.g.Fig. 5) and JCH values.15 A strong deviation of this experimental profile from the typical evolution would therefore indicate an overlap of carbons with different multiplicities or very different JCH values. Together with the number of directly bound protons nH from Q-INEPT, this information can be useful for the carbon assignment in complex samples like SC. In addition, the increase in INEPT signal has been used as a qualitative indication of a higher mobility in many systems, including SC.4,11–13,41,42 This change can be due to a higher amount of the mobile components or due to shorter correlation time τc or a lower order parameter |SCH|.14 The Q-INEPT experiments can help to distinguish between changes in the amount of the mobile components and molecular dynamics.
Q-INEPT is able to detect and quantify a minor amount of mobile component that is present in a major rigid material like SC. There would be potential applications of this method in many different systems with coexisting amount of rigid and mobile components. One example, which has clear relevance in both biological and technical applications, is the lipid bilayer where the co-existence of solid and fluid domains in the bilayers can lead to dramatically increased membrane permeability as well as partitioning of small molecules into the membranes.43,44 Coexistence of rigid and mobile components is also commonly found in systems composed of one single phase, for example, mobile solvent in a Lgel phase with rigid acyl-chains.20,45 This example is illustrated in this study by DPPC–glycerol–water system (Fig. 3D). There are even cases where there is rigid-mobile coexistence within the same molecule, for example, membrane proteins with rigid transmembrane and mobile extra-membrane domains,46,47 protein fibrils with rigid core and mobile flanking domains,48,49 polymers with rigid backbone and mobile side chains,50 or lipids in which the mobility is only detected in the terminals of the chains51 or the headgroup e.g. the DPPC Lgel phase. Another case is found for the equilibrium between bound and free states in systems containing ligand–protein and membrane–protein complexes in which the protein structure and functions are altered by this binding.52
Despite the advantages mentioned above, Q-INEPT is rather time-consuming as one needs to record a series of INEPT spectrum at different delay times τ1 and τ2. The number of scans for each INEPT spectrum in the Q-INEPT depends on the abundance of the studied fluid components in the sample, whereas there is a compromise between the number of INEPT spectra with systematic variation of the INEPT timing variables and the precision of the fitted data in eqn (1). As the signal modulation when varying τ2 is very different for carbons with different number of directly bound protons nH (Fig. 5), one may need to record more INEPT spectra with different τ2 values in order to achieve a good precision for the fitted data of the different fluid carbons in the same sample.
5. Conclusions
In conclusion, we have shown that Q-INEPT can provide molar ratio and even quantitative amount of 13C mobile components in 13C natural abundance semi-solid samples including the biological sample SC. The results obtained from Q-INEPT are comparable to standard quantitative Q-DP experiments, whereas the former can filter out signals of other segments that are not mobile and specifically enhance signals of mobile carbons. The sensitivity of Q-INEPT to the mobile carbons is very useful to quantify minor amounts of mobile components coexisting with a major rigid fraction e.g. in SC. The amounts of mobile fractions obtained from these experiments will help to open up more quantitative information e.g. characterizing permeability of membranes. These experiments can also provide other valuable information including scalar couplings and relaxation rates, giving further molecular insights into the systems. The Q-INEPT can also help to confirm carbon assignment in the measured samples.6. Experimental sections
6.1. Materials and sample preparation
DMPC, DPPC and POPC were purchased from Avanti Polar Lipids, Inc. NaCl, Na2HPO4.2H2O, KH2PO4, and PDMS (average molecular weight of 95000 g mol−1) were from Sigma-Aldrich, SDS was from Duchefa Biochemie, and glycerol was from VWR chemicals. All samples were prepared with Milli-Q water (18 mΩ cm). All chemicals were of analytical grade and used without further purification. Pulverized SC from porcine ears was prepared as described in previous studies.4 Porcine ears were obtained from a local abattoir and stored at −80 °C until use. Hair was removed by a trimmer, and the skin from the inner ear was dermatomed (TCM 3000 BL, Nouvag) to a thickness of approximately 500 μm. The dermatomed skin strips were placed on filter paper soaked in phosphate buffered saline, PBS (130.9 mM NaCl, 5.1 mM Na2HPO4·2H2O, 1.5 mM KH2PO4, pH 7.4) solution with 0.2 wt% trypsin at 4 °C overnight to separate SC from tissue. Sheets of SC were removed by forceps, washed with PBS five times and further dried under vacuum. The dry SC sheets were then cut into small pieces to facilitate the mixing and equilibration. SC pieces were dried again in vacuum and stored in a freezer until further use.
The weighed amounts of chemicals were mixed in Eppendorf tubes. The POPC–PDMS–glycerol samples were dispersed in water and then freeze-dried to obtain a homogenous mixture before adding water. The SDS sample was dispersed by vortexing whereas the lipid samples were placed in a water bath at 60 °C for 15 min to induce mixing. These model samples were equilibrated at room temperature for at least two days and then loaded into a Bruker 3.2 mm rotor for experiments on the 800 MHz spectrometer or into a rotor insert to be fitted into a Bruker 4 mm rotor for experiments on the 500 MHz spectrometer. A batch of SC and 0.5 wt% PDMS (based on the total weight of SC and PDMS) was prepared by mixing SC and PDMS with 70 wt% water (based on the total weight of SC and water) to facilitate mixing. This SC–PDMS mixture was then dried under vacuum and stored in a freezer until further use. Dry SC powder with and without PDMS was mixed with different amount of water (e.g. 40 wt%, based on the total weight of SC and water) and then transferred into inserts and incubated at 32 °C for one day before the NMR measurements. The NMR experiments for different selected samples with the same composition were reproduced.
6.2. NMR experiments and data analysis
NMR experiments were performed on a Bruker Avance II – 500 MHz NMR spectrometer equipped with a Bruker 4 mm E-free MAS probe or a Bruker 4 mm HX CP/MAS probe and a Bruker Avance III – 800 MHz equipped with a Bruker 3.2 mm HX CP/MAS probe. The 4 mm HX CP/MAS probe was only employed for the measurements at 90 °C. All experiments were carried out at a spinning frequency of 5 kHz. In DP, CP, and INEPT experiments in a set of PT ssNMR, the following set-up was used: spectral width of 248.5 ppm, acquisition time of 50 ms, 2048 scans per experiment, recycle delay τR of 5 s, and 1H and 13C high power pulses at a nutation frequency of 80.6 kHz. The 1H nutation frequency was ramped up from 64.5 to 80.6 kHz and the 13C nutation frequency was 72.6 kHz during the contact time of 1 ms in the CP experiment. The INEPT experiments were performed with the delay times τ1 of 1.8 ms and τ2 of 1.2 ms. All experiments were recorded under 68 kHz two-pulse phase modulation (TPPM) 1H decoupling53 or swept-frequency (SF) TPPM541H decoupling on the 500 and 800 MHz NMR spectrometers, respectively. The data were processed with a line broadening of 20 Hz, zero-filling from 1024 to 8192 time-domain points, Fourier transformation, phase and baseline correction by in-house Matlab code partially from matNMR.55The Q-INEPT experiments were measured by performing a refocused INEPT sequence in which the delay times τ1 and τ2 were varied (Fig. 2). The same spinning frequency of 5 kHz, power levels of pulses, 1H decoupling, and acquisition as in the PT ssNMR experiments were used in these quantitative experiments. All experiments on the model systems were performed by using recycle delays τR of 10 s, otherwise Q-INEPT was carried out on SC samples with a recycle delay τR of 5 s. The Q-INEPT data were processed in the same way as for the other 13C measurements. An absorptive Lorentzian peak shape
 | (5) |
The Q-DP experiments were performed on the 500 MHz spectrometer using the conventional DP sequence with a 90° pulse applied to the 13C magnetization followed by data recording under 68 kHz two-pulse phase modulation (TPPM) 1H decoupling.53 The experimental set-up of Q-DP is the same as Q-INEPT except the fact that a recycle delay τR of 50 s was used in Q-DP. The Q-DP data were processed in the same way as Q-INEPT data.
Conflicts of interest
There are no conflicts to declare.Acknowledgements
We thank Julien Trebosc for his help with the experiments on the 800 MHz spectrometer. The Swedish Research Council (VR) is gratefully acknowledged for financial support both through regular grants and the Linnaeus Center of Excellence “Organizing molecular matter” (E. S., D. T.). The Swedish Foundation for Strategic Research (E. S.) and the Crafoord Foundation (E. S.) are acknowledged for financial support. This project has received funding from the European Union's Horizon 2020 research and innovation programme under grant agreement no. 731019 (EUSMI) as well as from L’Oréal company.References
- P. M. Elias and D. S. Friend, J. Cell Biol., 1975, 65, 180–191 CrossRef CAS PubMed.
- R. J. Scheuplein, J. Invest. Dermatol., 1976, 67, 672–676 CrossRef CAS.
- J. A. Bouwstra, G. S. Gooris, W. Bras and D. T. Downing, J. Lipid Res., 1995, 36, 685–695 CAS.
- S. Björklund, A. Nowacka, J. A. Bouwstra, E. Sparr and D. Topgaard, PLoS One, 2013, 8, e61889 CrossRef PubMed.
- Q. D. Pham, S. Björklund, J. Engblom, D. Topgaard and E. Sparr, J. Controlled Release, 2016, 232, 175–187 CrossRef CAS PubMed.
- A. Alonso, N. C. Meirelles, V. E. Yushmanov and M. Tabak, J. Invest. Dermatol., 1996, 106, 1058–1063 CrossRef CAS PubMed.
- S. Björklund, Q. D. Pham, L. B. Jensen, N. Ø. Knudsen, L. D. Nielsen, K. Ekelund, T. Ruzgas, J. Engblom and E. Sparr, J. Colloid Interface Sci., 2016, 479, 207–220 CrossRef PubMed.
- E. H. Mojumdar, Q. D. Pham, D. Topgaard and E. Sparr, Sci. Rep., 2017, 7, 15712 CrossRef PubMed.
- A. Pines, M. G. Gibby and J. S. Waugh, J. Chem. Phys., 1972, 56, 1776–1777 CrossRef CAS.
- G. A. Morris and R. Freeman, J. Am. Chem. Soc., 1979, 101, 760–762 CrossRef CAS.
- A. Nowacka, P. C. Mohr, J. Norrman, R. W. Martin and D. Topgaard, Langmuir, 2010, 26, 16848–16856 CrossRef CAS PubMed.
- Q. D. Pham, D. Topgaard and E. Sparr, Langmuir, 2015, 31, 11067–11077 CrossRef CAS PubMed.
- Q. D. Pham, D. Topgaard and E. Sparr, Proc. Natl. Acad. Sci. U. S. A., 2017, 114, E112–E121 CrossRef CAS PubMed.
- A. Nowacka, N. A. Bongartz, O. H. Ollila, T. Nylander and D. Topgaard, J. Magn. Reson., 2013, 230, 165–175 CrossRef CAS PubMed.
- B. Elena, A. Lesage, S. Steuernagel, A. Bockmann and L. Emsley, J. Am. Chem. Soc., 2005, 127, 17296–17302 CrossRef CAS PubMed.
- A. V. Mäkelä, I. Kilpeläinen and S. Heikkinen, J. Magn. Reson., 2010, 204, 124–130 CrossRef PubMed.
- J. Hou, Y. He and X. Qiu, Macromolecules, 2017, 50, 2407–2414 CrossRef CAS.
- M. J. Janiak, D. M. Small and G. G. Shipley, J. Biol. Chem., 1979, 254, 6068–6078 CAS.
- P. Kekicheff, C. Grabiellemadelmont and M. Ollivon, J. Colloid Interface Sci., 1989, 131, 112–132 CrossRef CAS.
- R. V. McDaniel, T. J. McIntosh and S. A. Simon, Biochim. Biophys. Acta, 1983, 731, 97–108 CrossRef CAS.
- J. S. Alper and R. I. Gelb, J. Phys. Chem., 1990, 94, 4747–4751 CrossRef CAS.
- T. M. Ferreira, F. Coreta-Gomes, O. H. S. Ollila, M. J. Moreno, W. L. C. Vaz and D. Topgaard, Phys. Chem. Chem. Phys., 2013, 15, 1976–1989 RSC.
- D. G. Gadian and F. N. H. Robinson, J. Magn. Reson., 1979, 34, 449–455 CAS.
- A. E. Kelly, H. D. Ou, R. Withers and V. Dotsch, J. Am. Chem. Soc., 2002, 124, 12013–12019 CrossRef CAS PubMed.
- Q. D. Pham, A. Wolde-Kidan, A. Gupta, A. Schlaich, E. Schneck, R. R. Netz and E. Sparr, J. Phys. Chem. B, 2018, 122, 6471–6482 CrossRef CAS PubMed.
- E. K. Paulson, R. W. Martin and K. W. Zilm, J. Magn. Reson., 2004, 171, 314–323 CrossRef CAS PubMed.
- A. C. Williams and B. W. Barry, Adv. Drug Delivery Rev., 2004, 56, 603–618 CrossRef CAS PubMed.
- H. Schaefer and T. E. Redelmeier, Skin barrier: Principles of percutaneous absorption, Karger, Basel, Switzerland, 1996, pp. 43–86 Search PubMed.
- C. L. Silva, D. Topgaard, V. Kocherbitov, J. J. Sousa, A. A. Pais and E. Sparr, Biochim. Biophys. Acta, Biomembr., 2007, 1768, 2647–2659 CrossRef CAS PubMed.
- G. M. Golden, D. B. Guzek, A. H. Kennedy, J. E. McKie and R. O. Potts, Biochemistry, 1987, 26, 2382–2388 CrossRef CAS PubMed.
- G. M. Gray, R. J. White, R. H. Williams and H. J. Yardley, Br. J. Dermatol., 1982, 106, 59–63 CrossRef CAS PubMed.
- W. Boiten, S. Absalah, R. Vreeken, J. Bouwstra and J. van Smeden, Biochim. Biophys. Acta, Mol. Cell Biol. Lipids, 2016, 1861, 1652–1661 CrossRef CAS PubMed.
- J. Doucet, A. Potter, C. Baltenneck and Y. A. Domanov, J. Lipid Res., 2014, 55, 2380–2388 CrossRef CAS PubMed.
- X. Chen, S. Kwak, M. Lafleur, M. Bloom, N. Kitson and J. Thewalt, Langmuir, 2007, 23, 5548–5556 CrossRef CAS PubMed.
- E. Brief, S. Kwak, J. T. J. Cheng, N. Kitson, J. Thewalt and M. Lafleur, Langmuir, 2009, 25, 7523–7532 CrossRef CAS PubMed.
- A. Schroeter, S. Stahlberg, B. Skolova, S. Sonnenberger, A. Eichner, D. Huster, K. Vavrova, T. Hauss, B. Dobner, R. H. Neubert and A. Vogel, Soft Matter, 2017, 13, 2107–2119 RSC.
- S. Stahlberg, B. Školová, P. K. Madhu, A. Vogel, K. Vávrová and D. Huster, Langmuir, 2015, 31, 4906–4915 CrossRef CAS PubMed.
- S. Stahlberg, S. Lange, B. Dobner and D. Huster, Langmuir, 2016, 32, 2023–2031 CrossRef CAS PubMed.
- A. Paz Ramos, G. Gooris, J. Bouwstra and M. Lafleur, J. Lipid Res., 2017, 59, 137–143 CrossRef PubMed.
- S. Björklund, J. Engblom, K. Thuresson and E. Sparr, J. Controlled Release, 2010, 143, 191–200 CrossRef PubMed.
- R. Y. Lin, G. Carlstrom, Q. D. Pham, M. W. Anderson, D. Topgaard, K. J. Edler and V. Alfredsson, J. Phys. Chem. C, 2016, 120, 3814–3821 CrossRef CAS.
- E. Hellstrand, A. Nowacka, D. Topgaard, S. Linse and E. Sparr, PLoS One, 2013, 8, e77235 CrossRef CAS PubMed.
- T. X. Xiang and B. D. Anderson, Biochim. Biophys. Acta, Biomembr., 1998, 1370, 64–76 CrossRef CAS.
- O. G. Mouritsen, Life – As a Matter of Fat, Springer, Heidelberg, 1st edn, 2005 Search PubMed.
- D. F. Evans and H. Wennerström, The Colloidal Domain: Where Physics, Chemistry, Biology, and Technology Meet, Wiley-VCH, New York, 2nd edn, 1999 Search PubMed.
- O. C. Andronesi, S. Becker, K. Seidel, H. Heise, H. S. Young and M. Baldus, J. Am. Chem. Soc., 2005, 127, 12965–12974 CrossRef CAS PubMed.
- R. Huang, K. Yamamoto, M. Zhang, N. Popovych, I. Hung, S.-C. Im, Z. Gan, L. Waskell and A. Ramamoorthy, Biophys. J., 2014, 106, 2126–2133 CrossRef CAS PubMed.
- I. Matlahov and P. C. A. van der Wel, Methods, 2018, 148, 123–135 CrossRef CAS PubMed.
- D. T. Murray, M. Kato, Y. Lin, K. R. Thurber, I. Hung, S. L. McKnight and R. Tycko, Cell, 2017, 171, 615–627 CrossRef CAS PubMed.
- J. Clauss, K. Schmidt-Rohr, A. Adam, C. Boeffel and H. W. Spiess, Macromolecules, 1992, 25, 5208–5214 CrossRef CAS.
- Q. D. Pham, E. H. Mojumdar, G. S. Gooris, J. A. Bouwstra, E. Sparr and D. Topgaard, Q. Rev. Biophys., 2018, 51, 1–9 CrossRef PubMed.
- D. Eliezer, E. Kutluay, R. Bussell, Jr. and G. Browne, J. Mol. Biol., 2001, 307, 1061–1073 CrossRef CAS PubMed.
- A. E. Bennett, C. M. Rienstra, M. Auger, K. V. Lakshmi and R. G. Griffin, J. Chem. Phys., 1995, 103, 6951–6958 CrossRef CAS.
- R. S. Thakur, N. D. Kurur and P. K. Madhu, Chem. Phys. Lett., 2006, 426, 459–463 CrossRef CAS.
- J. D. van Beek, J. Magn. Reson., 2007, 187, 19–26 CrossRef CAS PubMed.
Footnote |
| † Electronic supplementary information (ESI) available. See DOI: 10.1039/d0cp00079e |
| This journal is © the Owner Societies 2020 |