
 Open Access Article
 This Open Access Article is licensed under a Creative Commons Attribution-Non Commercial 3.0 Unported Licence
Pressure-induced non-innocence in bis(1,2-dionedioximato)Pt(II) complexes: an experimental and theoretical study of their insulator–metal transitions†
Helen
Benjamin
a,
Jonathan G.
Richardson
a,
Stephen A.
Moggach
 *b,
Sergejs
Afanasjevs
c,
Lisette
Warren
a,
Mark R.
Warren
d,
David R.
Allan
d,
Carole A.
Morrison
*a,
Konstantin V.
Kamenev
c and
Neil
Robertson
*a
*b,
Sergejs
Afanasjevs
c,
Lisette
Warren
a,
Mark R.
Warren
d,
David R.
Allan
d,
Carole A.
Morrison
*a,
Konstantin V.
Kamenev
c and
Neil
Robertson
*a
aEaStCHEM School of Chemistry, University of Edinburgh, Edinburgh, UK. E-mail: neil.robertson@ed.ac.uk
bSchool of Molecular Sciences, and the Centre for Microscopy, Characterisation and Analysis, University of Western Australia, Australia
cSchool of Engineering and Centre for Science at Extreme Conditions, University of Edinburgh, Edinburgh, UK
dDiamond Light Source Ltd, Diamond House, Harwell Science and Innovation Campus, Didcot, Oxfordshire, OX11 0DE, UK
First published on 5th March 2020
Abstract
Bis(1,2-dionedioximato) complexes of Pt(II) are known for their propensity to form linear chains of metal complexes in the solid state, and under the application of pressure members of the family display interesting optical and conductive properties. Two examples, Pt(bqd)2 and Pt(dmg)2, are known to undergo insulator-to-metal-to-insulator transitions, with the metallic state reached at 0.8–1.4 GPa and 5 GPa, respectively. Previous interpretations of these materials’ behaviour focused on the role of the filled dz2 and vacant p orbitals on platinum, with little consideration to the role of the ligand. Here, the pressure-structural behaviour of Pt(bqd)2 is investigated through single crystal X-ray diffraction, the first such study on this material. The difference in conductive behaviour under pressure between Pt(bqd)2 and Pt(dmg)2 is then interpreted through a combination of experimental and computational methods, including conductivity measurements under high pressure and electronic structure calculations. Our computational work reveals the significant contribution from ligand low-lying vacant π-orbitals to the frontier orbitals and bands in these complexes, and provides an explanation for the experimentally observed re-entrant insulator-to-metal-to-insulator transitions, and the differences in behaviour between the two compounds.
Introduction
Since the discovery of the high conductivity of Krogmann's complex (K2[Pt(CN)4Br0.30]·2.3H2O), transition metal complexes that form linear chains of metal ions in the solid state have been of interest as potential candidates for molecular wires or high temperature superconductors.1,2 Particular focus has been placed on square planar d8 complexes due to their propensity to form one-dimensional stacks with short metal⋯metal distances (2.80–3.60 Å for Pt complexes).3 One such family of materials are the bis(1,2-dionedioximato) complexes of Pt(II), which display interesting optical and conductive properties under the application of external pressure. In the solid state the complexes stack in 1D columns, with metal⋯metal separation distances in the range of 3.18–3.60 Å, and with neighbouring molecules related by an approximate 90° rotation (see Fig. 1). Under application of pressure, significant shifts in electronic absorption bands have been reported;4,5 for example, the absorption band of Pt(dpg)2 (where dpg = diphenylglyoximato) shifts at a rate of −3000 cm−1/GPa, resulting in a colour change from red/brown to green to yellow in the 0–2 GPa range.6 The electrical conductivity of these materials is also dramatically affected by the application of pressure: complexes Pt(bqd)2 (bqd = benzoquinonedioximato) and Pt(dmg)2 (dmg = dimethylglyoximato) undergo a 4-fold and 15-fold order of magnitude change in conductivity, becoming metallic at 0.6–1.4 and 5 GPa, respectively.4,5,7,8 Increasing the applied pressure (to 2 GPa for Pt(bqd)2, and 6.4 GPa for Pt(dmg)2) results in further changes, with both complexes now best described as semiconductors.5 This change in material property behaviour has previously been correlated with a decrease in the Pt⋯Pt distance.5,6,9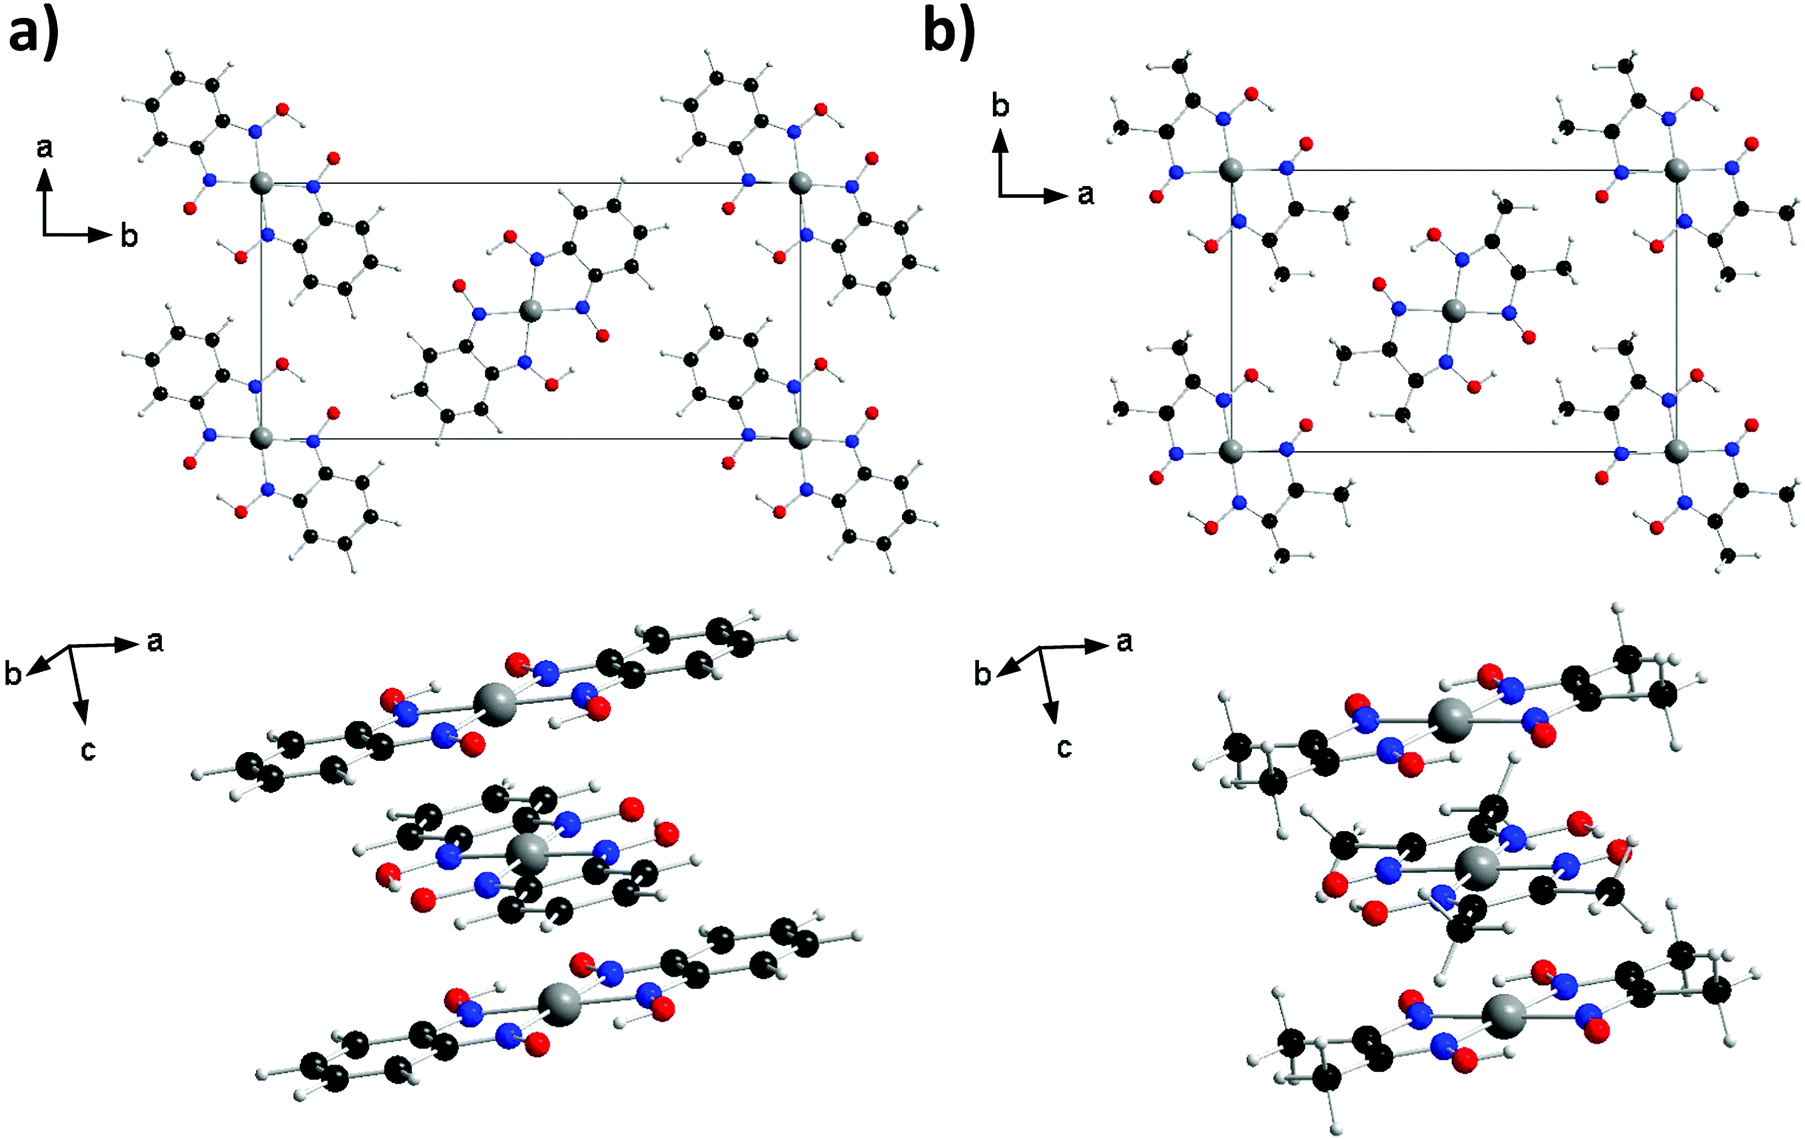 | ||
| Fig. 1 Crystal structures of bis(1,2-dionedioximato)Pt(II) complexes (a) Pt(bqd)2 and (b) Pt(dmg)2. Top: One sheet of molecules in the ab plane. Bottom: The stacking between neighbouring molecules along the c axis. Atoms are coloured: Pt (dark grey), O (red), N (blue), C (black) and H (light grey). | ||
These compounds have relatively narrow electronic band gaps (Pt(bqd)2 in fact has moderate [10−3 S cm−1] room temperature conductivity), which has been rationalised on the basis of strong intermolecular interactions between the metal ions stacked in the columns. This results in a broadening of the filled Pt 5dz2 and vacant 6pz bands, which represent the highest occupied and lowest unoccupied crystalline orbitals (the HOCO, and LOCO), respectively.5,10,11 While the ligand is thought to facilitate metal⋯metal stacking through crystal packing, it is seldom considered in the molecular orbital interpretation, leaving little explanation as to why materials with similar metal⋯metal distances, such as Pt(bqd)2 (3.18 Å) and Pt(dmg)2 (3.26 Å), show such large variation in response to the application of pressure.
While a study has been reported on the impact of pressure on the single crystal structure of Pt(dmg)2 (0–3.84 GPa) the structural behaviour of Pt(bqd)2 under pressure has only been studied via high pressure powder diffraction, which only provided information on the effect of pressure on the unit cell parameters.4,7,12 Relatively little theoretical work has been conducted on these complexes, with only one report on the molecular orbital character of Pt(dmg)2,13 and one study simulating the effect of pressure on a linear column of eight molecules, constructed to mimic the 1D stack observed in the crystal structure.14
In this paper we report high-pressure single crystal measurements for Pt(bqd)2 and investigate the role played by the choice of dioximato ligand on the electronic structure and conductive behaviour of the resultant platinum complexes by considering two complexes, Pt(bqd)2 and Pt(dmg)2 (Fig. 1). While the complexes crystallise with similar structures and comparable Pt⋯Pt distances, the two ligands differ significantly in the extent of electronic conjugation. For Pt(dmg)2 the delocalised structure encompasses the N, O, C, H-containing chelate, while in Pt(bqd)2 the conjugation extends to include the benzene rings. To determine to what extent this difference impacts the complexes’ electronic behaviour we first investigate the structural behaviour of Pt(bqd)2 under the application of pressure in the range 0–2.38 GPa, using single-crystal X-ray diffraction, the first such study on this material. We then determine electronic band structures of both Pt(bqd)2 and Pt(dmg)2 using hybrid density functional theory (DFT), to ascertain how they change when an external pressure is applied. We support these calculations with experimental high pressure conductivity measurements conducted on a compressed powder of Pt(bqd)2, and by comparison with the previously reported semiconductor-to-metal-to-semiconductor transition.5 The differences in the electronic structures of Pt(bqd)2 and Pt(dmg)2 are then interpreted through isolated molecule calculations, which reveal the previously-neglected role of the ligand in directing the pressure response of both compounds.
Results and discussion
Pt(bqd)2 crystallography
Crystals of Pt(bqd)2 obtained herein exhibited a structure commensurate to that obtained in previous studies (space group Ibam, Table S1, ESI†) at ambient pressure,5,7,8,15 with the Pt⋯Pt stacking direction corresponding to the crystallographic c-axis. The location of the oxime proton was located in a difference map in the ambient structure, and its position refined with 1,2 and 1,3 restraints. This position is in agreement with the H-atom position found in the Pd analogue.16 In all subsequent high-pressure structures, the position of the H-atom was presumed to remain on the same O-atom, in agreement with the cell-constrained geometry optimisation calculations. On application of pressure, the space group remained unchanged, with no obvious drop in diffraction data quality (Table S1, ESI†). The overall extent and rate of compression was in good agreement with the results observed previously using high-pressure powder X-ray diffraction,7 with around 6.6% and 12.6% compression in the unit cell volume at 1.03 GPa and 2.38 GPa respectively (Fig. 2a). The contribution to the volumetric compression is highly anisotropic, with the majority of the compression attributed to the c-axis direction (equating to 60–70% of the overall volumetric compression).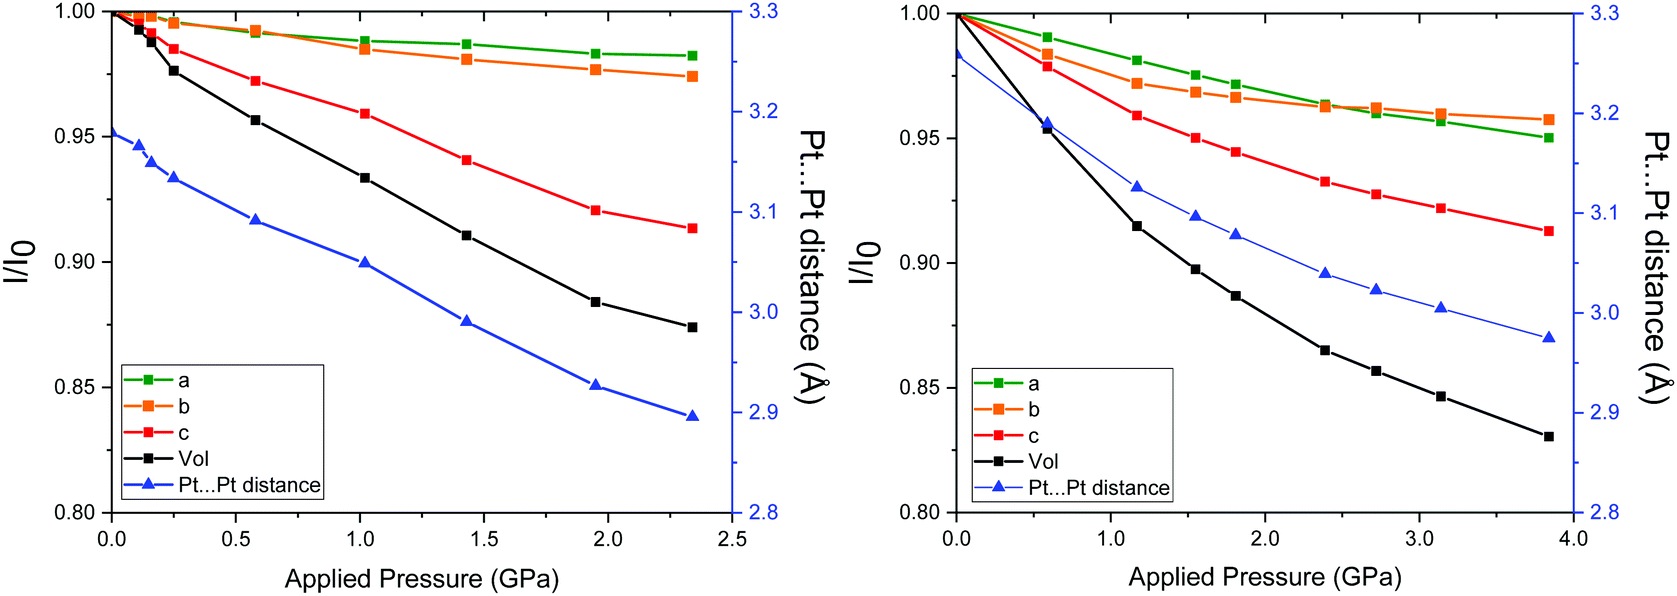 | ||
| Fig. 2 Left: Compression of the unit cell parameters of Pt(bqd)2 at each pressure point as a fraction of the parameters from ambient pressure unit cell, and the corresponding Pt⋯Pt distance. All standard deviations are smaller than the symbols used. Right: For comparison, the compression of the unit cell parameters of Pt(dmg)2 at each pressure point as a fraction of the parameters from ambient pressure unit cell, and the corresponding Pt⋯Pt distance, reproduced from ref. 12. | ||
No significant change was observed in the Pt coordination environment or Pt–N bond lengths throughout the pressure series (Table S2, ESI†). Moreover, the pair of angles of rotation between molecules stacking down the c-axis remain essentially constant throughout the pressure series, ranging from 87.4(4)° and 92.6(4)° to 88.9(10)° and 91.1(10)° (Table S2, ESI†). This lack of intramolecular structural and orientational variability allows us to describe the compression of Pt(bqd)2 through the compression of each of the lattice parameters.
The pressure point at 1.03 GPa is of particular importance, since this is the region at which the insulator to metal transition was observed in previous studies.7,8 At this pressure point in the current study, the Pt⋯Pt stacking distance was observed as 3.05 Å, hence equating to a decrease of 0.13 Å compared to the Pt⋯Pt distance observed at ambient conditions.
In order to compare the compressibility of Pt(bqd)2 with Pt(dmg)2 literature data for the latter (to ca. 4 GPa)12 are plotted alongside our measurements for the former in Fig. 2. The unit cell volume–pressure relationships for both were fitted using a Birch–Murnaghan 3rd order equation of state (see ESI†) in order to extract the bulk modulus (B0) and its derivative (B0′). With a value of B0 = 11.7 GPa (and B0′ = 5.5), Pt(bqd)2 is slightly less compressible than Pt(dmg)2, which has B0 = 8.5 GPa (and B0′ = 11.4). However, this masks the individual axes responses, which sees the greatest contraction in the c-axis in Pt(bqd)2 (12.5% at 2.4 GPa, compared to 6.7% for Pt(dmg)2 at the same pressure point). The a- and b-axes are much less affected in both compounds, especially so for Pt(bqd)2 (contracting by 1.7 and 2.6% at 2.4 GPa, compared to ca. 3.6% for both axes in Pt(dmg)2). At this point, it is worth noting that at 0.59 GPa the Pt⋯Pt distance in Pt(dmg)2 reaches 3.19 Å, a distance comparable to that of Pt(bqd)2 at ambient pressure, and at 2.39 GPa it reaches 3.03 Å, comparable to the 3.05 Å distance achieved by Pt(bqd)2 after 1.03 GPa of applied pressure. This comparison will be valuable when considering the difference in electronic structure and behaviour of the two materials under application of pressure.
High pressure conductivity
Herein we have probed the conductive behaviour of Pt(bqd)2 as a compressed powder under applied pressure, in order to assess its performance in the bulk state through comparison with single crystal literature reports.5,7 The resistivity of the compressed powder was measured on a pellet using a diamond anvil cell (DAC) apparatus (Fig. 3), and was found to decrease dramatically in the pressure range of 0.0–2.1 GPa, undergoing a 7-order of magnitude change, a significantly larger response than that reported for the single crystal. Unlike for the measurements conducted on single crystals,5 the resistivity does not begin to increase above 1.4 GPa. These deviations from the reported single crystal behaviour can be explained by the fact that the resistivity change of a compressed powder under pressure will be a combination of two effects, (i) the inherent response of the material to the application of pressure, a property that we investigate through electronic structure calculations, and (ii) the response of inter-grain boundaries under pressure. The greater response of the pellet in the 0–1.4 GPa range and the fact the resistivity of the pellet plateaus rather than increasing again above 1.4 GPa suggest that the inter-grain resistance decreases as the grains become more compacted with increasing pressure.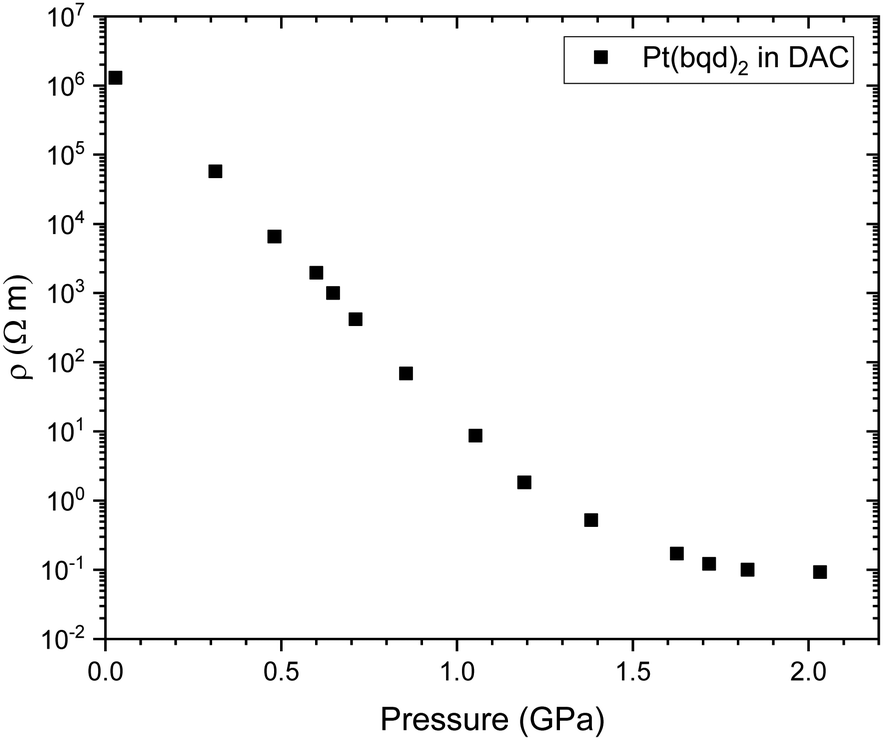 | ||
| Fig. 3 Electrical resistivity (ρ) of a compressed pellet of Pt(bqd)2 under application of pressure, measured in a DAC. | ||
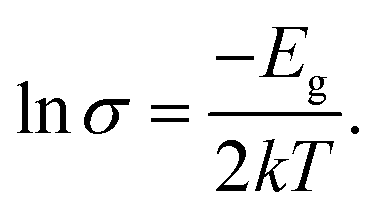
In order to provide a benchmark for our calculations the temperature dependence of the conductivity was assessed at ambient pressure to provide an estimate of the band gap; measurements on a compressed pellet showed that Pt(bqd)2 behaved as a semiconductor with a band gap of 1.00 eV, which is comparable to previous reports (0.25–0.84 eV, obtained from measurements on single crystals and in thin films via conductive and optical measurements).7,9,17,18 The temperature dependence of the conductivity was also investigated at a series of pressure points commensurate with the pressure range investigated in our crystallography study (Fig. 4), in order to investigate whether the semiconductor-to-metal-to-semiconductor transition is accessible in the bulk materials. The compressed powder shows semiconductor behaviour at 0.39 and 2.03 GPa, with conductivity increasing with increasing temperature, and 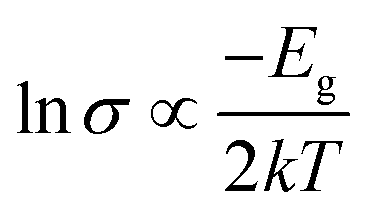 where Eg is the band gap. Metallic behaviour was observed at 0.62 and 0.88 GPa, with conductivity decreasing with increasing temperature, consistent with the observations in the literature.5,7,8
 | ||
| Fig. 4 Temperature dependence of the conductivity (σ) of compressed powder of Pt(bqd)2 at a series of high pressures. | ||
Pt(bqd)2 and Pt(dmg)2 electronic structure calculations
 | ||
| Fig. 5 Left: Ambient pressure computed band structure, projected density of states (PDOS), broken down onto atomic contributions, and the COHP plot showing Pt⋯Pt interaction and interlayer N⋯N interaction for Pt(bqd)2. The Fermi energy is set at 0 eV (dashed line, EFermi = −4.95 eV). Right: Associated k-point positions and vector path in the Brillouin zone. | ||
 | ||
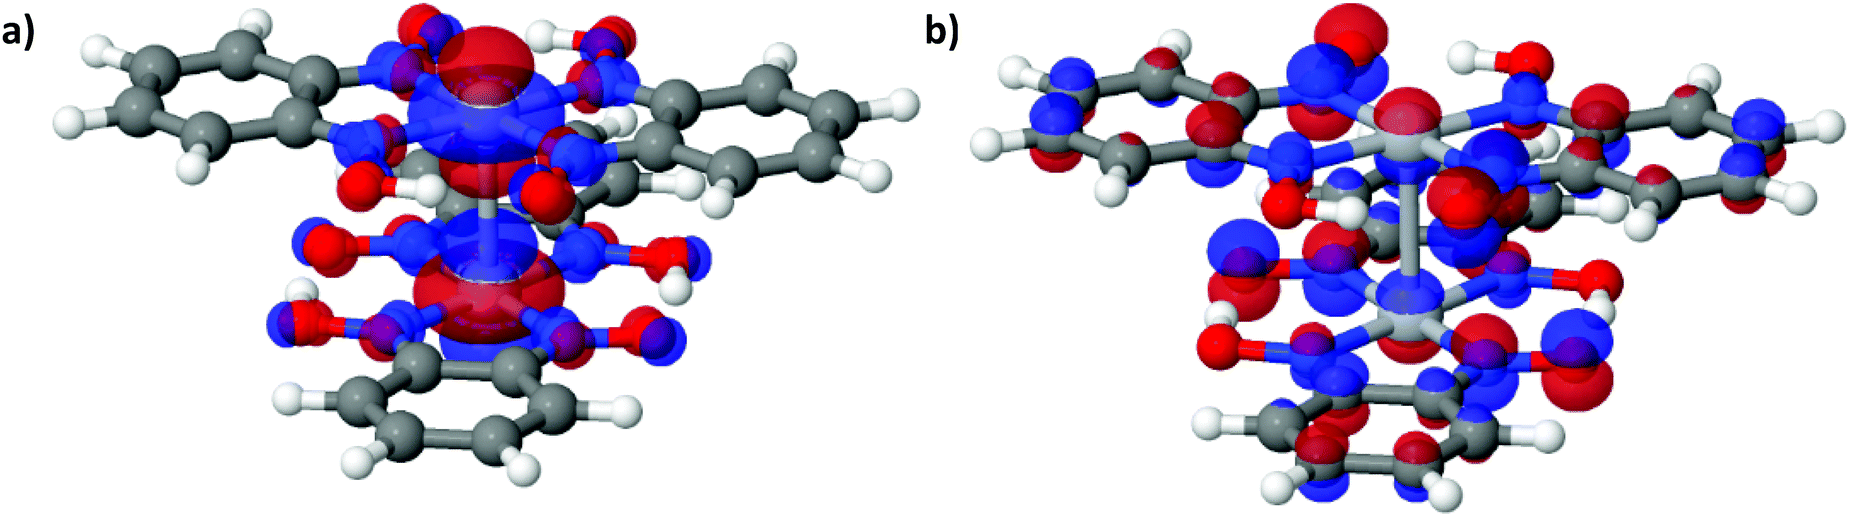
| Fig. 6 (a) LUCO and (b) HOCO of Pt(bqd)2 at the Γ point, at ambient pressure. The atoms are coloured as follows: white = H, dark grey = C, red = O, purple = N, light grey = Pt. | ||
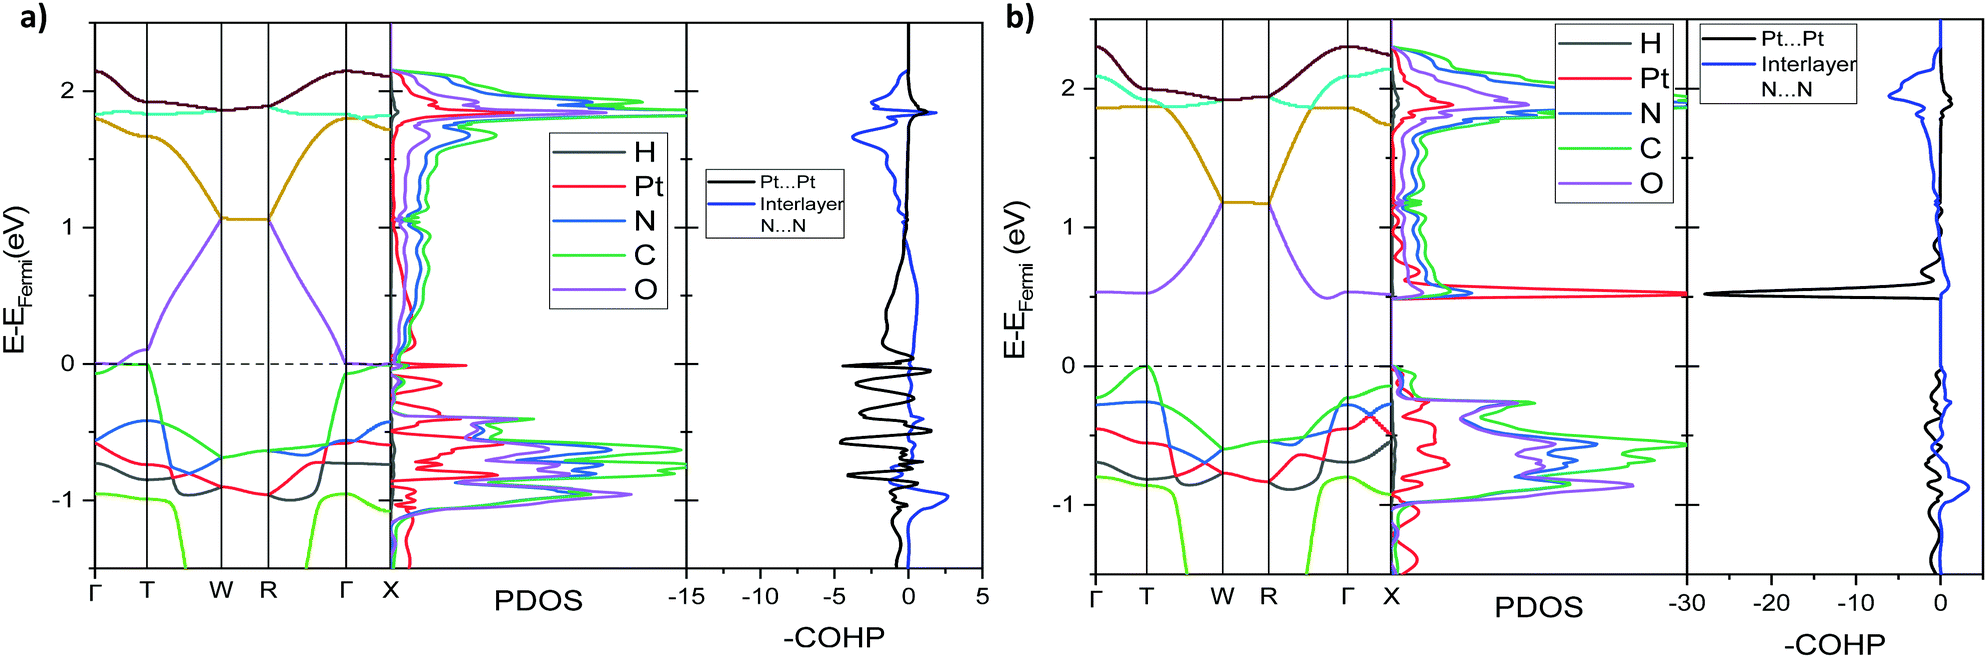
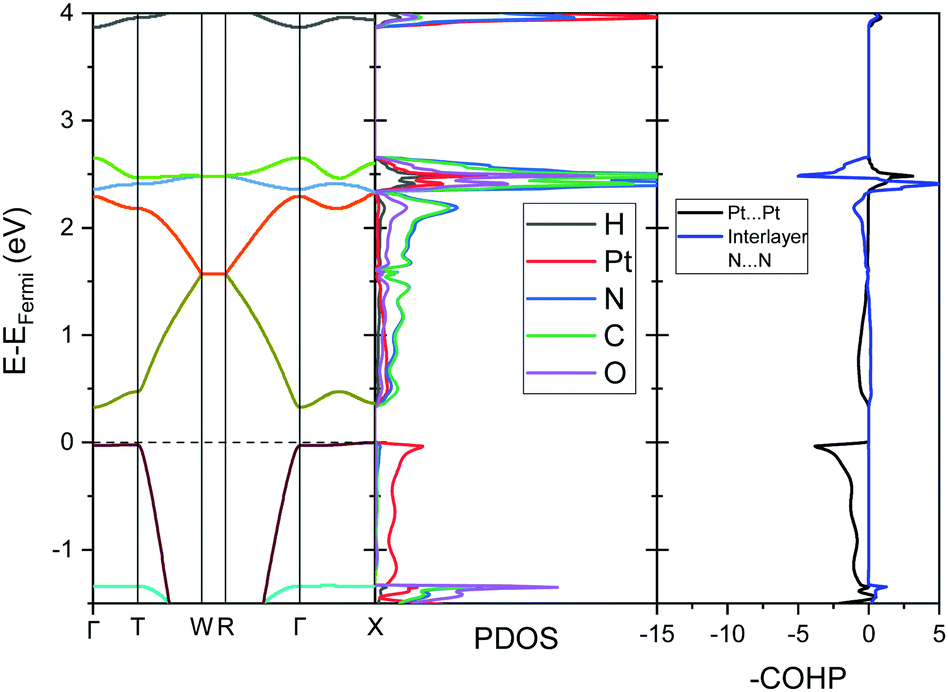
To further analyse the nature of the interaction between adjacent molecules within the chain, COHP analyses were performed to partition the band-structure energies in terms of orbital-pair contributions into bonding, non-bonding and anti-bonding regions.19–21 By convention, the negative of the COHP is plotted so that bonding states appear as positive values and antibonding states as negative values with respect to the x-axis, while non-bonding states disappear from the plot. The interactions investigated were the Pt⋯Pt interaction, and the N⋯N interactions between neighbouring molecules in the chain, as they occupy an almost occluded geometry when viewed down the c-axis. From the COHP calculations (Fig. 5) it can be seen that the top of the valence band possesses significant antibonding character with respect to the Pt⋯Pt interaction, and is non-bonding with respect to the interlayer N⋯N interaction, in agreement with the HOCO shown in Fig. 6(b). By comparison, the interaction between the Pt centres is relatively weak (effectively non-bonding) in the conduction band, while a slightly more pronounced bonding interaction is observed between the nitrogen atoms, which agrees with the relatively poor orbital overlap shown in the LUCO in Fig. 6(a). This N⋯N interaction becomes antibonding in the LUCO+1, which is consistent with the visualisation of the crystalline orbital.
The analogous results for Pt(dmg)2 are presented in Fig. 7 and 8, which show that while the band structure and PDOS are very similar to that of Pt(bqd)2 the band gap is now considerably larger. The calculated band gap, 1.44 eV, compares reasonably with the experimental value (2.10 eV).22,23 As with Pt(bqd)2 the top of the valence band has predominantly metal character, while the bottom of the conduction band has predominantly ligand character with a small contribution from Pt. Analysis of the crystalline orbitals (Fig. 8) shows the HOCO and LUCO at the Γ point possess the same orbital character as seen for Pt(bqd)2.
 | ||
| Fig. 7 Left: Ambient pressure computed band structure, PDOS, broken down onto atomic contributions, and the COHP plot showing Pt⋯Pt interaction and interlayer N⋯N interaction for Pt(dmg)2. The Fermi energy is set at 0 eV (dashed line, EFermi = −4.94 eV). Right: Associated k-point positions and vector path in the Brillouin zone. | ||
 | ||
| Fig. 8 (a) LUCO and (b) HOCO of Pt(dmg)2 at the Γ point, at ambient pressure. The atoms are coloured as follows: white = H, dark grey = C, red = O, purple = N, light grey = Pt. | ||
As the Pt⋯Pt distances are similar (3.18 Å and 3.26 Å for Pt(bqd)2 and Pt(dmg)2, respectively) it seems unlikely that the reason for this difference in band gap can be attributed solely to the spacing (and therefore interaction) between the Pt ions. The energy and construct of the top of the valence band is comparable for both complexes, so the difference in band gap between the two materials can be largely attributed to variations in the position of the conduction bands. From the PDOS and crystalline orbital calculations presented herein it is clear that for Pt(bqd)2 and Pt(dmg)2 the π system of the ligand plays a significant role in the construct of the frontier conduction band. This contrasts with current understanding in the literature, where it has been assumed that the role of the ligand π system was just to accept the back donation of electron density from the metal centre, rather than contribute directly to the character of the frontier bands.9,11,18,24
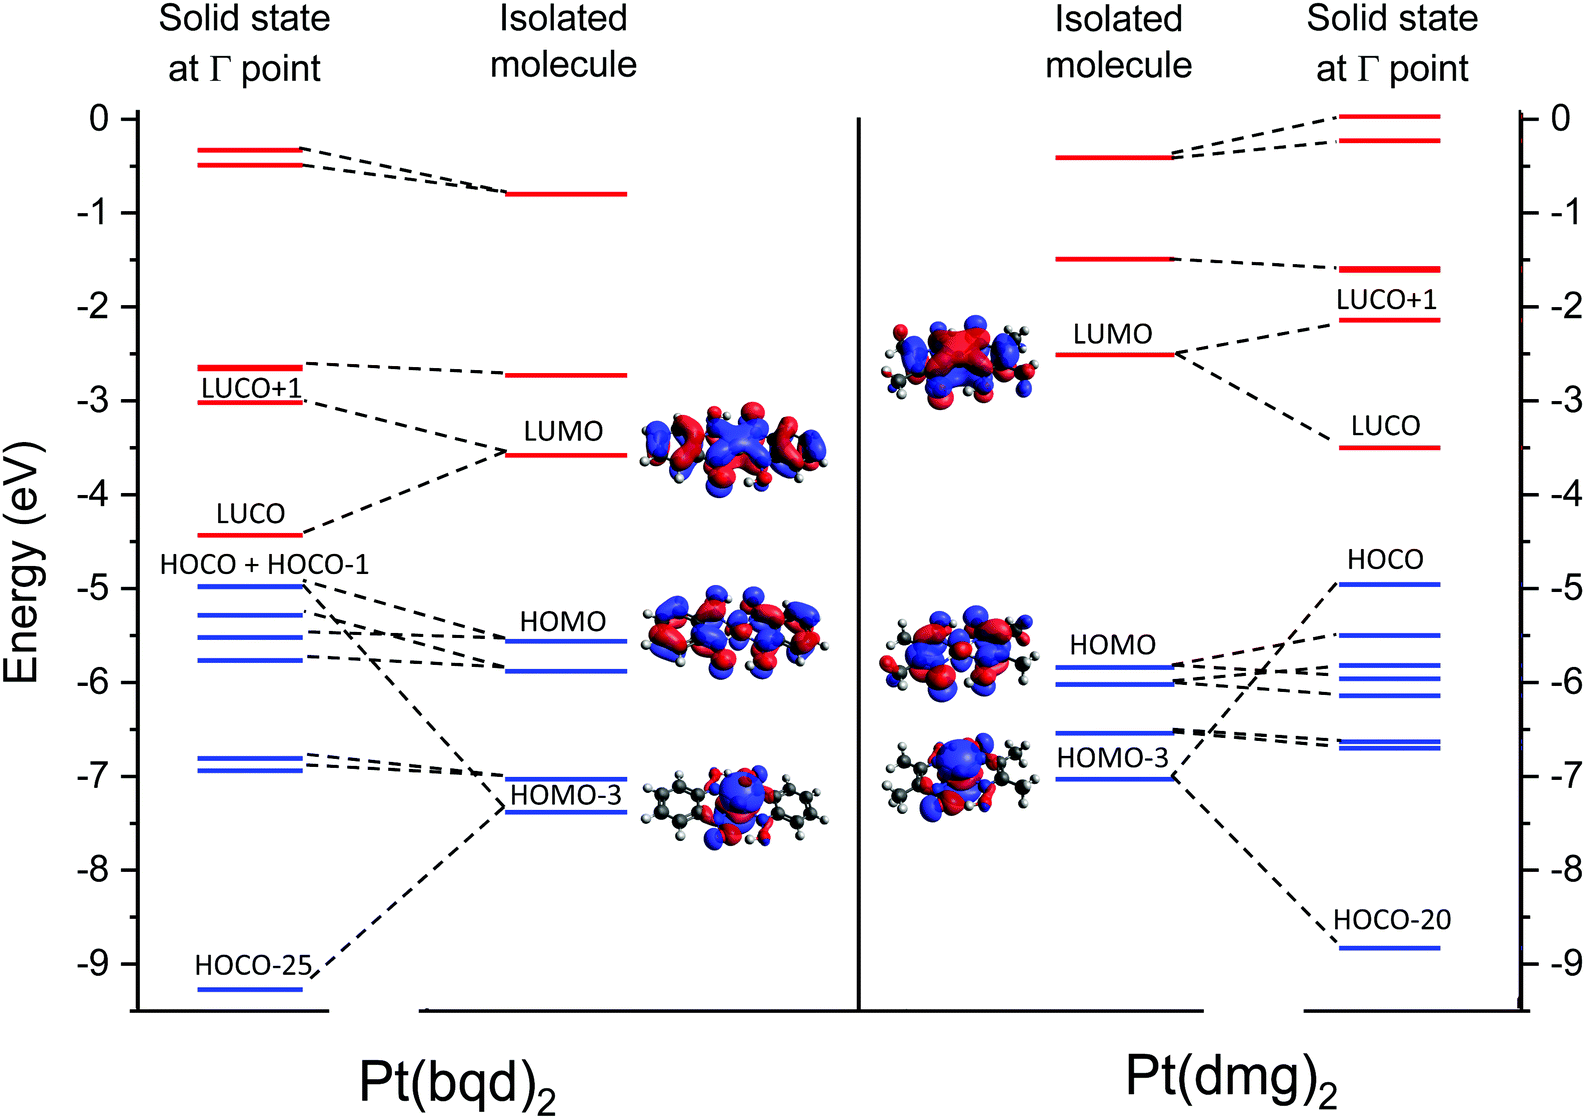 | ||
| Fig. 9 Energies of selected frontier molecular orbitals of Pt(bqd)2 and Pt(dmg)2 (isocontour value of 0.02100); and the bands these MOs contribute to in the solid state. Occupied orbitals/bands are shown in blue, unoccupied orbitals/bands in red. Bands between the HOCO−6 and HOCO−20 (for Pt(dmg)2)/HOCO−25 (for Pt(bqd)2) are omitted for clarity, and energies for the solid state bands are shown at the Γ point. | ||
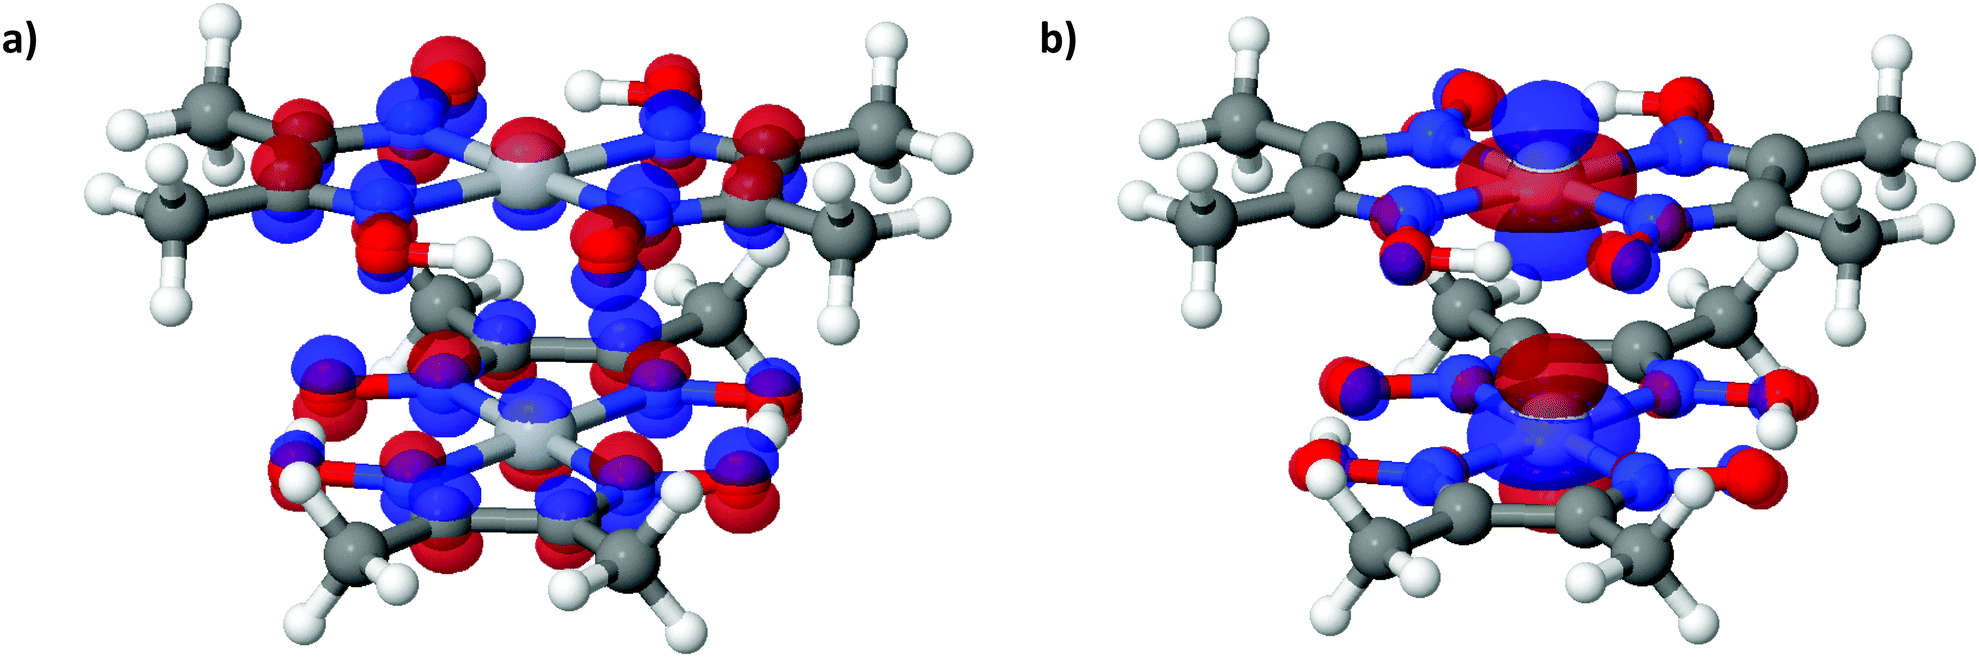
From visualisation of the MOs it is clear that the frontier orbitals for isolated molecules of Pt(bqd)2 and Pt(dmg)2 are qualitatively the same up to and including the LUMO+2, and the importance of the ligand is readily apparent; hybridisation between the ligand π system and metal d-orbitals can be seen in the filled and the vacant MOs for both complexes. The main difference between the two complexes lies in their relative energy levels (Fig. 9). While the difference in the HOMO levels of the two complexes is relatively small (0.35 eV) the difference between the LUMO levels is much greater (1.05 eV), resulting in a calculated optical gap of 2.0 eV for Pt(bqd)2, compared to 3.4 eV for Pt(dmg)2. This difference can be explained by the greater extent of conjugation in Pt(bqd)2: the benzene rings contribute significantly to the frontier molecular orbitals, with percentage contributions on the order of 25–40% for the HOMO−1 to LUMO+1, whereas the percentage contributions from the methyl groups to the corresponding orbitals in Pt(dmg)2 are under 5% (ESI†).
It is worth noting here that, despite the HOCO band in both complexes possessing significant dz2 character, the dz2 orbital does not contribute towards the HOMOs for the molecular systems. For both complexes this contribution is present in the HOMO−3 which sits significantly lower in energy; this highlights the impact that the solid state packing has on modulating the electronic properties of the molecules.
Armed with knowledge of the makeup of the molecular orbitals in isolated molecules of Pt(bqd)2 and Pt(dmg)2 we can now consider how these molecular orbitals interact to form bands in the solid state. On moving to the solid state the Pt⋯Pt stacking results in significant interactions along the c-axis, specifically between the Pt centres and between the nitrogen atoms in adjacent molecules; as a result molecular orbitals possessing substantial c-axis components on these atoms will experience interactions with their neighbours on moving to the solid state, resulting in the formation of pairs of bands with varying degrees of separation and dispersion, depending on the strength of the intermolecular interaction. The relative energies of the bands (at the Γ-point) are illustrated in Fig. 9, along with the molecular orbitals they originate from. Visualisations of crystalline orbitals beyond the HOCO and LUCO are available in the ESI.†
Considering the occupied orbitals first, contributions from the HOMO can be identified in the HOCO−1 and the HOCO−3 for both Pt(bqd)2 and Pt(dmg)2. The HOCO−2 and HOCO−4 derive from the overlap of the HOMO−1 for neighbouring complexes, while the HOCO−5 and HOCO−6 derive from the interaction between neighbouring HOMO−2 orbitals. For the most part the pairs of bands derived from the bonding/antibonding combinations of neighbouring molecular orbitals are relatively close in energy, a result of poor orbital overlap between neighbouring molecules displaced by the stacking twist along the c-axis. By contrast, the pair of bands originating from the overlap of neighbouring HOMO−3 orbitals, being largely based on the Pt dz2 orbital which stack directly on top of each other along the c-axis, differ significantly in energy due to their strong neighbouring interaction. Thus, the antibonding interaction of the HOMO−3 molecular orbitals gives rise to the HOCO of both compounds, while the bonding combination is captured in the HOCO−25 and the HOCO−20 for Pt(bqd)2 and Pt(dmg)2, respectively (Fig. 9). The strength of this interaction can be assessed from the separation of the resulting bands, which is 4.29 eV at their widest point (the Γ point) for Pt(bqd)2, compared to 3.87 eV for Pt(dmg)2. The difference between the two could be attributed to the difference in Pt⋯Pt distance, as the shorter distance in Pt(bqd)2 (3.18 Å vs. 3.26 Å) would result in an increased interaction.
In terms of the unoccupied orbitals, for both complexes adjacent LUMOs combine to form the LUCO (bonding combination) and LUCO+1 (antibonding combination) bands (Fig. 9). These bands show a large separation (1.41 eV at the widest point (the Γ point) for Pt(bqd)2 compared with a 1.36 eV separation for Pt(dmg)2), indicating strong coupling. This small difference between the two can, again, be attributed to the shorter Pt⋯Pt distance in Pt(bqd)2. By contrast, the interaction between neighbouring LUMO+1 orbitals (and LUMO+2 orbitals, see ESI†) is relatively weak due to the stack twist, resulting in small separation between the LUCO+2 and LUCO+3 bands, and the LUCO+4 and LUCO+5 bands.
As can be seen clearly from Fig. 9 the extent of intermolecular interaction in the solid state is broadly similar for the two complexes, as evidenced by the comparable amounts of band separation arising from the bonding/antibonding combination of molecular orbitals. While the small difference in Pt⋯Pt separation between the two compounds accounts for small variations in resulting band structures, it is not sufficient to account for the large difference in band gap at ambient pressure. Instead, it can be credited to the inherent lower energy of the LUMO in Pt(bqd)2 (and in turn the LUCO), which in turn can be attributed to the greater delocalisation onto the chelating ligand. Thus it is demonstrated that the electronic properties of the ligand can play an active role in controlling the magnitude of the material band gap beyond that directed by crystal packing effects.
 | ||
| Fig. 10 Calculated band gap vs. pressure for Pt(bqd)2. | ||
 | ||
| Fig. 11 Computed band structure, PDOS, broken down onto atomic contributions, and the COHP plot showing Pt⋯Pt interaction and interlayer N⋯N interaction for Pt(bqd)2 at (a) 1.03 GPa, (dashed line, EFermi = −4.67 eV), and (b) 2.38 GPa, (dashed line, EFermi = −4.78 eV). Brillouin zone path as defined in Fig. 5. | ||
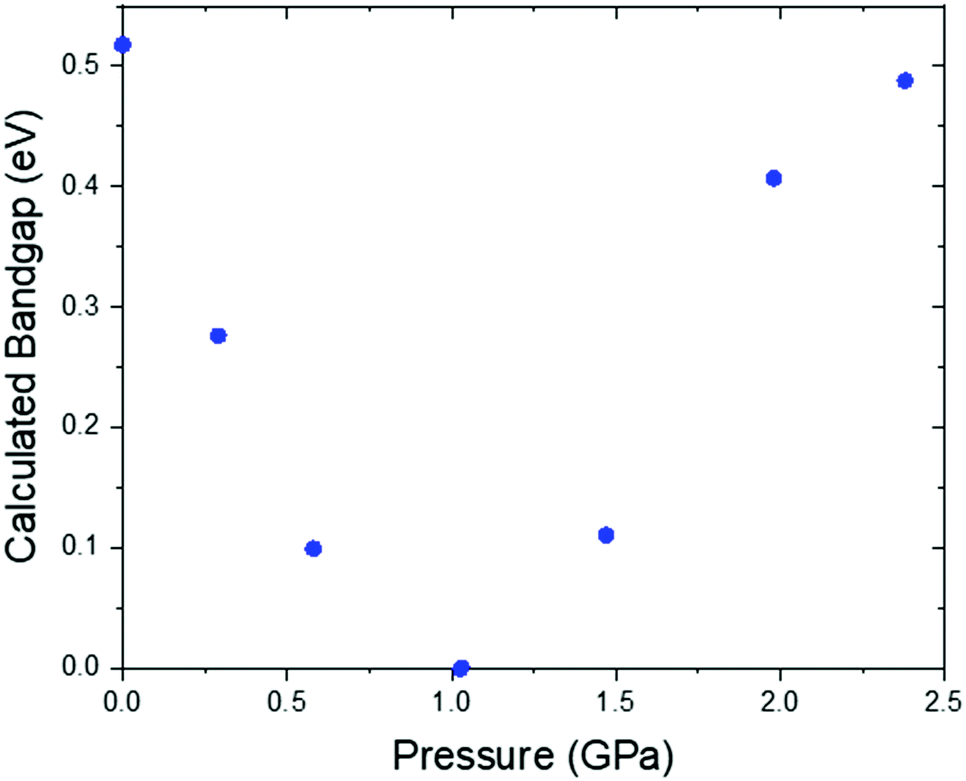
Under application of pressure the computed band gap of Pt(bqd)2 decreases (Fig. 10), reaching 0.0 eV at a pressure of 1.03 GPa, with two contact points between the top of the valence band and the bottom of the conduction band (along Γ–X and Γ–T, Fig. 11(a)). This is consistent with our experimental conductivity measurements on the compressed powder pellet, which showed metallic behaviour for Pt(bqd)2 in the range 0.6–0.8 GPa, and other experimental studies which report metallisation at 0.8 GPa and 1.4 GPa.5,7 Up until the point where the band structure becomes metallic, the nature of the valence and conduction bands (see ESI†) remains similar to that of the ambient pressure structure. At ambient pressure the HOCO−1 band, derived from the overlap of HOMOs on adjacent molecules, has a similar energy to that of the HOCO, resulting in a significant contribution from the ligand orbitals to the DOS near the Fermi level (Fig. 9). Under the application of pressure the HOCO substantially increases in energy, as it is derived from the antibonding contribution of the HOMO−3 orbitals, which have a significant overlap that is further enhanced by contraction of the c-axis. This increase is reflected in the increase in the Fermi level, which sits at the edge of the HOCO and increases from −4.94 eV to −4.67 eV by 1.03 GPa. By comparison, the HOCO−1 does not undergo as significant a shift in energy, due to the poorer overlap between neighbouring HOMO orbitals; as a result, a separation emerges between the HOCO−1 and HOCO bands, resulting in the DOS at the valence band being dominated by Pt at high pressures (up to 1.03 GPa). The decrease in band gap up to 1.03 GPa can thus be rationalised by the increased interaction between neighbouring molecules as a result of the decreased inter-layer separation, which in turn raises the energy of the HOCO while lowering the LUCO band.
Once the pressure exceeds 1.03 GPa the computed band gap re-opens (Fig. 10), and there is a change in the nature of the frontier bands along the T–W and R–Γ directions, illustrated in Fig. 11b for the 2.38 GPa pressure point. Along the T–W and R–Γ directions, the HOCO band is now predominately ligand based, with a much smaller contribution from the Pt ion, and the LUCO in turn is now dominated by an anti-bonding Pt⋯Pt interaction (as shown by the –COHP plot).
This is also accompanied by a reduction in dispersion of the LUCO band. From a cross-reference of the ambient pressure crystal orbitals at the Γ point (given in Fig. 6) it is apparent that the frontier bands have switched order on application of pressure, with the antibonding combination of dz2 orbitals now being empty, and the ligand π orbital now being filled (Fig. 12). This can be interpreted as a relocation of electron density from the Pt ions onto the ligands, indicating that the ligands become ‘non-innocent’ at pressures greater than 1.03 GPa. The re-emergence of the band gap is supported experimentally by our high pressure conductivity data, suggesting that at 2.03 GPa the complex shows semiconductor behaviour (Fig. 4), and is consistent with the literature observation that Pt(bqd)2 undergoes a semiconductor-to-metal-to-semiconductor transition as a single crystal.5,7,8 This pressure-induced band inversion is reminiscent of the behaviour of some topological insulators.25–27
 | ||
| Fig. 12 (a) The LUCO and (b) the HOCO of Pt(bqd)2 at the Γ point, at 2.38 GPa. The atoms are coloured as follows: white = H, dark grey = C, red = O, purple = N, light grey = Pt. | ||
According to the literature, the conductivity of Pt(dmg)2 exhibits a similar behaviour to Pt(bqd)2 under the application of pressure, however the insulator-to-metal transition occurs at much higher pressure (5 GPa).5 To investigate the effect of pressure on the electronic structure of Pt(dmg)2 we calculated the band structure, PDOS and –COHP Pt⋯Pt interaction at 3.14 GPa (Fig. 13), the highest pressure point obtained in the literature single crystal study.12 At this pressure a significant band gap (0.33 eV) remains, and the nature of the frontier bands is the same as observed at ambient, pressure (Fig. 7). This supports the literature observation that Pt(dmg)2 requires higher pressures than Pt(bqd)2 to metallise. By 3.18 GPa the Pt⋯Pt distance in Pt(dmg)2 has contracted to 3.00 Å significantly increasing the intermolecular interactions between the layers; this can be seen from the dramatic increase in dispersion in the frontier bands compared to the ambient structure, and the fact that the Fermi level, which sits are the edge of the HOCO, has increased to −4.08 eV, compared to −4.94 eV in the ambient structure.
 | ||
| Fig. 13 Computed band structure, PDOS, broken down onto atomic contributions, and the COHP plot showing Pt⋯Pt interaction and interlayer N⋯N interaction for Pt(dmg)2 at 3.14 GPa. The Fermi energy is set at 0 eV (dashed line, EFermi = −4.08 eV). | ||
Finally, to further support our conclusion that small differences in Pt⋯Pt distance between Pt(bqd)2 and Pt(dmg)2 is not sufficient to account for the large difference in band gaps between the two compounds, we plot the computed band gap for both compounds across a range of Pt⋯Pt distances, obtained from our simulations of both compounds over the pressure range 0 to 1.02 GPa for Pt(bqd)2 and 0 to 3.19 GPa for Pt(dmg)2 (Fig. 14). From this it is clear that for the same Pt⋯Pt distance Pt(dmg)2 always returns a larger band gap than Pt(dmg)2.
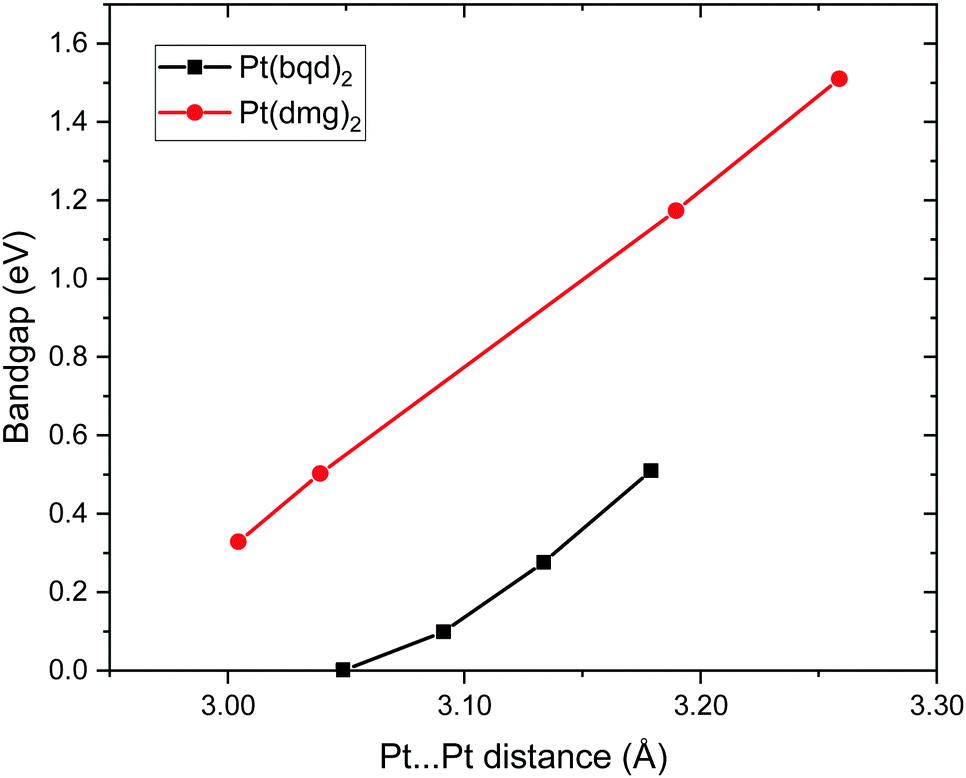 | ||
| Fig. 14 Plot of computed band gap against Pt⋯Pt distance for selected pressure points. | ||
Conclusions
To summarise, herein we have investigated the structural and electronic property response of Pt(bqd)2 and Pt(dmg)2 to pressure, using a combination of experimental and computational modelling techniques. High pressure single crystal crystallography measurements have shown that while overall the lattice of Pt(bqd)2 is less compressible than Pt(dmg)2 the former is significantly more compressible along the Pt⋯Pt axis. Compressed powder conductivity measurements on Pt(bqd)2 have shown semiconductor–metal–semiconductor behaviour comparable to that observed for single crystals, with the metallic state observed between 0.62–0.88 GPa, a pressure range consistent with that obtained in the literature and in our computational work. Electronic structure calculations of both complexes indicated that the top of the valence band is constructed from the antibonding combination of filled dz2 orbitals, while the bottom of the conduction band originates from a combination of vacant ligand π-orbitals and the Pt 6pz orbital. Molecular orbital calculations assisted the interpretation of the solid state band structure and highlighted the key role of the ligand in determining the electronic structure of these complexes, with the low energy vacant π-orbitals providing the origin of the narrow band gaps in these materials. This significant contribution from the ligands to the frontier bands of these complexes is a factor that has been overlooked in previous interpretations of their behaviour. This understanding, combined with our structural work, allows us to distil the difference in conductivity behaviour under pressure between Pt(bqd)2 and Pt(dmg)2 into two factors. The first is that the crystal structure of Pt(bqd)2 is much more compressible along the Pt⋯Pt stacking direction (c-axis) than that of Pt(dmg)2, a factor that could be attributed to the increased planarity of the benzene rings in bqd compared to the methyl groups of dmg. The second factor is related to the electronic structure; the starting band gap in Pt(dmg)2 is much larger than that of Pt(bqd)2 (1.44 eV vs. 0.52 eV); as a result a greater pressure is required to close the band gap, assuming a similar rate of change of the band gap with compression distance. We also provided an explanation for the observed semiconductor/insulator–metal–semiconductor/insulator transitions under pressure in these materials; increased intermolecular interactions under the application of pressure, particularly along the c-axis, result in an increase in the energy of the conduction band, which is comprised of an antibonding interaction, and a decrease in energy of the valence band, which shows a marginally bonding interaction with respect to the c-axis. The crossing of these bands results in an inversion of the orbital character and a reopening of the band gap at higher pressures. We believe these results provide an increased understanding of the conductive behaviours of the platinum bis(1,2-dionedioximato) complexes under pressure, and this knowledge could be used to interpret the behaviour of other linear-stacked square planar d8 metal complexes. In particular, we highlight the important role played by the ligand in determining the pressure response of these complexes, rather than this being determined by the Pt⋯Pt distance alone.Experimental
Synthesis
o-Benzoquinone dioxime was synthesised from commercially available benzofuroxan, as reported in the literature.28 Pt(bqd)2 was then prepared by mixing a solution of o-benzoquinone dioxime (0.56 g, 4.05 mmol in acetone) with a solution of K2PtCl4 (0.83 g, 2.00 mmol in water). A black precipitate formed and was collected by filtration, washed with water and acetone to give Pt(bqd)2 (0.75 g, 80%). Single crystals were grown by slow diffusion of the two reagent solutions. Black needles grew over time, and were collected by filtration.Crystallography
For all structures obtained in this study, all non-hydrogen atoms were refined anisotropically, with thermal and vibrational similarity restraints applied across the ligand system. All C–H proton atoms were placed geometrically and their positions were allowed to ride during the refining process. The oxime proton was added manually, with its position refined with 1,2 and 1,3 restraints with values taken from the ambient pressure structure, which in turn were determined from the oxime proton position in the isostructural Pd complex.16
Conductivity
Computational methodology
Conflicts of interest
There are no conflicts to declare.Acknowledgements
The authors thank the Leverhulme Trust (RPG-2016-152) for funding. This work has made use of the resources provided by the Edinburgh Compute and Data Facility (ECDF) (http://www.ecdf.ed.ac.uk/). This work used the ARCHER UK National Supercomputing Service (http://www.archer.ac.uk). We acknowledge Diamond Light Source for time on Beamline I19 under Proposal MT19178. J. R. thanks the University of Edinburgh for PhD stipend funding in the form of a Principal's Careers Development Scholarship. The authors gratefully acknowledge the facilities, and the scientific and technical assistance of Microscopy Australian at the Centre for Microscopy, Characterisation & Analysis, The University of Western Australia, a facility funded by the University, State and Commonwealth Governments.References
- W. A. Little, Phys. Rev., 1964, 134, A1416–A1424 CrossRef.
- K. Krogmann, Angew. Chem., Int. Ed. Engl., 1969, 8, 35–42 CrossRef CAS.
- B. M. Anderson and S. K. Hurst, Eur. J. Inorg. Chem., 2009, 3041–3054 CrossRef CAS.
- K. Takeda, I. Shirotani and K. Yakushi, Chem. Mater., 2000, 12, 912–916 CrossRef CAS.
- I. Shirotani, A. Kawamura, K. Suzuki, W. Utsumi and T. Yagi, Bull. Chem. Soc. Jpn., 2006, 64, 1607–1612 CrossRef.
- I. Shirotani, Y. Inagaki, W. Utsumi and T. Yagi, J. Mater. Chem., 1991, 1, 1041–1043 RSC.
- K. Takeda, I. Shirotani, C. Sekine and K. Yakushi, J. Phys.: Condens. Matter, 2000, 12, L483–L488 CrossRef CAS.
- K. Takeda, I. Shirotani and K. Yakushi, Synth. Met., 2003, 133–134, 415–416 CrossRef CAS.
- I. Shirotani, T. Kudo, N. Sato, H. Yamochi and G. Saito, J. Mater. Chem., 1995, 5, 1357 RSC.
- M. Mégnamisi-Bélombé, Ann. N. Y. Acad. Sci., 1978, 313, 633–650 CrossRef.
- K. Sakai, T. Hasegawa, M. Ichikawa and Y. Taniguchi, Chem. Lett., 2006, 35, 302–303 CrossRef CAS.
- M. Konno, T. Okamoto, I. Shirotani and IUCr, Acta Crystallogr., Sect. B: Struct. Sci., 1989, 45, 142–147 CrossRef.
- S. Di Bella, M. Casarin, I. Fragala, G. Granozzi and T. J. Marks, Inorg. Chem., 1988, 27, 3993–4002 CrossRef CAS.
- K. Liu, Y. Orimoto and Y. Aoki, Polyhedron, 2015, 87, 141–146 CrossRef CAS.
- M. Mégnamisi-Bélomeé, J. Solid State Chem., 1979, 27, 389–396 CrossRef.
- T. J. Kistenmacher and R. Destro, Inorg. Chem., 1983, 22, 2104–2110 CrossRef CAS.
- I. Shirotani, K. Takeda, F. Onuma and N. Sato, Mol. Cryst. Liq. Cryst. Sci. Technol., Sect. A, 1996, 285, 119–124 CrossRef CAS.
- M. Megnamisi-Belombe, J. Solid State Chem., 1977, 22, 151–156 CrossRef CAS.
- R. Dronskowski and P. E. Bloechl, J. Phys. Chem., 1993, 97, 8617–8624 CrossRef CAS.
- V. L. Deringer, A. L. Tchougréeff and R. Dronskowski, J. Phys. Chem. A, 2011, 115, 5461–5466 CrossRef CAS PubMed.
- S. Maintz, V. L. Deringer, A. L. Tchougréeff and R. Dronskowski, J. Comput. Chem., 2013, 34, 2557–2567 CrossRef CAS PubMed.
- S. Iwai, T. Kamata, S. Murata, T. Fukaya, T. Kodaira, F. Mizukami, M. Tachiya, K. Yamamoto and T. Ohta, J. Chem. Phys., 1999, 110, 8687 CrossRef CAS.
- K. Yamamoto, T. Kamata, S. Iwai, S. Kazaoui, N. Minami, F. Mizukami, K. Misawa, T. Ohta and T. Kobayashi, Chem. Phys. Lett., 1999, 302, 609–614 CrossRef CAS.
- J. W. Brill, M. Mégnamisi-Bélombé and M. Novotny, J. Chem. Phys., 1978, 68, 585–592 CrossRef CAS.
- V. Rajaji, K. Pal, S. Ch Sarma, B. Joseph, S. C. Peter, U. V. Waghmare and C. Narayana, Phys. Rev. B, 2018, 97, 155158 CrossRef CAS.
- A. Bansil, H. Lin and T. Das, Rev. Mod. Phys., 2016, 88, 021004–021041 CrossRef.
- S. Güler-Kılıç and C. Etin Kılıç, Phys. Rev. B, 2016, 94, 165203 CrossRef.
- M. M. El-Abadelah, Z. H. Khan and A. A. Anani, Synthesis, 1980, 146–147 CrossRef CAS.
- Bruker, APEX II, Bruker AXS Inc., Madison, Wisconsin, USA, 2012 Search PubMed.
- Bruker, SAINT, Bruker AXS Inc., Madison, Wisconsin, USA, 2012 Search PubMed.
- Bruker, SADABS, Bruker AXS Inc., Madison, Wisconsin, USA, 2001 Search PubMed.
- A. Altomare, G. Cascarano, C. Giacovazzo, A. Guagliardi, M. C. Burla, G. Polidori, M. Camalli and IUCr, J. Appl. Crystallogr., 1994, 27, 435 Search PubMed.
- P. W. Betteridge, J. R. Carruthers, R. I. Cooper, K. Prout, D. J. Watkin and IUCr, J. Appl. Crystallogr., 2003, 36, 1487 CrossRef CAS.
- L. Merrill and W. A. Bassett, Rev. Sci. Instrum., 1974, 45, 290–294 CrossRef.
- S. A. Moggach, D. R. Allan, S. Parsons, J. E. Warren and IUCr, J. Appl. Crystallogr., 2008, 41, 249–251 CrossRef CAS.
- G. J. Piermarini, S. Block, J. D. Barnett and R. A. Forman, J. Appl. Phys., 1975, 46, 2774–2780 CrossRef CAS.
- H. Nowell, S. A. Barnett, K. E. Christensen, S. J. Teat and D. R. Allan, J. Synchrotron Radiat., 2012, 19, 435–441 CrossRef CAS PubMed.
- Agilent, CrysAlisPRO, Agilent Technologies Ltd., Yarnton, Oxfordshire, England, 2014 Search PubMed.
- H. C. Montgomery, J. Appl. Phys., 1971, 42, 2971–2975 CrossRef CAS.
- J. D. Weiss, D. L. Decker and H. B. Vanfleet, J. Appl. Phys., 1976, 47, 4188–4189 CrossRef CAS.
- R. Dovesi, V. R. Saunders, C. Roetti, R. Orlando, C. M. Zicovich-Wilson, F. Pascale, B. Civalleri, K. Doll, N. M. Harrison, I. J. Bush, P. D’Arco, M. Llunell, M. Causà, Y. Noël, L. Maschio, A. Erba, M. Rerat and S. Casassa, CRYSTAL17 User's Manual, University of Torino, Torino, 2017 Search PubMed.
- R. Dovesi, A. Erba, R. Orlando, C. M. Zicovich-Wilson, B. Civalleri, L. Maschio, M. Rérat, S. Casassa, J. Baima, S. Salustro and B. Kirtman, Wiley Interdiscip. Rev.: Comput. Mol. Sci., 2018, 8, e1360 Search PubMed.
- M. F. Peintinger, D. V. Oliveira and T. Bredow, J. Comput. Chem., 2013, 34, 451–459 CrossRef CAS PubMed.
- D. Andrae, U. Häußermann, M. Dolg, H. Stoll and H. Preuß, Theor. Chim. Acta, 1990, 77, 123–141 CrossRef CAS.
- K. Doll, Surf. Sci., 2004, 573, 464–473 CrossRef CAS.
- J. Heyd, G. E. Scuseria and M. Ernzerhof, J. Chem. Phys., 2003, 118, 8207–8215 CrossRef CAS.
- A. A. L. Michalchuk, M. Trestman, S. Rudić, P. Portius, P. T. Fincham, C. R. Pulham and C. A. Morrison, J. Mater. Chem. A, 2019, 7, 19539–19553 RSC.
- J. Heyd and G. E. Scuseria, J. Chem. Phys., 2004, 121, 1187–1192 CrossRef CAS PubMed.
- J. Heyd, J. E. Peralta, G. E. Scuseria and R. L. Martin, J. Chem. Phys., 2005, 123, 174101 CrossRef PubMed.
- J. E. Peralta, J. Heyd, G. E. Scuseria and R. L. Martin, Phys. Rev. B, 2006, 74, 073101 CrossRef.
- X. D. Wen, R. L. Martin, L. E. Roy, G. E. Scuseria, S. P. Rudin, E. R. Batista, T. M. McCleskey, B. L. Scott, E. Bauer, J. J. Joyce and T. Durakiewicz, J. Chem. Phys., 2012, 137, 154707 CrossRef PubMed.
- M. T. Ruggiero, A. Erba, R. Orlando and T. M. Korter, Phys. Chem. Chem. Phys., 2015, 17, 31023–31029 RSC.
- M. J. Frisch, G. W. Trucks, H. B. Schlegel, G. E. Scuseria, M. A. Robb, J. R. Cheeseman, G. Scalmani, V. Barone, G. A. Petersson, H. Nakatsuji, X. Li, M. Caricato, A. Marenich, J. Bloino, B. G. Janesko, R. Gomperts, B. Mennucci, H. P. Hratchian, J. V. Ortiz, A. F. Izmaylov, J. L. Sonnenberg, D. Williams-Young, F. Ding, F. Lipparini, F. Egidi, J. Goings, B. Peng, A. Petrone, T. Henderson, D. Ranasinghe, V. G. Zakrzewski, J. Gao, N. Rega, G. Zheng, W. Liang, M. Hada, M. Ehara, K. Toyota, R. Fukuda, J. Hasegawa, M. Ishida, T. Nakajima, Y. Honda, O. Kitao, H. Nakai, T. Vreven, K. Throssell, J. A. J. Montgomery, J. E. Peralta, F. Ogliaro, M. Bearpark, J. J. Heyd, E. Brothers, K. N. Kudin, V. N. Staroverov, T. Keith, R. Kobayashi, J. Normand, K. Raghavachari, A. Rendell, J. C. Burant, S. S. Iyengar, J. Tomasi, M. Cossi, J. M. Millam, M. Klene, C. Adamo, R. Cammi, J. W. Ochterski, R. L. Martin, K. Morokuma, O. Farkas, J. B. Foresman and D. J. Fox, Gaussian 09, Revision A.02, Gaussian, Inc., Wallingford CT, 2016 Search PubMed.
- N. M. O’Boyle, A. L. Tenderholt and K. M. Langner, J. Comput. Chem., 2008, 29, 839–845 CrossRef PubMed.
Footnote |
| † Electronic supplementary information (ESI) available: Visualisation of crystalline orbitals and band structures for intermediate pressure points. CCDC 1971034–1971042. For ESI and crystallographic data in CIF or other electronic format see DOI: 10.1039/c9cp06749c |
| This journal is © the Owner Societies 2020 |