
 Open Access Article
 This Open Access Article is licensed under a
 Creative Commons Attribution 3.0 Unported Licence
Polaronic structure of excess electrons and holes for a series of bulk iron oxides†
Christian S.
Ahart
 a,
Jochen
Blumberger
*a and
Kevin M.
Rosso
*b
a,
Jochen
Blumberger
*a and
Kevin M.
Rosso
*b
aDepartment of Physics and Astronomy, University College London, London WC1E 6BT, UK. E-mail: j.blumberger@ucl.ac.uk
bPacific Northwest National Laboratory, Richland, WA, USA. E-mail: kevin.rosso@pnnl.gov
First published on 17th February 2020
Abstract
Iron oxides such as hematite (α-Fe2O3) play an important role in diverse fields ranging from biogeochemistry to photocatalysis. Here we perform calculations of both the electron and electron hole polaron structures and associated reorganisation energies for a series of bulk iron oxides: hematite (α-Fe2O3), lepidocrocite (γ-FeOOH), goethite (α-FeOOH) and white rust (Fe(OH)2). Through the use of gap-optimized hybrid functionals and large supercells under periodic boundary conditions, we remove some of the complications and uncertainties present in earlier cluster model calculations. It is found that while the electron hole polaron in these materials generally localises onto a single iron site, the electron polaron localises across two iron sites of the same spin layer as a consequence of the lower reorganisation energy for electrons compared to holes. An exception to these trends is the hole of goethite, which according to our calculations does not form a localised polaron.
1 Introduction
With increasing environmental concerns, it is necessary to pursue more sustainable and more efficient materials. Iron oxides and oxyhydroxides are highly abundant, cheap and stable and have many properties such as visible spectrum band gaps which make them ideal candidates in photoelectrochemical applications.1,2 Hematite (α-Fe2O3) in particular has received much attention as a photoanode material for water splitting, however problems remain including low mobility and short carrier lifetimes due to electron–hole recombination.3 While there has been experimental4,5 and theoretical6–12 investigations of charge transport in these materials, a complete atomistic level understanding of their polaron structures is still lacking.As these iron oxides are generally considered native n-type semiconductors,13 and are frequently doped with electron donors,7,14 the structure of the electron polaron has received much attention. In the small electron polaron model, supported by experiment,4 a conduction electron induces a localised lattice distortion that lowers its energy to the point that the electron becomes self-trapped. This reorganisation energy therefore acts to reduce the mobility of the electron. Subsequent electron transport occurs via thermally-activated hopping between iron sites, which has been studied by a number of groups.12–14
Some time ago, Rosso and co-workers11,12,15,16 performed pioneering calculations on small hematite clusters using Unrestricted Hartree–Fock (UHF), calculating an inner-sphere reorganisation energy of 1.30 eV for excess electron transfer between two neighbouring iron sites. An approximation of the polarisation of the full bulk crystal in response to the presence of the electron polaron, referred to as the outer-sphere reorganisation energy, was calculated from Marcus theory as 0.17 eV. Their results are consistent with the small electron polaron model, with the excess electron localising over a single iron atom. More recent work by Rosso and co-workers continues to support the small electron polaron,17,18 and other groups have also utilised cluster models with wavefunction methods with similar results.13
As a result of the treatment of holes as minority charge carriers, in addition to experimental challenges regarding the production of p-type hematite,19 the electron hole polaron has received less attention than the electron polaron in these materials. Early experimental work on hematite showed that the electron hole polaron has a higher activation energy and reorganisation energy than that of the electron polaron, attributing this to hole transport in narrow oxygen bands.20,21 However, more recent experimental work on the hematite photoanode observed two different electron hole polaron types: high energy O(2p) holes, and lower energy Fe(3d) holes.22 Computational studies are also frequently in disagreement, with cluster calculations by Rosso and co-workers supporting the Fe(3d) hole,11 while later calculations from Liao et al. using a similar methodology supported the O(2p) hole.19 Lee et al.14 performed calculations utilising the Hubbard U correction, a common approach to address the failings of semi-local Density Functional Theory (DFT) functionals in the treatment of strongly correlated Fe(3d) electrons,23 however were unable to identify any localised hole that was more stable than the delocalised one. Some groups have attempted to compare the possible Fe(3d) or O(2p) holes, with Ansari et al.24 recently using post Hartree–Fock methods on cluster models to support the O(2p) hole.
It is well known that polaron formation is very sensitive to the DFT functional used, in particular the amount of exact Hartree–Fock Exchange (HFX). UHF, used in previous calculations, is prone to overbinding of excess charge25 and may overstabalise small polarons. Moreover, the cluster model that was often used has a number of shortcomings: artificial hydrogen atoms necessary for bond termination, and a lack of consideration of the strain imposed from the full bulk crystal. While some groups have performed bulk DFT+U calculations, these do not produce a uniformly good description of Fe(3d) and O(2p) centres, band gap and spin population of hematite.26,27
With increasing efficiency of computer codes and platforms, it is now possible to study polaron formation in oxide materials using hybrid functionals and large supercells under periodic boundary conditions. In this way some of the complications and uncertainties introduced by cluster models are removed. Vitally, in this work we use hybrid functionals with the fraction of HFX adjusted empirically to reproduce the experimental band gap. While this strategy is rather pragmatic, we believe it is also one of the most effective and accurate to date, allowing us to obtain new insight into the polaron structure of iron oxides.
We note that recently a non-empirical method for the choice of the fraction of exact exchange has been suggested for semiconductors,28 based on compliance with the generalized Koopmans condition (or ionization potential theorem), similar to the optimal tuning approach for finite molecular systems.29 Baer, Kronik and co-workers argued, however, that for systems subject to periodic boundary conditions Koopmans condition is obeyed in the limit of large supercells even for functionals that do not give the correct electronic structure (e.g. band gap).30 This implies that Koopmans condition cannot, in general, be used as a diagnostic for correct electronic structure for systems subject to periodic boundary conditions. It can however help to improve the functional performance in certain cases.28 This view is supported by our present calculations: our functionals with empirically adjusted exact exchange satisfy Koopmans condition for the periodic bulk oxides studied here, but so does the PBE functional despite the severe underestimation of the band gap for this functional.
While hematite has received the most attention due to its greatest electron mobility,31 other iron oxides and oxyhydroxides may also have similar photoelectrochemical applications and an equal understanding of their polaron structures is desirable. As such, calculations of the both the electron and electron hole polaron structures and associated reorganisation energies are performed for a series of iron oxides: hematite (α-Fe2O3), lepidocrocite (γ-FeOOH), goethite (α-FeOOH) and white rust (Fe(OH)2). This series enables examination of a variety of structural effects including hydration state, hydrogen bonding and the valence of bulk iron. It is found that while the hole polaron in these materials generally localises onto a single iron site, the electron polaron localises across two iron sites of the same spin layer as a consequence of the lower reorganisation energy for electrons compared to holes. An exception to these trends is the hole of goethite, which according to our calculations does not form a localised polaron due to the energy penalty for disrupting the extended hydrogen bonding framework.
The paper is organised as follows. Section 2 presents the Computational details of the calculations, Section 3 the Results for hematite, lepidocrocite, goethite and white rust (Sections 3.1–3.4) in addition to Finite size corrections (Section 3.5) and a Discussion of the results (Section 3.6). Generalizable effects across the iron oxide series are summarised in Section 4.
2 Computational details
All calculations were performed applying unrestricted DFT with a modified form of the range-separated hybrid functional HSE06,33 where the percentage of exact HFX is optimised to reproduce the experimental band gap for each iron oxide.27 Hybrid functionals have been shown to have greater accuracy in the description of electronic and structural properties of iron oxides such as hematite,27,34 at increased computational cost.The basis set used was DZVP-MOLOPT-SR-GTH,35 with explicit treatment of Fe(3s, 3p, 3d, 4s) and O(2s, 2p) valence electrons only, with a multigrid cutoff of 400 Ry consistent with previous work in our group.36 To decrease the large computational cost of hybrid DFT calculations, the Auxiliary Density Matrix Method (ADMM)37 was used, with an auxiliary basis set of: cFIT11 for Fe, cpFIT3 for O and cpFIT3 for H. The Grimme D3 dispersion correction was used, although we note that our results are not dependent upon its inclusion. The CP2K code was used,38 with Γ point sampling of the Brillouin zone.
To allow for an examination of finite size effects, calculations for each iron oxide were performed on two different supercell sizes of around 150 atoms (1000 electrons) and 300 atoms (2000 electrons) with periodic boundary conditions. The exact supercells used are specified further below in the main text for each iron oxide.
Initial coordinates were taken from experimental crystal structures for hematite,39 lepidocrocite,40 goethite41 and white rust.42 The wavefunction was optimised for the experimental spin ground state,42–45 which are antiferromagnetic (AFM). We have verified for each oxide that this spin pattern gives the lowest electronic energy.
During the geometry optimisations structures, unless specified otherwise, were converged until the residual forces were smaller than 0.02 eV Å−1. Unit cell parameters were fixed, and no symmetry restrictions were applied. In order to prevent bias of the system, no atom was specified as the initial guess for the removal or addition of an electron.
The reorganisation energy λ associated with polaron formation is calculated from Nelsen's four-point method:16,46
 | (1) |
For comparison of the extent of localisation for the different iron oxides, the change in spin moment was calculated from Hirshfeld analysis47 for the atoms over which the polaron localises.
The degree to which Koopmans condition is satisfied can be described as the nonlinearity28
 | (2) |
| Hematite/eV | Lepidocrocite/eV | Goethite/eV | |||||||
|---|---|---|---|---|---|---|---|---|---|
| E g | ξ (h) | ξ (e) | E g | ξ (h) | ξ (e) | E g | ξ (h) | ξ (e) | |
| a Eqn (2). b HSE(12%) for hematite, HSE(18%) for lepidocrocite and goethite. | |||||||||
| PBE | 0.89 | −0.01 | 0.00 | ||||||
| HSE(25%) | 3.62 | 0.11 | 0.27 | 3.15 | 0.03 | −0.16 | 3.33 | 0.05 | −0.02 |
| HSEb | 2.17 | 0.03 | 0.03 | 2.34 | 0.02 | −0.12 | 2.52 | 0.03 | −0.04 |
| 2.14 (331) | −0.01 (331) | −0.01 (331) | |||||||
We note that we have also examined the recently developed Strongly Constrained and Appropriately Normed (SCAN) meta-GGA functional.48 SCAN has received much interest due to its computational cost comparable to standard GGA functionals, while more accurately predicting important structural and electronic properties.49 However, it has been demonstrated that SCAN only slightly improves on PBE in regards to the band gap for most materials50–52 including hematite,53,54 and therefore we do not consider it here as an alternative to hybrid functionals.
3 Results and discussion
3.1 Hematite α-Fe2O3
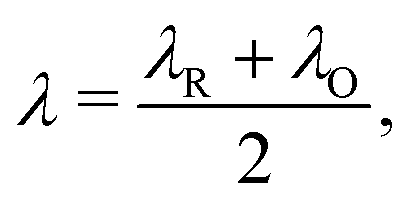
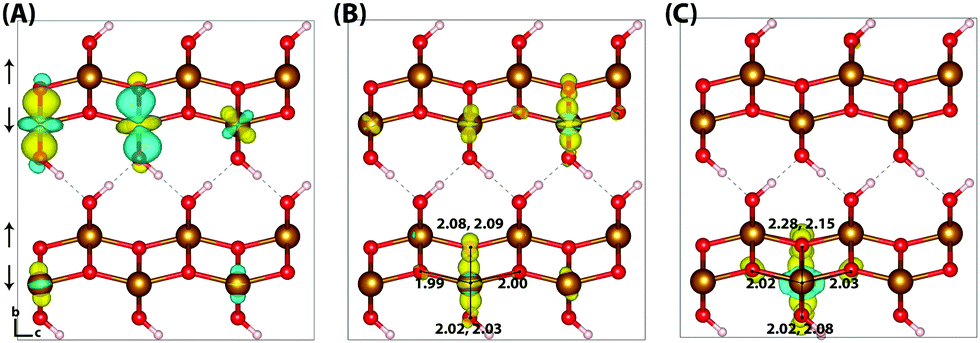
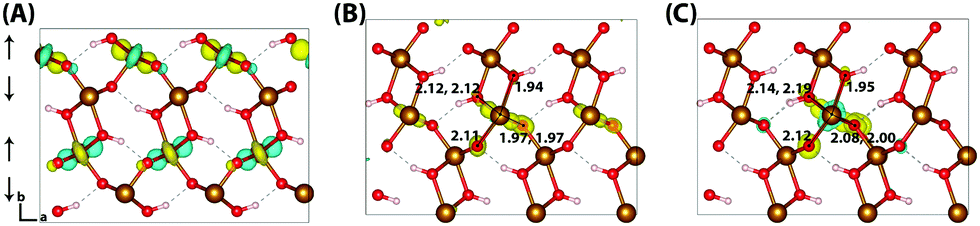
Hematite is a corundum type iron oxide, with a hexagonal structure where each iron(III) atom is octahedrally coordinated to six oxygen atoms. Previous studies have established that 12% HFX is able to recover the correct band gap, spin populations and geometry for hematite.26,27 Calculations were performed on two supercells: a 221 supercell composed of 120 atoms, and a larger 331 supercell composed of 270 atoms. Neutral geometry optimisation results in a structure in good agreement with experiment,39 where the two distinct planes of iron atoms that comprise an iron bilayer form average Fe–O bond lengths of 1.94 and 2.12 Å.Fig. 1 shows the localisation of an excess hole for the smaller 221 supercell. When an electron is removed with electronic but no nuclear relaxation (referred to as the vertical state), the hole delocalises over the Highest Occupied Molecular Orbital (HOMO). The HOMO is composed of both O(2p) and Fe(3d) eg orbitals, as expected from crystal field theory and supported by experiment.32,55 The density of states is provided in the ESI.† This results in a vertical state where 51% of the excess spin density is localised over parallel spin iron atoms, and following nuclear relaxation the majority of the excess hole localises over a single iron atom with an average contraction of the local Fe–O bond lengths of 0.069 Å. The contraction is larger for the longer Fe–O bonds, 0.094 Å in comparison to 0.044 Å, although it is clear that symmetry breaking is able to further lower the energy and therefore the contraction is anisotropic. The change in spin moment over this iron atom from the ground state neutral to charged relaxed state is 0.66 μB for the 221 supercell, and 0.68 μB for the larger 331 supercell. For the former the reorganisation energy calculated from eqn (1) is 0.29 eV, while the latter has a larger reorganisation energy of 0.36 eV as a result of greater lattice rearrangement. There is no qualitative difference in the localisation of the excess hole when doubling the supercell size. The formation of polaronic states within the band gap has been verified from the density of states and inverse participation ratio, see ESI.†
 | ||
| Fig. 1 Excess hole in hematite. (A) HOMO with asymmetry caused by degeneracy (<7 meV) between the top five levels. (B) Difference in spin density for vertical state, and (C) the relaxed state. The excess hole relaxes onto a single iron site, with positive increase in spin density indicated by yellow isosurfaces and negative by blue isosurfaces. Bond lengths between the iron site and coordinated oxygen atoms are shown in Angstrom. Data for a bulk hematite 221 supercell calculated with HSE06(12%)-D3, viewed perpendicular to the AFM layers along the (100) plane. AFM spin orientation is indicated by arrows to the left of the figure. | ||
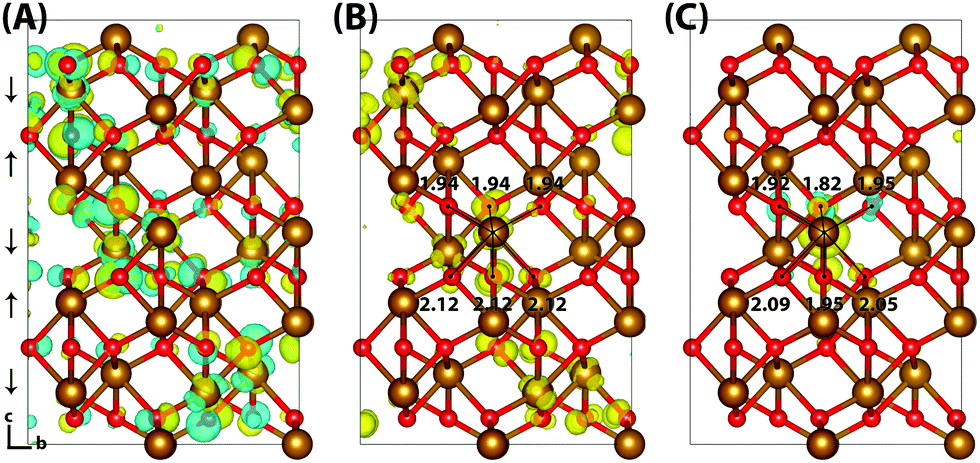
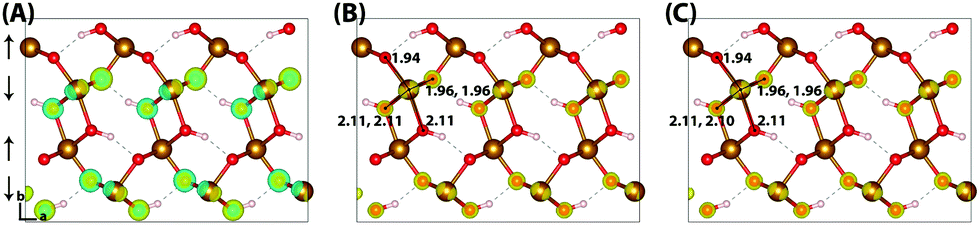
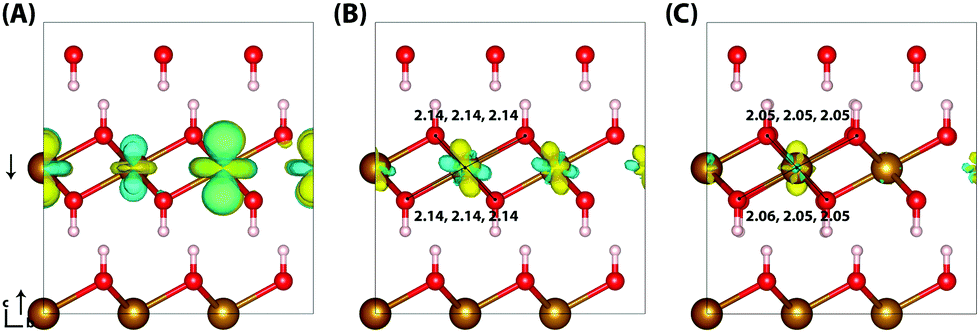
Typically of greater interest for charge transport processes in these iron oxides is the structure of the electron polaron, which to the best of the authors knowledge has not previously been studied at this level of theory. The vertical state is shown in Fig. 2 and is consistent with the Lowest Unoccupied Molecular Orbital (LUMO), composed of Fe(3d) t2g character. Upon nuclear relaxation the excess electron localises over two iron atoms, with equal changes in spin moment of 0.23 μB and 0.24 μB. This localisation pattern does not change for the larger 331 supercell, where the two iron sites have a change in spin moment of 0.24 μB and 0.25 μB. The corresponding reorganisation energies are smaller than in the case of the excess hole: 0.19 eV and 0.22 eV respectively. This two iron site localisation is very different from previous results in the literature, but the associated reorganisation energies while small can nonetheless be related to prior work (see Section 3.6).
 | ||
| Fig. 2 Excess electron in hematite. (A) LUMO, (B) difference in spin density for vertical state, and (C) the relaxed state. The excess electron relaxes onto two parallel spin iron sites, with a positive increase in spin density caused by the addition of an anti-symmetric spin electron. The ESI† contains an alternate view of the lepidocrocite electron polaron. | ||
An important consideration is that the percentage of HFX has been optimised to reproduce the experimental band gap, and that this may alter the localisation behaviour. Therefore for completeness, the localisation patterns at 25% and 50% HFX have also been investigated for the excess electron. The value of 25% HFX is notable as this is the value used in HSE06, motivated from perturbation theory.56 At this value the change in spin density reduces significantly over one of the iron sites, resulting in a change in spin moment of 0.50 μB and 0.09 μB over the two iron sites. At 50% HFX the electron is fully localised, with a change in spin moment of 0.68 μB and 0.02 μB. At these values of HFX the band gap rises to 3.6 eV and 6.4 eV respectively, and therefore it can be understood that only at unphysically high values of HFX does the electron localise over a single iron site as previously understood in the literature. It has been confirmed that in restarting the HSE06(50%) structure with 12% HFX there is immediate electronic relaxation to the two iron site localisation, even without geometry re-optimisation.
3.2 Lepidocrocite γ-FeOOH
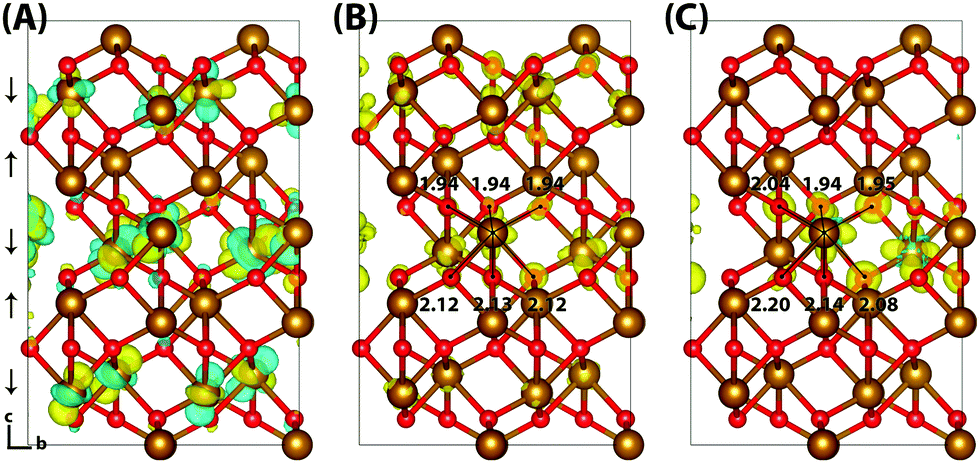
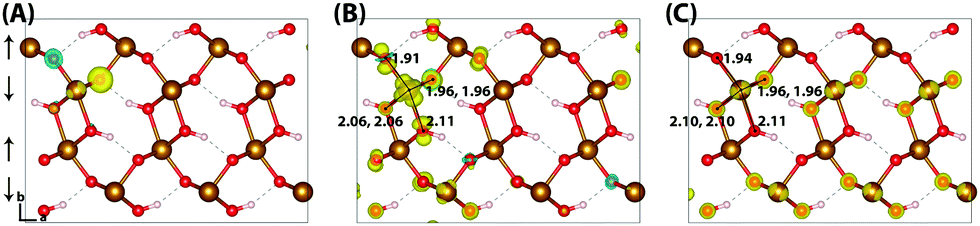
Lepidocrocite is a naturally occurring metastable iron oxyhydroxide, of interest for charge transport processes in addition to proton transfer as a consequence of its layered graphite-like structure.57 The band gap of lepidocrocite calculated using HSE06(12%)-D3 is 1.4 eV, outside of the experimental range 2.1–2.4 eV.32,58 The band gap for goethite is similarly underestimated, and as lepidocrocite and goethite are polymorphs it would be desirable to use the same value of HFX for both systems. Therefore the percentage of HFX is increased to 18%, in order to reproduce the experimental band gaps for both lepidocrocite and goethite. The two supercell sizes used are 313 (144 atoms) and 613 (288 atoms),40 increased in the direction of localisation only in order to examine finite size effects.There are a few notable differences between the experimental and neutral optimised geometries, a result of the experimental uncertainty regarding the hydrogen atom positions. Two space groups have been proposed for lepidocrocite: the centro-symmetric group Cmcm where the hydrogen atoms occupy two positions either side of the Fe–O bond, and the Cmc2 group where the hydrogen atoms occupy only one of these positions (Fig. 3). A number of experimental papers quote either space group,40,44,59 however it is clear that only the Cmc2 space group used in this work results in a physically meaningful structure. The Pmc2 space group structure containing alternating hydrogen bonds in adjacent layers is found to be energy-degenerate with Cmc2, as different layers will be weakly correlated. This may be a cause for the experimental identification of the space group as Cmcm, as the hydrogen atoms may occupy either space group with no energy penalty. These results are in good agreement with other computational studies.57
 | ||
| Fig. 3 Excess hole in lepidocrocite. (A) HOMO with asymmetry caused by degeneracy (<0.06 meV) between the top four levels. (B) Difference in spin density for vertical state, and (C) the relaxed state. The excess hole relaxes onto a single iron site, where the positive increase in spin density is indicated by yellow isosurfaces and negative by blue isosurfaces. Bond lengths between the iron site and coordinated oxygen atoms are shown in Angstrom. Data for a 313 supercell of bulk lepidocrocite calculated with HSE06(18%)-D3, viewed perpendicular to the AFM layers along the (100) plane. AFM spin orientation is indicated by arrows to the left of the figure. | ||
Similar to hematite, the HOMO of lepidocrocite (Fig. 3) is composed of a mixture of O(2p) and Fe(3d) eg orbitals. In the hole vertical state 45% of the excess spin moment is over the iron atoms, with the remainder over the oxygen atoms. This is consistent with the density of states (Fig. S2, ESI†), with a lower Fe(3d) density at the valence band maximum in comparison to hematite. Following nuclear relaxation a single iron site emerges with a change in spin moment of 0.64 μB, the same change observed for the hematite 221 supercell. With the larger 613 supercell the change in spin moment increases slightly to 0.65 μB, and the average change in bond lengths increases from −0.073 Å to −0.080 Å. The largest change in bond lengths of −0.14 Å is experienced by the two non-hydrogen bonded oxygen atoms of the same spin layer (±c direction), and the smallest of +0.02 Å is over the hydrogen bonded oxygen atoms (−b direction). This increase in bond lengths is a consequence of the iron atom moving in the opposite direction to maximise orbital overlap with the in-plane oxygen atoms, as well as the inflexible hydrogen bonding network which leads to a low change in spin moment and bond lengths over the hydrogen bonded oxygen atoms. As such while the average change in bond lengths and spin moment over the iron atom is similar to the hematite 331 supercell, the reorganisation energy of 0.59 eV is much greater. See Section 3.6 for further discussion.
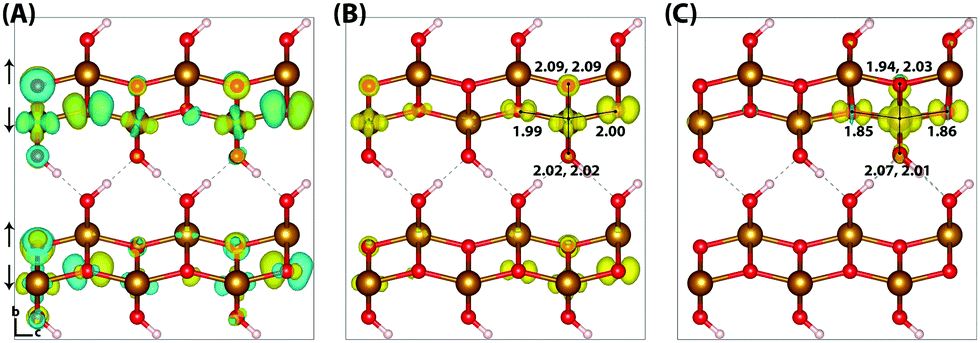
Upon nuclear relaxation the excess electron in the 313 supercell localises across a single parallel spin layer composed of three iron atoms, a result of interaction with periodic self-images of the excess charge. The larger 613 supercell (Fig. 4) is able to avoid these finite size effects with twice the number of atoms in this direction, leading to a two iron site localisation with equal changes in spin moment of 0.24 μB and an average change in bond lengths of +0.063 Å and +0.064 Å. The reorganisation energy for the 613 supercell is 0.36 eV, higher than that of hematite (0.22 eV). The ESI† contains an additional view of the lepidocrocite electron polaron.
 | ||
| Fig. 4 Excess electron in lepidocrocite. (A) LUMO with asymmetry caused by degeneracy (<5 meV) between the top four levels. (B) Difference in spin density for vertical state, and (C) the relaxed state. The excess electron relaxes onto two parallel spin iron sites, with a positive increase in spin density caused by the addition of an anti-symmetric spin. Data for a 613 supercell of bulk lepidocrocite calculated with HSE06(18%)-D3. The ESI† contains an alternate view of the lepidocrocite electron polaron. | ||
3.3 Goethite α-FeOOH
Goethite is the most thermodynamically stable iron oxyhydroxide, isostructural with diaspore. In contrast to lepidocrocite, goethite is not a layered structure but one based upon oxo-bridged double-chains of iron octahedra. While experimental band gap data ranges from 2.1–2.5 eV, recent experiments favour 2.5 eV32 which is reproduced with HSE06(18%)-D3. In addition to the same HFX value, the same supercell sizes are also constructed from experimental data to ensure fair comparison of the two polymorphs lepidocrocite and goethite.41The neutral geometry optimisation of goethite has been challenging, as the structure becomes easily distorted along the Fe–O chains with fragile hydrogen bonding. The O–H bond lengths from X-ray diffraction experiments are calculated as 0.88 Å, while the HSE06(18%)-D3 optimised value is 0.99 Å. This is in agreement with other computational studies,60 and is attributed to lack of sensitivity to hydrogen atoms present in X-ray diffraction experiments. It has been confirmed that the hydrogen bonding distances are not strongly dependent on the inclusion of the D3 dispersion correction.
The HOMO of goethite in Fig. 5 is consistent with the other iron oxides studied, a mixture of O(2p) and Fe(3d) eg orbitals. The structure of the hole polaron however is very different, remaining fully delocalised even after nuclear relaxation. In order to verify this unexpected result a number of different initial conditions have been tested, including restarting the optimisation from a localised state from a higher percentage of HFX. While increasing the amount of HFX to 50% does not lead to spontaneous localisation for the 316 supercell, for the smaller 313 supercell the excess hole localises across a row of oxygen atoms. A similar dependency on the fraction of HFX has been observed in hematite and lepidocrocite, as well as in the literature,24 where at high values of HFX the hole localises over oxygen atoms. Fig. 6 shows how restarting this localised state at 18% HFX immediately results in delocalisation of the excess hole. Following nuclear relaxation, the hole fully delocalises across the parallel spin layers with a relaxation energy of ∼1 eV.
 | ||
| Fig. 5 Excess hole in goethite. (A) HOMO, (B) difference in spin density for vertical state, and (C) the relaxed state. The excess hole in goethite does not localise, with no qualitative difference between the vertical and relaxed states. Bond lengths between the iron site and coordinated oxygen atoms are shown in Angstrom. Data for a 313 supercell of bulk goethite calculated with HSE06(18%)-D3, viewed perpendicular to the AFM layers along the (001) plane. AFM spin orientation is indicated by arrows to the left of the figure. | ||
 | ||
| Fig. 6 Excess hole in goethite. (A) Difference in spin density for the relaxed excess hole calculated at 50% HFX, (B) restarted at 18% HFX and (C) re-optimised at 18% HFX. | ||
A final confirmation of the lack of excess hole localisation in goethite can be found from an analysis of the local force constants, where in the vertical state each unique oxygen atom is displaced up to 5% (around 0.1 Å) along the corresponding Fe–O bond. For both the neutral and excess hole state these fit well to the harmonic approximation  (RMSE < 2 meV). This is strong contrast to lepidocrocite, where for the excess hole there is a decrease in energy for displacement along the Fe–O–Fe bonds up to 0.06 Å (same spin plane) and 0.02 Å (out of spin plane). The attractive region present in lepidocrocite demonstrates how the decrease in local bond lengths leads to a lower energy localised state, which does not occur in goethite. As such, it can be stated with some confidence that the lack of excess hole localisation in goethite is not a methodological problem but an example of the importance of electronic structure and geometry in determining the behaviour of different polymorphs. A final result from this force constant analysis is that there is no decrease in energy for displacement of the Fe–OH bonds in lepidocrocite, suggesting that the energy penalty for disrupting the hydrogen bonding framework is greater than the decrease in energy from polaron formation. This appears to be the case in both lepidocrocite and goethite. See Section 3.6.2 for further discussion.
Similar to lepidococrite, the localisation of the excess electron in the larger 316 supercell results in a two iron site localisation with changes in spin moment of 0.25 μB and 0.26 μB (Fig. 7). The subsequent reorganisation energy is 0.35 eV, within numerical error of lepidocrocite at 0.36 eV.
 | ||
| Fig. 7 Excess electron in goethite. (A) LUMO, (B) difference in spin density for vertical state, and (C) the relaxed state. The excess electron relaxes onto two parallel spin iron sites, with a positive increase in spin density caused by the addition of an anti-symmetric spin. (B) and (C) are shown centred on the localisation atoms, as these are on the supercell edge. Data for a 316 supercell of bulk goethite calculated with HSE06(18%)-D3. The ESI† contains an alternate view of the goethite electron polaron. | ||
3.4 White rust Fe(OH)2
White rust is a highly unstable iron oxyhydroxide, isostructural with brucite, with a layered structure of iron atoms in octahedral coordination with oxygen separated by non-bonded hydrogen atoms.61–64 In contrast to previous oxides all iron atoms have formal oxidation state (II) rather than (III) in the neutral state, and therefore only the electron hole polaron is considered. To the best of the authors knowledge this is the first work to perform DFT calculations of white rust, although Rosso and co-workers have studied white rust with a similar methodology to their cluster calculations of hematite using Hartree–Fock.65While the crystal structure and antiferromagnetic spin pattern have been determined experimentally,42 the band gap has not been verified. From the white colour it should be expected that the band gap exceeds 3.1 eV (violet light), and an experimental study using ultraviolet-visible spectroscopy indicates that the band gap may be around 3.5 eV.66 As such white rust has been examined using a range of HFX values, including 29% which reproduces the band gap of 3.5 eV. The mixed spin state and non-bonded interactions make this a very challenging system to model, requiring tight wavefunction convergence and a robust conjugate gradient optimiser. As such, the available system size is limited to a 90 atom 332 supercell. A careful optimisation for the neutral state results in a structure in good agreement with experiment,42 the only notable difference with the increase in O–H bond lengths from 0.90 Å to 0.96 Å.
Fig. 8 shows the HOMO of white rust, composed of entirely Fe(3d) character. At 14% HFX, with a band gap of 2.1 eV, the excess hole fully delocalises. As the percentage of HFX increases the excess hole converges to the single iron site localisation, where Fig. 8 shows the results at 29% HFX with a change in spin moment of 0.62 μB and a reorganisation energy of 0.47 eV. We note that the residual forces could only be converged to 0.08 eV Å−1, which may be exacerbated by the small supercell size where only up the nearest neighbour iron atoms are included.
 | ||
| Fig. 8 Excess hole in white rust. (A) HOMO, with asymmetry caused by degeneracy (<0.5 meV) between the top two HOMO levels. (B) Difference in spin density for vertical state, and (C) the relaxed state. The excess hole relaxes onto a single iron site, where the positive increase in spin density is indicated by yellow isosurfaces and negative by blue isosurfaces. Bond lengths between the iron site and coordinated oxygen atoms are shown in Angstrom. Data for a 332 supercell of bulk white rust calculated with HSE06(29%)-D3, viewed perpendicular to the AFM layers along the (100) plane. AFM spin orientation is indicated by arrows to the left of the figure. | ||
3.5 Finite size corrections
As calculations become unfeasible for supercells larger than the ones used here, the computed reorganisation energies need to be corrected for finite size effects. In previous work on electron transfer between F-center polarons in MgO it was possible to calculate λ for a series of unit cells of increasing size and to extrapolate to an infinite cell size using a Marcus-like functional form for reorganisation energy.67,68 Unfortunately, this strategy is not possible in current work since, due to the more demanding electronic structure calculations, we have data for only two cells sizes. Here we partition the reorganisation energy into inner-sphere λi and outer-sphere λo contributions: the inner-sphere accounts for the local changes in bond lengths, while the outer-sphere accounts for the polarisation of the surrounding environment:| λ = λi + λo. | (3) |
 | (4) |
Taking experimental values for the dielectric constants (εop = 6.85, εst = 22.35)70 and the cube root of the supercell volume for L (neglecting deviations from cubic symmetry), there remain two unknown parameters: λi and R. We determine their values by minimising the root-mean-square-error (RMSE) between the DFT reorganisation energy and eqn (3), using eqn (4) for λo, for the two different supercells for which calculations were carried out. Using the example of the excess hole in hematite, we obtain a finite range of values for which the RMSE is at a minimum: R = 2.15–2.40 Å, slightly larger than typical Fe–O bonds, with λi = 0.16–0.19 eV. Inserting these parameters into eqn (3) and (4) and taking the limit L ⇒ ∞ gives the finite size corrected reorganisation energy of λ = 0.49 eV. A similar procedure is carried out for all iron oxides adopting the same dielectric constants as for hematite due to a lack of experimental values and to facilitate comparison. The outer-sphere reorganisation energy for the excess electron is smaller than that of the excess hole, 0.21–0.23 eV compared to 0.30–0.33 eV. This is consistent with the larger cavity radius R = 3.2–3.5 Å found for the excess electron, equal to the radius of the two iron site localisation (3.3 Å). The finite size corrected reorganisation energies are summarised in Table 2, except for white rust as the supercell is not large enough to avoid other effects not considered in this approximation.
| Hematite | Lepidocrocite | Goethite | White rust | |
|---|---|---|---|---|
| a Eqn (1). | ||||
| Excess hole | ||||
| Reorganisation energy λa/eV | 0.29 (221) | 0.51 (313) | ||
| 0.36 (331) | 0.59 (613) | 0.47 (332) | ||
| 0.49 (∞) | 0.72 (∞) | |||
| Average change Fe–O bond lengths/Å | −0.069 (221) | −0.073 (313) | ||
| −0.070 (331) | −0.080 (613) | −0.090 (332) | ||
| Change in Fe spin moment/μB | 0.66 (221) | 0.64 (313) | ||
| 0.68 (331) | 0.65 (613) | 0.62 (332) | ||
| Excess electron | ||||
| Reorganisation energy λa/eV | 0.19 (221) | |||
| 0.22 (331) | 0.36 (613) | 0.35 (316) | ||
| 0.37 (∞) | 0.51 (∞) | 0.50 (∞) | ||
| Average change Fe–O bond lengths/Å | +0.026, +0.028 (221) | |||
| +0.027, +0.030 (331) | +0.063, +0.064 (613) | +0.045, +0.055 (316) | ||
| Change in Fe spin moment/μB | 0.23, 0.24 (221) | |||
| 0.24, 0.25 (331) | 0.24, 0.24 (613) | 0.25, 0.26 (316) | ||
It is noted that while the electron hole polaron is well described by the spherical approximation, for the excess electron due to the two iron site localisation the polaron becomes more elliptical in shape and therefore deviates from this approximation. Further, the finite size correction is sensitive to the values of the dielectric constants used. For example using the dielectric constants used by Rosso et al. (εop = 9, εst = 25)15 reduces the hematite electron polaron reorganisation energy from 0.37 eV to 0.32 eV. While their static dielectric is taken from a standard mineralogy textbook,71 their optical dielectric is approximated as the square of the index of refraction for hematite.72 As such, the limited experimental data available for these iron oxides makes such a finite size correction somewhat uncertain.
3.6 Discussion
Much of the current understanding of electron small polaron formation originates from pioneering cluster model calculations supporting the view that the excess electron is localised on a single iron atom.11,12,15,16 Twenty years on, such calculations can now be carried out for extended supercells in periodic boundary conditions, which removes some of the well-known deficiencies of cluster models: the presence of artificial hydrogen atoms necessary for termination of the dimer cluster; and the neglect of strain effects present in the bulk crystal. Moreover, UHF, which tends to overbind excess electrons is replaced with a hybrid functional with empirically tuned exact exchange. The result is a significantly smaller reorganisation energy to the extent that the excess electron localises over two rather than one iron atom. We have also carried out similar cluster model calculations using HSE06(12%), finding reorganisation energies more than twice as large as in the bulk indicating that it is mostly the missing steric strain in the cluster models that cause the large reorganisation energies. An important consideration in the comparison of our reorganisation energy to that of Rosso and co-workers,11 0.37 eV compared to 1.47 eV for the hematite electron polaron, is that these are for distinct but conceptually inter-related processes. Their calculations correspond to electron transfer between neighbouring iron sites, involving two simultaneous distortions, which is related to twice of our reorganisation energy (0.73 eV). As electron transfer between neighbouring sites should be stabilised in comparison to electron injection and removal at infinite distance, it would be expected that their lambda value is slightly lower than twice of our lambda value. Hence our current calculations suggest that the reorganisation energy for excess electrons are more than a factor of 2 smaller than previously thought.
Viewed from the perspective of electron transfer theory (i.e. in the diabatic representation of electronic states), our results mean that the electronic coupling matrix element, Hab, between Fe(II) and Fe(III) is greater than half of the reorganisation energy, which leads to instability of the diabatic states such that the transition state of electron transfer theory becomes the minimum.76 We have not generated the diabatic states for electron transfer in this work, but our results obtained here for the adiabatic ground state suggests  .
.
In lepidocrocite there are two distinct oxygen environments: the hematite-like oxygen atoms within the layers with four O–Fe bonds, and the hydrogen bonded oxygen atoms linking the layers with two O–Fe bonds and two hydrogen bonds. It is found that these hematite-like oxygen atoms undergo a larger change in bond lengths and spin moment in comparison to the hydrogen bonded oxygen atoms, due to the inflexible hydrogen bonding framework in the charged state. Indeed, from force constant analysis there is no decrease in energy for displacement of the Fe–OH bonds in the vertical state for lepidocrocite. This effect is more pronounced in goethite, where every oxygen atom is hydrogen bonded. The energy gained from polaron formation in hematite is around 8 kcal mol−1, on the same energy scale as that of a hydrogen bond (5–10 kcal mole−1). Therefore in goethite there are two competing effects: the lowering of energy due to polaron formation, and the energy cost of disrupting/breaking the extended hydrogen bonding framework. As such, the excess hole remains delocalised in goethite.
This hole delocalisation in goethite should be experimentally testable, as the band conduction of holes would have a temperature dependent signature that does not fit the classical small polaronic hopping model.
Due to the reduced extent of localisation the reorganisation energy for the excess electron is lower, by around a factor of 1.5. The same trend appears as for the excess hole, where the same change in spin moment is experienced but with a greater reorganisation energy for lepidocrocite and also now for goethite. The localisation of the excess electron in hematite across two iron sites within the same sublayer is the cause for the smaller change in bond lengths, as in order to maximise the orbital overlap between the iron atoms two of the longer Fe–O bonds contract (see Fig. 2). The reorganisation energies for lepidocrocite and goethite are within numerical error, and the smaller change in bond lengths for goethite is likely a result of the interaction of the different spin layers. While the excess electron in goethite localises partially over the oxygen atoms of the opposing spin layer, this occurs with no change in bond length as this would have a high energy penalty. In lepidocrocite the LUMO has greater overlap with the oxygen atoms in the ±b direction, and while the oxygen atoms in this direction are more strongly associated with the opposing spin layer there is still some contribution from this spin layer which allows for a change in bond lengths. This is similar to hematite where the oxygen atoms are shared by both spin layers. These findings are consistent with experimental observations, where hematite has the highest electron mobility among the examined iron oxides.
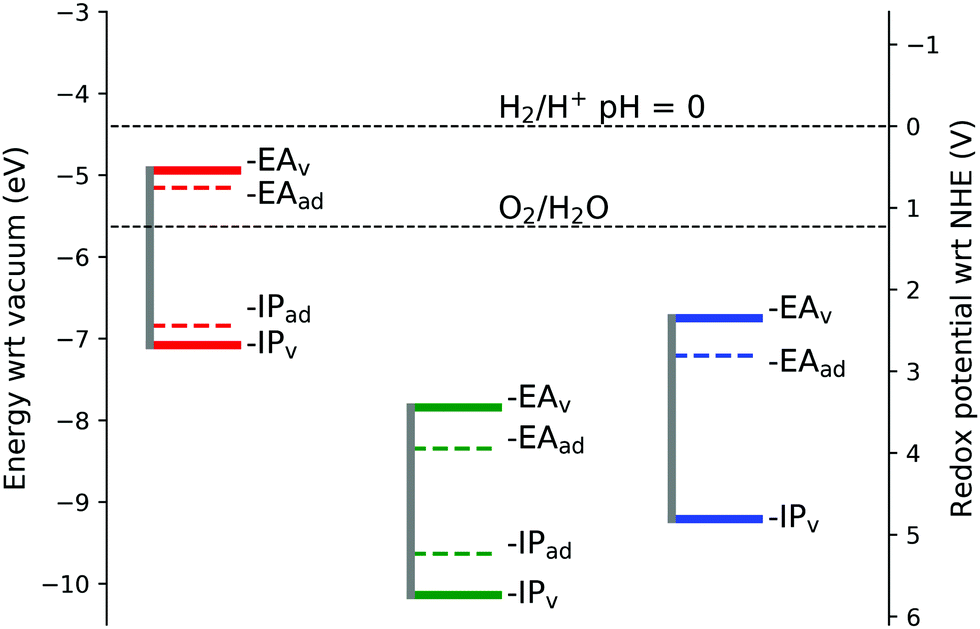 | ||
| Fig. 9 Band edge positions. Red line represents hematite, green lepidocrocite and blue goethite IP and EA values shifted to reproduce the experimental hematite conduction band minimum. IP and EA data are for the largest supercell studied for each iron oxide, with finite size corrected reorganisation energies. Note that for goethite IPad = IPv. | ||
As the ionisation potential only changes by 0.01 eV between the hematite 221 and 331 supercells, no finite size correction has been applied as this is negligible in comparison to the differences in energy between the iron oxides. Indeed, the finite size correction for charging an ion in periodic boundary conditions with parameters modelling the current oxides gives negligible values due to the fast decay of that correction, proportional to the volume of the simulation cell.79
To the best of the authors knowledge there are no experimental values available for comparison of the IP's and EA's for lepidocrocite and goethite, although empirical estimates from electronegativity calculations give a conduction band minimum of −5.08 eV for FeOOH.55 In this work we calculate the conduction band minimum for lepidocrocite as −7.84 eV, and for goethite as −6.75 eV. As one of the requirements for use in a photoelectrochemical cell for water splitting is that the conduction band and valence band levels straddle the water redox potentials,77 our calculations suggest that lepidocrocite and goethite are not suitable for use in water splitting applications.
4 Conclusions
In this work both the electron and hole polaron structures and associated reorganisation energies and band edges have been calculated for a series of bulk iron oxides. Through use of a simple continuum model the reorganisation energies for an infinite supercell has been estimated from full periodic DFT calculations, verified to reproduce important electronic and structural properties. While the polaron structures and extent of charge localisation remains largely consistent across the studied iron oxides, except for the hole in goethite, hematite has consistently the lowest reorganisation energy in agreement with its experimental electron mobility.The calculation of hole polaron structures reveals a lack of localisation of the excess hole for goethite, as a result of the energy penalty for disrupting the extended hydrogen bonding framework. This may make this material a promising candidate as a hole conducting material. It would be of interest to verify this prediction, such as by temperature dependent hole conductivity measurements.
Electron polaron calculations consistently produce a two iron site localisation of the excess electron for all studied iron oxides and oxyhydroxides, contrary to previous understanding of the small electron polaron in these materials. Calculations from hematite dimer clusters have been demonstrated to lead to an overestimate of the reorganisation energy and an overbinding of the excess electron to a single iron site, and the importance of reproducing both the experimental structural and electronic properties (i.e. band gap) has been emphasised. To the best of the authors knowledge these are the highest level calculations performed for these materials, and as such these results should provide new insights into polaron formation and charge transfer.
Conflicts of interest
There are no conflicts to declare.Acknowledgements
C. A. would like to thank Guido von Rudorff for performing earlier calculations on neutral hematite, and Zdenek Futera for their useful discussions. C. A. gratefully acknowledges a PhD studentship cosponsored by University College London and Pacific Northwest National Laboratory (PNNL) through its BES Geosciences program supported by the U.S. Department of Energy's Office of Science, Office of Basic Energy Sciences, Chemical Sciences, Geosciences and Biosciences Division. Via our membership of the UK's HEC Materials Chemistry Consortium, which is funded by EPSRC (EP/L000202, EP/R029431), this work used the ARCHER UK National Supercomputing Service (http://www.archer.ac.uk), as well as the UK Materials and Molecular Modeling (MMM) Hub, which is partially funded by EPSRC (EP/P020194), for computational resources. We also acknowledge the use of the UCL Grace High Performance Computing Facility.References
- K. Sivula, F. Le Formal and M. Grätzel, ChemSusChem, 2011, 4, 432–449 CrossRef CAS PubMed.
- A. Valdés, J. Brillet, M. Grätzel, H. Gudmundsdóttir, H. A. Hansen, H. Jónsson, P. Klüpfel, G. J. Kroes, F. Le Formal, I. C. Man, R. S. Martins, J. K. Nørskov, J. Rossmeisl, K. Sivula, A. Vojvodic and M. Zäch, Phys. Chem. Chem. Phys., 2012, 14, 49–70 RSC.
- D. A. Grave, N. Yatom, D. S. Ellis, M. C. Toroker and A. Rothschild, Adv. Mater., 2018, 30, 1–10 CrossRef PubMed.
- S. Biswas, S. Wallentine, S. Bandaranayake and L. R. Baker, J. Chem. Phys., 2019, 151, 104701 CrossRef PubMed.
- C. Frandsen, X. Zhang, R. W. Falcone, P. Zarzycki, B. Gilbert, K. M. Rosso, G. A. Waychunas, K. Attenkofer, K. W. Chapman and J. E. Katz, Science, 2012, 337, 1200–1203 CrossRef PubMed.
- Z. Huang, F. Han, M. Li, Z. Zhou, X. Guan and L. Guo, Comput. Mater. Sci., 2019, 169, 109110 CrossRef.
- T. J. Smart and Y. Ping, J. Phys.: Condens. Matter, 2017, 29, 394006 CrossRef PubMed.
- V. Alexandrov and K. M. Rosso, Phys. Chem. Chem. Phys., 2015, 17, 14518–14531 RSC.
- N. Adelstein, J. B. Neaton, M. Asta and L. C. De Jonghe, Phys. Rev. B: Condens. Matter Mater. Phys., 2014, 89, 1–9 CrossRef.
- S. Kerisit and K. M. Rosso, J. Chem. Phys., 2007, 127, 124706 CrossRef PubMed.
- N. Iordanova, M. Dupuis and K. M. Rosso, J. Chem. Phys., 2005, 122, 144305 CrossRef CAS PubMed.
- K. M. Rosso and E. S. Ilton, J. Chem. Phys., 2003, 119, 9207–9218 CrossRef CAS.
- P. Liao, M. C. Toroker and E. A. Carter, Nano Lett., 2011, 11, 1775–1781 CrossRef CAS PubMed.
- J. Lee and S. Han, Phys. Chem. Chem. Phys., 2013, 15, 18906–18914 RSC.
- K. M. Rosso, D. M. Smith and M. Dupuis, J. Chem. Phys., 2003, 118, 6455–6466 CrossRef CAS.
- K. M. Rosso and M. Dupuis, J. Chem. Phys., 2004, 120, 7050–7054 CrossRef CAS PubMed.
- K. Klyukin, K. M. Rosso and V. Alexandrov, J. Phys. Chem. C, 2018, 122, 16086–16091 CrossRef CAS.
- E. J. Bylaska and K. Rosso, J. Chem. Theory Comput., 2018, 14, 4416–4426 CrossRef CAS PubMed.
- P. Liao and E. A. Carter, J. Appl. Phys., 2012, 112, 013701 CrossRef.
- R. F. Gardner, F. Sweett and D. W. Tanner, J. Phys. Chem. Solids, 1963, 24, 1175–1181 CrossRef CAS.
- R. F. Gardner, F. Sweett and D. W. Tanner, J. Phys. Chem. Solids, 1963, 24, 1183–1196 CrossRef CAS.
- A. Braun, K. Sivula, D. K. Bora, J. Zhu, L. Zhang, M. Grätzel, J. Guo and E. C. Constable, J. Phys. Chem. C, 2012, 116, 16870–16875 CrossRef CAS.
- V. I. Anisimov, F. Aryasetiawan, A. I. Lichtenstein and A. I. Lichtenstein, J. Phys.: Condens. Matter, 1997, 9, 767–808 CrossRef CAS.
- N. Ansari, K. Ulman, M. F. Camellone, N. Seriani, R. Gebauer and S. Piccinin, Phys. Rev. Mater., 2017, 1, 1–8 Search PubMed.
- D. Feller and K. A. Peterson, J. Chem. Phys., 1998, 108, 154–176 CrossRef CAS.
- G. F. Von Rudorff, R. Jakobsen, K. M. Rosso and J. Blumberger, J. Phys.: Condens. Matter, 2016, 28, 394001 CrossRef PubMed.
- Z. D. Pozun and G. Henkelman, J. Chem. Phys., 2011, 134, 1–9 CrossRef PubMed.
- A. R. Elmaslmane, M. B. Watkins and K. P. McKenna, J. Chem. Theory Comput., 2018, 14, 3740–3751 CrossRef CAS PubMed.
- L. Kronik, T. Stein, S. Refaely-Abramson and R. Baer, J. Chem. Theory Comput., 2012, 8, 1515–1531 CrossRef CAS PubMed.
- V. Vl
![[c with combining breve]](https://www.rsc.org/images/entities/char_0063_0306.gif) ek, H. R. Eisenberg, G. Steinle-Neumann, L. Kronik and R. Baer, J. Chem. Phys., 2015, 142, 034107 CrossRef PubMed.
ek, H. R. Eisenberg, G. Steinle-Neumann, L. Kronik and R. Baer, J. Chem. Phys., 2015, 142, 034107 CrossRef PubMed. - V. Alexandrov and K. M. Rosso, J. Chem. Phys., 2014, 140, 234701 CrossRef PubMed.
- D. M. Sherman, Geochim. Cosmochim. Acta, 2005, 69, 3249–3255 CrossRef CAS.
- A. V. Krukau, O. A. Vydrov, A. F. Izmaylov and G. E. Scuseria, J. Chem. Phys., 2006, 125, 0–5 CrossRef CAS PubMed.
- G. F. Von Rudorff, R. Jakobsen, K. M. Rosso and J. Blumberger, J. Phys. Chem. Lett., 2016, 7, 1155–1160 CrossRef CAS PubMed.
- S. Goedecker and M. Teter, Phys. Rev. B: Condens. Matter Mater. Phys., 1996, 54, 1703–1710 CrossRef CAS PubMed.
- O. R. Gittus, G. F. Von Rudorff, K. M. Rosso and J. Blumberger, J. Phys. Chem. Lett., 2018, 9, 5574–5582 CrossRef CAS PubMed.
- M. Guidon, J. Hutter and J. Vandevondele, J. Chem. Theory Comput., 2010, 6, 2348–2364 CrossRef CAS PubMed.
- J. Vandevondele, M. Krack, F. Mohamed, M. Parrinello, T. Chassaing and J. Hutter, Comput. Phys. Commun., 2005, 167, 103–128 CrossRef CAS.
- E. N. Maslen, V. A. Streltsov, N. R. Streltsova and N. Ishizawa, Acta Crystallogr., Sect. B: Struct. Sci., 1994, 50, 435–441 CrossRef.
- A. P. Zhukhlistov, Crystallogr. Rep., 2002, 46, 730–733 CrossRef.
- Y. Hexiong, L. Ren, R. T. Downs and G. Costin, Acta Crystallogr., Sect. E: Struct. Rep. Online, 2006, 62, 250–252 CrossRef.
- J. B. Parise, W. G. Marshall, R. I. Smith, H. D. Luiz and H. Möller, Am. Mineral., 2000, 85, 189–193 CrossRef CAS.
- E. Krén, P. Szabó and G. Konczos, Phys. Lett., 1965, 19, 103–104 CrossRef.
- A. Oleś, A. Szytuła and A. Wanic, Phys. Status Solidi, 1970, 41, 173–177 CrossRef.
- A. Szytula, A. Burewicz, Z. Dimitrij, S. Krasnick, H. Rzany, J. Todorovi, A. Wanic, W. Wolski, Z. Dimitrijvic, S. Krasnicki and J. Todorovic, Phys. Status Solidi, 1968, 429, 429–434 CrossRef.
- S. F. Nelsen, S. C. Blackstock and Y. Kim, J. Am. Chem. Soc., 1987, 109, 677–682 CrossRef CAS.
- F. L. Hirshfeld, Theor. Chim. Acta, 1977, 44, 129–138 CrossRef CAS.
- J. Sun, A. Ruzsinszky and J. Perdew, Phys. Rev. Lett., 2015, 115, 1–6 Search PubMed.
- J. G. Brandenburg, J. E. Bates, J. Sun and J. P. Perdew, Phys. Rev. B, 2016, 94, 17–19 CrossRef.
- Z. H. Yang, H. Peng, J. Sun and J. P. Perdew, Phys. Rev. B, 2016, 93, 1–9 Search PubMed.
- J. P. Perdew and A. Ruzsinszky, Eur. Phys. J. B, 2018, 91, 108 CrossRef.
- E. B. Isaacs and C. Wolverton, Phys. Rev. Mater., 2018, 2, 1–11 Search PubMed.
- G. Sai Gautam and E. A. Carter, Phys. Rev. Mater., 2018, 2, 1–14 Search PubMed.
- Y. Si, M. Li, Z. Zhou, M. Liu and O. Prezhdo, J. Chem. Phys., 2020, 152, 024706 CrossRef PubMed.
- X. Yong and M. A. Schoonen, Am. Mineral., 2000, 85, 543–556 CrossRef.
- J. P. Perdew, M. Ernzerhof and K. Burke, J. Chem. Phys., 1996, 105, 9982–9985 CrossRef CAS.
- H. Guo and A. S. Barnard, Phys. Chem. Chem. Phys., 2011, 13, 17864–17869 RSC.
- R. M. Cornell and U. Schwertmann, The Iron Oxides: Structure, Properties, Reactions, Occurences and Uses, Wiley-VCH, 2003 Search PubMed.
- H. Christensen, A. N. Christensen, U. Turpeinen, A. F. Andresen, O. Smidsrød, C.-O. Pontchour, P. Phavanantha, S. Pramatus, B. N. Cyvin and S. J. Cyvin, Acta Chem. Scand., 1978, 32, 87–88 CrossRef.
- S. A. Fuente, P. G. Belelli, N. J. Castellani and M. Avena, Mater. Chem. Phys., 2013, 137, 1012–1020 CrossRef CAS.
- N. H. de Leeuw and T. G. Cooper, Geochim. Cosmochim. Acta, 2007, 71, 1655–1673 CrossRef CAS.
- S. Speziale, R. Jeanloz, A. Milner, M. P. Pasternak and J. M. Zaug, Phys. Rev. B: Condens. Matter Mater. Phys., 2005, 71, 184106 CrossRef.
- H. D. Lutz, H. Möller and M. Schmidt, J. Mol. Struct., 1994, 328, 121–132 CrossRef CAS.
- H. D. Lutz, K. Beckenkamp and H. Möller, J. Mol. Struct., 1994, 322, 263–266 CrossRef CAS.
- M. C. Wander, K. M. Rosso and M. A. Schoonen, J. Phys. Chem. C, 2007, 111, 11414–11423 CrossRef CAS.
- R. H. P. Devamani and M. Alagar, Elixir Nanotechnol., 2013, 61, 16845–16848 Search PubMed.
- K. P. McKenna and J. Blumberger, Phys. Rev. B: Condens. Matter Mater. Phys., 2012, 86, 245110 CrossRef.
- J. Blumberger and K. P. McKenna, Phys. Chem. Chem. Phys., 2013, 15, 2184–2196 RSC.
- R. Ayala and M. Sprik, J. Phys. Chem. B, 2008, 112, 257–269 CrossRef CAS PubMed.
- S. Onari, T. Arai and K. Kudo, Phys. Rev. B: Condens. Matter Mater. Phys., 1977, 16, 1717–1721 CrossRef CAS.
- E. G. Ehlers, Optical Mineralogy: Mineral Descriptions, Blackwell Scientific, 1987 Search PubMed.
- R. D. Shannon, J. Appl. Phys., 1993, 73, 348–366 CrossRef CAS.
- R. Seidel, S. Thürmer, J. Moens, P. Geerlings, J. Blumberger and B. Winter, J. Phys. Chem. B, 2011, 115, 11671–11677 CrossRef CAS PubMed.
- R. Seidel, M. Faubel, B. Winter and J. Blumberger, J. Am. Chem. Soc., 2009, 131, 16127–16137 CrossRef CAS PubMed.
- J. Moens, R. Seidel, P. Geerlings, M. Faubel, B. Winter and J. Blumberger, J. Phys. Chem. B, 2010, 114, 9173–9182 CrossRef CAS PubMed.
- J. Spencer, L. Scalfi, A. Carof and J. Blumberger, Faraday Discuss., 2016, 195, 215–236 RSC.
- J. Li and N. Wu, Catal. Sci. Technol., 2015, 5, 1360–1384 RSC.
- A. Hankin, J. C. Alexander and G. H. Kelsall, Phys. Chem. Chem. Phys., 2014, 16, 16176–16186 RSC.
- G. Hummer, L. R. Pratt and A. E. García, J. Phys. Chem. A, 1998, 102, 7885–7895 CrossRef CAS.
Footnote |
| † Electronic supplementary information (ESI) available. See DOI: 10.1039/c9cp06482f |
| This journal is © the Owner Societies 2020 |