 Open Access Article
Unravelling the configuration of transient ortho-quinone methides by combining microfluidics with gas phase vibrational spectroscopy†
Martin
Mayer
 a,
Maik
Pahl
b,
Matthias
Spanka
c,
Max
Grellmann
a,
Marcel
Sickert
c,
Christoph
Schneider
a,
Maik
Pahl
b,
Matthias
Spanka
c,
Max
Grellmann
a,
Marcel
Sickert
c,
Christoph
Schneider
 *c,
Knut R.
Asmis
 *a and
Detlev
Belder
 *b
*b
aWilhelm-Ostwald-Institut für Physikalische und Theoretische Chemie, Universität Leipzig, Linnéstraße 2, D-04103 Leipzig, Germany. E-mail: knut.asmis@uni-leipzig.de
bInstitut für Analytische Chemie, Universität Leipzig, Linnéstraße 3, D-04103 Leipzig, Germany. E-mail: belder@uni-leipzig.de
cInstitut für Organische Chemie, Universität Leipzig, Johannisallee 29, D-04103 Leipzig, Germany. E-mail: schneider@chemie.uni-leipzig.de
First published on 4th February 2020
Abstract
The alkylidene double bond configuration of transient ortho-quinone methides (o-QMs) is studied by cryogenic ion trap vibrational spectroscopy. To this end, o-QMs are formed from ortho-hydroxy benzhydryl alcohols in a Brønsted acid mediated dehydration reaction on a microfluidic chip reactor and the E/Z isomer ratio is determined by comparing the measured gas phase mid-infrared fingerprints with the predicted harmonic spectra from density functional theory calculations. Control over the stereochemistry is achieved by exploiting steric repulsion interactions between the substituents adjacent to the formal double bond of the o-QMs. Attempts to manipulate the ratio of the E- and Z-isomers by varying the reaction conditions were unsuccessful. This observation suggests a low isomerization barrier and hence shorter equilibration times with respect to the on-chip residence time. The fluxional character of the formal double bond is confirmed in 13C-labelling experiments, which reveal a substantially red-shifted CC stretching frequency characteristic for extended, conjugated π-systems.
Introduction
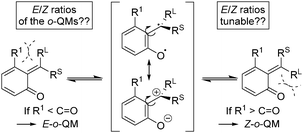
ortho-Quinone methides (o-QMs) are highly reactive intermediates featuring a polarized 2-alkylidene cyclohexadienone system. They occur in nature and play a prominent role in a variety of biological processes, e.g. in photosynthesis, as biomolecular radical scavengers or in plant defence mechanisms.1,2 However, not only nature makes use of the o-QM reactivity, chemists have also discovered their potential as in situ generated intermediates in a broad range of controlled organic reactions, most prominently, cycloaddition and conjugate addition reactions.3,4o-QMs can exist as E- and Z-isomers (RL ≠ RS), but the formal double bond is assumed to be much more fluxional than in classical olefins, due to relevant resonance structures with biradical and zwitterionic character (Scheme 1) and hence a lower rotational barrier to isomerization. The equilibrium distribution between these stereoisomers is believed to be controlled by repulsive steric interactions between the substituents R1, RL, and RS (RL > RS) and the carbonyl oxygen atom. Note, when o-QMs are prepared in acid-mediated reactions, as in the present study, they do not remain neutral in charge, as indicated in Scheme 1, but are present in their protonated form.
A thorough mechanistic understanding enabling conformational control is important for identifying new stereoselective reactions. But, even though a large number of stereoselective reactions involving o-QMs as transient intermediates have been developed to date,5 there are only limited reports on the direct characterization of the o-QMs due to their transient nature.2,6,7 Specifically, there is no direct proof for the relative configuration of in situ generated o-QMs, and the E/Z configurations of these intermediates have only been postulated by characterization of the corresponding reaction products.7,8 Here, we identify and characterize non-stabilized, protonated o-QMs by spectroscopic means.
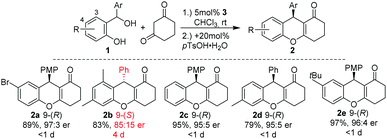
Since 2014, Schneider and coworkers have developed a broad range of chiral Brønsted acid catalysed conjugate and cycloaddition reactions of in situ generated o-QMs with β-dicarbonyl compounds, aldehydes, enamides, indoles, naphthols, oxonium ylides, and α-diazo ketones to produce a variety of chromane, coumarin, and benzofuran systems, respectively (Scheme 2).9,10 In the course of their investigations, they found circumstantial evidence for the existence of E–Z-isomers of o-QMs. For example, in [4+2]-cycloadditions of in situ generated o-QMs with 1,3-cyclohexadione in a broad substrate scope of o-QM precursors 1, only the 3-substituted alcohol 1a (Scheme 4) led to a prolonged reaction time and a substantial reduction of the enantioselectivity of product 2b (Scheme 2). Moreover, as confirmed by the X-ray single crystal analysis of 2a and 2b, the absolute configuration of product 2 was inverted from 9-(R) in tetrahydroxanthenon 2a to 9-(S) in tetrahydroxanthenon 2b.9,11 This observation led us to assume that the steric effects of the 3-substituent in the ortho-hydroxy benzhydryl alcohol 1 determine the absolute configuration of 2.
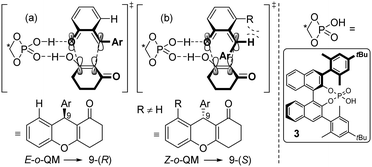
A reasonable hypothesis for this inversion is the preferred formation of a Z-configured o-QM in the case of a 3-substituted ortho-hydroxy benzhydryl alcohol 1. In the case of 1a, for example, the Z-configuration of the o-QM minimizes the steric repulsion interaction involving the adjacent methyl group (Scheme 3b). In contrast, when there is only a H-atom in the 3-position of the benzhydryl alcohol, the repulsive interaction with the carbonyl group of the o-QM is dominant and favours the formation of the E-isomer (Scheme 3a). Both double bond stereoisomers expose opposite faces to the β-diketone in the exo-transition state of the cycloaddition and hence give rise to opposite enantiomers. Scheme 3 shows the respective frontier molecular orbitals of the diene (LUMO) and the dienophile (HOMO) in this hetero Diels–Alder reaction with inverse electron demand.
However, due to the transient nature of the o-QMs, their concentration is low in solution, prohibiting their direct observation via NMR, IR or UV/VIS spectroscopy. Therefore, no direct evidence for the actual existence of these in situ generated E- or Z-o-QMs has been reported to date, leaving the proposed transition states (a) and (b) in Scheme 3 highly debatable.
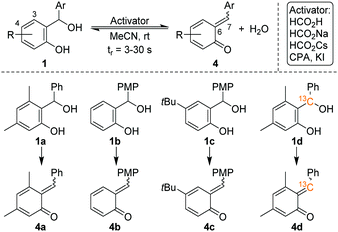
Pahl et al. have recently combined a microfluidic chip reactor with a cryogenic ion trap vibrational spectrometer to determine the structure of isomeric flow-reaction intermediates.12 We build upon this work and now report on the in situ formation and spectroscopic characterization of o-QMs using such a setup. Four different ortho-hydroxy benzhydryl alcohols 1 were routinely converted into o-QMs with 1 equiv. of formic acid as an activator, according to Scheme 4. Consequently, the o-QMs are present in their protonated form in solution. The benzhydryl alcohols 1a–1d were chosen in order to mimic the reactions in Scheme 2. The E/Z isomer ratios of protonated o-QMs formed from this selected set of benzhydryl alcohols were determined from their gas phase vibrational spectra obtained by means of infrared photodissociation (IRPD) spectroscopy. In order to control the stereochemistry of the o-QMs thermodynamically, we performed the reaction with and without substitution at position 3 and 4 in the benzhydryl alcohols 1. Subsequently, different activators were used to evaluate the potential for manipulating the E/Z isomer ratios. Finally, we used 13C-labelling to identify the spectroscopic fingerprint of the alkylidene CC bond involved in the E–Z-isomerization and use its vibrational frequency to characterize the nature of this nominal double bond.
Methods section
Synthesis of precursors and benzhydryl alcohols 1
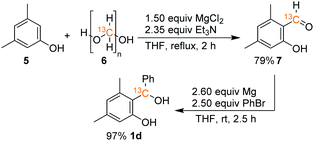
The synthesis of benzhydryl alcohols (1a–1c) proceeded via a Grignard reaction from the corresponding salicyl aldehyde. The incorporation of the 13C isotope into salicyl aldehyde 7, a precursor to alcohol 1d, was accomplished through the modification of a literature known procedure and by using commercially available 13C-paraformaldehyde (6) and 3,5-dimethylphenol (5), as depicted in Scheme 5 (for further details, see the ESI†).Experimental details for the chip reaction
The experimental microchip-ESI setup consists of a tailor-made glass microfluidic chip positioned in front of the inlet capillary of the triple mass spectrometer. The microfluidic chip had three inlets and a grinded emitter at the end of the reaction channel. The dimensions of the microchannels were 50 μm width, 20 μm depth and 25 cm length. The on-chip residence time was adjustable from 2.66 s to 30.0 s by altering the flow rates determined by the three syringe pumps. The starting materials and activators (1 mM) were dissolved in MeCN and delivered to the microfluidic chip via a syringe pump (neMESYS, cetoni GmbH, Korbußen, Germany). The connection between the individual syringes and the inlet of the microfluidic chip were realized via polyetheretherketone (PEEK) capillaries (360 μm OD, 75 μm ID, VICI AG, Schenkon, Switzerland). In this case, they were pressed into the inlet of the chip by elastomeric ferrules and PEEK clamps. A solution of MeCN/H2O (90/10 vol%) was delivered to a third inlet at the end of the chip. A steel capillary (360 μm OD, 150 μm ID, VICI AG, Schenkon, Switzerland) was used and integrated as described above. Electrospray formation was achieved by applying a voltage of 2500 V at the steel capillary at the third inlet.Gas phase vibrational spectroscopy
The IRPD experiments were performed using the Leipzig 6 K ion-trap triple mass spectrometer.13 Briefly, ions were transferred from solution into the gas phase using the microchip-ESI setup.12 The ion beam was collimated and compressed in phase space in a He-buffer-gas filled radio frequency (RF) ion-guide, held at room temperature. Subsequently, they were mass-selected using a quadrupole mass filter and focused in a RF ring-electrode ion-trap. The trap was filled with deuterium (D2) buffer gas at a nominal temperature of 13 K. The trapped ions were thermalized and weakly bound ion-messenger complexes with D2 are formed by many-body collisions.14 Every 100 ms, all ions were extracted from the ion trap and focused into the centre of the extraction region of an orthogonally mounted reflectron tandem mass spectrometer. IRPD spectra were obtained by irradiating the ions in the centre of the extraction region with an IR laser pulse from a Nd:YAG laser (Continuum Surelight EX1) pumped OPO/OPA/AgGaSe2 laser system (Laser Vision)15 operated at 10 Hz and with a bandwidth of approximately 3.5 cm−1. IRPD spectra were recorded by continuously scanning the laser wavelength with a scan speed such that a TOF mass spectrum averaged over 20 laser shots was obtained every 2 cm−1. Typically, three to four scans were measured and averaged to obtain an IRPD spectrum. The photodissociation cross-section σIRPD was determined as described previously.13,16Computational details
Electronic structure calculations and vibrational frequency analyses were carried out with the Gaussian 0917 software package using the B3LYP functional18 in combination with the Def2-TZVP basis set,19 applying dispersion-correction using Grimme's DFT-D3 model with Becke–Johnson damping (GD3BJ).20 The simulated vibrational spectra were obtained from scaled harmonic vibrational frequencies and intensities and convoluting the corresponding stick spectra with a Gaussian line shape function (12 cm−1 full-width-at-half-maximum, fwhm). The scaling factor (0.975) was obtained by scaling the computed spectra such that they align with the peak at 1536 cm−1 in the experimental IRPD spectrum, identified by 13C-labelling and differ only slightly from the factor reported in the literature (0.967) for this method.21 All electronic (ΔE) and standard Gibbs free energies (ΔG) were corrected for vibrational zero-point energy (ZPE).To obtain an objective score for the agreement between experimental and computed spectra, the cosine similarity score22 was employed. The score expresses the similarity S between two spectra A and B by their normalized Euclidean dot products according to:
 | (1) |
 | (2) |
Results and discussion
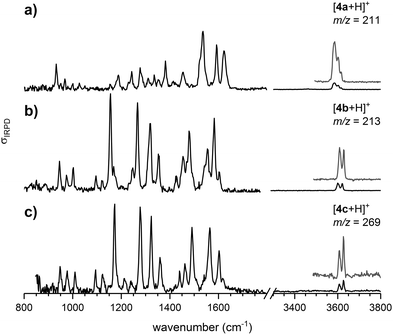
The continuous flow chip-reactor with an integrated electrospray emitter generates a stable and continuous (gas phase) ion signal of transient o-QM species. At short residence times of a few seconds, all three protonated o-QMs, which occur at m/z ratios of 211 ([4a + H]+), 213 ([4b + H]+) and 269 ([4c + H]+), were detected. The IRPD spectra of the corresponding messenger-tagged ions are shown in Fig. 1. All three spectra exhibit O–H stretching bands around 3600 cm−1 resulting from the protonation of the o-QM carbonyl group. Even though only a single O–H oscillator is present, multiple peaks are observed in this spectral region, because the D2 tag can bind to more than one site in a particular ion, each characterized by a characteristic shift in the O–H stretching frequency (see Fig. S2, ESI†). A comparison of the IRPD spectra with the simulated spectra reveals that the spectral range from 1125 to 1440 cm−1 is particularly sensitive to the configuration of the protonated o-QMs. We therefore focus on this region for the determination of the E/Z ratios.Structures and energetics
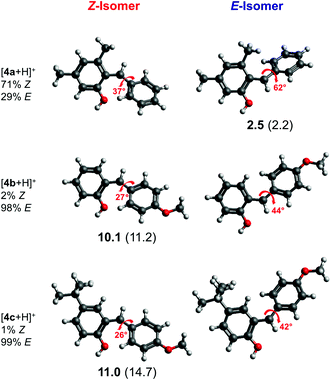
We performed geometry optimizations of all three protonated o-QMs to structurally and energetically characterize the transient intermediates. The local minimum-energy structures of the E- and Z-isomers of [4a + H]+, [4b + H]+ and [4c + H]+, their relative energy ΔE, standard Gibbs free energy and the predicted E/Z isomer ratios, calculated with the van't Hoff isotherm (see the ESI† for details), are shown in Fig. 2. As can be seen, all three protonated o-QMs deviate from planarity and the angles between the two ring systems (indicated by red arrow) are larger for the E- than the Z-isomer.
For [4b + H]+ and [4c + H]+, the E-isomer is predicted to be the most stable structure, both at 0 K (ΔE) and at room temperature ( ). E-[4b + H]+ lies 11.2 kJ mol−1 (10.1 kJ mol−1) lower in energy (standard Gibbs free energy) than the Z-isomer, whereas E-[4c + H]+ lies 14.7 kJ mol−1 (11.0 kJ mol−1) lower in energy. These standard Gibbs free energy differences lead to an E/Z isomer ratio of 98/2 for [4b + H]+ and 99/1 for [4c + H]+ at 298 K. On the other hand, the predicted minimum-energy structure for [4a + H]+ is found to be the Z-isomer, which is predicted to be 2.2 kJ mol−1 (2.5 kJ mol−1) lower than the E-isomer, yielding an E/Z isomer ratio of 29/71. The dominant contribution to these differences in energy (and free energy) is attributed to repulsive steric effects.
Hence, the present results support the hypothesis4 that the configuration of protonated o-QMs is governed by repulsive steric interactions. In the absence of a bulky substituent at position 3, as in [4b + H]+ and [4c + H]+, the formation of the E-isomer is favoured. If the protonated o-QM carries a bulky substituent, like the methyl group in [4a + H]+, steric repulsion between the methyl and the phenyl group favours the formation of the Z-isomer. Moreover, substitution at position 4, as in [4c + H]+, has no influence on the E/Z ratio, since the steric interaction of the phenyl group with the remote tBu-substituent is negligible. Therefore, [4c + H]+ shows the same isomer ratio as the unsubstituted [4b + H]+.
IRPD spectra
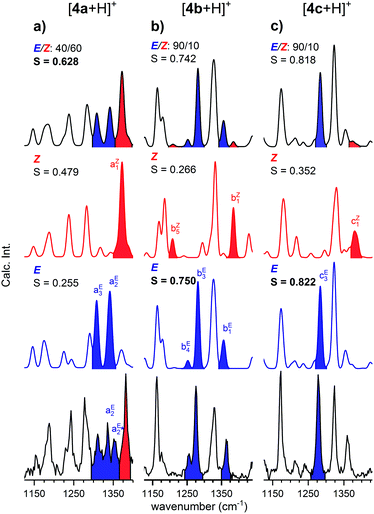
In order to determine the E/Z isomer ratios of the three protonated o-QMs, we compared their IRPD spectra with the sum spectra obtained by the proportionate summation of the computed harmonic spectra of the respective E- and Z-isomers (see Fig. 3 and Fig. S4, ESI†) in the spectral region of the CH and OH bending as well as C–OH and CC stretching modes (1125–1440 cm−1). Isomer-specific peaks in Fig. 3 are labelled and color-coded (red: Z-isomer-specific; blue: E-isomer-specific). The spectrum with the highest cosine similarity score S then yields the experimentally observed E/Z ratio.In the IRPD spectrum of [4b + H]+ (see Fig. 3b), the E-isomer-specific bands bE1, bE3 and bE4 are dominant, while the Z-isomer-specific bands bZ1 and bZ5 are not observed. Indeed, we find the best agreement with the pure E-isomer spectrum (S = 0.750), which is slightly better than the spectrum for the E/Z ratio of 90/10 (0.742). We conclude that for [4b + H]+, the Z-isomer is, if at all, present with a relative ratio of less than 10%.
A similar conclusion can be drawn for [4c + H]+. Its IRPD spectrum (see Fig. 3c) shows satisfactory agreement with the E-isomer-only spectrum (S = 0.822) and slightly poorer agreement for the E/Z = 90/10 spectrum (S = 0.818), while the comparison with the spectrum of the Z-isomer yields a much lower score (S = 0.352). In more detail, band cE3 (E-isomer-specific) is one of the most prominent features in the IRPD spectrum, while band cZ1 (Z-isomer-specific) is not observed. Hence, also for [4c + H]+, only the E-isomer is present in significant (>90%) amounts.
The IRPD spectrum of [4a + H]+, shown in Fig. 3a, on the other hand, exhibits features characteristic of the Z- (aZ1) as well as the E-isomer (aE2 and aE3). The best agreement is found by assuming a ratio E/Z of 40/60 (S = 0.628), while the simulated spectra of the pure isomers yield significantly smaller S values (Z: S = 0.479; E: S = 0.255). Note that the best S value is significantly smaller than for the other two systems. This is predominantly due to discrepancies in the spectral region of 1325–1360 cm−1, where the separation of two vibrational modes in the experimental spectrum (aE2 and  ) is underestimated in the simulated one, which predicts two quasi-degenerate modes and hence only a single band (aE2). Summarizing, the experimentally determined E/Z ratios are in reasonable agreement with the predicted isomer ratios (see Fig. 1) based on the computed standard Gibbs free energies at 298 K, confirming the presence of a thermodynamically-controlled reaction.
E–Z fluxionality
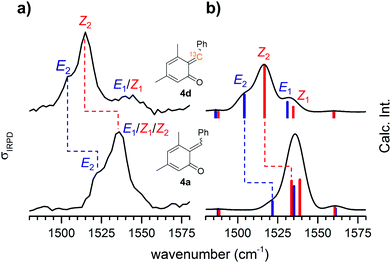
Attempts to influence the reaction stereoselectivity using different activators for the on-chip reaction (see Table S4, ESI†) were not successful. However, o-QMs are predicted to exhibit a relatively small E–Z-isomerization barrier compared to other conjugated systems and thus a rather fluxional E–Z-geometry.4 We therefore hypothesize that the on-chip equilibration time for the E–Z-isomerization is substantially shorter than the on-chip residence time. In such a case, thermodynamic equilibrium is reached quasi instantaneously and any attempts to influence the reaction kinetics are likely to fail. However, we cannot fully rule out that the E/Z ratio my be modified by the ESI process.The marked E–Z-fluxionality suggests a bond order of less than two for the nominal alkylidene double bond in the respective protonated o-QM. More detailed information on the nature of this double bond can be inferred from the position of the corresponding CC bond stretching band in the IRPD spectrum. We therefore 13C-labelled the former benzylic carbon atom. The comparison between the 13C-labelled and the unlabelled IRPD spectrum in Fig. 4a (see Fig. S5 in the ESI† for full spectral range) reveals that only two features, labelled Z2 (1536 → 1515 cm−1) and E2 (1522 → 1505 cm−1) in Fig. 4a, exhibit a substantial red shift. The computed spectra (Fig. 4b) allow us to assign these features to two vibrational transitions (Z2 and E2), one in the Z- and the other in the E-isomer, that indeed involve the stretching displacement of the 6-C atom.
For comparison, isolated double bonds are found in the 1680–1620 cm−1 range.24 Conjugation with, e.g., a carbonyl group as in a Michael acceptor25 red-shifts these bands down to 1640–1590 cm−1. These conjugated CC double bonds are found at similar or lower energies, as, e.g., in 1,3 butadiene26 (1643/1599 cm−1) or in benzene25 (1600–1420 cm−1). The stretching modes of CC single bonds25 lie around 1130 cm−1. Consequently, the CC stretching mode of [4a + H]+ is associated with an extended, conjugated π-system embedded in the o-QM. Electron delocalization lowers the rotational barrier of the E–Z-isomerization and leads to the observed fluxionality of o-QMs.
Conclusion
The present work demonstrates that transient o-QMs, which are generated in situ on a microfluidic chip, coupled to a cryogenic ion trap vibrational spectrometer, can be isolated and spectroscopically characterized. Moreover, their E–Z-isomers can be distinguished based on their IR signature in the fingerprint region. When both isomers are present, E/Z ratios can be determined with an accuracy of ∼±10%, which is mainly limited by the quality of the electronic structure calculations.We have shown that the Brønsted acid mediated dehydration reaction proceeds via the E-isomer when there is no substituent present at the ortho-position relative to the alkylidene double bond. If a methyl group is introduced at this position, the Z-isomer is predominantly formed and consequently the enantioselectivity of the ensuing reaction is inverted. The steric repulsion between the methyl and the phenyl group thus determines the configuration of the protonated o-QM. Furthermore, substitution at position 4 also leads to exclusive formation of the E-isomer. In order to invert the stereoselectivity, substitution in the direct vicinity of the formal double bond (position 3) is required.
The pronounced E–Z fluxionality of o-QMs leads to the hypothesis that the thermodynamic equilibration between the E- and Z-isomer is substantially faster than the on-chip residence time, which explains why all attempts to influence the reaction kinetics remained fruitless. The red-shifted CC stretch vibration supports the assumption that o-QMs are geometrically fluxional species. These findings will prove valuable for the development of further stereoselective reactions.
Conflicts of interest
There are no conflicts to declare.Acknowledgements
Generous financial support has been provided by the Deutsche Forschungsgemeinschaft (SCHN 441/11-2). K. R. A. acknowledges instrumental support from the Fritz-Haber-Institute of the Max-Planck Society. K. R. A. and M. M. thank J. Oomens, A. Riis, and K. J. Houthuijs from Radboud University (Institute for Molecules and Materials) for helping with the calculations concerning the cosine similarity score. M. M. acknowledges programming support from his friend and coding-enthusiast Gashi Stenzel.Notes and references
- (a) M. Vos, G. Esposito, J. N. Edirisinghe, S. Vilain, D. M. Haddad, J. R. Slabbaert, S. van Meensel, O. Schaap, B. de Strooper, R. Meganathan, V. A. Morais and P. Verstreken, Science, 2012, 336, 1306 CrossRef CAS PubMed; (b) G. Leary, J. Chem. Soc. A, 1971, 2248 RSC; (c) H. Gorner, Photochem. Photobiol. Sci., 2004, 3, 71 RSC; (d) A. M. Swartz, M. Barra and D. Kuntz, J. Org. Chem., 2004, 69, 3198 CrossRef CAS PubMed; (e) T. Rosenau, E. Kloser, L. Gille, F. Mazzini and T. Netscher, J. Org. Chem., 2007, 72, 3268 CrossRef CAS PubMed; (f) T. P. Clausen, J. W. Koller and P. B. Reichardt, Tetrahedron Lett., 1990, 31, 4537 CrossRef CAS; (g) G. Balakrishnan and S. Umapathy, J. Mol. Struct., 1999, 475, 5 CrossRef CAS.
- T. Rosenau, A. Potthast, T. Elder and P. Kosma, Org. Lett., 2002, 4, 4285 CrossRef CAS PubMed.
- (a) R. W. van de Water and T. R. R. Pettus, Tetrahedron, 2002, 58, 5367 CrossRef CAS; (b) S. B. Ferreira, F. d. C. da Silva, A. C. Pinto, D. T. G. Gonzaga and V. F. Ferreira, J. Heterocycl. Chem., 2009, 46, 1080 CrossRef CAS; (c) T. P. Pathak and M. S. Sigman, J. Org. Chem., 2011, 76, 9210 CrossRef CAS PubMed; (d) Z. Wang and J. Sun, Synthesis, 2015, 3629–3644 Search PubMed; (e) L. Caruana, M. Fochi and L. Bernardi, Molecules, 2015, 20, 11733 CrossRef CAS PubMed; (f) A. A. Jaworski and K. A. Scheidt, J. Org. Chem., 2016, 81, 10145 CrossRef CAS PubMed; (g) B. Yang and S. Gao, Chem. Soc. Rev., 2018, 47, 7926 RSC.
- M. S. Singh, A. Nagaraju, N. Anand and S. Chowdhury, RSC Adv., 2014, 4, 55924 RSC.
- (a) D. Wilcke, E. Herdtweck and T. Bach, Synlett, 2011, 1235 CAS; (b) C.-C. Hsiao, H.-H. Liao and M. Rueping, Angew. Chem., Int. Ed., 2014, 53, 13258 CrossRef CAS PubMed; (c) Z. Lai, Z. Wang and J. Sun, Org. Lett., 2015, 17, 6058 CrossRef CAS PubMed; (d) C.-C. Hsiao, S. Raja, H.-H. Liao, I. Atodiresei and M. Rueping, Angew. Chem., Int. Ed., 2015, 54, 5762 CrossRef CAS PubMed; (e) Z. Wang, F. Ai, Z. Wang, W. Zhao, G. Zhu, Z. Lin and J. Sun, J. Am. Chem. Soc., 2015, 137, 383 CrossRef CAS PubMed; (f) J.-J. Zhao, S.-B. Sun, S.-H. He, Q. Wu and F. Shi, Angew. Chem., Int. Ed., 2015, 54, 5460 CrossRef CAS PubMed; (g) W. Zhao, Z. Wang, B. Chu and J. Sun, Angew. Chem., Int. Ed., 2015, 54, 1910 CrossRef CAS PubMed; (h) G. C. Tsui, L. Liu and B. List, Angew. Chem., Int. Ed., 2015, 54, 7703 CrossRef CAS PubMed; (i) Y. Xie and B. List, Angew. Chem., Int. Ed., 2017, 56, 4936 CrossRef CAS PubMed; (j) H. J. Jeong and D. Y. Kim, Org. Lett., 2018, 20, 2944 CrossRef CAS PubMed.
- (a) O. L. Chapman and C. L. McIntosh, J. Chem. Soc. D, 1971, 383 RSC; (b) L. Jurd, Tetrahedron, 1977, 33, 163 CrossRef CAS; (c) H. Amouri, Y. Besace, J. Le Bras and J. Vaissermann, J. Am. Chem. Soc., 1998, 120, 6171 CrossRef CAS.
- A. Arduini, A. Pochini, R. Ungaro and P. Domiano, J. Chem. Soc., Perkin Trans. 1, 1986, 1391 RSC.
- M. Taing and H. W. Moore, J. Org. Chem., 1996, 61, 329 CrossRef CAS.
- O. El-Sepelgy, S. Haseloff, S. K. Alamsetti and C. Schneider, Angew. Chem., Int. Ed., 2014, 53, 7923 CrossRef CAS PubMed.
- (a) S. Saha and C. Schneider, Chem. – Eur. J., 2015, 21, 2348 CrossRef CAS PubMed; (b) S. K. Alamsetti, M. Spanka and C. Schneider, Angew. Chem., Int. Ed., 2016, 55, 2392 CrossRef CAS PubMed; (c) K. Gebauer, F. Reuß, M. Spanka and C. Schneider, Org. Lett., 2017, 19, 4588 CrossRef CAS PubMed; (d) M. Spanka and C. Schneider, Org. Lett., 2018, 20, 4769 CrossRef CAS PubMed; (e) S. Saha and C. Schneider, Org. Lett., 2015, 17, 648 CrossRef CAS PubMed; (f) S. Saha, S. K. Alamsetti and C. Schneider, Chem. Commun., 2015, 51, 1461 RSC; (g) A. Suneja and C. Schneider, Org. Lett., 2018, 20, 7576 CrossRef CAS PubMed.
- CCDC 969295 (2a), 1561287 (2b) contains the supplementary crystallo-graphic data for this paper†.
- M. Pahl, M. Mayer, M. Schneider, D. Belder and K. R. Asmis, Anal. Chem., 2019, 91, 3199 CrossRef CAS PubMed.
- N. Heine and K. R. Asmis, Int. Rev. Phys. Chem., 2015, 34, 1 Search PubMed.
- (a) M. Brümmer, C. Kaposta, G. Santambrogio and K. R. Asmis, J. Chem. Phys., 2003, 119, 12700 CrossRef; (b) D. J. Goebbert, T. Wende, R. Bergmann, G. Meijer and K. R. Asmis, J. Phys. Chem. A, 2009, 113, 5874 CrossRef CAS PubMed.
- W. R. Bosenberg and D. R. Guyer, J. Opt. Soc. Am. B, 1993, 10, 1716 CrossRef CAS.
- N. Heine and K. R. Asmis, Int. Rev. Phys. Chem., 2016, 35, 507 Search PubMed.
- M. J. Frisch, G. W. Trucks, H. B. Schlegel, G. E. Scuseria, M. A. Robb, J. R. Cheeseman, G. Scalmani, V. Barone, G. A. Petersson, H. Nakatsuji, X. Li, M. Caricato, A. Marenich, J. Bloino, B. G. Janesko, R. Gomperts, B. Mennucci, H. P. Hratchian, J. V. Ortiz, A. F. Izmaylov, J. L. Sonnenberg, D. Williams-Young, F. Ding, F. Lipparini, F. Egidi, J. Goings, B. Peng, A. Petrone, T. Henderson, D. Ranasinghe, V. G. Zakrzewski, J. Gao, N. Rega, G. Zheng, W. Liang, M. Hada, M. Ehara, K. Toyota, R. Fukuda, J. Hasegawa, M. Ishida, T. Nakajima, Y. Honda, O. Kitao, H. Nakai, T. Vreven, K. Throssell, J. A. Montgomery, Jr., J. E. Peralta, F. Ogliaro, M. Bearpark, J. J. Heyd, E. Brothers, K. N. Kudin, V. N. Staroverov, T. Keith, R. Kobayashi, J. Normand, K. Raghavachari, A. Rendell, J. C. Burant, S. S. Iyengar, J. Tomasi, M. Cossi, J. M. Millam, M. Klene, C. Adamo, R. Cammi, J. W. Ochterski, R. L. Martin, K. Morokuma, O. Farkas, J. B. Foresman and D. J. Fox, Gaussian 09 (Revision D.01), Gaussian, Inc, Wallingford CT, 2016 Search PubMed.
- A. D. Becke, J. Chem. Phys., 1993, 98, 5648 CrossRef CAS.
- (a) F. Weigend, Phys. Chem. Chem. Phys., 2006, 8, 1057 RSC; (b) F. Weigend and R. Ahlrichs, Phys. Chem. Chem. Phys., 2005, 7, 3297 RSC.
- S. Grimme, S. Ehrlich and L. Goerigk, J. Comput. Chem., 2011, 32, 1456 CrossRef CAS PubMed.
- M. K. Kesharwani, B. Brauer and J. M. L. Martin, J. Phys. Chem. A, 2015, 119, 1701 CrossRef CAS PubMed.
- L. J. M. Kempkes, J. Martens, G. Berden, K. J. Houthuijs and J. Oomens, Faraday Discuss., 2019, 217, 434 RSC.
- R. E. van Outersterp, K. J. Houthuijs, G. Berden, U. F. Engelke, L. A. J. Kluijtmans, R. A. Wevers, K. L. M. Coene, J. Oomens and J. Martens, Int. J. Mass Spectrom., 2019, 443, 77 CrossRef CAS.
- P. W. Atkins and J. de Paula, Physical chemistry, W.H. Freeman and Co, New York, 9th edn, 2010 Search PubMed.
- M. Hesse, H. Meier and B. Zeeh, Spektroskopische Methoden in der Organischen Chemie: 102 Tabellen, Thieme, Stuttgart, 7th edn, 2005 Search PubMed.
- Y. N. Panchenko, Spectrochim. Acta, 1975, 31, 1201 CrossRef.
Footnote |
| † Electronic supplementary information (ESI) available: Microfluidic fabrication process; minimum-energy geometries, harmonic IR spectra, IRPD band positions, and assignments; list of different activators and the corresponding IRPD spectra measured with different activators; determination of equilibrium constants and conversion rates using transition state theory; information on the synthesis and analysis of the precursors. See DOI: 10.1039/c9cp06435d |
| This journal is © the Owner Societies 2020 |

