
 Open Access Article
 This Open Access Article is licensed under a
 Creative Commons Attribution 3.0 Unported Licence
Measurement of the fluorescence lifetime of GFP in high refractive index levitated droplets using FLIM
N. M.
Davidson
a,
P. J.
Gallimore
b,
B.
Bateman
 c,
A. D.
Ward
c,
S. W.
Botchway
c,
M.
Kalberer
b,
M. K.
Kuimova
d and
F. D.
Pope
*a
c,
A. D.
Ward
c,
S. W.
Botchway
c,
M.
Kalberer
b,
M. K.
Kuimova
d and
F. D.
Pope
*a
aSchool of Geography, Earth and Environmental Sciences, University of Birmingham, Edgbaston, Birmingham, B15 2TT, UK. E-mail: f.pope@bham.ac.uk
bDepartment of Chemistry, University of Cambridge, Lensfield Road, Cambridge, CB2 1EW, UK
cCentral Laser Facility, Rutherford Appleton Laboratory, Harwell, Oxford, OX11 0QX, UK
dDepartment of Chemistry, Imperial College London, South Kensington Campus, London, SW7 2AZ, UK
First published on 15th June 2020
Abstract
Green fluorescent protein (GFP) is a widely used fluorescent probe in the life sciences and biosciences due to its high quantum yield and extinction coefficient, and its ability to bind to biological systems of interest. This study measures the fluorescence lifetime of GFP in sucrose/water solutions of known molarity in order to determine the refractive index dependent lifetime of GFP. A range of refractive indices from 1.43–1.53 were probed by levitating micron sized droplets composed of water/sucrose/GFP in an optical trap under well-constrained conditions of relative humidity. This setup allows for the first reported measurements of the fluorescence lifetime of GFP at refractive indices greater than 1.46. The results obtained at refractive indices less than 1.46 show good agreement with previous studies. Further experiments that trapped droplets of deionised water containing GFP allowed the hygroscopic properties of GFP to be measured. GFP is found to be mildly hygroscopic by mass, but the high ratio of molecular masses of GFP to water (ca. 1500![[thin space (1/6-em)]](https://www.rsc.org/images/entities/char_2009.gif) :1) signifies that water uptake is large on a per-mole basis. Hygroscopic properties are verified using brightfield microscope imaging, of GFP droplets at low and high relative humidity, by measuring the humidity dependent droplet size. In addition, this experiment allowed the refractive index of pure GFP to be estimated for the first time (1.72 ± 0.07). This work provides reference data for future experiments involving GFP, especially for those conducted in high refractive index media. The work also demonstrates that GFP can be used as a probe for aerosol studies, which require determination of the refractive index of the aerosol of any shape.
:1) signifies that water uptake is large on a per-mole basis. Hygroscopic properties are verified using brightfield microscope imaging, of GFP droplets at low and high relative humidity, by measuring the humidity dependent droplet size. In addition, this experiment allowed the refractive index of pure GFP to be estimated for the first time (1.72 ± 0.07). This work provides reference data for future experiments involving GFP, especially for those conducted in high refractive index media. The work also demonstrates that GFP can be used as a probe for aerosol studies, which require determination of the refractive index of the aerosol of any shape.
1. Introduction
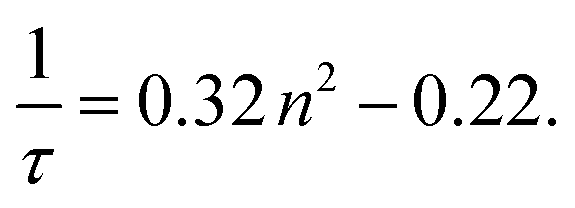
Green fluorescent protein (GFP) has been widely used in cellular imaging since its isolation from Aqueorea victoria jellyfish.1 It contains an intrinsic fluorophore which remains functional when encoded into other organisms,2 therefore, it is used as a fluorescent tag for a range of proteins. GFP has been used as a fluorescent marker to determine the extent of gene expression and spatial location of proteins in cells. In recent years, Fluorescence Lifetime Imaging (FLIM) has been particularly useful for probing protein–protein interactions using GFP as a donor in Förster Resonance Energy Transfer (FRET) experiments.As well as specific molecular interactions, the lifetime of a fluorophore may depend on other characteristics of the surrounding solution. For GFP, the solution viscosity3 has been found not to influence lifetime. However, several studies have found that lifetime varies with refractive index (n).4–7 This is theoretically predicted; Strickler and Berg8 proposed that the inverse natural lifetime of a fluorophore (1/τ) scales with the square of the refractive index n2, see eqn (1), where n2 is also referred to as the relative permittivity.
 | (1) |
Subsequent theoretical work9–12 suggests that other power-law relationships may be more appropriate depending on the nature of fluorophore–solvent interactions (e.g. solvent “caging”), or if constants in the Strickler–Berg equation also vary with n. To date, however, GFP lifetimes measured as a function of refractive index are consistent with eqn (1).
Across two studies, Suhling et al.3,5 measured the lifetime of GFP in bulk mixtures of water and glycerol (n = 1.33–1.46), and found good agreement with eqn (1). Similar experiments by Borst et al.13 found that related yellow and cyan fluorescent proteins show the same functional dependence on refractive index.
On this basis, GFP lifetime has been used to estimate refractive index in living cells. Tregidgo et al.1 used GFP-tagged proteins to estimate ncell = 1.45 and found that the refractive index of the medium surrounding the cells influenced lifetime, again consistent with eqn (1). Van Manen et al.11 measured the lifetimes of GFP-tagged proteins localised to the cytosol and the cell membrane and found ncytosol = 1.38 and nmembrane = 1.46. They also noted that GFP physisorbed to high-refractive index polystyrene beads (n = 1.60) had a correspondingly short lifetime.
Systematic studies of GFP lifetime at high refractive index (n > 1.46) have not been reported, likely due to difficulties in preparing suitable bulk aqueous solutions. However, regions of the cell which are rich in proteins, nucleic acids and lipids may possess n above this range, as high as 1.6.14 Zhang et al.15 recently determined the distribution of refractive index in whole cells and noted significant heterogeneity, including regions with n > 1.50.
In this study, we determine the fluorescent lifetime of GFP in a high refractive index environment. Lifetime studies have also been carried out in reverse micelles to study the behaviour of enclosed water pools,16 and within cells during mitosis to monitor protein concentrations at different stages of the cell cycle.17 Specifically, we employ optical trapping18,19 to optically levitate micron-sized sucrose/water aerosols containing GFP. Aerosols provide well constrained systems, where the thermodynamic equilibrium of the particle water content is determined by the surrounding ambient relative humidity (RH). At low RH (<30%), sucrose aerosols do not crystallise like corresponding bulk sucrose solutions, but instead form a metastable “glassy” state with a high mass fraction of sucrose and hence high refractive index.20 Using Fluorescent Lifetime Imaging, we measure GFP lifetimes using over a range of RH corresponding to n = 1.43–1.53, to test the applicability of eqn (1) to previously unexplored conditions. Earlier FLIM work illustrated the changes in GFP lifetime as a result of medium refractive index.21 Furthermore, since aerosol refractive index is an important parameter in determining the radiative properties of atmospheric particles,22,23 we demonstrate that GFP could be used to probe atmospheric aerosol refractive index in laboratory studies employing FLIM.
We also investigate optical trapping of binary GFP/water mixtures and perform imaging over a wide range of RH. This exploratory work allows us to relate changes in refractive index to particle water content, including a tentative estimate of the refractive index of “pure” GFP at low RH by extrapolation. We also observe increases in droplet size with increasing RH as a consequence of hygroscopic water uptake by the protein.
This paper provides a methodology for determining the refractive index of aerosol particles and droplets, which are relevant for atmospheric science, including air quality and climate change, and potentially other applications.
2. Methods and materials
2.1 Calculation of refractive index of sucrose/water aerosols under controlled RH conditions
The refractive index (n) and hygroscopic properties of binary sucrose/water solutions are well defined. Tong et al.20 measured the refractive indices of a series of aqueous sucrose solutions at varying concentration and hence mass fraction of solute (MFS), as parameterised in eqn (2).| n = 0.071w2 + 0.1358w + 1.3339 | (2) |
This formula allows the refractive index of a sucrose solution to be calculated based upon the MFS. For sucrose/water aerosols at a given RH, the MFS can be calculated using the parameterisation of eqn (10) in Zobrist et al.24 which is shown in eqn (3).
 | (3) |
2.2 Green fluorescent protein solutions
A stock solution of the ternary mixture of GFP/sucrose/water was made from solid crystalline GFP (made in house), analytical grade sucrose (Sigma Aldrich), and deionised water. The concentration of the stock solution was 0.375 M sucrose (342.3 g mol−1) and 36 μM GFP (ca. 27000 g mol−1). The molarity and mass of sucrose in solution is in large excess compared to GFP, therefore, the hygroscopicity of the generated aerosol droplets is dependent solely on the sucrose to water ratio.
It is noted, that whilst the work of Suhling et al. used solutions of lower GFP concentration compared to this work, their fluorescence measurements were taken from bulk solutions in cuvettes (diameter = 1 cm) as opposed to micron-sized droplets. The corresponding number of fluorophores in the cuvette experiments far exceeds those in the droplets. Hence it was necessary to use higher GFP concentrations (36 μM) in these experiments in order to generate enough photons from 4–5 μm diameter aerosol droplets to have sufficient fluorescence to measure. Lower concentration solutions (18 μM) did not produce droplets with sufficient fluorescence for imaging.
2.3 Sample delivery
GFP solutions were aerosolised by adding approximately 1.5 ml of stock solution to the reservoir of an Aerosonic Travel Nebulizer (Schill Medical). Droplets were carried into the trapping chamber via a modified Aerochamber Plus spacer (Trudell Medical International) to reduce droplet velocity approaching the chamber and improve the chances of successful trapping. The front baffle inside the mouthpiece of the spacer was removed to allow more droplets to pass through. Average droplets from the nebulizer had a diameter of ≤1 μm. Once a droplet was trapped it was allowed to collide with additional droplets, until multiple collisions had occurred and the trapped droplet diameter was 4–5 μm across. The trapping chamber was a 1 × 2 × 10 cm aluminium cuboid with borosilicate glass coverslips above and below to admit laser light and similar windows on the sides to allow direct imaging otrapped droplets. Aerosol droplets were pulled through the system by a vacuum pump attached to the chamber outlet. The vacuum pump's pull from the chamber was limited to 100 cm3 min−1 using a needle valve, as higher flow rates tended to dislodge trapped droplets. An open side line was installed to avoid damaging the pump by restricting air flow. The pump exhaust was connected to the lab extraction vent.Dry nitrogen gas, from the boil-off from a liquid nitrogen tank, was fed to the chamber at 100 cm3 min−1via a mass flow meter (Bronkhorst MV-301) to lower RH. To raise RH, the nitrogen feed was run from the mass flow meter through a water bubbler. Once the desired low RH was reached, the line from the mass flow controller was detached intermittently while the RH was monitored throughout each FLIM measurement. RH was monitored within the chamber with a Sensirion SHT75 temperature-RH probe (manufacturer stated RH uncertainty = ±1.8% over the range from 10% to 90%25).
2.4 Flim & droplet imaging setup
The optical trap was a counter-propagating dual beam setup similar to the apparatus described by ref. 19 and 26, using a 1064 nm Nd:YAG CW laser (Ventus 1064, Laser Quantum) split across a beam splitter and carried to their respective objectives by optical fibres. The top objective was a ×50 N.A. 0.42 NIR Mplan Apo by Mitutoyo, and the bottom objective was a ×60 N.A. 1.2 Nikon Apochromat installed in a Nikon Eclipse Ti inverted scanning confocal microscope. Laser output from the top objective was 11.4 mW and 11.7 mW from the bottom objective. The bottom objective is a water immersion objective and requires a water drop external to the lower coverslip of the chamber. The optical trap was positioned 40 μm above the cover slip with a separation of 10 μm between the focal planes.Excitation of the GFP was achieved using a SuperK Compact Supercontinuum white light laser set to 488 nm with a measured beam output of 0.744 mW. The supercontinuum is separated into the desired wavelength using an AOTF: a narrow band of the correct wavelength is selected to excite fluorescence. This is focussed to a diffraction limited spot using the same lower objective that is used for trapping. The spot is raster scanned across the field of view and the droplet. The beam waist is approximately 500 nm, contrasted with a droplet size of 4–5 μm. Droplet illumination is point by point and the fluorescence collection is via confocal microscopy.
2.5 Data processing
Fluorescence lifetime readings were collected using SPCM application software (Becker and Hickl), and results were processed in Tri2 (version 2.8). Each fluorescence measurement was binned by a factor of 8 (17 × 17 pixels) in order to reach a threshold of at least 100 counts per pixel, enough to generate a Gaussian distribution, following Suhling et al. 2002.5 A bi-exponential Marquardt fit was applied since this gave the best fit to the data and matched the fits produced by Suhling et al. in 2001.3 A X2 range of 0.8–1.2 was selected to exclude poor distributions and improve the shape of the resulting lifetime readings. Sample readings from SPCM and Tri2 are shown in Fig. 1.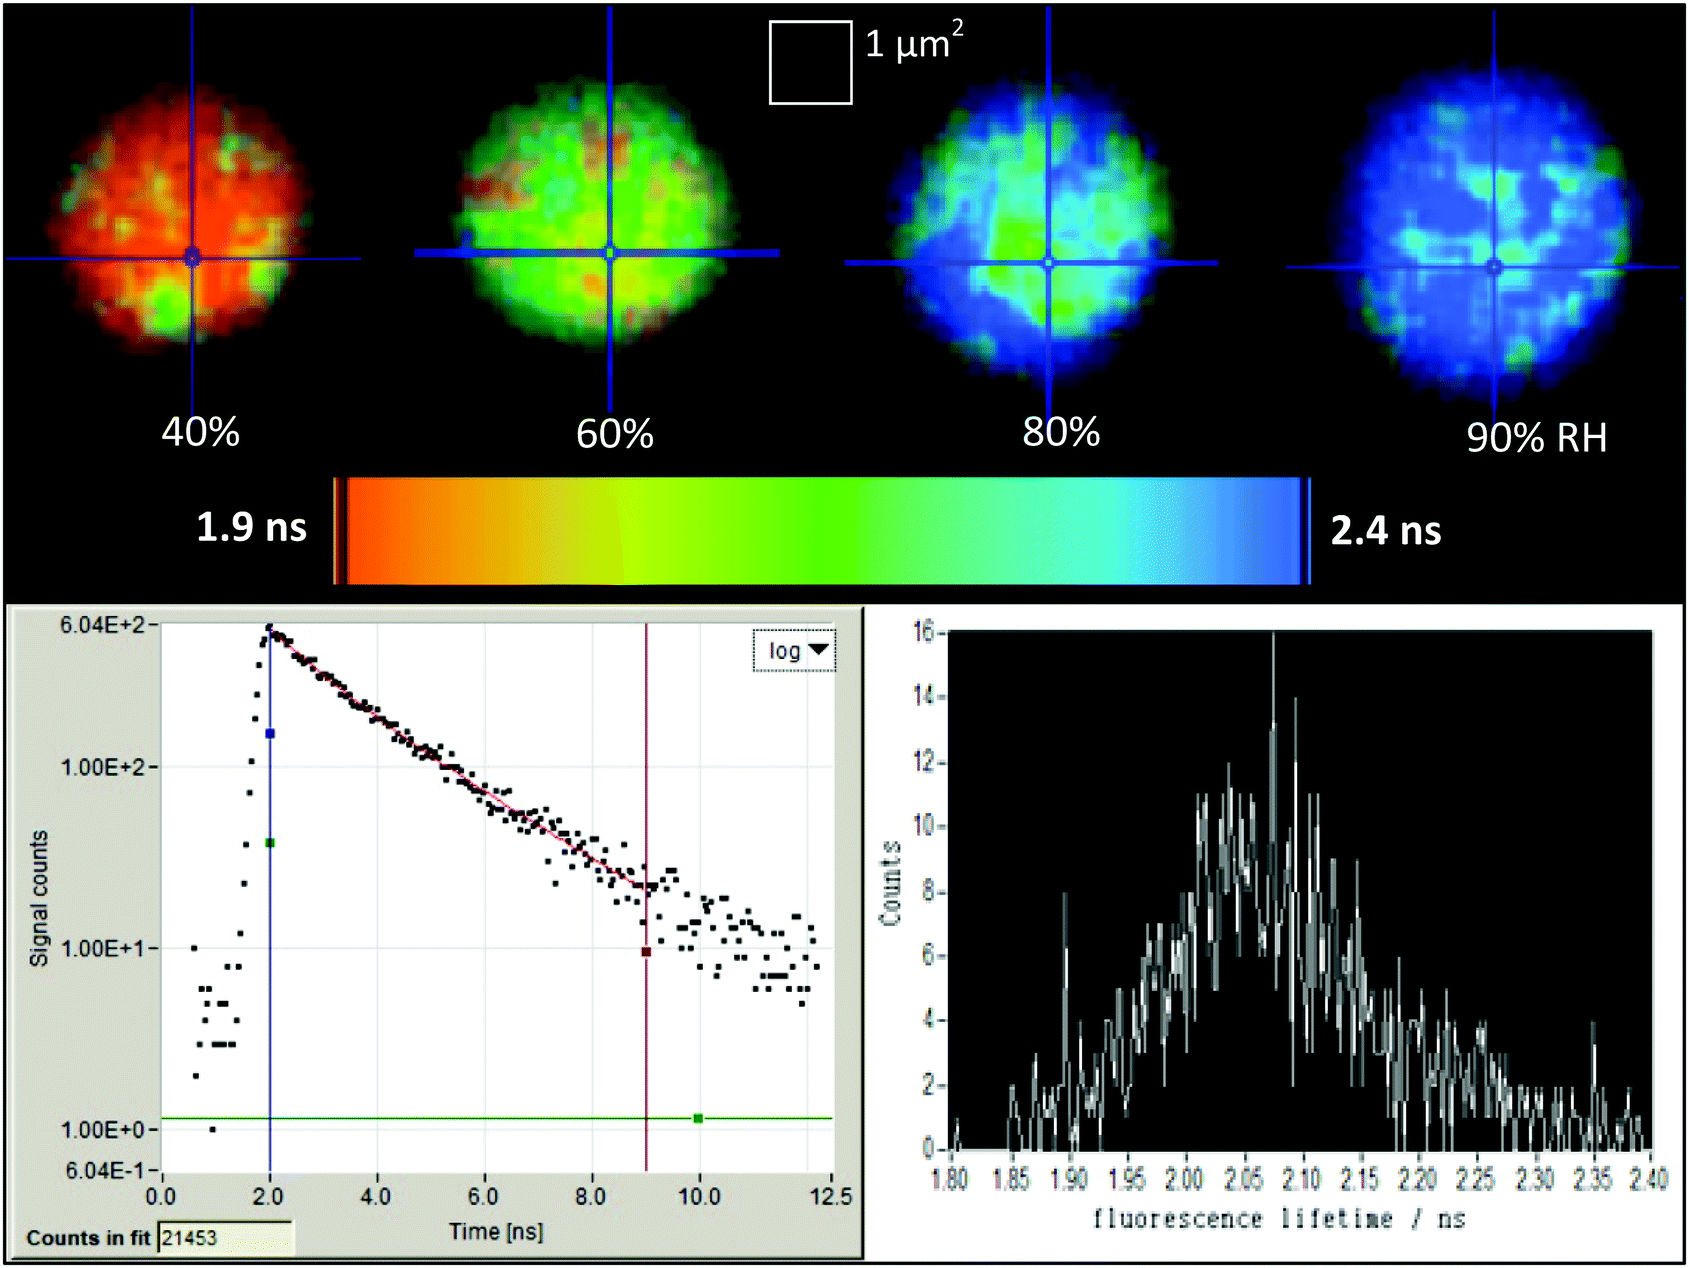 | ||
| Fig. 1 Top: Example fluorescence lifetime images of the same droplet of GFP in sucrose/water at 40, 60, 80 & 90% RH collected by SPCimage. Bottom left: Log time-resolved fluorescence decay of the 40% RH droplet in Tri2. Bottom right: Lifetime histogram of the same droplet, with lifetime on the x-axis and number of counts on the y-axis. | ||
Histograms of the fluorescence lifetime were analysed to obtain the full-width half-maximum (FWHM) of each measurement of a droplet at a fixed RH for a period of ∼60 seconds. The mid-point of the FWHM region was taken to be the average lifetime value, while the upper and lower bounds of the FWHM define the error bars on the y-axis. The error in n was calculated by defining upper and lower bounds of each RH reading using the known uncertainty in the RH measurements. The error in the relative permittivity was calculated using standard error propagation methodology.
A graticule (Pyser-SGI S16 stage micrometer with 1 mm/100 × 0.01 mm divisions) was imaged in brightfield to allow for the droplet size to be measured and calibrated. Images were processed with the ImageJ processing software (v1.51n).
3. Results
3.1 Dependence of inverse fluorescence lifetime on refractive index
The average fluorescence lifetime of droplets composed of sucrose/water/GFP were measured. In total three droplets were measured with each droplet analysed under multiple RH conditions, thereby resulting in 19 measurements in the RH range 17–90% and MFS range of 0.58–0.97. The relationship between inverse fluorescence lifetime and relative permittivity is found to be near linear, in the range of relative permittivity of 2.05–2.33, as shown previously by Suhling et al.,3 see Fig. 2.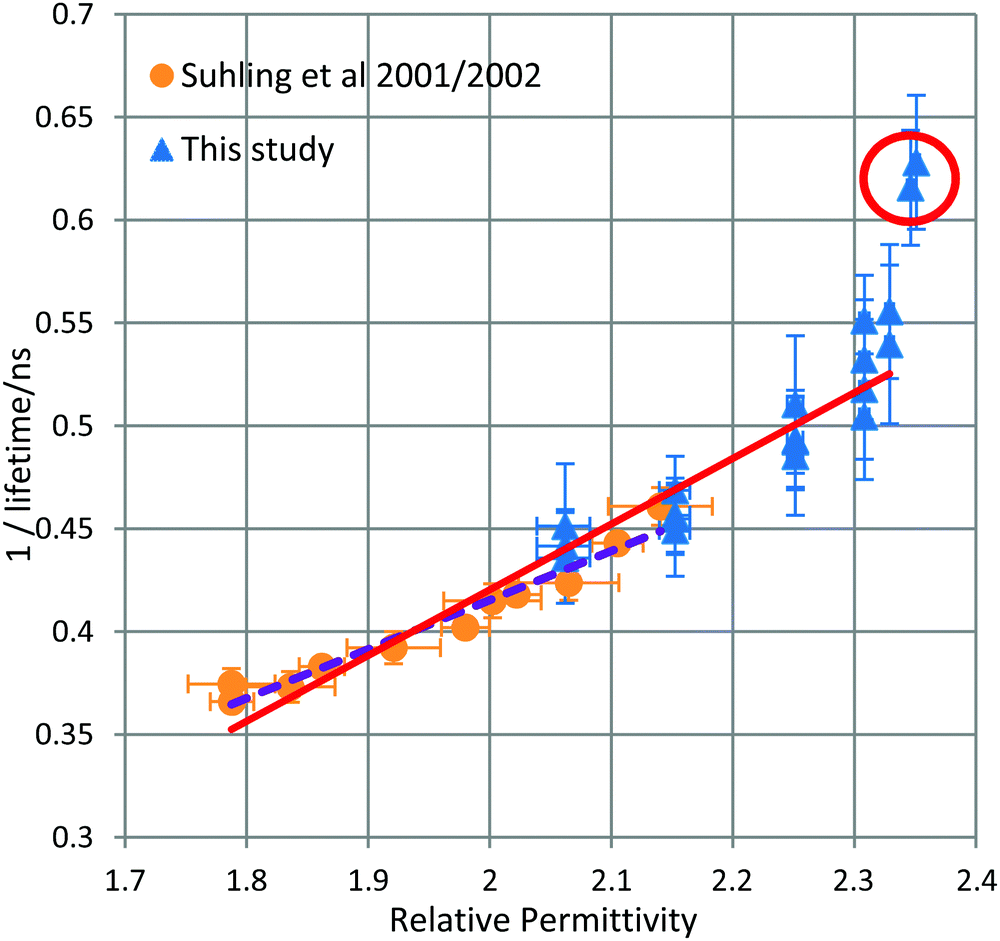 | ||
| Fig. 2 Inverse fluorescence lifetime of GFP versus relative permittivity of droplets composed of sucrose/water/GFP. Data from this study are compared alongside the results from Suhling et al. Readings collected at RH below the glass transition point identified by Tong et al. are highlighted in the red circle and are excluded from the calculation of the trendline. The red solid trendline follows both the data from this study and from the studies of Suhling et al. The purple dashed trendline follows the Suhling data alone. | ||
In the region of overlap of relative permitivities, measured both by this study and by Suhling et al., there is good agreement and all measurements agree within error. This study has extended the measurements of relative permittivity beyond 2.14 and up to 2.35 thereby increasing the measurement region beyond an n of 1.50, the highest n so far recorded within cells.14
While the Strickler & Berg formula8 predicts a linear relationship between inverse fluorescence lifetime and relative permittivity, at the highest measured relative permitivities there appears to be a deviation from linearity. Aerosolised sucrose becomes highly viscous at low RH and reaches a glass transition point to a glassy state at <24% RH.4 In cognate experiments with similar sized sucrose/water droplets, this transition, according to Tong et al.'s measurements, takes at least 20 minutes to occur.
Due to the instability of particles in the optical trap at low RH (thus high relative permittivity), readings were collected at ≤20% RH (corresponding to n2 > 2.34) as soon as the humidity reading had stabilised but while the particle was still undergoing transition. If these thermodynamically unstable readings are excluded, the remaining readings (including those collected by Suhling et al.) correlate linearly in agreement with the Strickler & Berg formula as stated in eqn (4). It is noted that the Strickler & Berg formula is an empirical relationship and more advanced theoretical treatments are available, e.g.27,28 However, for the data in this paper, Strickler & Berg was found to be sufficient.
 | (4) |
Some heterogeneity is visible in the range of fluorescence lifetime values recorded in the GFP/sucrose droplets shown in Fig. 1 (top images), although the resulting histograms illustrate that the influence over the average lifetime measurement is small. The recorded histograms show a normal distribution of lifetimes with no strong second peaks that would indicate heterogeneous regions within the droplet.
3.2 Hygroscopicity and the refractive index of GFP
The results shown in Section 3.1, along with the work of Suhling et al., establish the relationship between n and GFP fluorescence lifetime. We now show results from binary GFP/water droplets. The n of GFP/water droplets are calculated by converting the fluorescence lifetime of the droplet to refractive index using eqn (4).In total five GFP/water droplets were measured with each droplet being measured at multiple RH conditions, thereby resulting in 13 measurements in the RH range 11–91%. Fig. 3a shows the measured n of the GFP/water droplets versus RH. It is unknown whether there are any kinetic limitations for water loss with GFP/water particles under low RH conditions, as there are for sucrose/water particles, but our readings do not indicate such a limit.
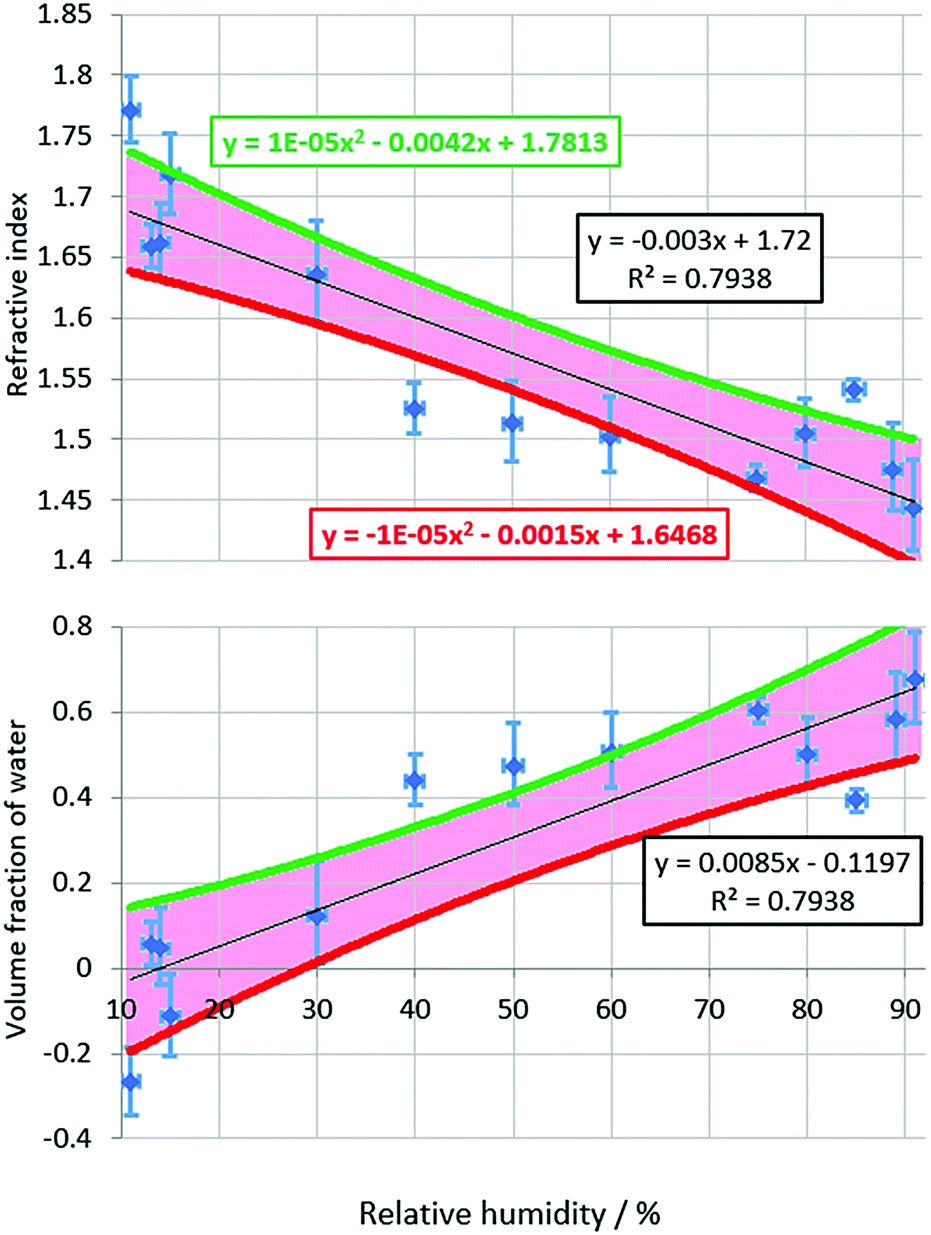 | ||
| Fig. 3 Upper panel – Measured refractive index of GFP as a function of RH. Lower panel – Derived volume fraction of water in aqueous GFP droplets as a function of RH. The green and red lines define the upper and lower 95% confidence intervals. Equations for the regression line and upper and lower confidence intervals match the colour of the corresponding line. | ||
The n of the GFP/water droplets rise with falling RH because the loss of the water solvent, which has a lower n index than GFP, causes the droplet to become more concentrated with regard to the solute. The n of pure GFP can thus be estimated by plotting the curve of n versus RH and measuring the n value where RH = 0. This value is likely to be an upper limit estimate since GFP (a 27000 Dalton protein) is anticipated to retain some associated water even under dry conditions.
The relationship of the n of GFP/water droplets appears to be approximately linear with respect to RH over the RH range investigated, with the data set having an R2 value of 0.79.
Assuming a linear relationship between n and RH, and using a short extrapolation to an RH of 0%, i.e., completely dry air; GFP in isolation is estimated to have an n of 1.72 ± 0.07. The error bars are defined by the upper and lower bounds of the confidence interval limits. It is noted, the error bars of 11 of the 13 readings overlap the 95% confidence interval of the linear fitting.
GFP droplets might be expected to follow a hygroscopic growth curve in which the uptake of water becomes more significant at higher RH, i.e., the relationship between n and RH would not be linear. This type of hygroscopic behaviour is observed for simple inorganic and organic aerosol systems, for example: Pope et al.30 but the GFP relationship appears approximately linear within the specified errors.
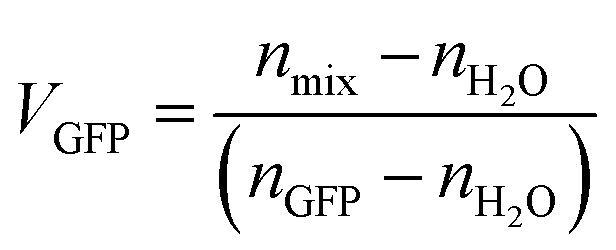
To estimate the water content of GFP particles at different RH, a simple mixing rule was employed using the volume fractions of water and GFP in the droplets, see eqn (4). Where VGFP = volume fraction of GFP at a given RH, nGFP = refractive index of GFP, VH2O = volume fraction of water at a given RH, nH2O = refractive index of water and nmix = refractive index of droplet at a given RH. Mole fraction is more often employed in mixing rules, but given the large difference in molecular weights between GFP and water (∼27000 versus 18 Daltons) volume fraction was deemed to be more representative.
| nmix = VGFP·nGFP + VH2O·nH2O. | (5) |
Since VGFP + VH2O = 1, VH2O can be expressed as 1 − VGFP and eqn (5) can be rearranged into eqn (6):
 | (6) |
This equation allows VGFP and thus VH2O to be calculated from known nH2O, nmix values taken from eqn (1) (using MFS values calculated from the directly measured RH of droplets), and nGFP obtained from the formula of the trendline in Fig. 3a. Fig. 3b gives the estimated water content of GFP as a function of RH. The equation of the line in Fig. 3b shows that from the data VH2O should be close to ze at 0% RH, as was determined experimentally.
It is noted, that two of the 13 readings collected for Fig. 3 generated average lifetime values that imply that the VH2O in the droplets is less than zero, which is physically impossible. However, these negative values provide an indication of the level of scatter in the fluorescence lifetime values collected by this technique, which is reflected in the size of the 95% confidence interval shown in the figure.
3.3 Droplet volume changes at different RH
Fig. 3b indicates that GFP/water droplets increase in volume when the RH is increased from low to high. This result is further verified by direct brightfield observations of a droplet at low and high RH, as illustrated in Fig. 4, in which the environmental RH surrounding the trapped droplet is increased from 17 to 77% RH. The change in droplet volume, predicted by eqn (6), using the calculated confidence limit is 27 ± 21%, and is measured to be approximately 14% based on area analysis of the 2D images in Fig. 4 using ImageJ software.31 Hence, within associated errors the change in volume is found to be within similar ranges regardless of measurement technique.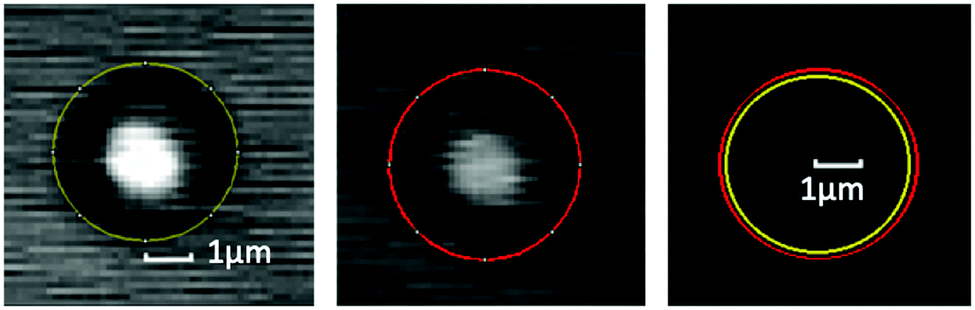 | ||
| Fig. 4 imageJ measurements of the areas of a droplet of GFP at 17% (left) and 77% RH (centre). The droplet areas were defined manually by the “elliptical brush” tool followed by software pixel counting. The areas of the droplet at the 2 RHs are contrasted in the rightmost image. | ||
Conclusions
This paper reports on a series of experiments that investigate optically levitated droplets which are part composed of GFP. Droplets contained either GFP mixed with sucrose solution or GFP in deionised water. The results demonstrate that viable fluorescence lifetime measurements can be collected from optically levitated droplets containing GFP at concentrations above ∼35 μM.The refractive indices for the droplets can be reliably calculated based on mass fraction of solute, which in turn can be calculated from the RH measured in situ. The combination of optical trap and fluorescence lifetime imaging allows droplets to be examined at a higher mass fraction of solute than is feasible in a bulk solution. Therefore, the fluorescence lifetime of GFP could be collected at high refractive indices using GFP in sucrose/water solutions.
Applying the trendline from the plot of relative permittivity vs. the inverse of the measured fluorescence lifetime allowed refractive index values to be obtained directly and thus predicted for GFP in aqueous aerosol droplets down to around 10% RH. Bulk liquid fluorimeter observations by Suhling et al. have monitored the RI of GFP at a mass fraction of up to 0.9, while this technique allowed readings to be collected at a GFP mass fraction of ∼0.985. Plotting the resulting refractive index values in a humidogram allowed the refractive index of pure GFP to be estimated at around 1.72 ± 0.07. This value is similar to values for n observed32 and predicted33 in the literature.
The hygroscopic properties of GFP were observed by measuring brightfield microscope images of aqueous GFP droplets at low and high RH, and verified by comparing the changes in droplet area with those predicted by a volume-based mixing rule. These results show that GFP has the potential to be employed as a probe compound for aerosol droplets. The FLIM/optical trap setup demonstrates that GFP aerosol solution concentrations can be modified in situ to a high degree of accuracy. The refractive index of pure GFP should be an asset to future researchers examining GFP's optical properties. For example, it could be exploited for situations using high RI media like Mowiol®, or GFP localised in non-cytoplasm parts of the cell, which have higher n.34
The experiments reported in this paper highlight a new methodology for measuring droplet properties, in particular refractive index and hygroscopicity. Further iterations on the experimental setup should focus on droplet stability and fluorescence collection to increase the measured fluorescence intensity. These modifications will allow the approach to measure a greater number of droplets over a wider range of solute concentrations with a greater spatial resolution, for example, future experiments could investigate potential edge effects upon droplet refractive index as suggested by Jones and Suhling (2006),35 and characterise other dynamically heterogeneous systems of interest. Longer term or higher concentration studies with greater fluorescence intensity will allow for more precise measurements, which will reduce the spread in the data, and hence allow further physico-chemical insights and testing of theories such as more advanced mixing rules than attempted in this paper, such as the Lorentz–Lorenz fitting model proposed by Cai et al.29
Conflicts of interest
There are no conflicts to declare.Acknowledgements
ND thanks the National Environmental Research Council for his studenship. Funding for the work was from the Science and Technology Facilities Council (STFC), Central Laser Facility, Programme Access Grant (LSF1207).Notes and references
- R. Y. Tsien, The Green Fluorescent Protein, Annu. Rev. Biochem., 1998, 67, 509–544 CrossRef CAS PubMed.
- M. Chalfie, Y. Tu, G. Euskirchen, W. W. Ward and D. C. Prasher, Green fluorescent protein as a marker for gene expression, Science, 1994, 263(5148), 802–805 CrossRef CAS PubMed.
- K. Suhling, D. M. Davis, Z. Petrasek, J. Siegel and D. Phillips, Influence of the refractive index on EGFP fluorescence lifetimes in mixtures of water and glycerol, SPIE Proceedings, Biomarkers and Biological Spectral Imaging, San Jose, CA, 2001, vol. 4259 Search PubMed.
- L. H. Garcia-Rubio, Refractive Index Effects on the Absorption Spectra of Macromolecules, Macromolecules, 1992, 25, 2608–2613 CrossRef CAS.
- K. Suhling, J. Siegel, D. Phillips, P. M. W. French, S. Lévêque-Fort and S. E. D. Webb, et al., Imaging the Environment of Green Fluorescent Protein, Biophys. J., 2002, 83(6), 3589–3595 CrossRef CAS.
- K. Suhling, D. M. Davis and D. Phillips, The Influence of Solvent Viscosity on the Fluorescence Decay and Time-Resolved Anisotropy of Green Fluorescent Protein, J. Fluoresc., 2002, 12(1), 91–95 CrossRef CAS.
- C. Tregidgo, J. A. Levitt and K. Suhling, Effect of refractive index on the fluorescence lifetime of green fluorescent protein, J. Biomed. Opt., 2008, 13(3), 031218 CrossRef PubMed.
- S. J. Strickler and R. A. Berg, relationship between absorption intensity and fluorecence lifetime of molecules, J. Chem. Phys., 1962, 37(4), 814–820 CrossRef CAS.
- D. Toptygin, Effects of the Solvent Refractive Index and Its Dispersion on the Radiative Decay Rate and Extinction Coefficient of a Fluorescent Solute, J. Fluoresc., 2003, 13(3), 201–219 CrossRef CAS.
- J. Y. Lee, C. Y. Kao, Y. J. Chen, T. Y. Wu and I. J. Hsu, Optical properties of green fluorescent proteins and their applications on virus infection, SPIE, Molecular Imaging, Munich, Germany, 2007 Search PubMed.
- H. J. Van Manen, P. Verkuijlen, P. Wittendorp, V. Subramaniam, T. K. van den Berg and D. Roos, et al., Refractive index sensing of green fluorescent proteins in living cells using fluorescence lifetime imaging microscopy, Biophys. J., 2008, 94(8), L67–L69 CrossRef CAS PubMed.
- J. Zou, Y. Ye, K. Welshhans, M. Lurtz, A. L. Ellis and C. Louis, et al., Expression and optical properties of green fluorescent protein expressed in different cellular environments, J. Biotechnol., 2005, 119(4), 368–378 CrossRef CAS PubMed.
- J. W. Borst, M. A. Hink, A. van Hoek and A. J. Visser, Effects of refractive index and viscosity on fluorescence and anisotropy decays of enhanced cyan and yellow fluorescent proteins, J. Fluoresc., 2005, 15(2), 153–160 CrossRef CAS PubMed.
- N. A. Hosny, C. Fitzgerald, C. Tong, M. Kalberer, M. K. Kuimova and F. D. Pope, Fluorescent Lifetime Imaging of Atmospheric Aerosols: A Direct Probe of Aerosol Viscosity, Faraday Discuss., 2013, 165, 343–356 RSC.
- Q. Zhang, L. Zhong, P. Tang, Y. Yuan, S. Liu and J. Tian, et al., Quantitative refractive index distribution of single cell by combining phase-shifting interferometry and AFM imaging, Nature, 2017, 7, 2532 Search PubMed.
- M. A. Uskova, J. Borst, M. A. Hink, A. van Hoek, A. Schots, A. L. Klyachko and A. J. W. G. Visser, Fluorescence dynamics of green fluorescent protein in AOT reversed micelles, Biophys. Chem., 2000, 87, 73–84 CrossRef CAS PubMed.
- A. Pliss, L. L. Zhao, T. Y. Ohulchanskyy, J. L. Qu and P. N. Prasad, Fluorescence lifetime of fluorescent proteins as an intracellular environment probe sensing the cell cycle progression, ACS Chem. Biol., 2012, 7, 1385–1392 CrossRef CAS PubMed.
- T. Athanasiadis, C. Fitzgerald, N. M. Davidson, C. Glorio, S. W. Botchway and A. D. Ward, et al., Dynamic viscosity mapping of the oxidation of squalene aerosol particles, Phys. Chem. Chem. Phys., 2016, 18(44), 30385–30393 RSC.
- L. Rkiouak, M. J. Tang, J. C. J. Camp, J. McGregor, J. M. Watson and R. A. Cox, et al., Optical Trapping and Raman Spectroscopy of Solid Particles, Phys. Chem. Chem. Phys., 2014, 11426–11434 RSC.
- H.-J. Tong, J. P. Reid, D. L. Bones, B. P. Luo and U. K. Krieger, Measurements of the timescales for the mass transfer of water in glassy aerosol at low relative humidity and ambient temperature, Atmos. Chem. Phys., 2011, 11, 4739–4754 CrossRef CAS.
- L. Joosen, M. A. Hink, T. W. J. Gadella and J. Goedhart, Effect of fixation procedures on the fluorescence lifetimes of Aequorea victoria derived fluorescent proteins, J. Microsc., 2014, 256, 166–176 CrossRef CAS PubMed.
- IPCC. Climate Change 2007: The Physical Science Basis. Contribution of Working Group I to the Fourth Assessment Report of the Intergovernmental Panel on Climate Change. Cambridge, UK & New York, USA; 2007.
- Y. J. Ma, P. Rajendran, C. Blum, Y. Cesa, N. Gartmann, D. Bruhwiler and V. Subramaniam, Microspectroscopic analysis of green fluorescent proteins infiltrated into mesoporous silica nanochannels, J. Colloid Interface Sci., 2011, 356, 123–130 CrossRef CAS PubMed.
- B. Zobrist, V. Soonsin, B. P. Luo, U. K. Krieger, C. Marcolli and T. Peter, et al., Ultra-slow water diffusion in aqueous sucrose glasses, Phys. Chem. Chem. Phys., 2011, 13, 3514–3526 RSC.
- A. G. Sensirion Digital Humidity Sensor SHT7x (RH/T). [Online].; 2017 cited 2017 08 09. Available from: https://www.sensirion.com/en/environmental-sensors/humidity-sensors/pintype-digital-humidity-sensors/.
- C. Fitzgerald, N. A. Hosny, H.-J. Tong, P. C. Seville, P. J. Gallimore and N. M. Davidson, et al., Fluorescence lifetime imaging of optically levitated aerosol: A technique to quantitatively map the viscosity of suspended aerosol particles, Phys. Chem. Chem. Phys., 2016, 18(31), 21710–21719 RSC.
- P.-H. Chung, C. Tregidgo and K. Suhling, Determining a fluorophore's transition dipole moment from fluorescence lifetime measurements in solvents of varying refractive index, Methods Appl. Fluores, 2016, 4, 045001 CrossRef PubMed.
- C. Cai, R. E. H. Miles, M. I. Cotterell, A. Marsh, G. Rovelli, A. M. J. Rickards, Y.-h. Zhang and J. P. Reid, Comparison of Methods for Predicting the Compositional Dependence of the Density and Refractive Index of Organic-Aqueous Aerosols, J. Phys. Chem. A, 2016, 120(33), 6604–6617 CrossRef CAS PubMed.
- M. Shiraiwa, M. Ammann, T. Koop and U. Pöschl, Gas uptake and chemical aging of semisolid organic aerosol particles, Proc. Natl. Acad. Sci. U. S. A., 2011, 108(27), 11003–11008 CrossRef CAS PubMed.
- F. D. Pope, B. J. Dennis-Smither, P. T. Griffiths, S. L. Clegg and R. A. Cox, Studies of single aerosol particles containing malonic acid, glutaric acid, and their mixtures with sodium chloride. I. Hygroscopic growth. The, J. Phys. Chem. A, 2010, 114(16), 5335–5341 CrossRef CAS PubMed.
- ImageJ Particle Analysis [Online].; 2017 [cited 2019 10 27]. Available from: https://imagej.net/Particle_Analysis.
- T. L. McMeekin, M. Wilensky and M. L. Groves, Refractive indices of proteins in relation to amino acid composition and specific volume, Biochem. Biophys. Res. Commun., 1962, 7, 151–156 CrossRef CAS.
- H. Zhao, P. H. Brown and P. Schuck, On the distribution of protein refractive index increments, Biophys. J., 2011, 100, 2309–2317 CrossRef CAS PubMed.
- R. H. Valdivia, A. E. Hromockyi, D. Monack, L. Ramakrishnan and S. Falkow, Applications for green fluorescent protein (GFP) in the study of host-pathogen interactions, Gene, 1996, 173(1), 47–52 CrossRef CAS PubMed.
- C. Jones and K. Suhling, Refractive index sensing using Fluorescence Lifetime Imaging (FLIM). Proceedings of the Second International Conference on Optical and Laser Diagnostics, J. Phys.: Conf. Ser., 2006, 45(1), 223 CrossRef CAS.
| This journal is © the Owner Societies 2020 |