
 Open Access Article
 This Open Access Article is licensed under a Creative Commons Attribution-Non Commercial 3.0 Unported Licence
Local anisotropy in single crystals of zeotypes with the MFI framework structure evidenced by polarised Raman spectroscopy†
Anna
Martinelli
 *a,
Simone
Creci
ab,
Szilvia
Vavra
a,
Per-Anders
Carlsson
ab and
Magnus
Skoglundh
ab
*a,
Simone
Creci
ab,
Szilvia
Vavra
a,
Per-Anders
Carlsson
ab and
Magnus
Skoglundh
ab
aDepartment of Chemistry and Chemical Engineering, Chalmers University of Technology, SE-412 96 Gothenburg, Sweden. E-mail: anna.martinelli@chalmers.se
bCompetence Centre for Catalysis, Chalmers University of Technology, SE-412 96 Gothenburg, Sweden
First published on 16th December 2019
Abstract
Polarised Raman spectroscopy is used to characterise the local structure in single crystals of zeotypes, namely silicalite-1 and ZSM-5, which share the MFI framework structure. Attributes favourable for applying polarised Raman spectroscopy are the orthogonal axes of these single crystals and their size, i.e. 10 to 30 micrometers in all three directions. We show that the intensity of certain vibrational modes in silicalite-1 depends on the polarisation of the incident light, reflecting the anisotropic character of the molecular bonds contributing to these vibrations. Using these observations, and by estimating the depolarisation ratio (ρ) and the pseudo-order factor (f), we propose a more accurate assignment of the Raman active modes. More precisely, Raman intensities peaked at 294, 360, 383 and 472 cm−1 are attributed to bending modes in 10-, 6-, 5- and 4-membered rings, respectively. In the region of stretching modes, the vibration at 832 cm−1 is assigned to Si–O–Si bonds shared between 5-membered rings, which have an orientation parallel to the a-axis of the crystal. By virtue of having a strongly polarised character, the modes at 472 and 832 cm−1 can be used as orientational indicators. The proposed assignment is supported by the good agreement between experimental and simulated polar plots, where Raman intensities are plotted as a function of the polarisation angle of the incident light. Finally, upon partial substitution of Si atoms by Al, the crystalline structure is maintained and almost no spectroscopic changes are observed. The only significant difference is the increased width of most vibrational modes, which is consistent with the local lower symmetry. This is also seen in the angular dependence of selected vibrational modes that compared to the case of pure silicalite-1 appear less polarised. In the Raman spectrum of ZSM-5 a new feature at 974 cm−1 is observed, which we attribute to Al–OH stretching. In the high frequency range, the O–H stretching modes are observed which arise from the Si–O(H)–Al Brønsted acid sites. The intensity of the characteristic mode at 3611 cm−1 reveals an anisotropic character as well, which is in line with previous findings from solid state NMR that Al atoms distribute nonrandomly within the MFI framework structure.
1 Introduction
Zeolites are materials of major scientific and technological importance. They have a huge commercial value and are used in a wide range of fields such as adsorption processes, ion exchange, gas separation, and catalysis. The chemical structure of zeolites includes Si, Al, and O atoms, ordered in different ways depending on the adopted crystalline structure, while counter-ions, typically H+ or NH4+, balance the net negative charges caused by the presence of aluminium atoms in the framework structure. In addition, zeolites are microporous materials with high surface area and high degree of crystallinity, with characteristic crystal structures that by convention are described by a 3-letter code (e.g. MFI, CHA, etc.). If Al is not present in the structure, or if this is substituted for another element, the material is referred to as a zeotype.The hierarchical and crystalline structure of zeolites has been studied by high resolution methods like TEM and XRD,1–3 while the challenging question related to the position and distribution of Al atoms in the framework structure has been addressed by NMR and DFT methods.4–6 High-quality TEM images of zeolites require advanced sample preparation, while both XRD and solid state NMR methods are applied to samples in powder form whereby the local orientation characteristic of single crystals cannot be probed. Infrared spectroscopy is an established method for quantitative studies of chemical reactions occurring inside the pores of zeolites, but vibrational spectroscopy in general (including Raman spectroscopy, infrared spectroscopy and inelastic neutron scattering) has been sparingly used to characterise the framework structure in zeolites.7–16 Infrared spectroscopy does not provide sufficiently high spectral resolution to clearly distinguish different zeolite structures through their characteristic vibrational modes,9,11 while the use of Raman spectroscopy has been limited due to problems of luminescence (in particular in zeolites containing Fe atoms), a low scattering cross section, and many times minor spectroscopic changes upon atomic substitution (e.g. Si → Al).7–9,13 Inelastic neutron scattering has the disadvantage of difficult access to neutron facilities. As a result of these aspects, infrared spectroscopy has been used about ten times more than Raman spectroscopy, and hundred times more than neutron scattering.17 To compensate for these experimental limitations, complementary theoretical calculations have been performed with the aim to elucidate distinct spectral features arising from specific and isolated structural sub-units (such as double 4-membered rings or double 6-membered rings, etc.).10,12,14,15,18 Group theory has also been invoked to break down the complexity in vibrational spectra of zeolites, which although representing an important contribution also showed that many zeolites of technological and scientific importance are in fact poor candidates for full-lattice dynamics analysis due to the large number of atoms in the Bravais unit cell, and the low space group and site group symmetry.7 Maroni anticipated already in 19887,19 the potential usefulness of polarised Raman spectroscopy on single crystals of zeolites for an otherwise impossible peak assignment. Since then this method has been used to study zeolites, albeit mainly for the detection and orientation of molecular species hosted inside the pores20,21,23,24 but less frequently with the specific aim to assign intrinsic vibrational modes using single crystals.20,22 In a broader context, and based on its sensitivity to crystals’ anisotropy, polarised Raman spectroscopy has been used in structural studies of biological systems,25 in several studies of stretched polymer fibres,26,27 to define the orientation of molecular species hosted in micro- and nano-pores,28 and to assign vibrational modes in crystalline materials.18,29–32,34
In the present work, we demonstrate that polarised Raman spectroscopy is sensitive also to the anisotropies of single crystals of zeolites and that, as a consequence, distinction between vibrational modes can be made based on the orientation of certain chemical bonds. More precisely we apply polarised Raman spectroscopy to single crystals of silicalite-1 and ZSM-5 that both share the MFI framework structure, see Fig. 1. Despite the complex multiple-ring structure, the MFI framework has crystal axes orthogonal to each other and hence parallel to the laboratory coordinate system, which facilitates the interpretation of the collected Raman spectra. Polarised and angular dependent Raman intensities are presented and discussed, and used to make an assignment of the observed vibrational modes more precise than is available today. The study of Al-free, i.e. purely siliceous, crystals is intentionally included to evidence the correlation between framework structure and vibrational modes, and show that the majority of frequencies and intensities are maintained upon substitution of Si with Al atoms. With this insight we provide pivotal clarifications on the origin of vibrational modes in zeolites of the MFI structure, which have some times been erroneously assigned. For example, vibrational modes in the Raman spectrum at 438, 745, 814 and 832 cm−1 have been assigned to Si–O–Al stretching and O–Si–O(Al) bending modes33 although these, as shown in this work, are observed at exactly the same frequencies and intensities in the Al-free structure. This paper is intended to be a source of inspiration for further theoretical and experimental studies, but also to promote a new useful method to identify the site of metal atoms substituting for Si, a crucial aspect in catalytic materials.
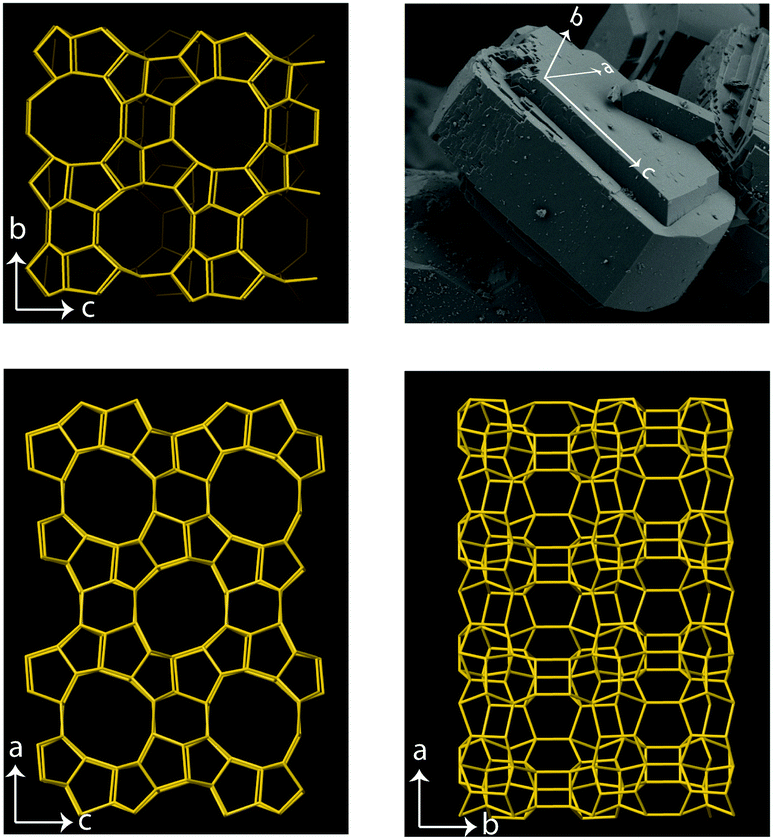 | ||
| Fig. 1 Top-right: SEM image showing the characteristic shape of a single zeolite crystal with the MFI framework structure, the crystal axes are also illustrated. The length of this crystal along the c-axis is about 35 μm. The local order of a zeotype with the MFI framework structure is given for the b–c plane (top-left), the a–c plane (bottom-left), and the a–b plane (bottom-right) to reveal the complex combination of 4-, 5-, 6- and 10-membered rings that build up the crystal. The large pores (i.e. the 10-membered rings) are aligned along the b-direction whereas they are oriented zig-zag along the a-direction. | ||
2 Experimental section
2.1 Synthesis and characterisation
Samples of silicalite-1 and ZSM-5 with the MFI type of framework structure were prepared according to the method proposed by Szotak et al.35 The chemicals used for the synthesis were the following: tetraethyl orthosilicate (TEOS, reagent grade, 98%, Sigma Aldrich) as silicon source, sodium aluminate (Technical, anhydrous, Sigma Aldrich) as aluminum source and tetrapropylammonium hydroxide (TPAOH, 1.0 M Lsg. in water, Sigma-Aldrich) as structure directing agent (SDA). Oxalic acid (98%, Sigma-Aldrich) and sodium hydroxide (pellets, 98%, Alfa Aesar) were used to adjust the pH value. The molar ratio Si![[thin space (1/6-em)]](https://www.rsc.org/images/entities/char_2009.gif) :TPA+:H2O = 1.00:0.30:24.86 was kept constant in both syntheses. For the ZSM-5 samples, TEOS was first hydrolysed for 24 h at 60 °C in water and oxalic acid (pH 2). The Al precursor was dissolved in water for 5 h (for the ZSM-5 sample, two solutions were prepared) and added to the TEOS containing solution. The solution was kept at pH 2 in order to prevent precipitation of metal hydroxide species. After 4 h of stirring, a 20 wt% solution of TPAOH was added dropwise under vigorous stirring and then the pH was adjusted with a 1 M NaOH solution to the basic conditions necessary to promote crystallisation (pH 11). The gel was heated in an unstirred autoclave (0.2 L, Parr Instrument Company) for 5 days at 170 °C. The obtained powder was washed, filtered and instantaneously frozen with liquid nitrogen and freeze-dried overnight. In order to remove the SDA and to obtain the Na+-form of the zeolite, the as synthesised sample was calcined at 500 °C for 5 h in air (5 °C min−1). The Na+-zeolite sample was then ion-exchanged twice at 60 °C for 24 h with ammonium nitrate (EMPLURA, Sigma-Aldrich), followed by washing, filtration and freeze-drying overnight. The H+-form of the zeolite was obtained by calcination at 500 °C for 1 h in air (10 °C min−1). The ZSM-5 samples was prepared with a Si:Al molar ratio (SAR) equal to 50. For the silicalite-1 samples, the same procedure as for ZSM-5 was followed, but no Al precursor was used and the ammonium exchange and the second calcination were not performed.
:TPA+:H2O = 1.00:0.30:24.86 was kept constant in both syntheses. For the ZSM-5 samples, TEOS was first hydrolysed for 24 h at 60 °C in water and oxalic acid (pH 2). The Al precursor was dissolved in water for 5 h (for the ZSM-5 sample, two solutions were prepared) and added to the TEOS containing solution. The solution was kept at pH 2 in order to prevent precipitation of metal hydroxide species. After 4 h of stirring, a 20 wt% solution of TPAOH was added dropwise under vigorous stirring and then the pH was adjusted with a 1 M NaOH solution to the basic conditions necessary to promote crystallisation (pH 11). The gel was heated in an unstirred autoclave (0.2 L, Parr Instrument Company) for 5 days at 170 °C. The obtained powder was washed, filtered and instantaneously frozen with liquid nitrogen and freeze-dried overnight. In order to remove the SDA and to obtain the Na+-form of the zeolite, the as synthesised sample was calcined at 500 °C for 5 h in air (5 °C min−1). The Na+-zeolite sample was then ion-exchanged twice at 60 °C for 24 h with ammonium nitrate (EMPLURA, Sigma-Aldrich), followed by washing, filtration and freeze-drying overnight. The H+-form of the zeolite was obtained by calcination at 500 °C for 1 h in air (10 °C min−1). The ZSM-5 samples was prepared with a Si:Al molar ratio (SAR) equal to 50. For the silicalite-1 samples, the same procedure as for ZSM-5 was followed, but no Al precursor was used and the ammonium exchange and the second calcination were not performed.
The morphology on the micrometer scale of the calcined crystals of silicalite-1 and ZSM-5 was investigated by scanning electron microscopy (SEM), using a Zeiss Ultra 55 FEG instrument. The acceleration voltage was set to 1.5 kV and the samples were imaged without any coating. The X-ray diffractograms of the calcined samples of silicalite-1 and ZSM-5 were recorded with a Bruker XRD D8 advanced instrument with monochromatic Cu Kα radiation, scanning from 5° to 55° with a step size of 0.029° and a dwell time of 1 s. In the case of silicalite-1, the diffractogram shows the characteristic peaks congruent with the MFI framework structure already reported for crystals prepared as in this work36 and a high degree of crystallinity, Fig. 2a. The corresponding SEM image shows distinct single crystals, homogeneous in size and shape, that have an average length of about 20 micrometers along the c-axis and of 12 micrometers along the a-axis. The height of the crystals along the b-axis is on average 10 micrometers. The XRD pattern recorded from samples of ZSM-5 is equivalent to that of silicalite-1, confirming the common MFI framework structure, Fig. 2b. The morphology of ZSM-5 single crystals is also the same, although the crystals are on average larger in size. An important note is that for both pure silicalite-1 and ZSM-5 no morphological changes are observed between before and after calcination.
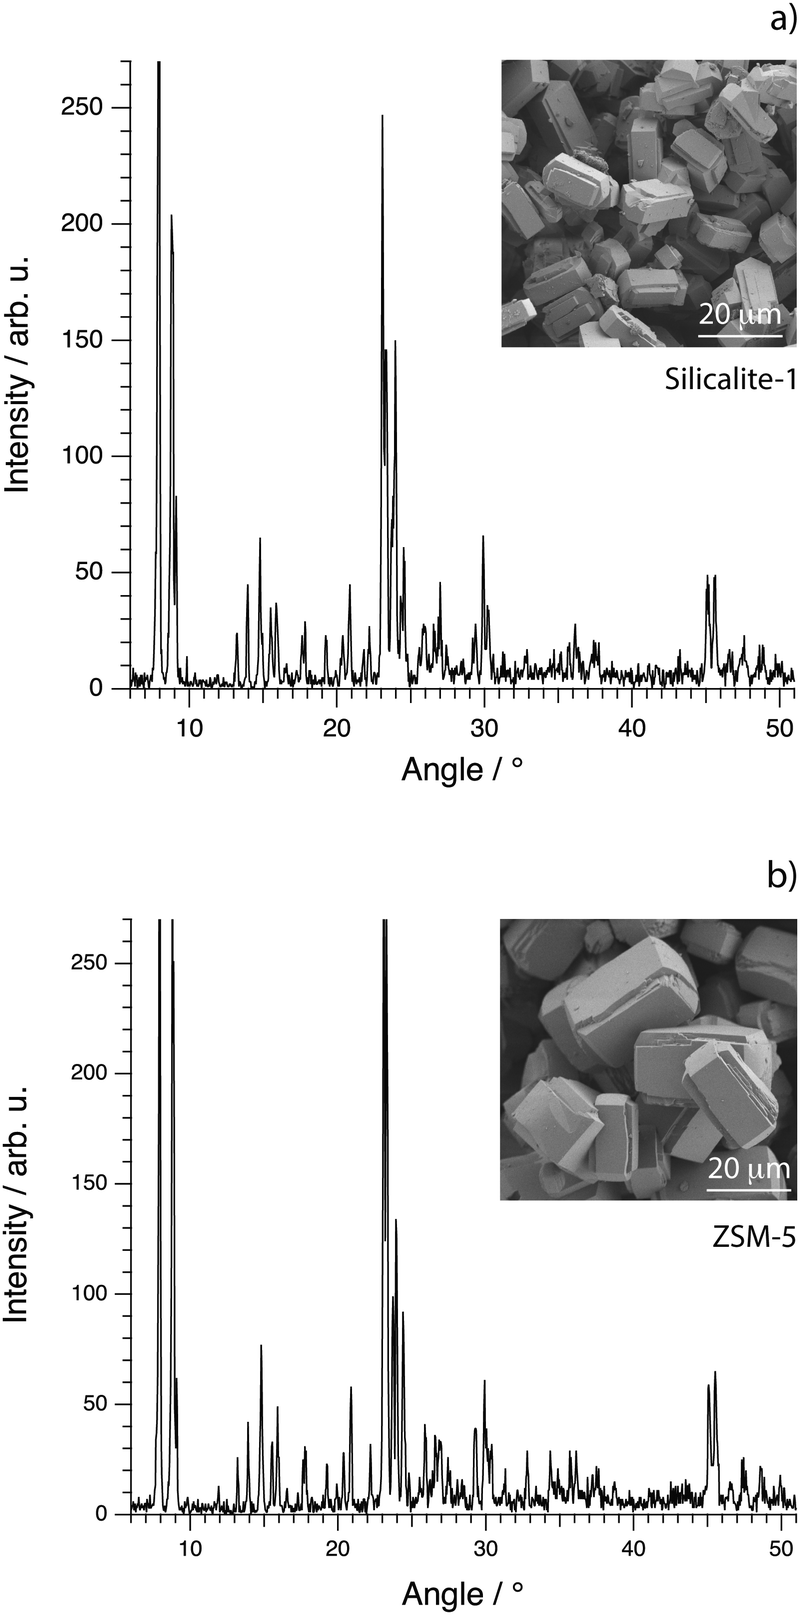 | ||
| Fig. 2 X-ray diffractograms (main figures) and SEM images (insets) for the synthesised crystals of silicalite-1 (a) and ZSM-5 (b). | ||
2.2 Polarised Raman spectroscopy
Raman spectra were recorded with an InVia Reflex spectrometer purchased from Renishaw. A high power near-infrared diode laser with a maximum output power of 300 mW and a wavelength of 785 nm was used as the excitation source. This, together with a grating with 1200 lines per mm allowed achieving a spectral resolution of about 1 cm−1. A motorised polarisation kit along with an analyser that is possible to set in the vertical or horizontal mode were coupled and used to collect polarisation sensitive Raman spectra. In this work, and due to the technical specifications of the spectrometer used, normally polarised light corresponds to polarisation along the x-axis of the laboratory coordinates, while orthogonally polarised light corresponds to polarisation along the y-axis. This, and other configurational details are illustrated in Fig. 3. In order to collect Raman spectra at variable polarisation angles, the polarisation of the incident light, rather than the single crystal, was rotated. This deliberate choice is crucial to ensure that the same volume of material is illuminated (and hence investigated) and to avoid intensity changes due to misalignment or local density fluctuations. All spectra were collected in the backscattering mode (180°) with the direction of the incident and scattered light being parallel to the z-axis. A Leica objective with numerical aperture (NA) 0.50 and magnification 50× was used to focus the incident light on selected spots over the single crystal's upper surface, enabling confocal spots of approximately 1 × 1 μm on the x–y plane (this has been estimated using the relation d = 1.22·λ/NA, where d is the diameter of the focal spot, λ is the wavelength of the incident laser, and NA is the numerical aperture of the objective). Out of a number of single crystals randomly spread out over a foil of aluminium, those with the right orientation with respect to the laboratory axes were searched for using a low magnification objective and selected for further investigation. Crystal twins grown into each other or a crystal laying over another should not be selected. Spectra were then recorded collecting over 60 seconds and 3 accumulations to obtain a high signal-to-noise ratio for reliable analyses of Raman intensities. In this paper, and if not stated otherwise, with Raman intensity we intend the integrated area under a peak. Moreover, when peak fitting is applied a linear background and Lorentzian functions are used to fit the experimentally recorded spectra.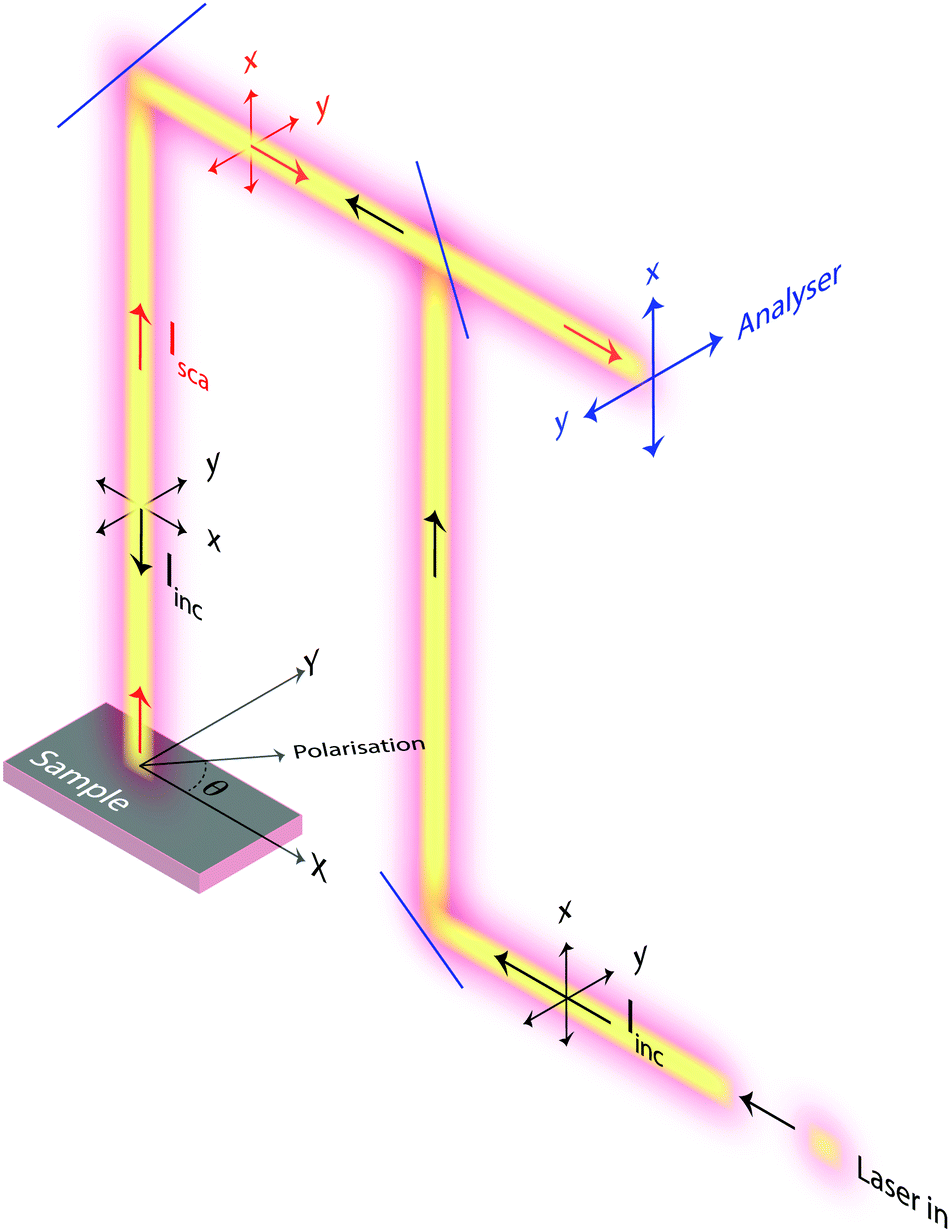 | ||
Fig. 3 Schematic of the experimental set up used in this study, showing the paths of the incident light (Iinc, black arrows) and of the back scattered light (Isca, red arrows). For both, the direction of the two possible polarisations are indicated. At the sample point, the direction of propagation for Iinc and Isca is along the ![[z with combining right harpoon above (vector)]](https://www.rsc.org/images/entities/i_char_007a_20d1.gif) axis, while the polarisation of light is along directions parallel to the x–y plane which can also be described by θ. Before the detector, an analyser can be placed to select either vertically (parallel to x) or orthogonally (parallel to y) polarised back scattered light. axis, while the polarisation of light is along directions parallel to the x–y plane which can also be described by θ. Before the detector, an analyser can be placed to select either vertically (parallel to x) or orthogonally (parallel to y) polarised back scattered light. | ||
3 Theoretical aspects
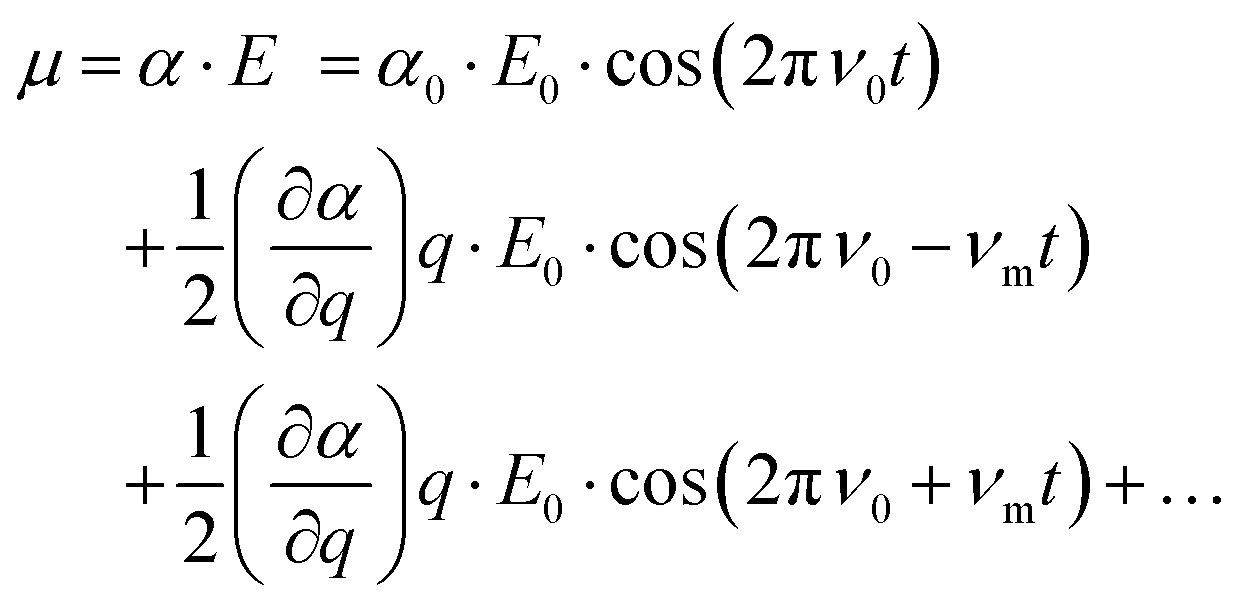
The basic principles of Raman scattering are thoroughly described in established text books and review articles. Here, however, we recall some aspects that are crucial for the purpose of this specific work, in particular the angle dependence of Raman intensities.Frequency dependent Raman intensities can be recorded due to an interaction between the incident light (typically in the visible range) and matter, which induces a dipole moment (μ) in the molecule or group of molecules investigated. This oscillating dipole moment emits light with a frequency that is modulated by that of the incoming light and an energy that is equal, higher or lower than that of the incident light. The relevant relation for a certain molecular vibration is thus:
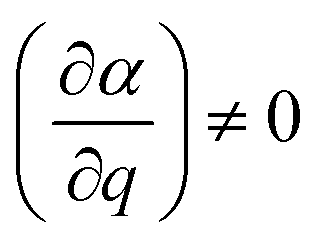 at equilibrium position, which means that the molecular polarisability of the vibrational mode should be neither maximum nor minimum at q = 0. With the spectrometer used in this work only light scattered with a lower energy than the incident light is detected, that is only the Stokes Raman events are measured. In general, the recorded Raman intensity is proportional to the square of the induced dipole moment but is also dependent on the power of the incoming light and the number of scatterers present within the focal volume of the incident laser. Moreover, when using polarised Raman spectroscopy it is crucial to realise that the induced dipole moment
 ![[small mu, Greek, vector]](https://www.rsc.org/images/entities/i_char_e0e9.gif) is a vector with components in all directions (x, y, and z) that depend on the electric field
is a vector with components in all directions (x, y, and z) that depend on the electric field ![[E with combining right harpoon above (vector)]](https://www.rsc.org/images/entities/i_char_0045_20d1.gif) through the polarisability Raman tensor. Further, the vector has components parallel and orthogonal to .
through the polarisability Raman tensor. Further, the vector has components parallel and orthogonal to .
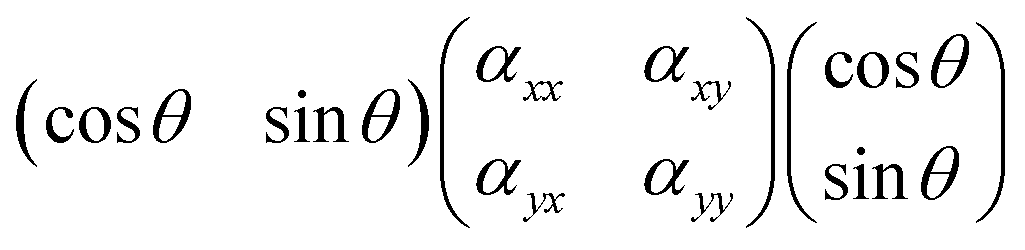
For the sake of simplicity, we consider the case of an incident light propagating along the z-direction and thus being polarisable at directions parallel to the x–y plane, as shown in Fig. 3. From a sample at a fixed position, Raman spectra can be recorded by setting different experimental configurations, for example with the incident light linearly polarised along the x-axis, along the y-axis or by varying the direction of polarisation around the angle θ. Further, by placing an analyser between the sample and the detector, scattered light with a polarisation parallel either to the x-axis or the y-axis can be selected to reach the detector. Without an analyser, scattered light with polarisation in all directions will be recorded. Mathematically, the Raman intensity will be proportional to |![[e with combining right harpoon above (vector)]](https://www.rsc.org/images/entities/i_char_0065_20d1.gif) inc·R·sca|2, where inc is the unit vector describing the direction of the incident light, sca is the unit vector describing the direction of the scattered light, and R is the Raman polarisability tensor. In the specific case where sca is parallel to inc we can express the product inc·R·sca as:
inc·R·sca|2, where inc is the unit vector describing the direction of the incident light, sca is the unit vector describing the direction of the scattered light, and R is the Raman polarisability tensor. In the specific case where sca is parallel to inc we can express the product inc·R·sca as:
and then further to
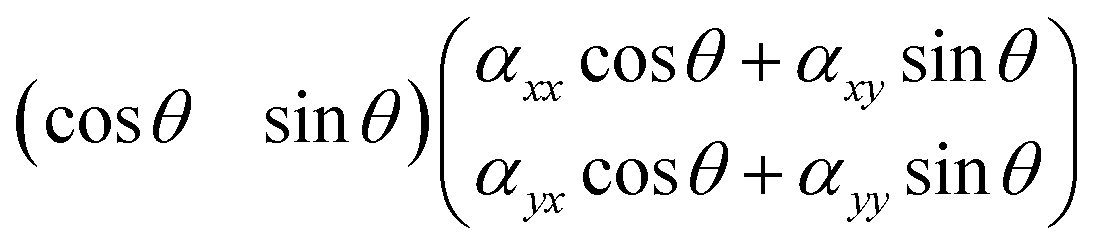
| (αxxcos2θ + αxycosθsinθ + αyxcosθsinθ + αyysin2θ) |
cos2θ + αxysin2θ + αyysin2θ. From this it follows that the Raman intensity measured for a symmetric vibration at parallel polarisation (i.e. when sca is parallel to inc) is expected to be:| Iss‖ ∝ (αxxcos2θ + αyysin2θ)2 | (1) |
| Ias‖ ∝ (αxysin2θ)2 | (2) |
sca and inc are orthogonal to each other, the following product should be considered instead:which has the solution (αyy − αxx)cos
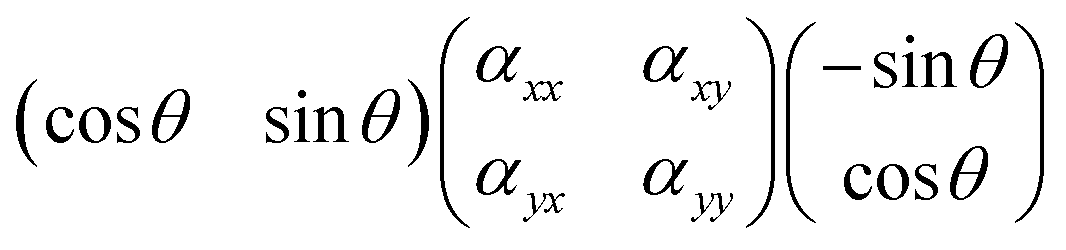 θsinθ + αxy(cos2θ − sin2θ). As a consequence, the Raman intensity measured for a symmetric vibration at cross polarised conditions is:
| Iss⊥ ∝ (αyy − αxx)2cos2θsin2θ | (3) |
| Ias⊥ ∝ (αxy)2(cos2θ − sin2θ)2 | (4) |
inc and inc can be described as the vector (1, 0) and the recorded Raman intensity will be proportional to |αxx|2. This is equivalent to performing an experiment at parallel polarisations, and according to the Porto notation this experiment is described by the z(xx)![[z with combining macron]](https://www.rsc.org/images/entities/i_char_007a_0304.gif) configuration. Similarly, if the incident light is polarized along the y-axis and only scattered light with a polarisation along the y-axis is detected, inc and sca can be described as the (0, 1) vector and the Raman intensity will be proportional to |αyy|2. According to the Porto notation, this experiment is defined to have the z(yy) configuration. If incident and scattered light are cross polarised, for example if inc is (1, 0) and sca is (0, 1), the solution of the inc·R·sca product will be αxy, the recorded Raman intensity will be proportional to |αxy|2, and the experiment is defined by the z(xy) notation. The cases discussed represent well the role of the tensor's coefficients, since by their relative magnitude they determine at which angle intensity maxima are detected. In fact, diagonal values contribute to intensities recorded at parallel polarisations, while off-diagonal coefficients contribute to intensities recorded in cross polarised measurements. In this context, it is also worth mentioning that each vibrational mode is characterised by a unique Raman tensor. To summarise, a selection of different possible experimental configurations together with the associated Porto notation are given in Table 1. In Fig. 4, the simulated contributions from purely symmetric (ss) or anti-symmetric (as) vibrations when using a polarisation parallel (‖) or orthogonal (⊥) to the incident light are illustrated for fictitious values of αxx, αyy, αxy and αyx to clarify on their typical angular dependence.
inc) and scattered (sca) light, the measured Raman intensity (Iij), the commonly used Porto notation, and the proportionality of the Raman intensity (IR) to the coefficients of the Raman tensor (αij)
configuration. Similarly, if the incident light is polarized along the y-axis and only scattered light with a polarisation along the y-axis is detected, inc and sca can be described as the (0, 1) vector and the Raman intensity will be proportional to |αyy|2. According to the Porto notation, this experiment is defined to have the z(yy) configuration. If incident and scattered light are cross polarised, for example if inc is (1, 0) and sca is (0, 1), the solution of the inc·R·sca product will be αxy, the recorded Raman intensity will be proportional to |αxy|2, and the experiment is defined by the z(xy) notation. The cases discussed represent well the role of the tensor's coefficients, since by their relative magnitude they determine at which angle intensity maxima are detected. In fact, diagonal values contribute to intensities recorded at parallel polarisations, while off-diagonal coefficients contribute to intensities recorded in cross polarised measurements. In this context, it is also worth mentioning that each vibrational mode is characterised by a unique Raman tensor. To summarise, a selection of different possible experimental configurations together with the associated Porto notation are given in Table 1. In Fig. 4, the simulated contributions from purely symmetric (ss) or anti-symmetric (as) vibrations when using a polarisation parallel (‖) or orthogonal (⊥) to the incident light are illustrated for fictitious values of αxx, αyy, αxy and αyx to clarify on their typical angular dependence.
inc) and scattered (sca) light, the measured Raman intensity (Iij), the commonly used Porto notation, and the proportionality of the Raman intensity (IR) to the coefficients of the Raman tensor (αij)
| Polarisation of inc |
Polarisation of sca |
Measured intensity | Porto notation | I R proportional to |
|---|---|---|---|---|
| ‖x or (1, 0) | ‖x or (1, 0) | I xx |
z(xx) |
|αxx|2 |
| ‖x or (1, 0) | ‖y or (0, 1) | I xy |
z(xy) |
|αxy|2 |
| ‖y or (0, 1) | ‖y or (0, 1) | I yy |
z(yy) |
|αyy|2 |
| ‖y or (0, 1) | ‖x or (1, 0) | I yx | z(yx) |
|αyx|2 |
| (cosθ, cosθ) |
‖x or (1, 0) | I θx | — | |αxxcosθ + αyxsinθ|2 |
| ‖y or (0, 1) | (cosθ, cosθ) |
I yθ | — | |αyxcosθ + αyysinθ|2 |
 | ||
| Fig. 4 Simulated polar plots considering purely symmetric (ss) and purely antisymmetric (as) modes contributing parallel (‖) or orthogonally (⊥) to the incident light. The fictitious values of α are chosen as follows: αxx = αyy = 1 for the simulation of Iss‖; αxy = 1 for the simulation of Ias‖; αxx = 0.7 and αyy = 1 for the simulation of Iss⊥; and αxy = αyx = 1 for the simulation of Ias⊥. | ||
In this work, we have specified the Cartesian coordinates as in Fig. 3, and assumed that these coincide with the coordinates of the molecular system. This is not an obvious assumption in general but has been successfully used in many previous works. In the case of this study, however, we know from previous crystallographic investigations that single crystals of silicalite-1 do have axes of orientations that are orthogonal to each other and parallel to the crystal's faces.1 Most importantly, the MFI structure typical of this zeolite has also been confirmed by our X-ray results, see Fig. 2 and Section 2.1. This implies that the three axes in our laboratory coordinate system and the axes of the single crystals investigated are parallel, see also details in Fig. 5; hence no further angular transformations are needed for the interpretation of Raman intensities.
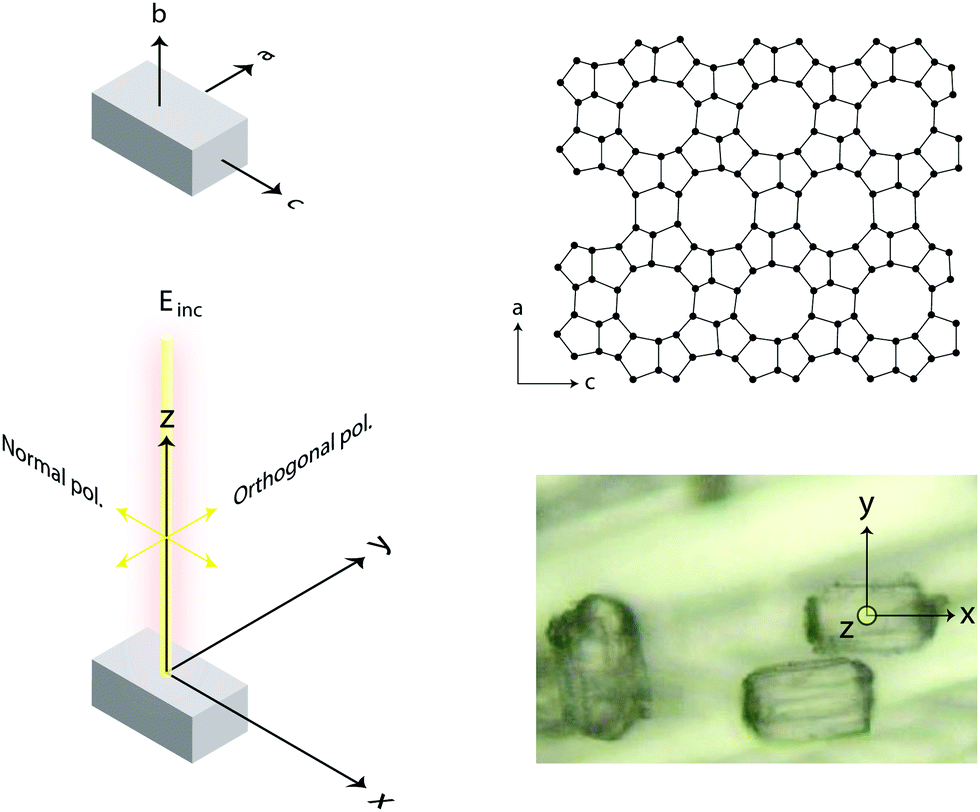 | ||
| Fig. 5 Schematic view of the laboratory coordinates x, y, and z (bottom left), of the crystal's axes a, b, and c (top left), as well as the projection of the ring units building up the a–c upper surface of the crystal (top right). The spot on the single crystal's surface from which the Raman spectra were collected is also precisely indicated (bottom right). | ||
Based on the theory explained above, cross polarised measurements can be performed to extract values of the depolarisation ratio (ρ) for a vibrational mode, where ρ = I⊥/I‖ (in practice ρ = Ixy/Ixx or ρ = Iyx/Iyy). By comparing the intensity detected at these different configurations it is possible to estimate the coefficients of the Raman tensor, which helps in assigning observed features to a specific vibrational mode. Complementary measurements done by variating the direction of polarisation of the incident light (that is the angle θ, by either rotating the sample on the x–y plane or rotating the polarisation of the incident light while keeping the sample fixed) serve to study the periodicity of Raman intensities, which are most appropriately shown in polar plots, as will be discussed in more details below.
4 Results and discussion
4.1 Vibrational modes
Raman spectra recorded at different polarisation configurations were recorded on single crystals of silicalite-1 oriented to have the c-axis perfectly parallel to the x-axis, the a-axis parallel to the y-axis, and the b-axis parallel to the z-axis, as illustrated in Fig. 5. This figure also shows the ring structure that fills the space over the a–c plane of the crystal,1 which includes 10-membered, 5-membered and 6-membered rings (see also Fig. 1). Tilted side views of this plane show that these rings are not perfectly planar (these and further structural details on this type of zeolite can be found in http://www.europe.iza-structure.org). Different planes along the b-direction are then connected by a complex combination of 4-membered, 5-membered and 6-membered rings.The Raman spectra recorded focusing the laser beam within 4 micrometers from the crystal's upper surface using circularly, normally (‖ to x) and orthogonally (‖ to y) polarised light are given in Fig. 6. To note that these spectra were collected without an analyser before the detector to gain maximum intensity. In the frequency region below 600 cm−1, Si–O–Si bending modes are observed, while in the range 650–850 cm−1, modes assigned to O–Si–O and Si–O–Si stretching are detected.7–10,12–14,16,38 A more precise assignment of the observed Raman active modes, for instance one that is able to distinguish rings of specific size (e.g. 5-membered from 6-membered rings), has been very difficult for zeolitic materials due to energetically close vibrations and frequency shifts that depend on both the ring size, the bond angle, and the type of connection between the ring sub-units. To understand the complex correlation between local structure and vibrational modes, one can consider that by using the exact atomic position derived from a precedent refined crystallographic study,2 and the fact that silicalite-1 has the orthorhombic symmetry and belongs to the space group Pnma (with 288 atoms per Bravais cell), the expected number of Raman active vibrational modes is as follows: 110 Ag, 106 B1g, 110 B2g and 106 B3g.37
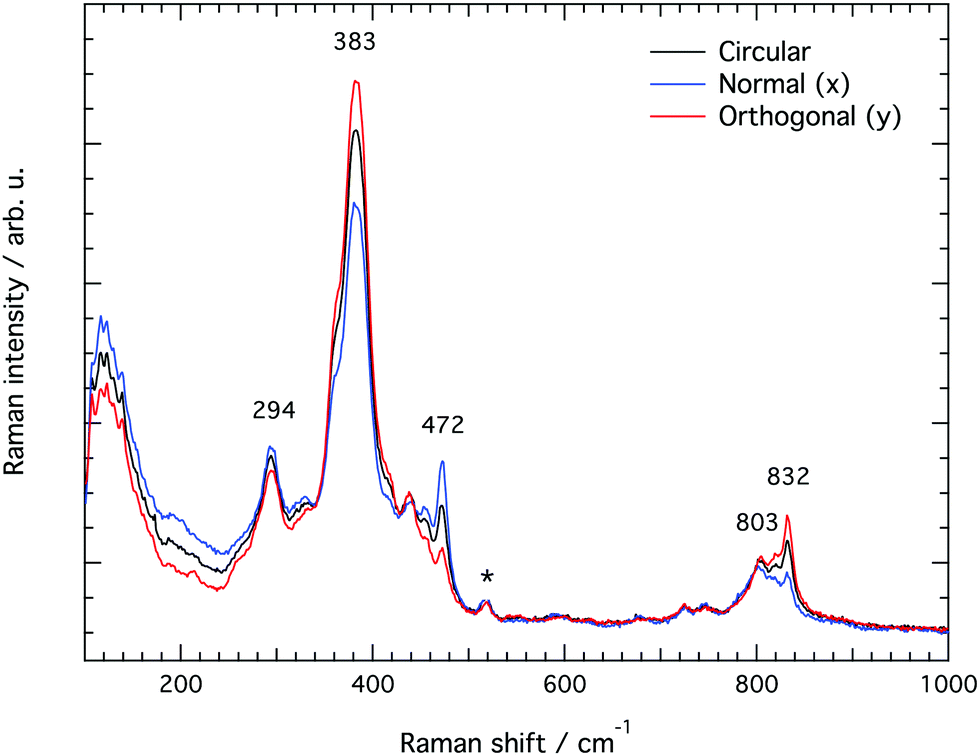 | ||
| Fig. 6 Raman spectra collected from the upper a–c plane of a single crystal of silicalite-1 with the incident light being circularly (black trace), normally (blue trace, parallel to the x-axis) and orthogonally (red trace, parallel to the y-axis) polarised. The asterisk marks a signature arising from the aluminium foil over which the single crystal is laying. | ||
Nevertheless, based on precedent theoretical and experimental works, and on similarities to the local structure of vitreous silica,38–42 it is now established that the Si–O–Si stretching modes arise primarily from the movement of Si atoms with the O atoms considered fixed at their position, while the Si–O–Si bending, ring opening and deformation modes, are dominated by the displacement of O atoms along the Si–O–Si bisector in the plane of the structural unit, resulting in Si–O–Si bond angles that variate during the vibration.42 Moreover, the frequency of the O-bending modes is expected to red shift with increasing ring size,8,42 while the intensity (i.e. the Raman coupling coefficient) increases with the frequency,42 and consequently decreases with increasing ring size. On the same line, it has been observed that in densified silica the frequency of bending modes increases due to the decreased mean intertetrahedra Si–O–Si angles and Si–Si distances (as a consequence of puckering), while the frequency of stretching modes is less affected by densification.39,42 To summarise, these effects, alongside line broadening due to the ring units not being perfectly planar, and the energetically close vibrations due to ring units of similar size have rendered the assignment of vibrational modes in zeolites a challenging task.
In line with previous works focused on the use of vibrational spectroscopy to characterise zeolites, we attribute the most intense feature peaked at 383 cm−1 to the most abundant ring unit that in silicalite-1 is the 5-membered ring.13 Accordingly, and in order of decreasing frequencies, we also assign the signature at 360 cm−1 to 6-membered rings, whereas the one at 294 cm−1 is attributed to 10-membered rings. The latter is in light contrast to one of the precedent works, in which the mode at 294 cm−1 was attributed to 6-membered rings instead.13 Our assignment is primarily supported by the complementary Raman spectrum recorded for the zeolite SSZ-13 (with the CHA framework structure that consists of 4-membered, 6-membered and 8-membered rings only), which is congruent with the correlation between ring size and frequency of the O-bending modes (see Fig. S1, ESI†). In addition, the contribution at 360 cm−1 is evidenced here thanks to a high spectral resolution, but has otherwise been hidden under the stronger feature peaked at 383 cm−1 in precedent studies. The sharp signature at 472 cm−1 is attributed to 4-membered rings, in line with what has been proposed by other authors before.8,12,13,16 These rings are not visible on the a–c plane shown in Fig. 5 since they connect different planes to each other and are thus parallel to the a–b plane. It is notable that the Raman spectra shown in Fig. 6, recorded using the incident light at different polarisations but in the absence of an analyser (i.e. without a polarisation filter), show different peak intensities. That is, the feature at 472 cm−1 is emphasized when the incident light is normally polarised (i.e. polarised along the x-axis) while the features at 383 and 832 cm−1 are emphasised when the incident light is orthogonally polarised (i.e. polarised along the y-axis). The Raman spectrum recorded with the incident light having a circular polarisation shows, as expected, an intermediate intensity at these frequencies. These aspects, emphasised here for the first time, are a direct manifestation of the anisotropy of the MFI framework structure.
and z(xy) as well as in the z(yy) and z(yx) set ups, as summarised in Fig. 7. The differences observed between the spectra recorded with the z(xx) and z(yy) configurations confirm that structural diversity exists along the two crystal axes a and c, and most importantly that polarised Raman spectroscopy is sensitive to these differences. Moreover, the drastic intensity decrease observed when changing the polarisation configuration from z(xx) to z(xy) and from z(yy) to z(yx) suggests that the recorded vibrations are close to totally polarised. More specifically, the depolarisation ratio ρ, estimated as ρ = Iz(xy)z/Iz(xx)z or ρ = Iz(yx)z/Iz(yy)z is found to be well below 0.75 for most vibrations, the threshold value that distinguishes polarised from depolarised vibrations, see also the calculated values given in Table 2 (each value of ρ has been obtained from the ratio of integrated areas estimated from the peak fit of the Raman spectra. An example of the peak fit model used in the lower frequency range is shown in Fig. S2, ESI†). An exception is the vibrational mode found by us at 803 cm−1 that shows a depolarisation ratio close to one, although this will be discussed in more detail further down. By definition, totally polarised vibrations are those that scatter light with the same polarisation as the incident light, which happens to be the case of symmetric vibrational modes.
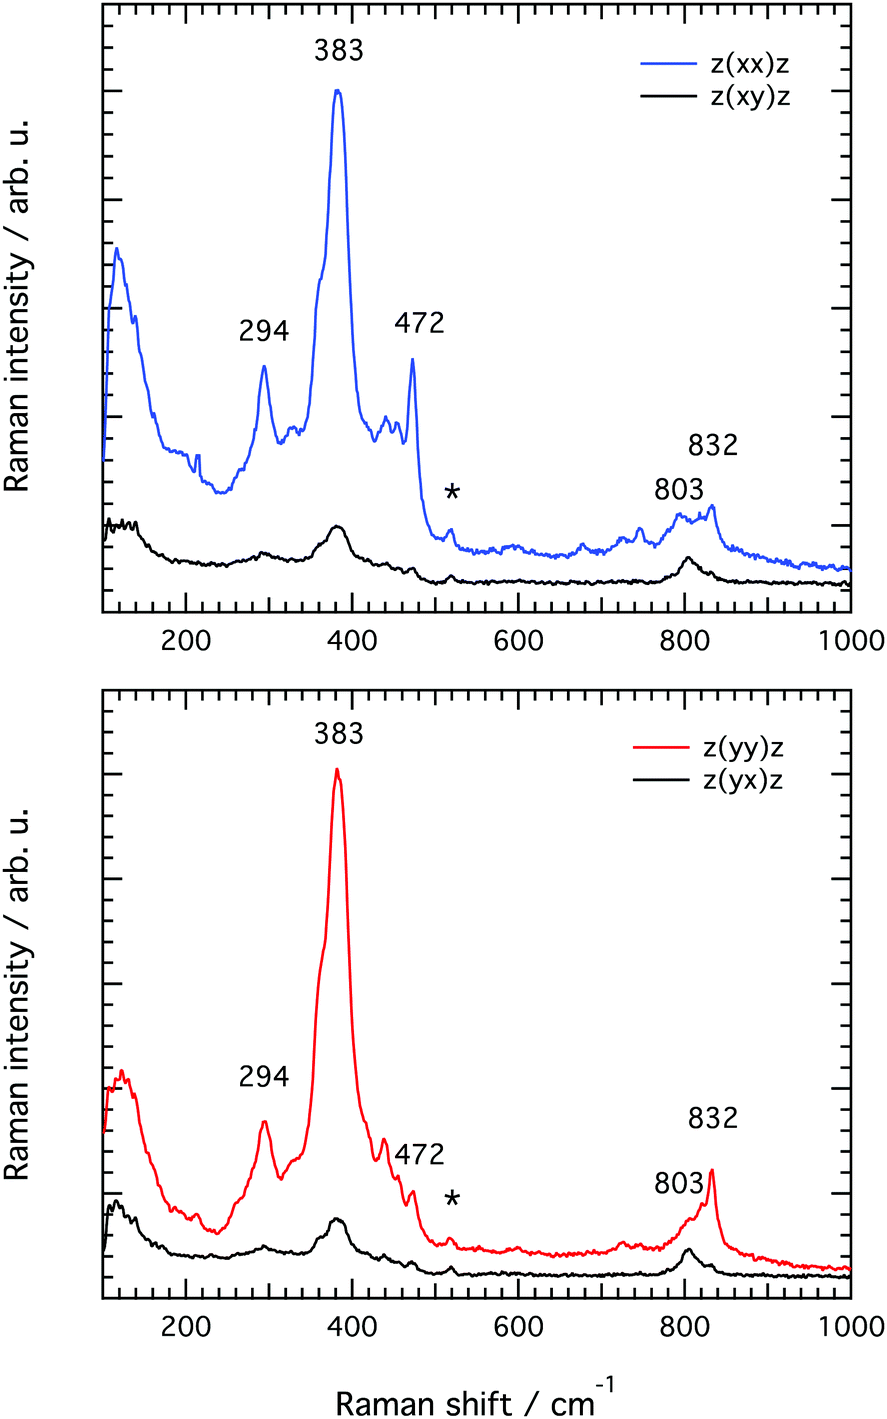 | ||
| Fig. 7 Raman spectra recorded from the upper a–c surface of a single crystal of silicalite-1 at parallel (that is z(xx)z and z(yy)z) and cross polarised (that is z(xy)z and z(yx)z) configurations. The asterisk marks a peak arising from the aluminium substrate and is thus not associated to any vibrational mode in silicalite-1. | ||
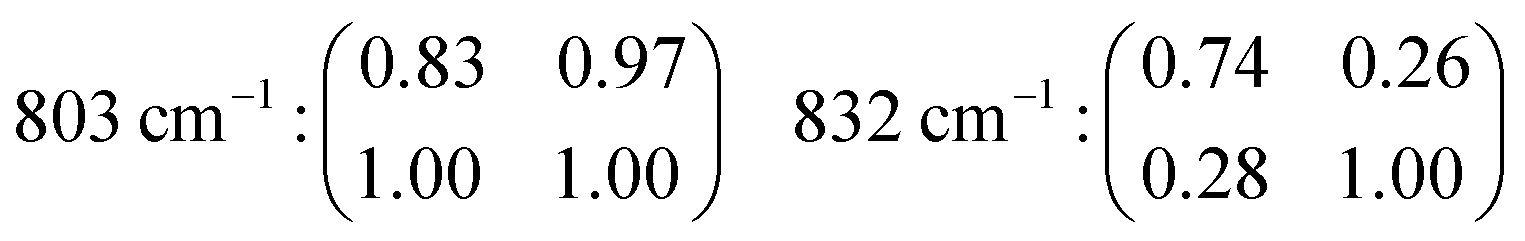
| Frequency (cm−1) | Assignment | ρ | ρ | Polarisation | f | Orientation |
|---|---|---|---|---|---|---|
| I z(yx)z/Iz(yy)z | I z(xy)z/Iz(xx)z | 1 − Iz(yy)z/Iz(xx)z | ||||
| 294 | δ Si–O–Si (10-membered) | 0.14 | 0.12 | Polarised | 0.17 | Isotropic |
| 360 | δ Si–O–Si (6-membered) | 0.10 | 0.13 | Polarised | 0.15 | Isotropic |
| 383 | δ Si–O–Si (5-membered) | 0.32 | 0.13 | Polarised | 0.10 | Isotropic |
| 472 | δ Si–O–Si (4-membered) | 0.19 | 0.05 | Polarised | 0.76 (Iz(xx)z > Iz(yy)z) | Anisotropic |
| 795 | ν s Si–O–Si (6-membered) | 0.26 | 0.11 | Polarised | 0.54 (Iz(xx)z > Iz(yy)z) | Anisotropic |
| 803 | ν as Si–O–Si/O–Si–O (10-membered) | 1.03 | 1.36 | Non-polarised | 0.31 (Iz(yy)z > Iz(xx)z) | Quasi-anisotropic |
| 818 | ν s Si–O–Si (4-membered) | 0.26 | 0.34 | Polarised | 0.18 | Isotropic |
| 832 | ν s Si–O–Si (5-membered) | 0.06 | 0.10 | Polarised | 0.45 (Iz(yy)z > Iz(xx)z) | Anisotropic |
One additional information that can be extracted from using polarised Raman spectroscopy is the so called pseudo-order parameter, f, expressed as f = 1 − (Iyy/Ixx) or f = 1 − (Ixx/Iyy) depending on the orientation of the specific material and the vibration that is analysed. This parameter can be investigated for each vibrational mode independently. In isotropic materials Ixx is expected to be equal to Iyy, which results in f being equal to zero. If a specific molecular orientation exists, f differs from zero and a value of one is achieved for a perfect alignment between the molecular bond underlying the vibration and the direction of polarisation of the incident light. The pseudo-order parameter has previously been estimated to achieve orientational information in several materials such as stretched synthetic polymer fibres, nanotubes and cellulose fibres.26–28,43 As also given in Table 2, we find that for the features peaked at 294, 360 and 383 cm−1 the pseudo-order parameter has a low value, between 0.10 and 0.20, indicating that the bonds underlying these vibrations are isotropic in nature. Based on this and the small value of ρ, we can conclude that at these three frequencies symmetric ring opening modes contribute the most (but certainly not exclusively, since more complex modes such as deformation or torsion can also contribute and overlap. According to precedent studies on vitreous silica, however, O-bending modes seem to dominate in the spectral range below 600 cm−140,42). The feature at 472 cm−1 is also associated to a ring mode, but shows a clear anisotropic character (f = 0.76, with Iz(xx)z > Iz(yy)z). Hence, this vibrational mode includes contributions from O atoms whose movement is oriented along the x-axis (or along the c-axis of the crystal). Looking at the ring structure reproduced in Fig. 8, but also the more detailed structure of the pentasil pair given in Fig. 9 (reproduced with an atom labelling equivalent to that proposed by Lermer et al.2 and Olson et al.44), a plausible assignment of the 472 cm−1 mode is to O atoms shared between two 5-membered rings above or below a 6-membered ring (i.e. to oxygen atoms in the T3–O–T4 bond) or to O atoms belonging to the 4-membered rings (i.e. to oxygen atoms in the T9–O–T10 bond). Here one should note that the spectral feature at 459 cm−1 has a similar character to that at 472 cm−1, although it has a relatively lower intensity. We propose to assign the vibration observed at 472 cm−1 to O-bending modes in 4-membered rings, with the argumentation that the T9–O–T10 bond is characterised by a smaller T–O–T angle (153.2°) than the T3–O–T4 bond (176.2°),2 which tends to blue shift the vibrational frequency, and that the feature is sharper (fwhm472 = 12 cm−1 while fwhm459 = 18 cm−1) with sharpness being typical of planar rings;39,41 in fact the 4-membered ring is the only truly planar sub-unit in the MFI framework structure. In this case, the polarisation dependent intensity must origin from out-of-plane ring deformation modes (since the in-plane O-bending modes occur over the a–b plane). We will come back to this assignment through the discussion of polar plots, but we anticipate that Raman active modes observed close to 470 cm−1 in diverse zeolitic materials have already been proposed to arise from 4-membered rings.8,12,13,16 Consistent with this assignment is the Raman spectrum that we have recorded for a zeolite with the chabazite structure (see Fig. S1, ESI†), which shows two sharp and distinct peaks around 470 cm−1 in agreement with the presence of two types of 4-membered rings in the framework.
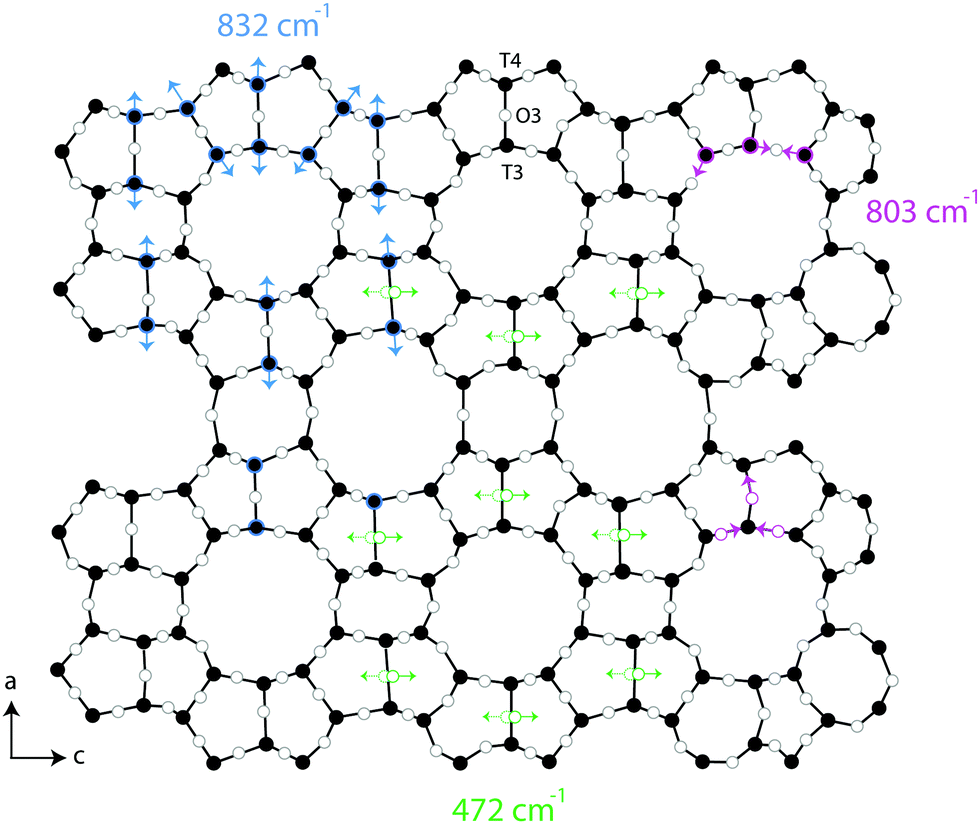 | ||
| Fig. 8 Projection of the ring units seen over the a–c plane of a MFI framework structure. Blue arrows indicate the Si–O–Si bonds contributing to the stretching mode observed at 832 cm−1, while green arrows mark the position of O-atoms involved in the O-bending modes appearing at 472 cm−1. The proposed assignment of anti-symmetric stretching modes at 803 cm−1 is also indicated. | ||
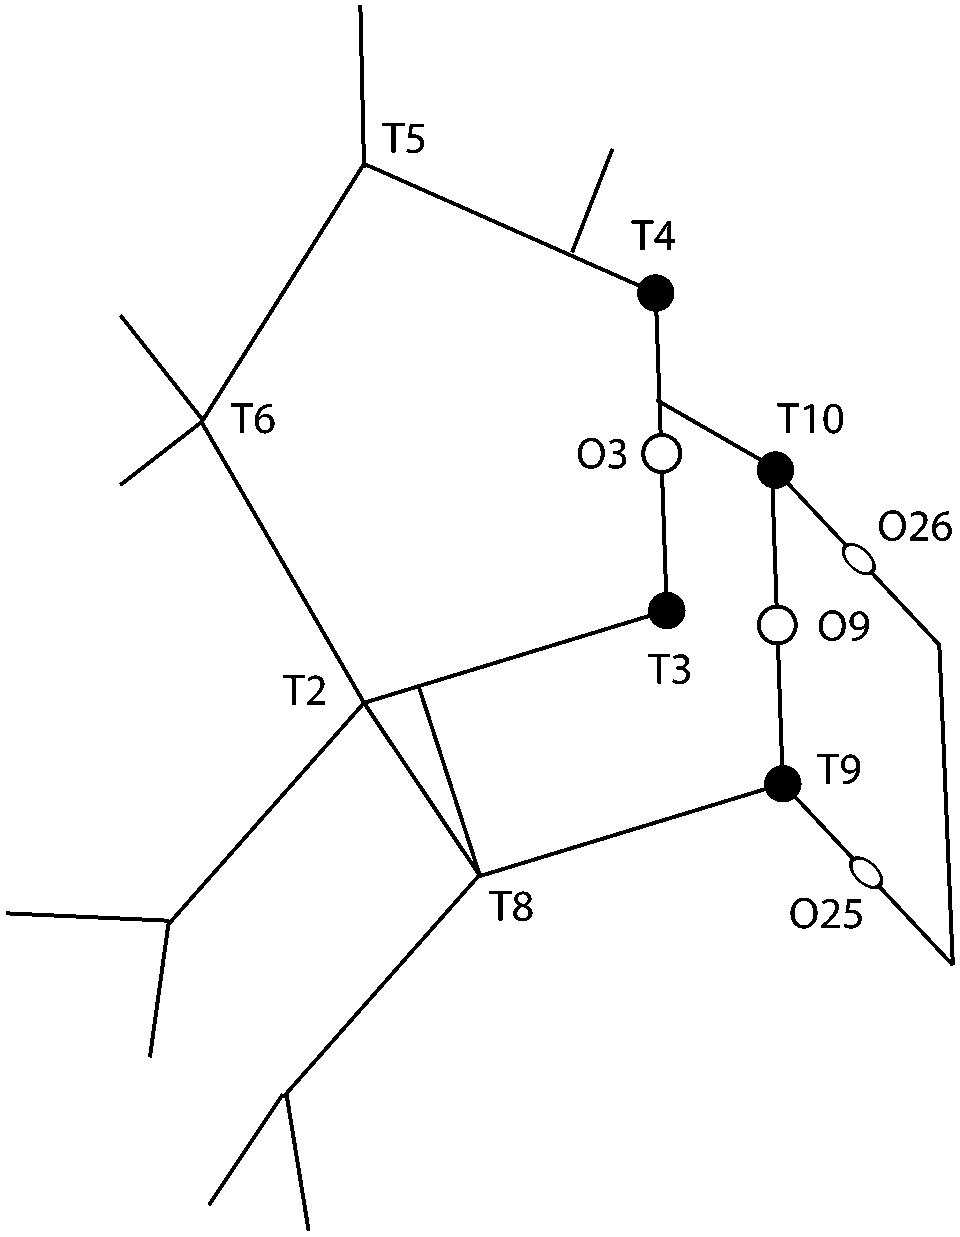 | ||
| Fig. 9 The pentasil sub-unit with atom numbering as proposed by Olson et al.44 and Lermer et al.2 See also Fig. 8 for the position of this sub-unit (e.g. the location of T3 and T4) in the context of the larger structure. The T3–O3–T4 and T9–O9–T10 bonds belong to 5-membered rings placed on different planes along the b-axis. | ||
The spectral region 650–920 cm−1, where Si–O–Si and O–Si–O stretching modes are known to appear, has required a meticulous analysis through careful peak fitting due to the low intensity of the modes and the proximity of several energetically close contributions. Fig. 10 illustrates the peak fit model that we have used, which between 760 and 850 cm−1 includes five Lorentzian functions. An important note is that the position and width of the fit peaks have been fixed at values obtained from the fit procedure of the spectra recorded at parallel configurations (Ixx and Iyy), while the intensity of the peaks was left as a free parameter. It is also important to mention that an alternative model with four components only (one component being free to be positioned between 795 and 803 cm−1) has also been tested, but resulted in inconsistent trends. Hence, despite models with fewer components are generally preferred, in this case we opted for the five peak model, which is strongly suggested by the position of the distinct local maxima observed in both the parallel and cross polarised spectra. For clarity, the remaining of the discussion is based on the five peaks model with components centred at 780, 795, 803, 818 and 832 cm−1.
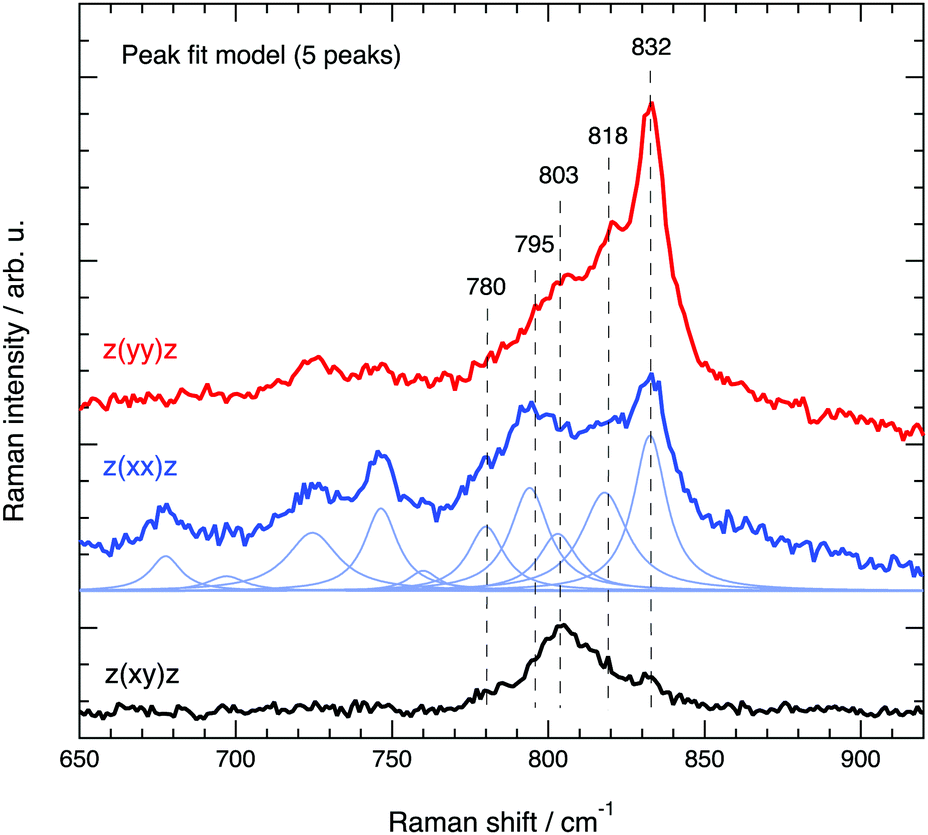 | ||
| Fig. 10 Peak fit model based on a linear background and several Lorentzian functions used to fit the Raman spectra of silicalite-1 in the range 650–920 cm−1. | ||
In the past, a distinction has been made between modes observed between 650 and 730 cm−1 which were assigned to intra-tetrahedral O–Si–O stretching, and modes observed between 760 and 850 cm−1 which were assigned to inter-tetrahedral Si–O–Si stretching.10 Because internal O–Si–O angles are stiffer than the Si–O–Si bridging angles,38 the latter region (i.e. the 760–850 cm−1 range) is expected to be more sensitive to structural changes (i.e. to ring size and Si–O–Si bond angle variations), yet still less affected than the vibrations categorised as bending modes.42
A distinct behaviour is that of the component at 832 cm−1, which is also the most isolated and easily fitted feature in this region. It is clearly more intense when measuring in the z(yy)z configuration than when using z(xx)z (Fig. 7 and 10), has a relatively high value for the pseudo-order parameter (f = 0.45, or Iyy ≈ 2·Ixx) and a low depolarisation ratio (ρ < 0.10). These details indicate that the vibrational mode can be assigned to a symmetric stretching with a considerable contribution from Si–O–Si bonds oriented along the a-axis of the crystal. As shown in Fig. 8, these may be the bonds shared between two 5-membered rings adjacent to one 6-membered ring, marked by blue arrows in the figure, or in other words the T3–O–T4 bonds (see also Fig. 9). However, as discussed above Fig. 9 shows that in alternating layers along the b-axis oriented Si–O–Si bonds can also belong to the 4-membered ring unit (the T9–O9–T10 bonds). The refined crystallographic studies performed by Lermer et al.2 and Olson et al.44 report average T–O bond lengths of 1.58 Å for the T3–O3–T4 bond and of 1.6 Å for the T9–O9–T10 bond. Since stretching frequencies are strongly related to the bond length (that is to the bond strength), we conclude that the vibrational feature at 832 cm−1 is primarily due to the stretching of Si–O–Si bonds shared between 5-membered rings. This make sense with the associated frequency being the highest within the investigated range 760–850 cm−1.
The feature at 803 cm−1 has a different behaviour, in particular it shows a high depolarisation ratio and a relatively low pseudo-order parameter (f = 0.31). These details are consistent with quasi isotropic Si–O–Si and/or O–Si–O bonds and vibrations with an anti-symmetric character. This is an interesting finding since the spectral region 760–850 cm−1 is often described to only contain symmetric stretching modes, as opposed to the high frequency range around 1000 cm−1 that is typically assigned to anti-symmetric stretching. Nevertheless, in one previous study focused on amorphous silica a high depolarisation ratio for a mode close to 800 cm−1 has been reported upon comparison between cross and parallel polarised Raman spectra,40 while the contribution of anti-symmetric stretching modes in at least one of the peaks found within the range 760–850 cm−1 has also been proposed to exist.38 Our results clearly indicate that at least one vibrational mode arises from the anti-symmetric displacement of O or Si atoms. Due to a strong coupling between Si–O–Si and O–Si–O stretching modes however, and the moderate difference between the masses of O and Si, the frequency of these vibrations can easily overlap and cannot be distinguished. A tentative assignment of the feature at 803 cm−1 is thus to anti-symmetric Si–O–Si and/or O–Si–O stretching modes in bonds belonging to 10-membered rings. The contribution at 795 cm−1 has a low depolarisation value (below 0.26) and a relatively high value of f (f = 0.54, with Iz(xx)z > Iz(yy)z), which suggests its assignment to symmetric stretches with an orientation along the laboratory x-axis (or along the c-axis of the crystal). Plausible bonds that can contribute at this frequency are Si–O–Si and/or O–Si–O stretching modes in 6-membered rings, given that precedent crystallographic studies have already evidenced a flatter contour for this ring unit.1
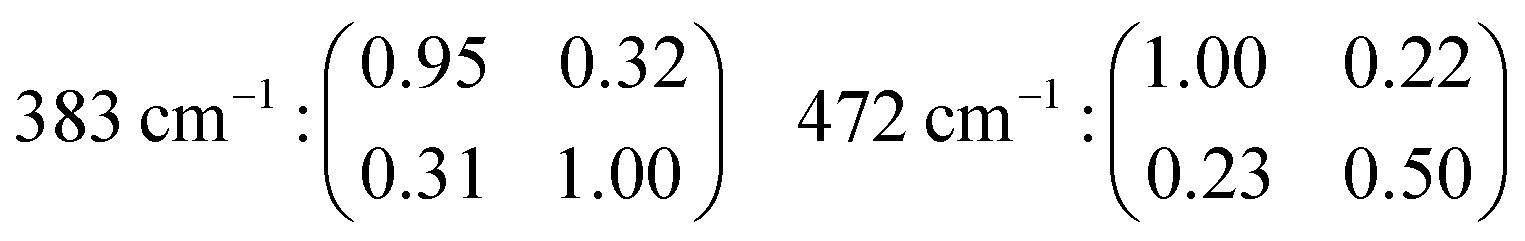
The fact that αxx ≠ αyy in the case of e.g. the features at 472 and 832 cm−1 reflects, once again, the anisotropic character of the underlying vibrational modes (a more complete set of tensor coefficients including also other vibrational modes can be found in the ESI† file, page 2).
 | ||
| Fig. 11 A selection of Raman spectra recorded from a single crystal of silicalite-1 with the polarisation angle θ rotating around the z-axis and over the x–y plane. The peak fit model used to analyse different spectral regions is shown at the bottom of this figure emphasising in colour particularly important components. | ||
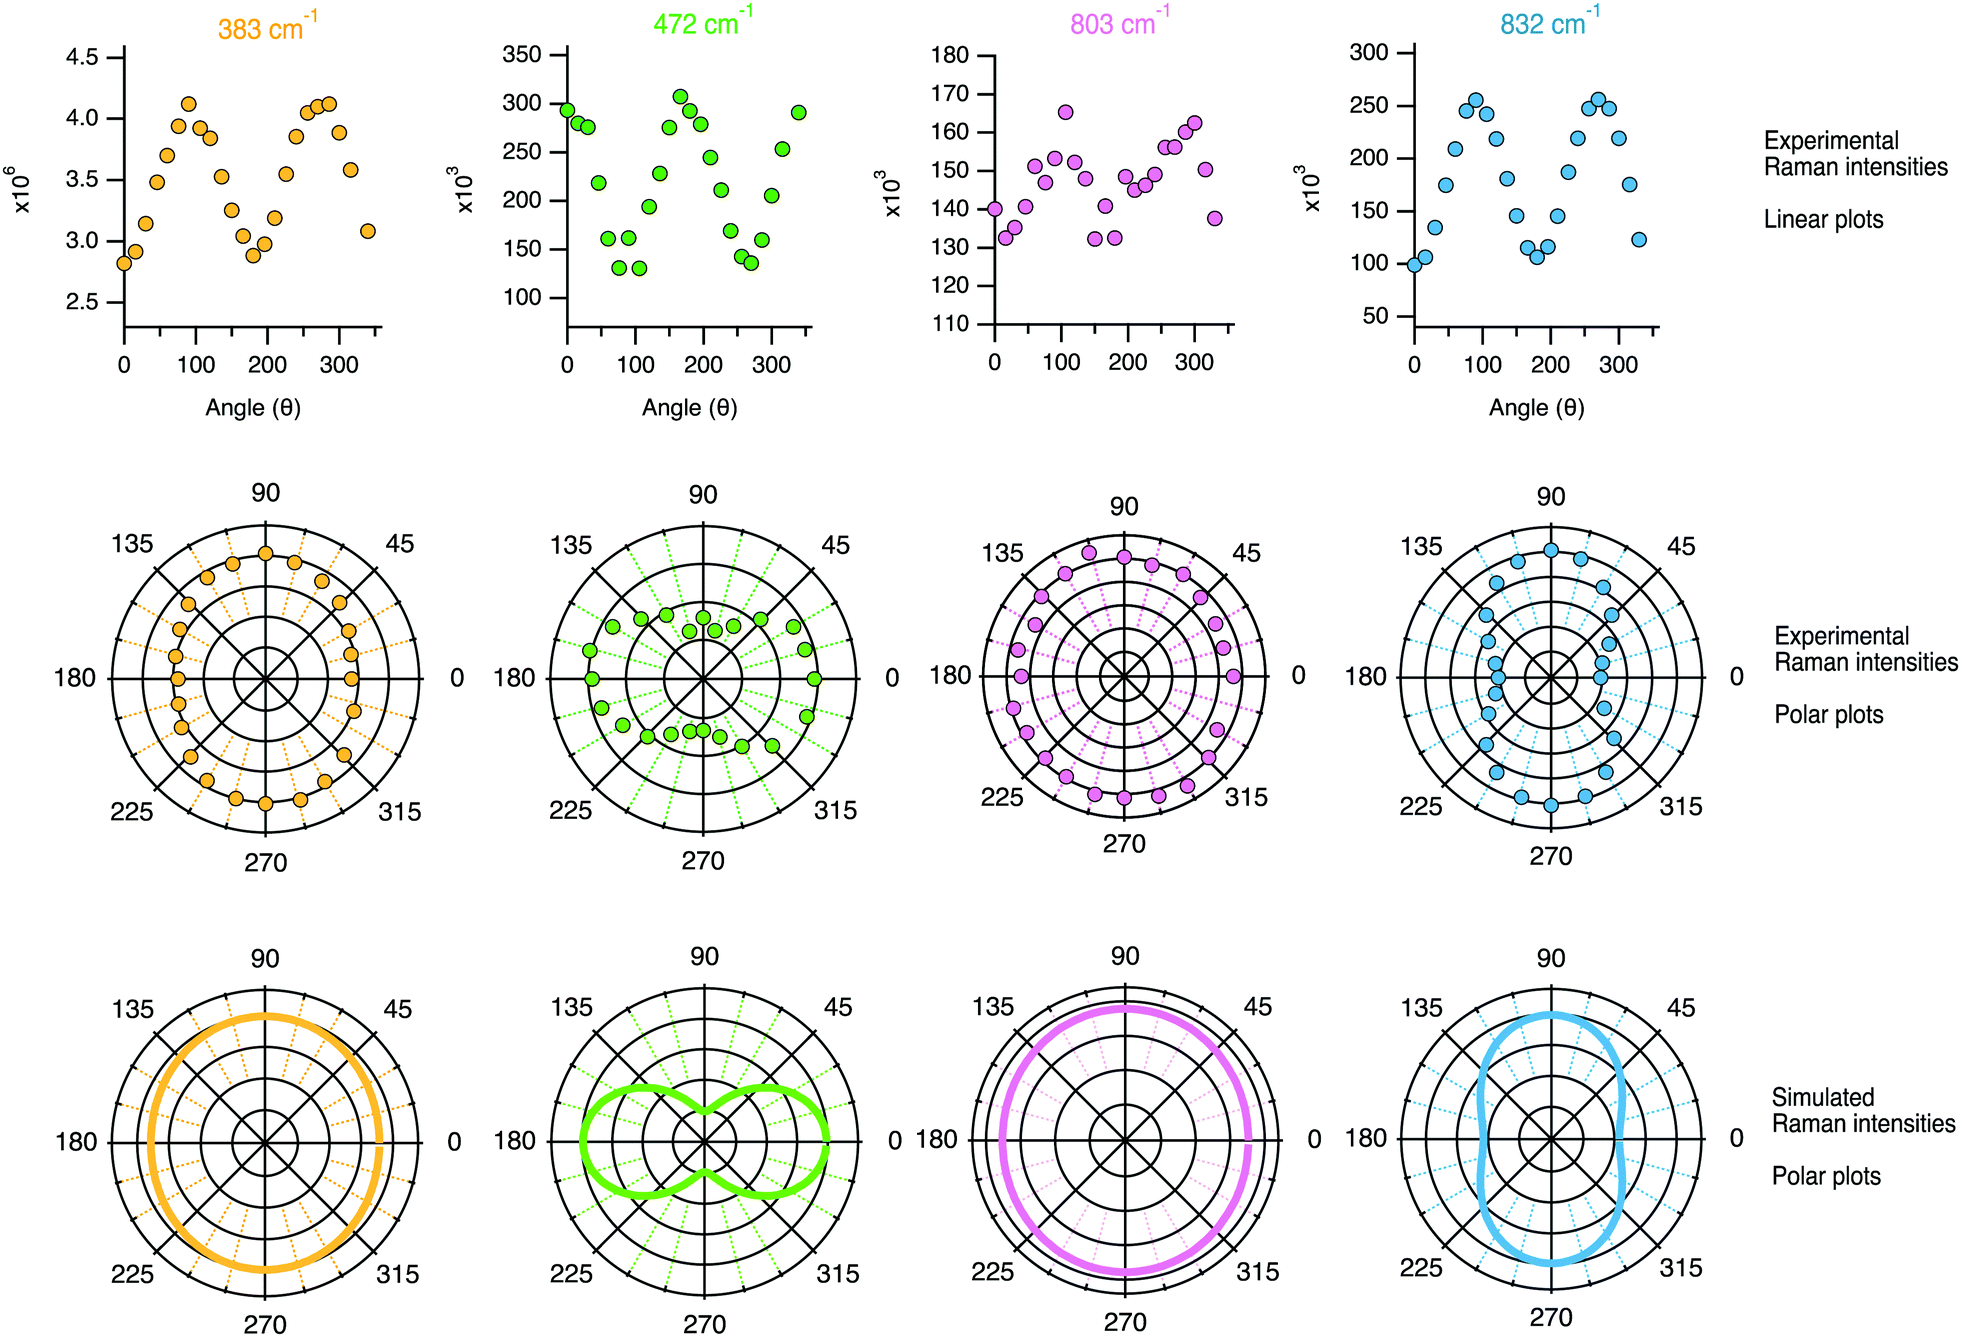 | ||
| Fig. 12 Linear plots (top panel) and polar plots (mid panel) of the Raman intensities (i.e. the integrated areas from the peak fit analysis) recorded while rotating the polarisation angle θ. For comparison, the bottom panel shows the Raman intensities simulated using the tensor coefficients found experimentally and using either eqn (1) and (3) or eqn (2) and (4) depending on the character of the vibration. | ||
The angular dependence of the feature at 383 cm−1 has been simulated considering the vibrational mode as symmetric (due to the character of its Raman tensor) and hence expected to have an intensity proportional to (0.95cos2θ + 1sin2θ)2 + (1 − 0.95)2cos2θsin2θ, i.e. as the sum of eqn (1) and (3) since no analyser was used (see the Theoretical aspects section in the beginning of this article). This simulated angular dependence is shown in the bottom row of Fig. 12 and reveals a fairly good agreement with the behaviour of the experimental data. Nevertheless, a better match is obtained if the coefficient αxx in the equation above is reduced to 0.90 (see Fig. S3, ESI†). The simulated angular dependence for the vibrational mode at 472 cm−1 has also been reproduced assuming a symmetric character, but now the expression (1cos2θ + 0.5sin2θ)2 + (1 − 0.5)2cos2θsin2θ results in a double loop shape with minima at 90 and 270°. The agreement between the simulation and the experiments is, in this case, very good. This confirms the symmetric character of the vibrational mode, which we thus assign to the in-phase out-of-plane deformation mode in 4-membered rings. An almost perfect match is also found between the experimental polar plots for the feature at 832 cm−1 and the polar plots simulated using the coefficients αxx = 0.74 and αyy = 1.00, and thus expecting the Raman intensity to be proportional to (0.74cos2θ + 1sin2θ)2 + (1 − 0.74)2cos2θsin2θ. The maxima at 90° and 270° and the overall shape of the loop are both very well reproduced, confirming that the vibrational mode contributing at this frequency is an anisotropic symmetric stretching. The experimental angular dependence of the integrated area under the feature peaked at 803 cm−1 is weak, with marginally higher intensities at 0° and 180°. Neither by treating the vibration as purely symmetric (i.e. as the sum of eqn (1) and (3)) nor by treating it as anti-symmetric (i.e. by the sum of eqn (2) and (4)) could the angular dependent experimental data be well reproduced using the found values of the Raman tensor. By contrast, a weighted sum with 80% of anti-symmetric character results in a good fit to the data, which is also the simulated behaviour shown in Fig. 12. This approach is motivated by the high values of the off-diagonal coefficients, which is typical for anti-symmetric vibrations. This finding is in agreement with the conclusions drawn from cross polarised measurements (Section 4.2.1), and supports the predicted presence of anti-symmetric stretching modes within the range 760–850 cm−1.38,40
An interesting observation is that while the polar plot of the 294 cm−1 is rather symmetric with respect to θ, the polar plots for the 360 and 383 cm−1 modes show a similar shape with slightly higher intensities at 90° and 270° (see Fig. S4, ESI†). This could be explained by the flatter contour of the 6-membered ring structures along the c-axis, as also illustrated in Fig. 8. Also, the fact that the polar plots of the peaks at 472 cm−1 and 832 cm−1 are orthogonal to each other, is in complete agreement with the assignment of the vibrational mode at 472 cm−1 to the motion of O atoms belonging to 4-membered rings. As can be seen from the 3D structural reconstruction of the MFI framework from crystallographic data (Fig. 9 and/or http://www.europe.ize.org) the 4-membered rings are in fact oriented orthogonally to the 5-membered rings appearing on the a–c plane, which implies that the motion of the O atoms during the 4-membered ring deformation mode is indeed perpendicular to the displacement of Si atoms during Si–O–Si stretching modes contributing at 832 cm−1.
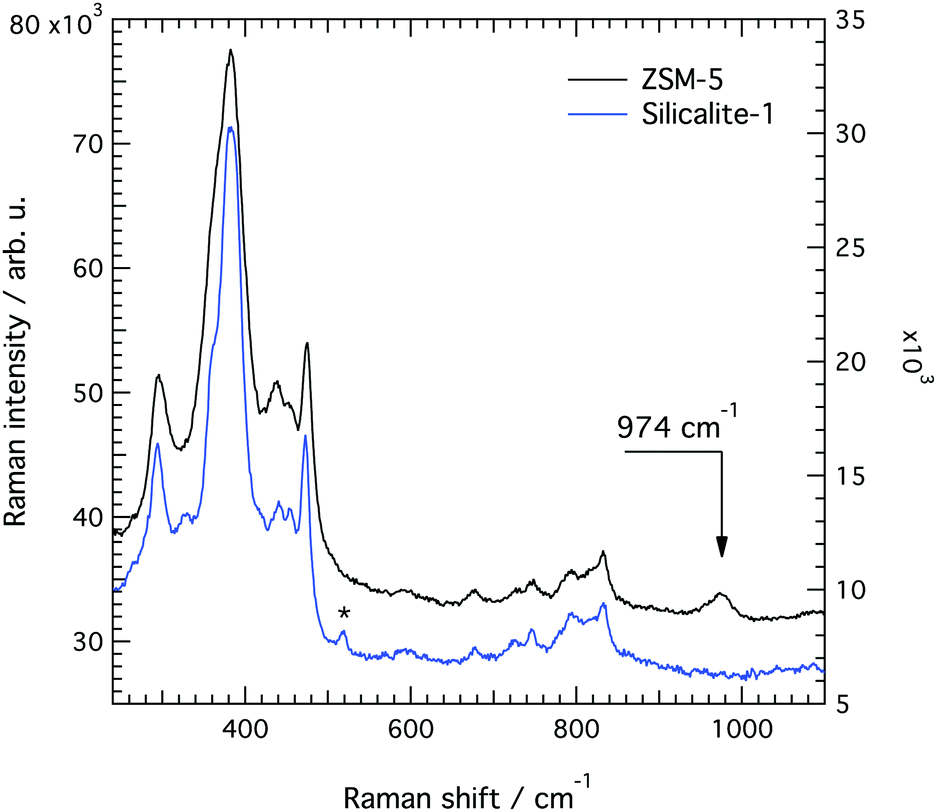 | ||
| Fig. 13 Raman spectra collected from single crystals of silicalite-1 (blue) and ZSM-5 (dark grey) with the polarisation of the incident light parallel to the c-axis in both cases. A new feature is observed at 974 cm−1 in ZSM-5. The asterisk indicates a signature arising from the aluminium foil underlying the single crystal. | ||
A difference between the Raman spectra of silicalite-1 and ZSM-5 is the width of the peaks, ZSM-5 showing overall broader spectral features. The feature at about 360 cm−1, for example, appears less defined because of its broader character. Line broadening is consistent with an increased disorder in the local structure due to the presence of Al atoms at a low ratio. As a note, structures with 100% of Si atoms, 100% of Al atoms or 50% of Si and Al atoms would all re-establish order. From a careful peak fit analysis (see Fig. S7, ESI†) we find that the feature at 472 cm−1 is less affected (i.e. is broadened the least) which indicates that the 4-membered ring is a less probable site for the Al atoms.
The most important difference to the spectrum of silicalite-1 is, however, a new vibrational mode at 974 cm−1, whose assignment is a subject of debate. Given the spectral region where it appears, this mode could a priori arise from in-plane AlO–H bending, Al–O(H)–Si stretching or Al–OH stretching. A vibration at or close to this frequency has also been observed in some other Al containing zeolites.13,16,18 In particular, Mofrad et al.18 have reported the trend of Raman frequencies theoretically calculated for sodalite (that adopts the SOD framework structure) at decreasing SAR values, highlighting an increasing contribution close to 970 cm−1. This was interpreted to arise from a red shift of the T–O–T anti-symmetric stretching modes otherwise found between 1000 and 1200 cm−1, an assignment that is supported by the fact that Al–O bonds are expected to be weaker than Si–O bonds. For example, according to the experimental work of Yu-Ran Luo,46 the bond dissociation energy is lower in Al–O (501.9 kJ mol−1) than in Si–O (799.6 kJ mol−1), if diatomic molecules are considered.
The tensor coefficients found by us from cross polarised measurements for the 974 cm−1 mode are αxx = 0.88, αyy = 1, αxy = 0.32 and αyx = 0.30, which is in contrast with the supposed anti-symmetric character of the vibration. Moreover, the dependence on the rotation angle θ of the integrated area under this mode (see Fig. 14, left panel) reveals a weak anisotropy, similarly to the case of the vibrational mode at 832 cm−1 but less pronounced. The theoretical angular behaviour calculated with the tensor values αxx = 0.88 and αyy = 1 and assuming a symmetric character for the vibration is superimposed to the experimentally found behaviour, revealing a fit of acceptable quality. These results altogether suggest that the signature at 974 cm−1 is most likely due to Al–OH stretching with the Al atom sitting at positions shared between 5-membered rings. Sites shared with six-membered rings are less probable since these would have shown an anisotropy with enhanced intensities at 0° and 180° (i.e. along the c-axis of the crystal). The assignment to Al-OH stretching is in analogy to the well known case of amorphous silica, for which a spectral feature at 980 cm−1 is typically assigned to Si–O stretching in terminal or defect Si–OH groups.
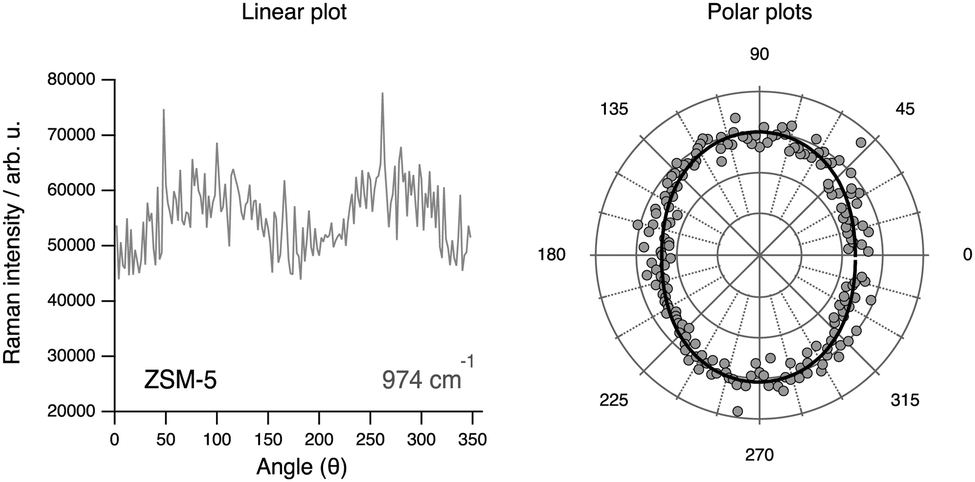 | ||
| Fig. 14 Angular dependence of the area under the peak at 974 cm−1 in a linear plot (left) and in polar plots (right). In the right plot experimental values are shown as filled grey dots, while the simulated plot is shown as a solid black line. | ||
We have also recorded complementary Raman spectra using the 514 nm laser line that when coupled with the appropriate grating (2400 lines per mm) allows catching the O–H stretching modes appearing in the 3100–3800 cm−1 spectral range, see Fig. 15. Two sharp peaks are resolved, one at 3611 cm−1 which is well known to arise from the Brønsted acid sites that are of utmost importance for the catalytic reactions in ZSM-5,47 and another one at 3663 cm−1 which in infrared spectra appears as an extremely weak and broad feature and has as such rarely been reported or discussed. Nevertheless, in the recent work of Bräuer et al.48 a feature observed at 3660 cm−1 by diffuse reflectance infrared Fourier transformed spectroscopy has been assigned to O–H stretching modes associated to Al species at extra-framework positions in the internal parts of the ZSM-5. This is a plausible assignment that, if correct, would suggest that the modes at 974 cm−1 and at 3663 cm−1 arise from the same molecular group. Future spectroscopic studies, desirably at high confocal mode and through the space of single crystals, could be performed with the aim to spatially resolve, and possibly distinguish, internal from external hydroxyl groups. The features at 3611 cm−1 and 3663 cm−1 both show a lower intensity when the polarisation of the laser is set parallel to the c-axis of the crystal, and thus reveal a most probable orientation of the O–H bond along the a-axis. Also, the intensity of the higher frequency feature appears to be more sensitive to the direction of polarisation of the incident light, Ixx/Iyy being 0.8 for the peak at 3611 cm−1 and 0.6 for the peak at 3663 cm−1. This finding is pivotal and is in agreement with a recent work based on solid state NMR spectroscopy that has demonstrated a nonrandom distribution of Al sites within the ZSM-5 framework structure.4 The authors identify four most probable sites for the Al atoms, i.e. T1 and T13, and T4 and T16, which exhibit a pseudomirror symmetry. These pair of sites are spectroscopically equivalent. The striking insight is that if the Al atom is at position T4 (see also Fig. 2b in ref. 4) the acidic OH group will have a preferred orientation along the a-axis, in agreement with the results presented in Fig. 15. We propose that further experimental work and DFT calculations will elucidate on the specific sites for the Al atom, possibly clarifying whether the two signatures observed in the high-frequency Raman spectrum correspond to the two most probable crystallographic sites identified by solid state NMR.
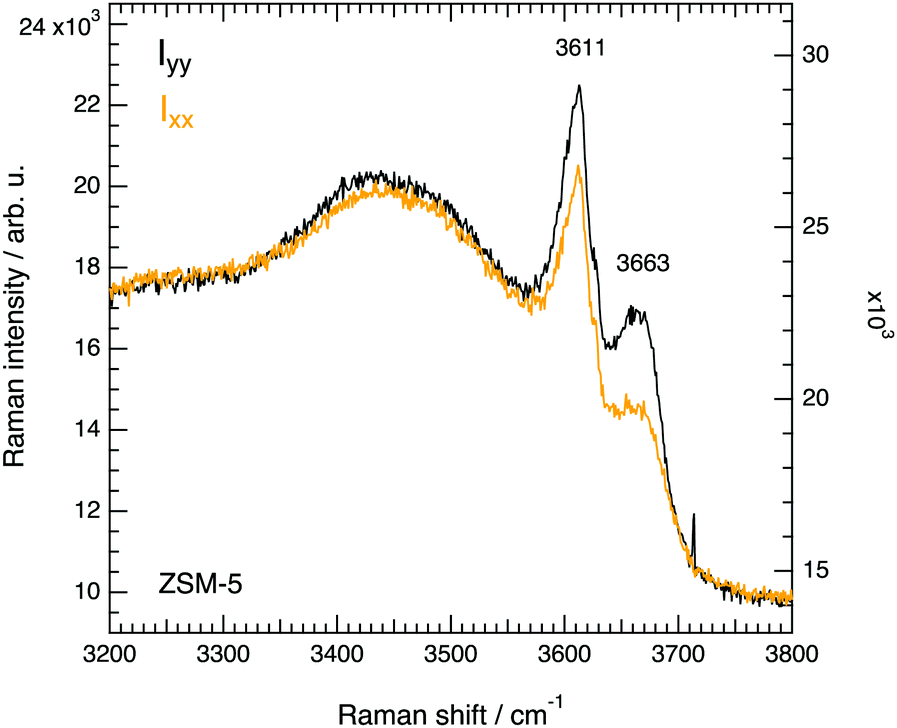 | ||
| Fig. 15 High frequency range of Raman spectra recorded with the 514 nm laser line at parallel conditions with the polarisation of the incident laser parallel to the c-axis (Ixx) or the a-axis (Iyy) of the crystal. | ||
5 Conclusions
In this work we demonstrate that the intrinsic anisotropy in zeolites of the MFI framework structure can be studied by polarised Raman spectroscopy, provided the study is done on isolated single crystals. In other words, some Raman active modes display enhanced intensity due to a preferential orientation in space of the underlying molecular bond, as in the case of the stretching mode at 832 cm−1 and the bending mode at 472 cm−1. By using information from X-ray diffraction on the crystal's axes and the orientation of the ring units, as well as argumentations related to T–O–T bond length and angles, these modes have been assigned to have contributions from T–O–T bonds shared between two 5-membered rings (832 cm−1) and belonging to 4-membered rings (472 cm−1). Similarly, the other Raman active modes could be assigned more precisely than proposed before thanks to detailed information achieved on isotropy and depolarisation, with strong support from the angular dependence of Raman intensities. The equivalent spectra of silicalite-1 and ZSM-5 and their almost identical behaviour upon change of polarisation of the incident light indicate that the observed vibrational modes can be assigned on the basis of local structure and bond orientation, and that none of the modes in the region 200–1400 cm−1 can be associated solely to the presence of Al atoms. That is, the expected blue shift of e.g. a stretching mode due to the lighter mass of Al (as compared to Si) is compensated by the red shift that arises from the longer Al–O bond, which explains why the Raman spectra of ZSM-5 (with SAR = 50) and silicalite-1 are in practice identical. The only mode that distinguishes the two zeotypes is found at 974 cm−1, which we attribute to Al–OH species. This, as opposed to all the other modes, can be used in future studies as an indicator for the presence of the Al atom. This work also shows that the strong Raman signature at 472 cm−1 can be used as an indicator of the crystal orientation, which can be a crucial tool in the in-depth investigation of single crystals and their sub-units. Raman spectra recorded with the incident light at different polarisations also suggest that the Brønsted acid sites have a preferred orientation with respect to the crystal's axes, which seems to be in agreement with the nonrandom distribution of Al sites in ZSM-5 revealed recently by solid state NMR spectroscopy. We foresee these results to have a large impact in the field of catalysis, since the use of polarised Raman spectroscopy is a priori applicable to any zeolitic framework structure provided that single crystals several micrometers in size can be synthesised and isolated. Complementary structural and orientational knowledge from X-ray diffraction data definitely help in the assignment of the vibrational modes.Conflicts of interest
The authors have no conflicts to declare.Acknowledgements
A. M. and S. V. acknowledge funding from the Knut & Alice Wallenberg Foundation (an academy fellow grant, grant no. 2016-0220) and the Swedish Foundation for Strategic Research (SSF FFL-6, grant no. FFL-15 0092). S. C., P.-A. C. and M. S. acknowledge funding from the Knut & Alice Wallenberg Foundation (project grant, grant no. 2015-0058) as well as from the Swedish Research Council (VR, grant no. 2017-04811).References
- I. Diaz, E. Kokkoli, O. Terasaki and M. Tsapatsis, Surface Structure of Zeolite (MFI) Crystals, Chem. Mater., 2004, 16(25), 5226–5232 CrossRef CAS.
- H. Lermer, M. Draeger, J. Steffen and K.-K. Unger, Synthesis and structure refinement of ZSM-5 single crystals, Zeolites, 1985, 5(3), 131–134 CrossRef CAS.
- J. Lu, E. Bartholomeeusen, B. F. Sels and D. Schryvers, Internal architecture of coffin-shaped ZSM-5 zeolite crystals with hourglass contrast unravelled by focused ion beam-assisted transmission electron microscopy, J. Microsc., 2017, 265(1), 27–33 CrossRef CAS.
- E. Dib, T. Mineva, E. Veron, V. Sarou-Kanian, F. Fayon and B. Alonso, ZSM-5 Zeolite: Complete Al bond connectivity and implications on structure formation from solid-state NMR and quantum chemistry calculations, J. Phys. Chem. Lett., 2018, 9(1), 19–24 CrossRef CAS PubMed.
- A. Zheng, L. Chen, J. Yang, M. Zhang, Y. Su, Y. Yue, C. Ye and F. Deng, Combined DFT Theoretical Calculation and Solid-State NMR Studies of Al Substitution and Acid Sites in Zeolite MCM-22, J. Phys. Chem. B, 2005, 109(51), 24273–24279 CrossRef CAS PubMed.
- Z. Zhao, Y. Xing, S. Li, X. Meng, F.-S. Xiao, R. McGuire, A.-N. Parvulescu, U. Müller and W. Zhang, Mapping Al Distributions in SSZ-13 Zeolites from 23Na Solid-State NMR Spectroscopy and DFT Calculations, J. Phys. Chem. C, 2018, 122(18), 9973–9979 CrossRef CAS.
- V. A. Maroni, Analysis of the vibrational characteristics of zeolites using factor group methods, Appl. Spectrosc., 1988, 42(3), 487–493 CrossRef CAS.
- P. K. Dutta, D. C. Shieh and M. Puri, Correlation of framework Raman bands of zeolites with structure, Zeolites, 1988, 8(4), 306–309 CrossRef CAS.
- P. K. Dutta, K. M. Rao and J. Y. Park, Correlation of Raman spectra of zeolites with framework architecture, J. Phys. Chem., 1991, 95(17), 6654–6656 CrossRef CAS.
- A. J. M. de Man and R. A. van Santen, The relation between zeolite framework structure and vibrational spectra, Zeolites, 1992, 12(3), 269–279 CrossRef CAS.
- B. Mihailova, V. Engström, J. Hedlund, A. Holmgren and J. Sterte, Vibrational spectroscopy study of the structure of silicalite-1 films on a gold surface, Microporous Mesoporous Mater., 1999, 32(3), 297–304 CrossRef CAS.
- E. L. Uzunova and G. St. Nikolov, Vibrational Modes of Double Four-Member Rings of Oxygen-Bridged Silicon and Aluminum Atoms: A DFT Study, J. Phys. Chem. B, 2000, 104(31), 7299–7305 CrossRef CAS.
- Y. Yu, G. Xiong, C. Li and F.-S. Xiao, Characterization of aluminosilicate zeolites by UV Raman spectroscopy, Microporous Mesoporous Mater., 2001, 46(1), 23–34 CrossRef CAS.
- H. Mikosch, E. L. Uzunova and G. St. Nikolov, Vibrational Modes of Double Six-Membered Rings of Oxygen-Bridged Silicon and Aluminum Atoms in Zeolites: A DFT Study, J. Phys. Chem. B, 2004, 108(35), 13200–13207 CrossRef CAS.
- A. B. Mukhopadhyay, C. Oligschleger and M. Dolg, Low-frequency vibrational excitations in zeolite ZSM-5 and its partially crystalline derivatives, Phys. Rev. B: Condens. Matter Mater. Phys., 2004, 69(1), 012202 CrossRef.
- B. Mihailova, V. Valtchev, S. Mintova, A.-C. Faust, N. Petkov and T. Bein, Interlayer stacking disorder in zeolite beta family: a Raman spectroscopic study, Phys. Chem. Chem. Phys., 2005, 7(14), 2756–2763 RSC.
- S. Bordiga, C. Lamberti, F. Bonino, A. Travert and F. Thibault-Starzyk, Probing zeolites by vibrational spectroscopy, Chem. Soc. Rev., 2015, 44(20), 7262–7341 RSC.
- A. M. Mofrad, C. Peixoto, J. Blumeyer, J. Liu, H. K. Hunt and K. D. Hammond, Vibrational Spectroscopy of Sodalite: Theory and Experiments, J. Phys. Chem. C, 2018, 122(43), 24765–24779 CrossRef CAS.
- More explicitly, in that paper he wrote “…correct assignment of Raman active modes (even if the expected total number was actually observed) would be a near-to-impossible task, unless information of the type obtained from oriented single crystal laser Raman measurements were available”.
- C. Brémard and J. Laureyns, Polarized Single-Crystal Micro-Raman Spectroscopy of As-Synthesized Silicalite-1, Al MFI- and Fe MFI-Type Zeolites, J. Raman Spectrosc., 1996, 27(6), 439–445 CrossRef.
- C. Brémard and D. Bougeard, Raman scattering in zeolites and molecular sieves, Adv. Mater., 1995, 7(1), 10–25 CrossRef.
- I. Vergilov and V. Valtchev, Raman spectra of ZSM-39 single crystals, Zeolites, 1991, 11(4), 387–390 CrossRef CAS.
- V. V. Poborchii, A. V. Kolobov, J. Caro, V. V. Zhuravlev and K. Tanaka, Polarized Raman spectra of selenium species confined in nanochannels of AlPO4-5 single crystals, Chem. Phys. Lett., 1997, 280(1–2), 17–23 CrossRef CAS.
- W. Guo, D. Wang, J. Hu, Z. K. Tang and S. Du, Raman spectroscopy of iodine molecules trapped in zeolite crystals, Appl. Phys. Lett., 2011, 98, 043105 CrossRef.
- M. Tsuboi, J. M. Benevides and G. J. Thomas Jr., Raman tensors and their application in structural studies of biological systems, Proc. Jpn. Acad., Ser. B, 2009, 85(3), 83–97 CrossRef CAS PubMed.
- S. Frisk, R. M. Ikeda, D. B. Chase and J. F. Rabolt, A Determination of the Molecular Orientation of Poly(propylene terephthalate) Fibers Using Polarized Raman Spectroscopy: A Comparison of Methods, Appl. Spectrosc., 2004, 58(3), 279–286 CrossRef CAS PubMed.
- M. Tanaka and R. J. Young, Polarised Raman Spectroscopy for the study of molecular orientation distributions in polymers, J. Mater. Sci., 2006, 41(3), 963–991 CrossRef CAS.
- V. Sereda, N. M. Ralbovsky, M. C. Vasudev, R. R. Nalk and I. K. Lednev, A Polarized Raman Spectroscopy for Determining the Orientation of di-D-phenylalanine Molecules in a Nanotube, J. Raman Spectrosc., 2016, 47(9), 1056–1062 CrossRef CAS PubMed.
- X. Xu, Q. Song, H. Wang, P. Li, K. Zhang, Y. Wang, K. Yuan, Z. Yang, Y. Ye and L. Dai, In-Plane Anisotropies of Polarized Raman Response and Electrical Conductivity in Layered Tin Selenide, ACS Appl. Mater. Interfaces, 2017, 9(14), 12601–12607 CrossRef CAS PubMed.
- U. Ramabadran and B. Roughani, Intensity analysis of polarized Raman spectra for off axis single crystal silicon, Mater. Sci. Eng., B, 2018, 230, 31–42 CrossRef CAS.
- A. Congeduti, M. Nardone and P. Postorino, Polarized Raman spectra of a single crystal of iodine, Chem. Phys., 2000, 256(1), 117–123 CrossRef CAS.
- R. Loudon, The Raman effect in crystals, Adv. Phys., 2001, 50(7 Spec.), 813–864 CrossRef.
- Ö. Attila, H. E. King, F. Meirer and B. M. Weckhuysen., 3D Raman Spectroscopy of Large Zeolite ZSM-5 Crystals, Chem. – Eur. J., 2019, 25, 7158–7167 CrossRef PubMed.
- N. R. Camara, V. T. Phuoc, I. Monot-Laffez and M. Zaghrioui, Polarized Raman scattering on single crystals of rare earth orthochromite RCr = 3 (R = La, Pr, Nd, and Sm), J. Raman Spectrosc., 2017, 48(12), 1839–1851 CrossRef CAS.
- R. Szostak, V. Nair and T. Thomas, Incorporation and stability of iron in molecular-sieve structures. Ferrisilicate analogues of zeolite ZSM-5, J. Chem. Soc., Faraday Trans. 1, 1987, 83(2), 487–494 RSC.
- E. M. Flanigen, J. M. Bennett, R. W. Grose, J. P. Cohen, R. L. Patton, R. M. Kirchner and J. V. Smith, Silicalite, a new hydrophobic crystalline silica molecular sieve, Nature, 1978, 271(5645), 512–516 CrossRef CAS.
- http://www.cryst.ehu.es .
- G. E. Walrafen, Y. C. Chu and M. S. Hokmabadi, Raman spectroscopic investigation of irreversibly compacted vitreus silica, J. Phys. Chem., 1990, 92(12), 6987–7002 CrossRef CAS.
- J. Burgin, C. Guillon, P. Langot, F. Vallee, B. Hehlen and M. Foret, Vibrational modes and local order in permanently densified silica glasses: Femtosecond and Raman spectroscopy study, Phys. Rev. B: Condens. Matter Mater. Phys., 2008, 78(18), 184203 CrossRef.
- P. Umari, X. Gonze and A. Pasquarello, Concentration of small ring structures in vitreus silica from a first-principles analysis of the Raman spectrum, Phys. Rev. Lett., 2003, 90(2), 027401 CrossRef CAS PubMed.
- A. G. Revesz and G. E. Walrafen, Structural interpretations for some Raman lines from vitreus silica, J. Non-Cryst. Solids, 1983, 54(3), 323–333 CrossRef CAS.
- B. Hehlen, Inter-tetrahedra bond angle of permanently densified silicas extracted from their Raman spectra, J. Phys.: Condens. Matter, 2010, 22(2), 025401 CrossRef CAS.
- L. Svenningsson, Y.-C. Lin, M. Karlsson, A. Martinelli and L. Nordstierna, Molecular Orientation Distribution of Regenerated Cellulose Fibers Investigated with Polarized Raman Spectroscopy, Macromolecules, 2019, 52(10), 3918–3924 CrossRef CAS.
- D. H. Olson, G. T. Kokotailo, S. L. Lawton and W. M. Meier, Crystal Structure and Structure-Related Properties of ZSM-5, J. Phys. Chem., 1981, 85(15), 2238–2243 CrossRef CAS.
- To obtain the tensor coefficients the proportionality of the experimentally measured Raman intensity to the laser power, to the number of contributing molecular species under the focal volume, and to the square of the induced dipole were all considered. As an example, to estimate the relation between αxx and αyy the following was used: Ixx/Iyy = c·(αxx)2/c·(αyy)2, where the factor c is considered to be a constant throughout measurements performed at different configurations (c thus includes the number of molecular species illuminated during the measurement and the laser power).
- Y.-R. Luo. Bond dissociation energies, notendur.hi.is, 2010, pp. 65–98.
- S. Creci, X. Wang, P.-A. Carlsson and M. Skoglundh, Tuned Acidity for Catalytic Reactions: Synthesis and Characterization of Fe- and Al-MFI Zeotypes, Top. Catal., 2019, 62(7–11), 689–698 CrossRef CAS.
- P. Brauer, P. L. Ng, O. Situmorang, I. Hitchcock and C. D'Agostino, Effect of Al content on number and location of hydroxyl acid species in zeolites: a DRIFTS quantitative protocol without the need for molar extinction coefficients, RSC Adv., 2017, 7(83), 52604–52613 RSC.
Footnote |
| † Electronic supplementary information (ESI) available: Additional Raman spectra, peak-fit models used to extract Raman intensities, complete set of Raman tensor coefficients, additional polar plots, polar plots for the ZSM-5. See DOI: 10.1039/c9cp06199a |
| This journal is © the Owner Societies 2020 |