
 Open Access Article
 This Open Access Article is licensed under a Creative Commons Attribution-Non Commercial 3.0 Unported Licence
Calculation of vibrationally resolved absorption and fluorescence spectra of the rylenes†
Jonas
Greiner
 a and
Dage
Sundholm
*b
a and
Dage
Sundholm
*b
aInstitut für Physikalische Chemie, Johannes Gutenberg-Universität Mainz, Duesbergweg 10-14, D-55128 Mainz, Germany. E-mail: jgreiner@students.uni-mainz.de
bDepartment of Chemistry, University of Helsinki, P.O. Box 55 (A.I. Virtanens plats 1), FIN-00014 University of Helsinki, Finland. E-mail: Dage.Sundholm@helsinki.fi
First published on 7th January 2020
Abstract
A generating function method was used to simulate the vibrationally resolved absorption and emission spectra of perylene, terrylene and quaterrylene. This method operates on the basis of adiabatic excitation energies and electronic ground and excited state vibrational frequencies. These parameters were calculated using density functional theory with the PBE0 functional for perylene and terrylene and with the BH-LYP functional for quaterrylene. The vertical excitation energies of the lower excited states were calculated using functionals with differing amounts of Hartree–Fock exchange. The optimal functional for each molecule was chosen by comparing these energies to literature excitation energies. Using this technique the calculated absorption spectra and the calculated emission spectrum of perylene were found to be in excellent agreement with the literature experimental spectra after introducing a shift and a scaling factor. The most prominent bands of the absorption spectra were assigned to their respective vibronic transitions.
1 Introduction
Perylene, terrylene and quaterrylene form a homologous group of polycyclic aromatic hydrocarbons (PAHs), the rylenes. Derivatives of these compounds are well known for their photochemical properties and their consequent usage in dyes and pigments as they exhibit intense and broad visible and infrared light absorption and high quantum yield fluorescence.1 Well-known examples are the perylene monoimides and diimides. Modern optical applications such as organic photovoltaic cells,2,3 dye lasers4 and organic field effect transistors5 on the basis of rylene derivatives are also being studied. Therefore it is worth investigating the vibronically excited states of the parent structures. Another important property of the PAHs is their long photostability.6,7 It is postulated that these molecules and their cations are common in the interstellar medium8–11 and could therefore be the source for part of the diffuse interstellar bands (DIBs).12–15 The identification of the molecules that are responsible for the DIBs is possible through the comparison with low-temperature spectra with no solvent effects. Quantum chemical calculations facilitate the prediction of these low-temperature spectra.Photon absorption and fluorescence of molecules follow the Franck–Condon principle. The smaller the shift in nuclei positions induced by the electronic excitation, the higher the observed intensity of the transition.16,17 In the zero-temperature approximation only the vibronic ground state is populated; excitations can only occur from this state. Most molecules also follow Kasha's rule, i.e., photon emission occurs from the vibrational ground state of the lowest electronically excited state.18 Within these approximations, the vibronic structure of the absorption spectrum is only a function of the excited state vibrational spectrum, while the fluorescence spectrum is a function of the ground state vibrational spectrum. The theoretical investigation of the vibronic spectra of molecules is thus possible through the calculation of electronic ground and excited state geometries and vibrational frequencies within the harmonic approximation. The ground state energy and geometry is accessible through density functional theory (DFT) while the time-dependent variant (TD-DFT) is necessary to investigate the electronically excited states. The coupling between vibrational and electronic transitions can be simulated in the harmonic approximation by describing the geometrical and vibrational differences between the ground and excited states through the Duschinsky rotation.19 The geometric displacement and the Duschinsky rotation matrix are used to construct a generating function that allows the simulation of absorption and fluorescence spectra within the zero-temperature approximation. This method has been developed and implemented by Tapavicza et al.20,21 The simulated spectra can be compared with ultraviolet-visible (UV-Vis) absorption and fluorescence spectra measured by matrix isolation spectroscopy. Absorption spectra for the perylene, terrylene and quaterrylene molecules have been recorded by Halasinski et al.22 The absorption and fluorescence spectra of perylene have been recorded by Joblin et al.23
As with all DFT methods the choice of the correct functional is significant for the accuracy of the calculated results. This is especially true for photochemical applications. The amount of ‘exact’ HF exchange included in the hybrid correlation–exchange–functionals has a large influence on the TD-DFT vertical excitation energies and the resulting spectra as can be seen in the literature.24,25
2 Methods
All calculations were done using Turbomole26–28 with the Karlsruhe triple-zeta basis set with double polarization functions (def2-TZVPP)29 and the m5 grid.30 The functionals used are the TPSSh functional with 10% HF exchange,31–33 the B3-LYP functional with 20% HF exchange,34–36 the PBE0 functional with 25% HF exchange31,37,38 and the BH-LYP functional with 50% HF exchange.34,35,39 The symmetry of all molecules is D2h and they are oriented in the xy-plane. The ground state geometry was optimized using density functional theory (DFT)40 and the respective functionals. The optimized molecular structures are presented in Fig. 1. The vertical excitation energies were calculated from the ground state geometries using time-dependent density functional theory (TD-DFT).41–43 The excited state geometries were optimized using TD-DFT.40,43,44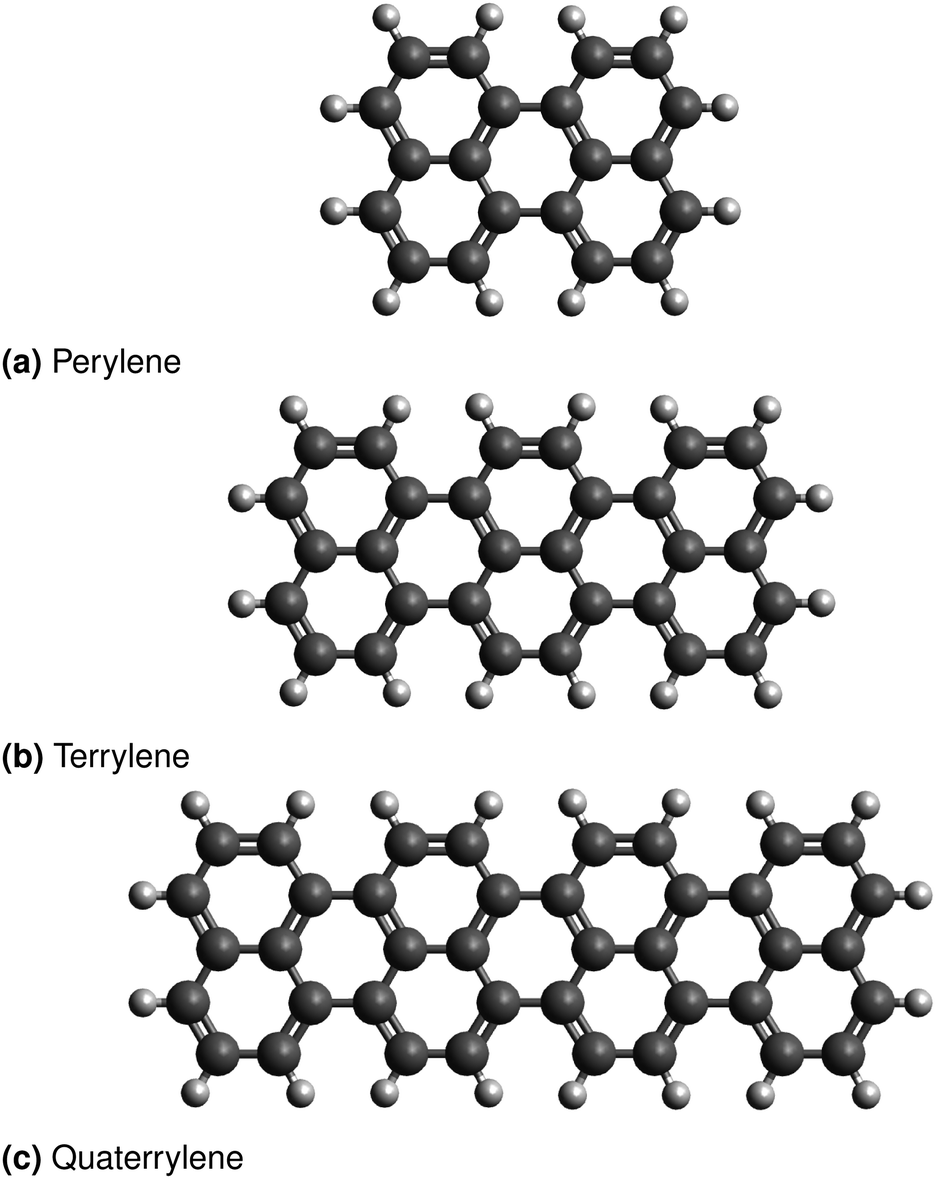 | ||
| Fig. 1 Molecular structures of the studied molecules. The graphics were created using Avogadro.45,46 | ||
The vibrational frequencies of the molecules in their ground state were calculated from the analytic second derivative of the energy using the AOFORCE module.47,48 The second derivatives of the excited state molecules were calculated numerically from the analytical gradients using the NUMFORCE module. The RADLESS module was used for the simulation of vibronic absorption and fluorescence spectra.20,21 The resolution of the calculated spectra can be raised by increasing the integration time. An integration time of 2.42 ps was found to be proficient for the comparison with the experimental spectra. Additionally, lifetime broadening can be employed to permit a visual comparison with the experimental spectra. The lifetime for the spectra of each molecule were chosen to reproduce the spectral widths observed in the respective experimental spectrum. The assignment of bands is easier with very narrow spectral widths. Therefore the absorption bands were assigned to a high-resolution spectrum with a lifetime of 2.42 ps and an integration time of 120.94 ps.
3 Results and discussion
3.1 Vertical excitation energies
To investigate the amount of HF exchange needed for the optimal prediction of the spectra, the vertical excitation energies of the two lowest B2u and B3u states were calculated using the TPSSh, B3-LYP, PBE0 and BH-LYP functionals. These transitions have a non-vanishing transition dipole moment and are therefore experimentally accessible. The excitation energies were calculated on the basis of the optimized ground state structures of the respective functional. The results are displayed in Table 1.| Molecule | State | DFT | Exp. | |||
|---|---|---|---|---|---|---|
| TPPSh | B3-LYP | PBE0 | BH-LYP | |||
| Perylene | 1B3u | 2.72 | 2.79 | 2.88 | 3.18 | 2.96 |
| 1B2u | 3.92 | 4.00 | 4.14 | 4.51 | ||
| 2B2u | 4.63 | 4.81 | 5.00 | 5.66 | ||
| 2B3u | 5.21 | 5.33 | 5.51 | 6.01 | ||
| Terrylene | 1B3u | 2.07 | 2.15 | 2.22 | 2.50 | 2.35 |
| 1B2u | 3.09 | 3.19 | 3.31 | 3.68 | ||
| 2B2u | 3.58 | 3.74 | 3.89 | 4.38 | ||
| 2B3u | 4.00 | 4.21 | 4.40 | 4.97 | ||
| Quaterrylene | 1B3u | 1.71 | 1.78 | 1.84 | 2.12 | 2.04 |
| 1B2u | 3.15 | 3.29 | 3.43 | 3.86 | ||
| 2B3u | 3.17 | 3.38 | 3.57 | 4.17 | ||
| 2B2u | 3.44 | 3.63 | 3.80 | 4.32 | ||
The most accurate energies are obtained using the PBE0 functional (25% HF exchange) for the perylene and terrylene molecules and using the BH-LYP functional (50% HF exchange) for the quaterrylene molecule. Therefore these respective functionals should yield the best results for the simulation of the absorption and emission spectra.
3.2 Absorption spectra
The functionals determined to accurately reproduce the experimental vertical excitation energies were used to calculate the equilibrium geometry, normal modes and vibrational frequencies of the ground state S0 and the first electronically excited state S1. The normal modes, vibrational frequencies, transition dipole moments as well as the ground and excited state energies at their respective equilibrium geometries make the calculation of vibronic absorption and fluorescence spectra possible. The calculated absorption spectra can be compared to the 4 K neon matrix isolation experimental spectra recorded by Halasinski et al.22All calculated absorption spectra are red-shifted compared to the measured spectrum. This difference must be attributed to the calculated adiabatic excitation energies which appear to be underestimated by the TD-DFT methodology. The calculated adiabatic excitation energies for the perylene, terrylene and quaterrylene molecules are 21![[thin space (1/6-em)]](https://www.rsc.org/images/entities/char_2009.gif) 796 cm−1 (2.70 eV), 16887 cm−1 (2.09 eV) and 15667 cm−1 (1.94 eV) respectively. The 0–0 band of the calculated spectra can be reproduced from the adiabatic excitation energies when the zero-point vibrational energies of the ground and excited states are accounted for. Additionally the experimental spectra of all three molecules include electronic transitions to higher excited states, which can be seen between 35000 cm−1 and 55000 cm−1 in the literature.22 These transitions have not been calculated and therefore cannot be compared. The energy intervals between the different bands are higher in the calculated spectra. In the experimental spectrum these intervals decrease with higher energies. The reason for this discrepancy is the usage of the harmonic approximation in the calculation which leads to overestimation of the vibrational energies, because anharmonic effects are not considered. The wavenumbers of the calculated spectrum can be scaled to the experimental spectrum to account for the error introduced by the harmonic approximation. The juxtaposition of the calculated spectra into the experimental spectra measured by Halasinski et al.22 is shown in Fig. 2.
796 cm−1 (2.70 eV), 16887 cm−1 (2.09 eV) and 15667 cm−1 (1.94 eV) respectively. The 0–0 band of the calculated spectra can be reproduced from the adiabatic excitation energies when the zero-point vibrational energies of the ground and excited states are accounted for. Additionally the experimental spectra of all three molecules include electronic transitions to higher excited states, which can be seen between 35000 cm−1 and 55000 cm−1 in the literature.22 These transitions have not been calculated and therefore cannot be compared. The energy intervals between the different bands are higher in the calculated spectra. In the experimental spectrum these intervals decrease with higher energies. The reason for this discrepancy is the usage of the harmonic approximation in the calculation which leads to overestimation of the vibrational energies, because anharmonic effects are not considered. The wavenumbers of the calculated spectrum can be scaled to the experimental spectrum to account for the error introduced by the harmonic approximation. The juxtaposition of the calculated spectra into the experimental spectra measured by Halasinski et al.22 is shown in Fig. 2.
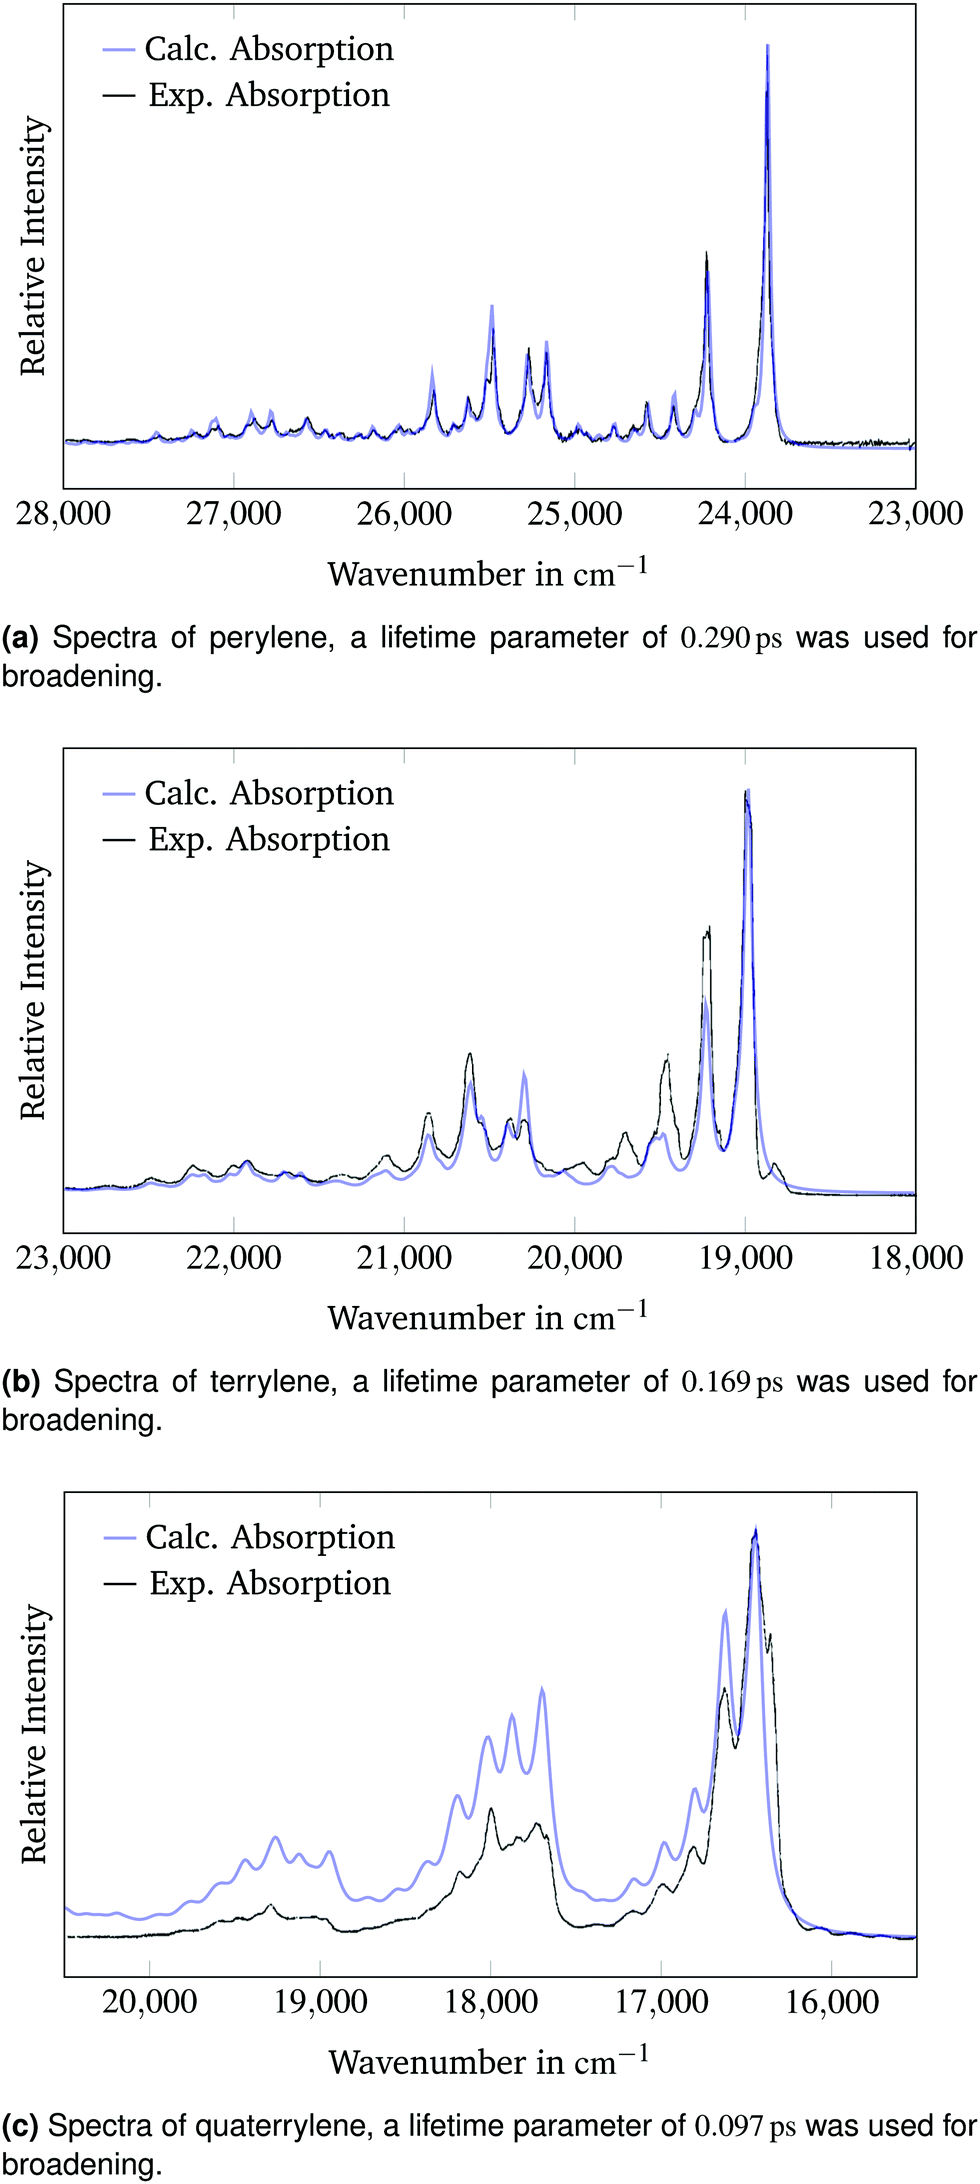 | ||
| Fig. 2 Calculated and experimental22 absorption spectra of the 1B3u state of perylene, terrylene and quaterrylene. The simulated spectra are scaled and shifted to match the experimental absorption spectra. | ||
The calculated spectra are shifted by 3380 cm−1, 3060 cm−1 and 2660 cm−1 to higher energies and scaled by a factor of 0.98, 0.99 and 0.93 respectively to make a qualitative comparison of the band structure possible.
When scaled and shifted, the calculated absorption spectrum of perylene in Fig. 2a matches the experimental spectrum precisely. The spectral widths of the experimental bands can be replicated accurately using lifetime broadening. This result underlines the potential of the generating function method to reproduce experimental spectra with high accuracy. Fig. 2a is a testament to the quality of both the experimental and the calculated spectrum. The calculated bands with a relative intensity of above 10% of the 0–0 band are reported in Table 2. The bands were assigned through comparison with the calculated vibrational spectrum of the excited state. Additionally, all bands with a relative intensity of above 2% of the 0–0 peak are reported and assigned in the ESI.† Joblin et al.23 matched the combination bands in their experimental spectrum to the respective simultaneously excited fundamental bands. For instance, they assigned the band at a shift of 1640 cm−1 to a combination of the bands at 348 cm−1 and 1293 cm−1 and the band at a shift of 1950 cm−1 to a combination of the bands at 348 cm−1 and 1601 cm−1. The assignment in Table 2 reaches the same conclusions when accounting for the harmonic approximation.
| Wavenumber (cm−1) | Shift (cm−1) | Relative intensity | Assignment |
|---|---|---|---|
| 20907 |
0 | 1.00 | |
| 21265 |
358 | 0.43 | 1ag |
| 21467 |
560 | 0.13 | 3ag |
| 22229 |
1321 | 0.25 | 8ag |
| 22346 |
1439 | 0.20 | 10ag |
| 22557 |
1649 | 0.31 | 13ag |
| 22586 |
1679 | 0.11 | 1ag + 8ag |
| 22914 |
2007 | 0.14 | 1ag + 13ag |
The comparison of the calculated absorption spectrum of terrylene to the experimental absorption spectrum in Fig. 2b shows small differences in the band intensities. All band intensities relative to the 0–0 peak appear to be underestimated in the simulated spectrum. The peaks from 19400 cm−1 to 20200 cm−1 are shifted to higher energies compared to the corresponding experimental bands. There is a distinct peak in the experimental spectrum at 18800 cm−1, which is red-shifted compared to the 0–0-band and has not been predicted in the calculated spectrum. A possible reason for these deviations from the experimental spectrum could be that the molecule occupies different sites within the neon matrix. This possibility has also been investigated by Halasinski et al.22 The different environment could result in a splitting of the peaks that is not predicted in the calculated spectrum of a free terrylene molecule. In spite of these discrepancies, there is good qualitative agreement between the simulated and the experimental spectrum. The calculated bands with a relative intensity of above 10% of the 0–0 band are reported in Table 3. The bands were assigned through comparison with the calculated vibrational spectrum of the excited state. Additionally, all bands with a relative intensity of above 2% of the 0–0 peak are reported and assigned in the ESI.†
| Wavenumber (cm−1) | Shift (cm−1) | Relative intensity | Assignment |
|---|---|---|---|
| 16035 |
0 | 1.00 | |
| 16283 |
248 | 0.45 | 1ag |
| 16532 |
497 | 0.10 | 2 × 1ag |
| 17355 |
1321 | 0.26 | 11ag |
| 17460 |
1425 | 0.11 | 14ag |
| 17604 |
1569 | 0.12 | 1ag + 11ag |
| 17682 |
1647 | 0.11 | 19ag |
There are larger differences between the calculated spectrum of the quaterrylene molecule and the experimental spectrum in Fig. 2c. The relative positions of the bands are well predicted by the simulated spectrum. The intensities of the calculated bands relative to the 0–0-band are larger in the calculated spectrum. The calculations seem to overestimate the intensities of the higher energy vibronic transitions for the quaterrylene molecule. The higher intensity of the predicted vibronic transitions in conjunction with the applied peak broadening also leads to a higher baseline at the higher energy side of the spectrum. The presence of small red-shifted bands next to the 0–0-band in the experimental spectrum could again be attributed to site-splitting effects22 in the neon matrix that have already been discussed for the terrylene molecule. The BH-LYP functional that was used for this calculation has 50% of HF exchange. This appears to reduce the shift necessary to compare the calculated spectrum to the experimental spectrum. This is not surprising since the TD-DFT method appears to underestimate adiabatic excitation energies while a functional with higher percentages of Hartree–Fock exchange overestimates the excitation energies as was shown in Table 1, leading to possible error cancellation. The calculated bands with a relative intensity of above 10% of the 0–0 band are reported in Table 4. The bands were assigned through comparison with the calculated vibrational spectrum of the excited state. Additionally, all bands with a relative intensity of above 2% of the 0–0 peak are reported and assigned in the ESI.†
| Wavenumber (cm−1) | Shift (cm−1) | Rel. intensity | Assignment |
|---|---|---|---|
| 14821 |
0 | 1.00 | |
| 14877 |
55 | 0.11 | 2 × 1au |
| 15015 |
194 | 0.72 | 1ag |
| 15209 |
388 | 0.26 | 2 × 1ag |
| 15401 |
579 | 0.12 | 5ag |
| 16164 |
1342 | 0.50 | 14ag |
| 16358 |
1536 | 0.37 | 1ag + 14ag |
| 16513 |
1692 | 0.12 | 25ag |
| 16551 |
1730 | 0.15 | 2 × 1ag + 14ag |
| 17506 |
2685 | 0.13 | 2 × 14ag |
Some of the low-frequency non-totally symmetric bands (1au, 2au, 1b2g, 1b3g, 1b1u and 8b2g) from the excited state vibrational spectra contribute to the electronic absorption spectra of terrylene and quaterrylene as totally symmetric combination bands. These combination bands also combine with other totally symmetric bands as can be seen in the ESI.† The calculation of quantitatively correct bands in the absorption and emission spectra is difficult using TD-DFT as the prediction of the appropriate functional is crucial. TD-DFT also appears to underestimate the adiabatic excitation energies. This could be improved through usage of an ab initio method such as CC2 or ADC(2).49 The different scaling of the band intervals is introduced through the harmonic approximation and can only be alleviated through the calculation of anharmonic corrections to the vibrational frequencies. To achieve this the numerical calculation of higher order energy derivatives to construct high order force constant matrices is needed. Both of these measures are coupled to higher computational costs for large molecules.
3.3 Fluorescence spectra
The fluorescence spectra can be calculated from the ground and excited state energies at their respective equilibrium geometries and from the ground and excited state vibrational frequencies. These parameters were calculated for all three molecules using the appropriate functionals. Unfortunately experimental spectra are only available for the perylene molecule from Joblin et al.23 A lower lifetime parameter of 0.145 ps was used to simulate the perylene spectra, because the spectral widths of these experimental spectra are larger. Both the absorption and the fluorescence spectra are scaled by a factor of 0.98 and shifted by 3380 cm−1 analogously to Section 3.2 and the result is presented in Fig. 3.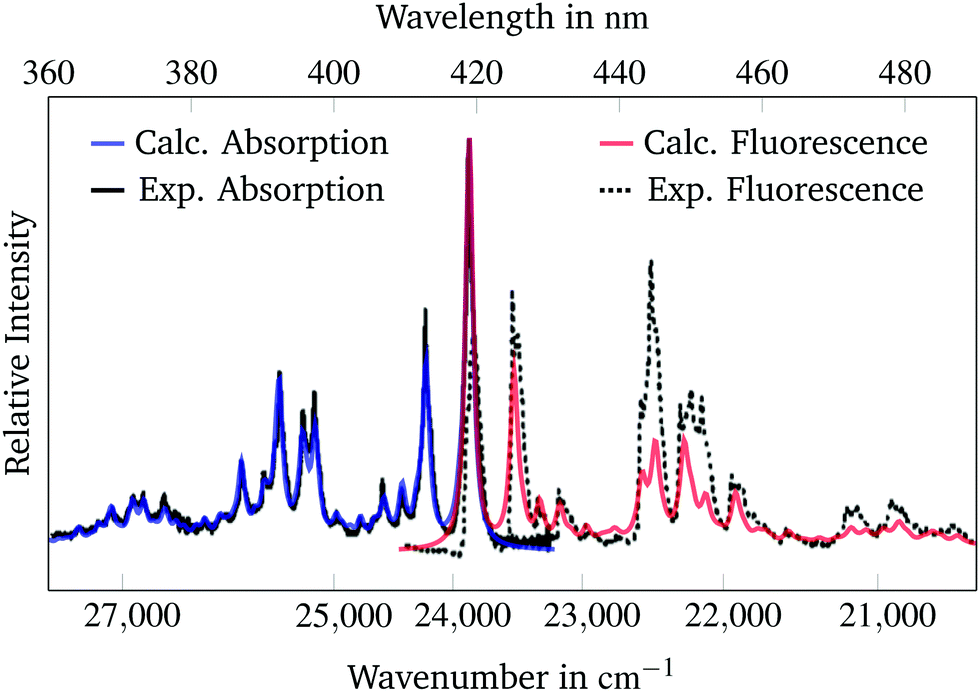 | ||
| Fig. 3 Calculated and experimental23 absorption and fluorescence spectra of the 1B3u state of perylene. The simulated spectra are scaled and shifted to match the experimental spectra. A lifetime parameter of 0.145 ps was used for broadening of the calculated spectra. | ||
As is to be expected from Section 3.2 there is high agreement between the experimental and the simulated absorption spectra. The simulated bands are able to reproduce the band structure of the experimental spectrum precisely. The position of the calculated fluorescence spectrum bands match those of the experimental spectrum. The spectral widths and heights of the bands are smaller than in the experimental spectrum. It appears as if the experimental fluorescence spectrum has larger spectral widths than the experimental absorption spectrum. Therefore the spectral widths and intensities could not be accurately reproduced by the calculated fluorescence spectrum. Overall, the position of the bands in the absorption and the fluorescence spectra are well predicted by the used methodology.
Fig. 4 presents the calculated absorption and emission spectra of all three molecules. No shift or scaling is applied in these figures. The lifetime parameters from Section 3.2 were used for all calculations.
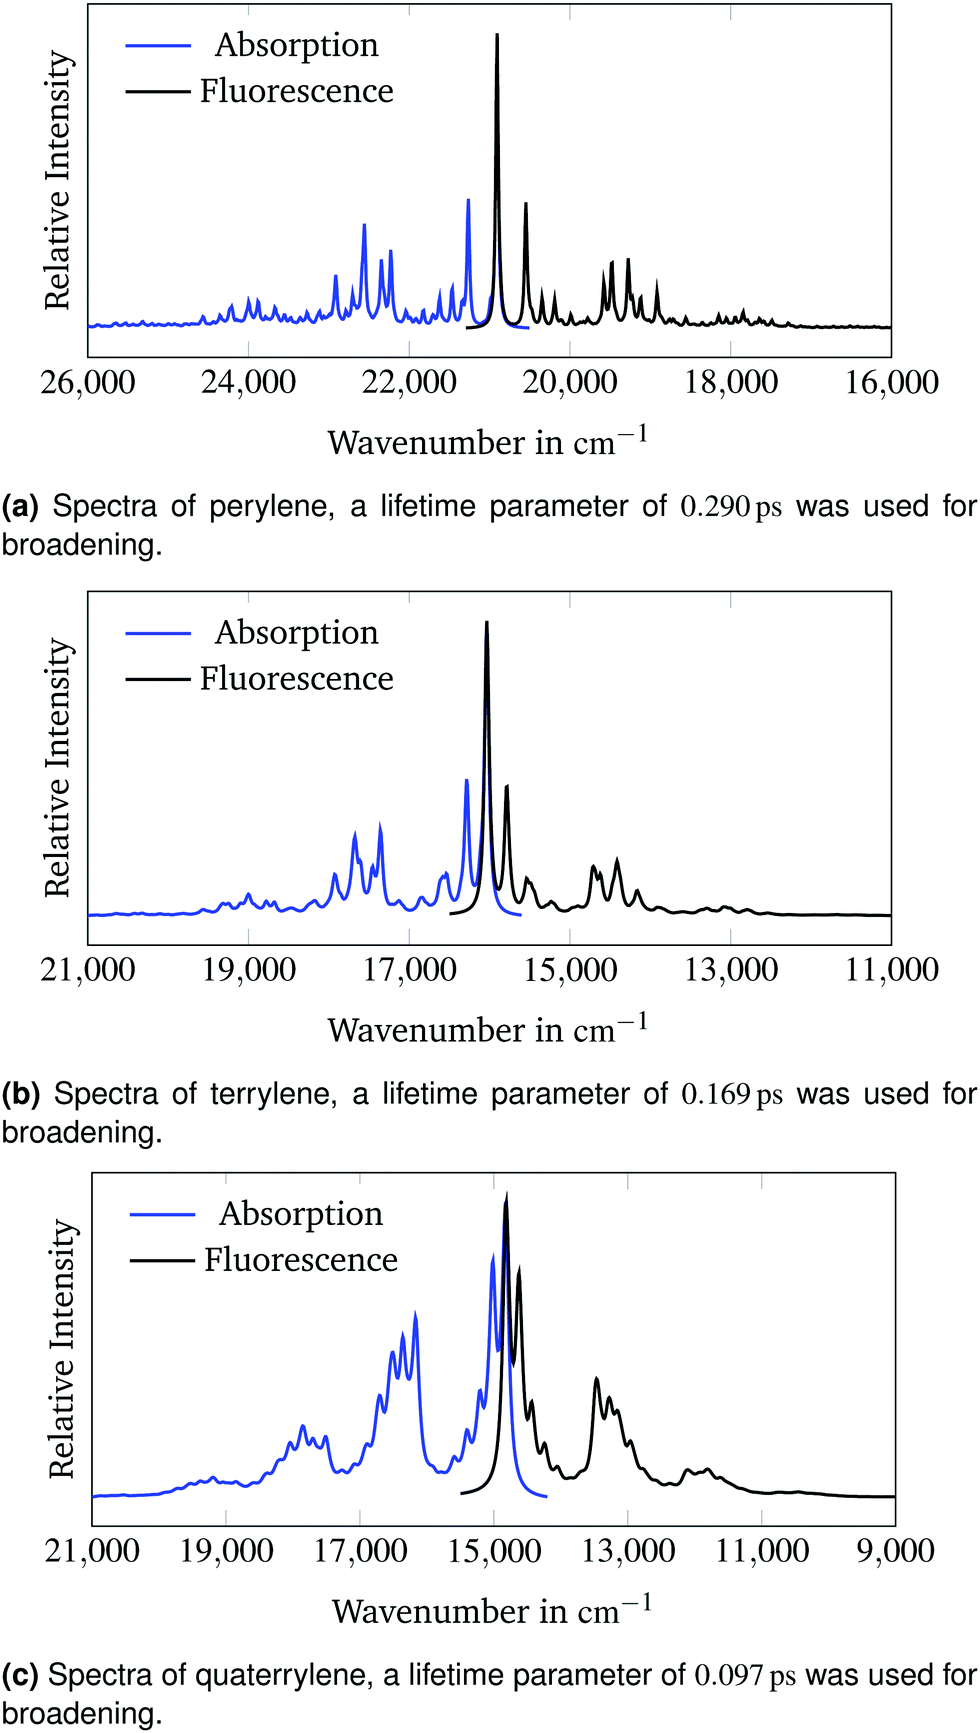 | ||
| Fig. 4 Calculated absorption and fluorescence spectra of the 1B3u state of perylene, terrylene and quaterrylene. | ||
The calculated spectra are very symmetrical. The emission band intensities are lower than the respective intensities of the absorption bands. The 0–0-band has the highest intensity in all spectra. Therefore according to the Franck–Condon principle16,17 the predicted change in molecular geometry upon adiabatic electronic excitation is small which conforms with the rigid structure of the polyaromatic hydrocarbons.50Fig. 4c clarifies why the baseline of the calculated spectrum in Fig. 2c appears to be raised on the high-energy side compared to the low-energy side of the spectrum. The calculated spectrum in Fig. 2c is cut off between two sets of overlapping vibronic transitions. The minimum between the transitions at around 18600 cm−1 is raised due to broadening of the neighbouring peaks. This effect is not observed in the experimental spectrum as the last set of bands is not visible due to lower experimental band intensities.
4 Conclusion
The vertical excitation energies of three rylene molecules were calculated using TD-DFT. It was found that the percentage of exact Hartree–Fock exchange contained in the hybrid functional has a high effect on the accuracy of the calculated vertical excitation energies. There appears to be an optimal amount of Hartree–Fock exchange between 30% and 40% with a trend to higher percentages for larger polyaromatic molecules with smaller HOMO–LUMO gaps. These results were used to choose the optimal functional for the calculation of the absorption and emission spectra.The simulated absorption spectra and their comparability to the experimental spectra of the rylenes validate the used methods and are a testament to their capability of describing the change in molecular geometry and molecular vibrations upon electronic excitation. Especially for perylene a high agreement between the simulation and the experiment was found. For the larger rylenes there were deviations from the experimental spectra. Some of these deviations are presumed to be a result of the experimental conditions of the matrix-isolation spectroscopic experiment. The bands of the simulated spectra were assigned to vibronic transitions using the calculated excited state vibrational spectra.
The fluorescence spectra were calculated using the same methodology as the absorption spectra. It was found that the calculated fluorescence spectrum of perylene is in good agreement with the experimental spectrum. Unfortunately there are no comparison spectra for terrylene and quaterrylene available in the literature. The accuracy of the simulated fluorescence spectra could therefore not be assessed.
The generating function approach shows a lot of potential for the simulation of vibrationally resolved absorption and emission spectra of the polyaromatic hydrocarbons. The experimental spectra can be replicated with high accuracy which underlines that the consideration of Duschinsky effects19 within the Franck–Condon approximation16,17 is enough to accurately describe the studied molecules while Herzberg–Teller vibronic coupling effects51 can be neglected.52 The only faults of the used methodology stem from the inability of TD-DFT to produce quantitatively accurate excitation energies and from the usage of the harmonic approximation to calculate molecular vibrations which makes shifting and scaling of the calculated spectra necessary for the qualitative comparison with the experiment. Conveniently this generating function technique is independent of the quantum chemical method used to calculate the required energies and could therefore be combined with more accurate procedures such as CC2 or ADC(2).49
Conflicts of interest
There are no conflicts to declare.Acknowledgements
This work has been supported by the Academy of Finland through project 314821, the Swedish Cultural Foundation in Finland, and Magnus Ehrnrooth Foundation. J. G. thanks the ERASMUS+ SMP program for financial support. We thank Isaac Benkyi and Enrico Tapavicza for helpful discussions. The CSC – the Finnish IT Center for Science and the Finnish Grid and Cloud Infrastructure (persistent identifier urn:nbn:fi:research-infras-2016072533) are acknowledged for computer time.References
- C. Huang, S. Barlow and S. R. Marder, J. Org. Chem., 2011, 76, 2386–2407 CrossRef CAS PubMed.
- C. Li and H. Wonneberger, Adv. Mater., 2012, 24, 613–636 CrossRef CAS PubMed.
- E. Kozma and M. Catellani, Dyes Pigm., 2013, 98, 160–179 CrossRef CAS.
- M. Sadrai and G. R. Bird, Opt. Commun., 1984, 51, 62–64 CrossRef CAS.
- X. Zhan, A. Facchetti, S. Barlow, T. J. Marks, M. A. Ratner, M. R. Wasielewski and S. R. Marder, Adv. Mater., 2010, 23, 268–284 CrossRef PubMed.
- L. Zhao, R. Lian, I. A. Shkrob, R. A. Crowell, S. Pommeret, E. L. Chronister, A. D. Liu and A. D. Trifunac, J. Phys. Chem. A, 2004, 108, 25–31 CrossRef CAS.
- A. M. Tokmachev, M. Boggio-Pasqua, D. Mendive-Tapia, M. J. Bearpark and M. A. Robb, J. Chem. Phys., 2010, 132, 044306 CrossRef PubMed.
- T. P. Snow, Spectrochim. Acta, Part A, 2001, 57, 615–626 CrossRef CAS.
- T. P. Snow, V. L. Page, Y. Keheyan and V. M. Bierbaum, Nature, 1998, 391, 259–260 CrossRef CAS PubMed.
- L. J. Allamandola, G. G. M. Tielens and J. R. Barker, Astrophys. J., Suppl. Ser., 1989, 71, 733–775 CrossRef CAS PubMed.
- J. L. Puget and A. Léger, Annu. Rev. Astron. Astrophys., 1989, 27, 161–198 CrossRef CAS.
- D. M. Hudgins and L. J. Allamandola, Astrophys. J., 1999, 513, L69–L73 CrossRef CAS PubMed.
- F. Salama, E. L. O. Bakes, L. J. Allamandola and A. G. G. M. Tielens, Astrophys. J., 1996, 458, 621–636 CrossRef CAS PubMed.
- F. Salama, G. A. Galazutdinov, J. Krełowski, L. J. Allamandola and F. A. Musaev, Astrophys. J., 1999, 526, 265–273 CrossRef CAS PubMed.
- A. Omont, H. F. Bettinger and C. Tönshoff, Astron. Astrophys., 2019, 625, A41 CrossRef CAS.
- J. Franck and E. G. Dymond, Trans. Faraday Soc., 1926, 21, 536–542 RSC.
- E. Condon, Phys. Rev., 1926, 28, 1182–1201 CrossRef CAS.
- M. Kasha, Discuss. Faraday Soc., 1950, 9, 14–19 RSC.
- F. Duschinsky, Acta Physicochim. URSS, 1937, 7, 566 Search PubMed.
- E. Tapavicza, F. Furche and D. Sundholm, J. Chem. Theory Comput., 2016, 12, 5058–5066 CrossRef CAS PubMed.
- I. Benkyi, E. Tapavicza, H. Fliegl and D. Sundholm, Phys. Chem. Chem. Phys., 2019, 21, 21094–21103 RSC.
- T. M. Halasinski, J. L. Weisman, R. Ruiterkamp, T. J. Lee, F. Salama and M. Head-Gordon, J. Phys. Chem. A, 2003, 107, 3660–3669 CrossRef CAS.
- C. Joblin, F. Salama and L. Allamandola, J. Chem. Phys., 1999, 110, 7287–7297 CrossRef CAS.
- M. Dierksen and S. Grimme, J. Phys. Chem. A, 2004, 108, 10225–10237 CrossRef CAS.
- P. H. P. Harbach and A. Dreuw, in Modeling of Molecular Properties, ed. P. Comba, Wiley VCH Verlag GmbH, 1st edn, 2011, ch. 3, pp. 29–47 Search PubMed.
- TURBOMOLE V7.4 2019, a development of University of Karlsruhe and Forschungszentrum Karlsruhe GmbH, 1989–2007, TURBOMOLE GmbH, since 2007; available from http://www.turbomole.com.
- R. Ahlrichs, M. Bär, M. Häser, H. Horn and C. Kölmel, Chem. Phys. Lett., 1989, 162, 165–169 CrossRef CAS.
- F. Furche, R. Ahlrichs, C. Hättig, W. Klopper, M. Sierka and F. Weigend, WIREs Comput. Mol. Sci., 2013, 4, 91–100 CrossRef.
- F. Weigend and R. Ahlrichs, Phys. Chem. Chem. Phys., 2005, 7, 3297–3305 RSC.
- K. Eichkorn, F. Weigend, O. Treutler and R. Ahlrichs, Theor. Chem. Acc., 1997, 97, 119–124 Search PubMed.
- J. P. Perdew and Y. Wang, Phys. Rev. B: Condens. Matter Mater. Phys., 1992, 45, 13244–13249 CrossRef PubMed.
- J. Tao, J. P. Perdew, V. N. Staroverov and G. E. Scuseria, Phys. Rev. Lett., 2003, 91, 146401 CrossRef PubMed.
- V. N. Staroverov, G. E. Scuseria, J. Tao and J. P. Perdew, J. Chem. Phys., 2003, 119, 12129–12137 CrossRef CAS.
- A. D. Becke, Phys. Rev. A: At., Mol., Opt. Phys., 1988, 38, 3098–3100 CrossRef CAS PubMed.
- C. Lee, W. Yang and R. G. Parr, Phys. Rev. B: Condens. Matter Mater. Phys., 1988, 37, 785–789 CrossRef CAS PubMed.
- A. D. Becke, J. Chem. Phys., 1993, 98, 5648–5652 CrossRef CAS.
- J. P. Perdew, M. Ernzerhof and K. Burke, J. Chem. Phys., 1996, 105, 9982–9985 CrossRef CAS.
- J. P. Perdew, K. Burke and M. Ernzerhof, Phys. Rev. Lett., 1996, 77, 3865–3868 CrossRef CAS PubMed.
- A. D. Becke, J. Chem. Phys., 1993, 98, 1372–1377 CrossRef CAS.
- O. Treutler and R. Ahlrichs, J. Chem. Phys., 1995, 102, 346–354 CrossRef CAS.
- M. Casida and M. Huix-Rotllant, Annu. Rev. Phys. Chem., 2012, 63, 287–323 CrossRef CAS PubMed.
- R. Bauernschmitt and R. Ahlrichs, Chem. Phys. Lett., 1996, 256, 454–464 CrossRef CAS.
- D. R. F. Furche, in Theoretical and Computational Chemistry, ed. M. Olivucci, Elsevier Science, 2005, vol. 16, ch. III Search PubMed.
- F. Furche and R. Ahlrichs, J. Chem. Phys., 2002, 117, 7433–7447 CrossRef CAS.
- Avogadro: an open-source molecular builder and visualization tool, Version 1.2.0, 2017, https://protect-eu.mimecast.com/s/GfgpCzvwXtJ9j5c4kqhf?domain=avogadro.cc.
- M. D. Hanwell, D. E. Curtis, D. C. Lonie, T. Vandermeersch, E. Zurek and G. R. Hutchison, J. Cheminf., 2012, 4, 17 CAS.
- P. Deglmann, F. Furche and R. Ahlrichs, Chem. Phys. Lett., 2002, 362, 511–518 CrossRef CAS.
- P. Deglmann and F. Furche, J. Chem. Phys., 2002, 117, 9535–9538 CrossRef CAS.
- C. Hättig, Advances in Quantum Chemistry, Elsevier, 2005, pp. 37–60 Search PubMed.
- R. Rieger and K. Müllen, J. Phys. Org. Chem., 2010, 315–325 CAS.
- G. Herzberg and E. Teller, Z. Phys. Chem., Abt. B, 1933, 21, 410–446 Search PubMed.
- F. Santoro, A. Lami, R. Improta, J. Bloino and V. Barone, J. Chem. Phys., 2008, 128, 224311 CrossRef PubMed.
Footnote |
| † Electronic supplementary information (ESI) available: The Cartesian ground and excited state coordinates of the optimized molecular structures, the oscillator strengths of the vertical excitations and the calculated ground and excited state harmonic frequencies of the studied molecules are given as supporting information. All assigned bands in the calculated absorption spectra with a relative intensity of above 2%. See DOI: 10.1039/c9cp06089h |
| This journal is © the Owner Societies 2020 |