 Open Access Article
Polarizable MD simulations of ionic liquids: How does additional charge transfer change the dynamics?
Christian
Schröder
 a,
Alex
Lyons
b and
Steven W.
Rick
 *b
*b
aUniversity of Vienna, Faculty of Chemistry, Department of Computational Biological Chemistry, A-1090 Vienna, Austria
bUniversity of New Orleans, Department of Chemistry, New Orleans, LA 70148, USA. E-mail: srick@uno.edu
First published on 22nd November 2019
Abstract
Both experimental and computational evidence exist that Coulomb interactions between the molecular ions in ionic liquids are significantly damped by almost a factor of two. This circumstance is often used to justify charge scaling. However, as polarizable MD simulations are also capable of explaining the reduced Coulomb interaction between the ionic liquid ions [C. Schröder, Phys. Chem. Chem. Phys., 2012, 14, 3089], the question arises, if the reduced Coulomb interactions are due to a charge transfer between the molecules or due to an overall effect of induced dipolar interactions. We aim to contribute to this discussion using polarizable MD simulations of 1-ethyl-3-methylimidazolium tetrafluoroborate including a new model for treating charge transfer between the cations and anions. The diffusion time scales are not changed significantly with the inclusion of charge transfer, but individual ions show a strong dependence on charge transfer amounts. Ions which have transferred more charge, and have a charge with a smaller magnitude, diffuse slower. The charge transfer model shows a slightly larger conductivity, despite having smaller charges, and shows a much stronger contribution of the anions to the conductivity. With charge transfer, the anions become the dominant species for charge transport, while the polarizable models show a roughly equal contribution from the anions and the cations.
Room temperature ionic liquids (ILs), composed of an organic cation and an organic or inorganic anion, are an interesting class of solvents, with applications including electrolyte solutions in batteries and capacitors, lubricants, and solvents for synthesis and catalysis.1,2 Significant effort has gone into the simulation of these liquids and a variety of potentials have been developed for ILs.3–16 Non-polarizable models, similar to what is commonly used in the simulation of aqueous solutions and proteins, can accurately reproduce a number of properties,4–6 but tend to underestimate diffusion rates.7,10,16–18 Polarizable models for ILs using point inducible dipoles,7,9,17 fluctuating charges,13,14 and Drude oscillators11 give better dynamical properties and it is not surprising given the large electric fields created by the ions that polarizability is important.19 A group of non-polarizable potentials uses reduced charges on the ions, so that each ion has a charge of ±0.7 e to ±0.9 e.4,8,12,18,20,21 These models, which will have weaker Coulombic interactions, have faster dynamics, closer to the polarizable models and experimental results. This charge reduction is taken as an adjustable parameter8,18,20 or as an easy method to account for polarizability.22 A comparison of charge scaled to polarizable models has shown that the charge scaled approach does not completely capture the dynamics of ILs, especially at the local level.18,19
Scaled charges have been used in models for aqueous ions.22–25 For both, ILs4,12,21,26–28 and aqueous ions,29–33 the reduction in charge in the scaled charge models is consistent with the amount of charge transfer (CT) between particles determined from ab initio calculations. Computational studies have shown that the charge transfer between particles influences the dynamics of water in salt solutions34–36 and ILs.37 Experimental studies with X-ray photoelectron spectroscopy (XPS)28 and two-dimensional infrared (2D-IR) spectroscopy38 indicate the interactions between the ions in ionic liquids are influenced by CT. The importance of CT for ion-water and water–water interactions are seen in IR,39–41 Raman,42–44 and X-ray absorption45 spectroscopy.
The experimental and ab initio studies both indicate the significance of CT on the properties on ILs. In this paper, we describe a new model for treating CT effects that builds on earlier work developing CT models for water46–48 and ions.32,49–52 What makes this CT approach different from the charge scaling methods for ionic liquids is that our method transfers charge between particle pairs based on their separation. The charge of a particle will depend on its local environment and will fluctuate. The amount of charge transfer is determined from ab initio calculations. The model is also polarizable, using the Drude oscillator approach. Using this model, we will examine how charge transfer influences the structure and dynamics of the IL with the 1-ethyl-3-methylimidazolium cation, C2mim+, and the tetrafluoroborate anion, BF4−.
1 Methods
1.1 The charge transfer model
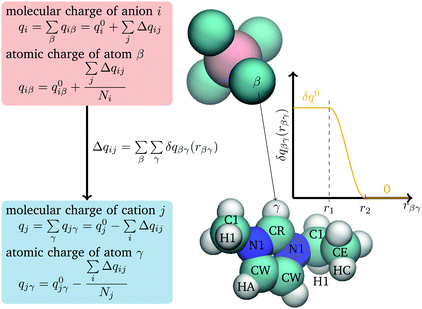
Charge transfer in the model is treated using a method adapted from the Discrete Charge Transfer (DCT) method developed previously.46 Previous DCT applications have been applied to molecules with interacting through hydrogen bonds, e.g. water,46–48 and the hydroxide or hydronium ions,51 or monatomic ions.32,50 Here, we extend the approach to polyatomic ions. In this approach, charge is transferred between two ions, i and j, based on the distance between atoms on the two ions, | (1) |
Following the other DCT models, the charge transferred, δqβγ, is taken to be a constant, δq0, at small separations, and to smoothly go to zero at large separations, as given by
 | (2) |
The total charge qi(t) on a molecular ion i is then the formal charge of that ion, q0i, plus all the charge that is transferred to other ions,
 | (3) |
 | (4) |
 | (5) |
 and μ0i is the dipole moment of the molecule before charge transfer. Using the ion's center as the origin means
  equals zero, so μi will equal μ0i.
Charge is only transferred between ions of opposite charge and it transferred from the anion to the cation. To keep things simple, only heavy atoms on the C2mim+ cation and fluorine atoms on BF4− anion are used in eqn (1) and the parameters (δq0, r1, and r2) are taken to be the same for all atom pairs. (The charges of all atoms are modified through eqn (4).)
In addition to the change in the electrostatic interactions, there is a charge transfer energy ECT, for each amount of charge transferred, given by
| ECT(t) = −μCT·|δqβγ(t)| | (6) |
This CT method introduces four parameters (δq0, r1, r2, and μCT). Density functional theory (DFT) calculations with the M06-2X functional54 and aug-cc-pVTZ basis sets, using the program Gaussian,55 determined the distance dependence of the amount of charge transfer between pairs.
Pair geometries were generated by varying the distance along a coordinate in the plane of the imidazolium ring in the direction outward from the CR atom and in a direction perpendicular to the ring, moving outward from the ring center (Fig. 1). The acidic CH points directly towards the B atom along the bisector of the F–B–F angle. Other pair geometries were taken from liquid simulations. Charge was determined both with the Bader atoms in molecules (AIM) method56 using the AIMALL program,57 and the CHELPG electrostatic potential fitting method,58 as implemented by Gaussian. Comparing to these results it was found that an upper limit of charge transfer, r2, of 4.8 Å is consistent with the distance at which the DFT calculations find that the charge transfer between pairs goes to zero. The charge transfer parameters δq0 and r1 were chosen to reproduce the liquid states charges as calculated by Mondal and Balasubramanian.21 Using configurations of the liquid generated from molecular dynamics simulations, charges were determined, using the density-derived electrostatic and chemical (DDEC)59 charge partitioning method, which is based on AIM. This method gave ions with average charges equal to ±0.79 e.21 Values of δq0 = 0.0050 e and r1 equal to 4.0 Å were found to reproduce the Mondal and Balasubramanian results, giving an average charge of ±0.77 e. The final parameter, μCT, was adjusted to give the correct liquid density at 298 K. This gives a value of μCT equal to 162.0 kcal mol−1e−1.
1.2 Polarizable model using Drude oscillators
The Drude model treats polarizability using the Drude oscillator method, in which charge are placed on harmonic springs attached to heavy atoms.19 The Lennard-Jones parameters, partial charges qFFiβ, and bonded parameters for bond stretches, bends, and torsions, are all taken from the polarizable force field of ref. 60 which is based on the non-polarizable force field of Canongia Lopes and Pádua.5 In the polarizable model, the dipoles are induced by the charges, as well as the other dipoles. Since our CT model has smaller charges, the induced dipoles will also be smaller. To compensate for this, the polarizabilities αiβ were increased by a factor of s = 1.04 by increasing the Drude charge. With this change, the dipole moment distributions of the models with and without charge transfer almost coincide (see Fig. 2), making comparisons between the two models easier. For additional comparison, the dipole distributions of a scaled charge model are also depicted. For the dipole calculation, the charge scaling was removed as this procedure can be considered as a poor man's way to take an average polarizability into account.18,22 The corresponding shift of the maxima of the dipole distributions between using the scaled/full charges for analysis are shown as horizontal black arrows in Fig. 2.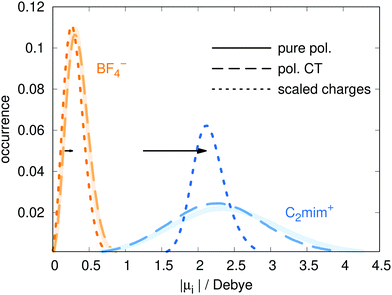 | ||
| Fig. 2 The distribution of dipole moments for the pure polarizable model (ref. 60, solid line), the polarizable CT model (dashed line) and the non-polarizable scaled charge model (dotted line). In case of the non-polarizable scaled charge model, the black arrows depict the shift due to using full charges for analysis resulting in the dotted blue and orange distributions for the cations and anions, respectively. | ||
All mobile Drude particles have mass of 0.2 amu, which was subtracted from the mass of the heavy atom associated with that particle. The partial charge qDiβ of the mobile Drude particle is defined by:
 | (7) |
| Atom type | q FF iβ [e] | α iβ [Å3] | q D iβ [e] | α iβ [Å3] | q D iβ [e] | |
|---|---|---|---|---|---|---|
| Pure pol. | Pol. CT | |||||
| BF4− | Boron | 0.8276 | 1.186 | −1.336 | 1.233 | −1.363 |
| Fluorine | −0.4569 | 0.400 | −0.776 | 0.416 | −0.792 | |
| C2mim+ | NA | 0.150 | 1.123 | −1.300 | 1.168 | −1.326 |
| CR | −0.110 | 1.578 | −1.542 | 1.641 | −1.572 | |
| CW | −0.130 | 1.578 | −1.542 | 1.641 | −1.572 | |
| HA | 0.210 | |||||
| C1 (methylene) | −0.170 | 1.788 | −1.641 | 1.860 | −1.674 | |
| C1 (methyl) | −0.170 | 1.998 | −1.735 | 2.078 | −1.769 | |
| H1 | 0.130 | |||||
| CE | −0.050 | 1.998 | −1.735 | 2.078 | −1.769 | |
| HC | 0.060 | |||||
As the hydrogen cannot be made polarizable, their polarizability is added to the heavy atom to which they are attached to. Consequently, the polarizability for the atom with the atom type C1 depends on the number of bonded hydrogen. The terminal C1 has three hydrogen and consequently a slightly higher polarizability than the C1 carbon of the CH2-group.
The non-polarizable scaled charge simulations were performed using a constant charge scaling factor of 0.77. As the command “SCALAR CHARGE MULT 0.77 SELE ALL END” causes dubious simulation artifacts in CHARMM, the partial charges were already scaled in the topology file.
1.3 Computational setup
All molecular dynamics simulations were performed using the program CHARMM,61 version 38b1, which we modified to include the charge transfer algorithm. The modified routines will be shared on request with other CHARMM users. The Lennard-Jones interactions smoothly were truncated between a distance of 10 to 11 Å and the particle mesh Ewald (PME) method was used for long-ranged electrostatic interactions with a real-space cut-off of 14 Å and a k-space damping constant of 0.41 Å. All bonds were constrained with SHAKE.All simulations were run with a time step of 0.5 fs at a temperature of 300 K, using a Nosé–Hoover thermostat, with a relaxation time equal to 0.1 ps. In case of the polarizable force fields, the Drude positions were thermostated at a temperature of 1 K with a relaxation time equal to 5 fs. Simulations for parameter optimization were run for at least 1 ns.
The initial configuration of 500 ion pairs in a periodic box of an initial length of 52 Å was generated by PACKMOL62 and equilibrated after a short steepest descent energy minimization for 500 ps at constant pressure of 1 atm using an Andersen barostat with a relaxation time equal to 0.2 ps yielding the densities in Table 2. Dynamical properties were generated in the canonical, NVT ensemble during production runs of 4 ns and 8 ns for polarizable CT and the pure polarizable as well as the non-polarizable scaled charge simulations, respectively. Structures for ensemble averages and time correlation functions were saved every 200 steps.
| Pure pol. | Pol. CT | Scaled charges | Experiment | |
|---|---|---|---|---|
| a These simulations were performed at constant volume with the density of the pure polarizable simulations to avoid additional density effects. b The dipole distributions in Fig. 2 were fitted by a Gaussian and its standard deviation. Selected properties of all models are given on Table 2. | ||||
| ρ [g cm−3] | 1.232 | 1.279 | 1.232a | 1.28063 |
| ΔHvap [kcal mol−1] | 44.7 | 43.8 | 32.2 | 35.664 |
| 〈μ⊕〉b [Debye] | 2.4 ± 0.7 | 2.3 ± 0.7 | 2.1 ± 0.2 | |
| 〈μ⊖〉b [Debye] | 0.4 ± 0.2 | 0.4 ± 0.2 | 0.3 ± 0.1 | |
| D ⊕ [10−8 cm2 s−1] | 24 | 28 | 26 | 5365 |
| D ⊖ [10−8 cm2 s−1] | 19 | 22 | 18 | 4465 |
| σ(0) [S m−1] | 0.43 | 0.55 | 1.1 | 1.5566 |
2 Results
Selected properties of all models are given on Table 2. By parameterization, the density of the charge transfer model is in good agreement with experiment.63 As the pure polarizable model60 was not optimized in this respect, a small discrepancy of 3% was detected. For the heat of vaporization, the agreement is not as good but reasonable. Please note that the heat of vaporization is difficult to measure experimentally, since the vapor pressure is so low, and different methods, including surface tension, Knudsen, and temperature programmed desorption, can lead to values that differ by 10 kcal mol−1 or more.67,68 Simulations find a range of values, from 27.8 kcal mol−1,69 29.4 kcal mol−1,12 32.3 kcal mol−1,9 to 43.5 kcal mol−1.702.1 Electrostatic properties
The model was parameterized to have similar dipoles to the pure polarizable model. The distributions of dipole moments for the ionic liquid as given by the charge transfer and the pure polarizable models are shown in Fig. 2 and look very similar. The distributions of molecular charges |qi| is shown in Fig. 3. All cations and anions have an absolute charge value less than one with a standard deviation of about 0.08 e. Interestingly, the cationic distribution looks like a Gaussian. In case of the anions, the distribution is skewed allowing for very low molecular anionic charges of qi < −0.7 e. The average charge was parameterized to be ±0.77 e, in agreement with the DFT-derived charges of Mondal and Balasubramanian.21 The distribution of charges qi(t), resulting from differing local geometries, is one obvious difference from the non-polarizable, scaled charge models, which would have the same charge qi at all times.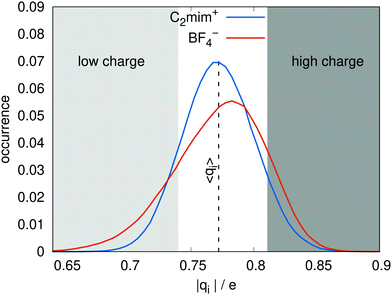 | ||
| Fig. 3 The distribution of ion charges qi for the charge transfer model. The vertical dashed line corresponds to the average charge 〈qC2mim〉 = − 〈qBF4〉 = 0.77 e. | ||
The charges can deviate from their average values for relatively long periods of time, reflecting the long time scales to change an ion's local environment (see Fig. 4a and b). There are short time-scale fluctuations, on the order of 0.25 ps, and a longer time relaxation of the charges. The time scale for this relaxation can be determined by calculating the charge–charge autocorrelation function,
 | (8) |
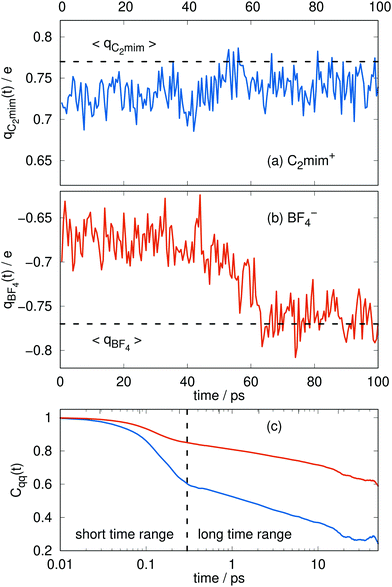 | ||
| Fig. 4 Typical time series for the molecular charge qi(t) of the cations (a) and the anions (b). The dashed line corresponds to the average of Fig. 3. The respective charge-charge autocorrelation function for the cations (blue) and the anions (orange) is plotted in (c). | ||
2.2 Structure of the ionic liquid
The radial distribution functions g(r) between the centers-of-mass of the ions in Fig. 5 using the polarizable charge transfer model (orange dashed line), the non-polarizable scaled charge model (black dotted line) and the pure polarizable model (gray solid line, ref. 60) are fairly similar. In case of the radial distribution functions of ions of like charge, i.e. g++(r) and g−−(r), the pure polarizable model shows minor differences with the CT model in the first solvation shell probably due to π–π stacking of the imidazolium rings. For a more detailed analysis, we considered imidazoliums with a center-of-mass/center-of-mass distance of less than 5 Å and to have significant π–π-interactions. The angle θ(t) was computed via vectors which are perpendicular to the imidazolium rings respectively. A second Legendre polynomial of cos
![[thin space (1/6-em)]](https://www.rsc.org/images/entities/char_2009.gif) θ(t) larger than 0.90 corresponds to angles 0° ≤ θ(t) ≤ 15° (above the reference imidazolium ring) or 165° ≤ θ(t) ≤ 180° (below the reference imidazolium ring). The numbers in Fig. 5b represent the average number of parallel imidazolium pairs per time frame and the total number of imidazolium pairs per time frame which are 5 Å apart. As already visible in g++(r) the total number in case of the pure polarizable force field is higher. Overall roughly 20% of the imidazolium pairs fulfill our criterion on parallel rings in all force field models.
θ(t) larger than 0.90 corresponds to angles 0° ≤ θ(t) ≤ 15° (above the reference imidazolium ring) or 165° ≤ θ(t) ≤ 180° (below the reference imidazolium ring). The numbers in Fig. 5b represent the average number of parallel imidazolium pairs per time frame and the total number of imidazolium pairs per time frame which are 5 Å apart. As already visible in g++(r) the total number in case of the pure polarizable force field is higher. Overall roughly 20% of the imidazolium pairs fulfill our criterion on parallel rings in all force field models.
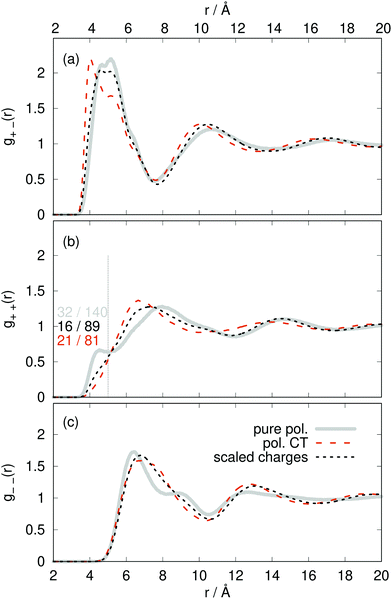 | ||
| Fig. 5 Radial distribution functions g(r) between the ion center-of-masses comparing pure polarizable model (solid line), the polarizable CT (dashed line) and the scaled charge model (dotted line). | ||
The increased number of pairs in the pure polarizable model may be due to the fact that the repulsion between ions of the same species is realized by an inner solvent effect.18,19,22 Here, the induced dipoles act as an additional solvent to screen the partial charges and thereby reducing the repulsion. However, this dielectric continuum theory works for larger distances which may be violated by ions which are direct neighbors. In case of the polarizable CT and the non-polarizable scaled charge model the reduced repulsion is simply governed by the sub-integer charges. In principle, the π–π stacking is not parametrized in the force field. As the partial charges of the reference imidazolium ring atoms are higher on average in the pure polarizable system than for the other two force fields, the induced dipoles of nearby imidazolium ring atoms are more attracted in this case which may enhance the overall number of pairs and hence the number of π–π stacking pairs.
2.3 Transport properties of the ionic liquid
The diffusion constants in Table 2 are calculated from the slope of the mean-square displacement of the center-of-mass of each ion 〈Δri(t)2〉 after 900 ps which should correspond to the diffusive regime. A system size correction71,72 is made, which adds a term to the diffusion constant equal to 2.837 kBT/(6πη L), where kB is Boltzmann's constant, L is the simulation box length, and η is the viscosity. We use the experimental value of η equal to 29.7 mPa s.65 With an average box length equal to 50.5 Å, this gives a correction equal to 4.2 × 10⁻⁸ cm2 s−1. The computational diffusion coefficients are about a factor of two too small compared to the experimental values.65 This may be due to the fact that the Lennard-Jones parameter of the polarizable force field have not been changed when adding polarizability. This results in a double counting of dispersion19 as the dispersion was already parametrized for the non-polarizable force field and the interaction of the induced dipoles further increases the dispersion interactions. A scaling scheme for the Lennard-Jones well depth has been used for polarizable simulations of ionic liquids, which lead to increased the conductivity (and hence the overall dynamics) by a factor of almost four in case of C2mim triflate and C2mim dicyanamide.73 However, in order to compare the non-polarizable scaled charge model, the polarizable CT and the pure polarizable simulation in this work, we use the same Lennard-Jones parameters for all simulations so that all differences are due to electrostatic interactions. Non-polarizable full-charge models are about an order of magnitude too small in dynamics.7,10,16,18,19,74As visible in Table 2 we find for all models in agreement with experiment that the C2mim+ ions diffuse faster, despite being heavier. Reliable estimates of the error bars for the diffusion constants would require longer simulations than carried out here.75 However, the pure polarizable model gives diffusion constants that are slightly smaller than the polarizable CT and non-polarizable scaled charge model but within the range of the statistical uncertainty. Additional information about translational motion is given by the velocity–velocity autocorrelation functions, as defined by
 | (9) |
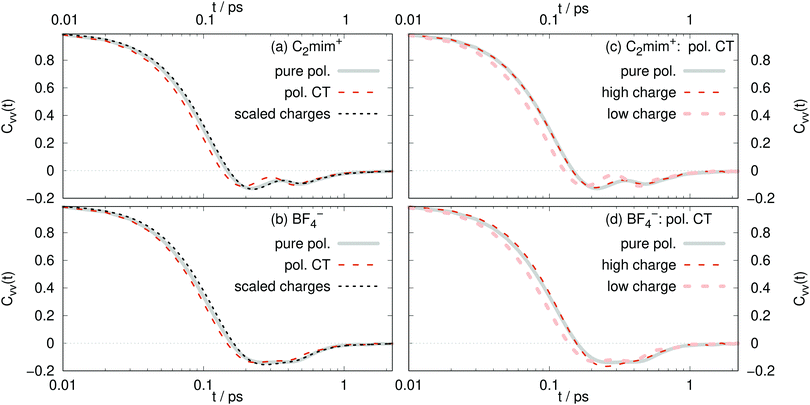
There is not a big difference between various models as visible in Fig. 6a and b. From the short-time dependence of Cvv(t), the mean-squared-forces 〈F2〉 can be found according to
 | (10) |
| |qi| [e] | 〈F2〉 [(10−6 N)2] | D [10−8 cm2 s−1] | |||
|---|---|---|---|---|---|
| C2mim+ | BF4− | C2mim+ | BF4− | ||
| Pure polarizable | = 1.00 | 0.50 | 0.36 | 24 | 19 |
| Polarizable CT | |||||
| All ions | <1.00 | 0.53 | 0.39 | 28 | 22 |
| High charge | >0.81 | 0.49 | 0.32 | ||
| Low charge | <0.74 | 0.62 | 0.44 | ||
| Scaled charges | = 0.77 | 0.47 | 0.33 | 26 | 18 |
As expected, the 〈F2〉 for the pure polarizable model and the polarizable CT model with absolute molecular charges close to 1 e reasonably agree with each other. Also the forces acting on the scaled charge ions are similar to the pure polarizable model which means that the inner solvent screening of the induced dipoles can be reproduced by scaled charges. However, 〈F2〉 acting on polarizable CT ions with low absolute molecular charge differ significantly from those acting on the scaled charge ions. This underlines the fact that non-polarizable scaled charge models are not appropriate to model charge transfer.
For the CT model, the ions with larger charges diffuse faster, with less backscattering, and experience smaller mean forces (Table 3) than those with smaller charges. This is counter-intuitive to what might be expected. Ions with decreased charges should have smaller forces and diffuse faster, as is found in the scaled charge models. The high charge ions diffuse faster due to the mechanism of charge transfer. These ions have larger charges (so closer to ±1 e) because they are transferring less charge to neighboring, oppositely-charged ions. Therefore, the ions with larger charges are in a less confined environment and those with smaller charges (in magnitude) are in a more cage-like geometry. This is consistent with a strong correlation between local environments with high number density and slow diffusion, as described recently.78
According to eqn (10) stronger mean-square forces on the molecules lead to faster decay of the corresponding velocity autocorrelation functions. One interpretation involves bounce effects of a strong surrounding ion cage.76 Increased interactions with the ion cage – a larger 〈F2〉 – would lead to increased librational motion and hindered translations of the ion in its cage. Consequently, the velocity autocorrelation function relaxes very fast. However, this tight ion cage will hamper the diffusion of the central ion and hence a decrease in diffusion coefficients should be observed. This is the case for polarizable simulations of Lithium doped 1-ethyl-3-methylimidazolium bis(trifluoromethylsulfonyl)imide.76 However, all our simulations find that the C2mim+ ions feel stronger forces than BF4− despite the fact that the cations diffuse faster. Interestingly, the ratio of the mean-square-forces of cations and anions is similar to the ratio of diffusion coefficients.
Another way to interpret the decay of 〈vi(0)·vi(t)〉 is a loss of memory effect. Memory can be of a collective nature as ionic liquids are known to be organized in spatial and dynamically heterogeneous domains. Applying hole theory to describe the conductivity in ionic liquids,79,80 the emergence of a suitable hole for the jumping ion is not only a function of the ion but also of the collective motion of the surrounding ions. From the point of view of the jumping ion, the drag forces towards the hole are random and consequently the memory of its former velocity decays rapidly. In this new local environment, new partners for charge transfer exist driving the ion in a new direction.
Another mechanism may also explain the coexistence of high mean-square forces and high mobility of the ions.75,81 In a coarse-grained simulation of the mixture of [C2mim][BF4] and [C2mim] triflate, the mobile ions were not randomly distributed, but associated into clusters of mobile particles, resulting in much higher radial distribution functions for like-charged ions for example. Here, the electrostatic repulsion of the low charge ions in Table 3 is weaker resulting in a stronger force keeping this clusters together.
2.4 Conductivity
Information about collective motion of the ions can be given by the charge current and total charge dynamics.82,83 The electric current J(t) is given by | (11) |
 | (12) |
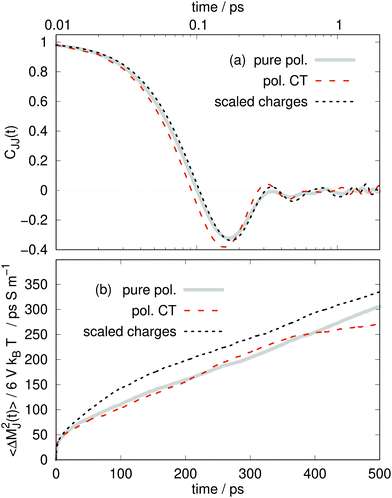 | ||
| Fig. 7 (a) Electric current time autocorrelation function. (b) Mean-squared displacement of the collective translational dipole moment. | ||
Interestingly, the negative “rebound” regime in Fig. 7a of the collective CJJ(t) is much more pronounced than for the molecular Cvv(t) with a deeper first minima, around 0.16 ps.
The static conductivity σ(0) can be obtained from the mean-square displacement of the collective translational dipole,83 which is statistically more reliable compared to the integration of the current-current correlation function. The collective translational dipole of a particular species k is defined by
 | (13) |
 | (14) |
At times beyond the correlation time of the CJJ(t), approximately 100 ps in this work, the mean-square displacement of MJ(t) becomes linear83
| 〈ΔMJ2(t)〉 = 〈(MJ(0) − MJ(t))2〉 | (15) |
∝ 6![[thin space (1/6-em)]](https://www.rsc.org/images/entities/char_2009.gif) V kBTσ(0)·t. V kBTσ(0)·t. | (16) |
| 〈ΔMJ2(t)〉 = 〈ΔM⊕J(t)·ΔMJ(t)〉 + 〈ΔM⊖J(t)·ΔMJ(t)〉 | (17) |
〈ΔM⊕J(t)·ΔMJ(t)〉 ∝ 6![[thin space (1/6-em)]](https://www.rsc.org/images/entities/char_2009.gif) V kBTσ⊕(0)·t V kBTσ⊕(0)·t | (18) |
〈ΔM⊖J(t)·ΔMJ(t)〉 ∝ 6![[thin space (1/6-em)]](https://www.rsc.org/images/entities/char_2009.gif) V kBTσ⊖(0)·t V kBTσ⊖(0)·t | (19) |
| σ(0) [S m−1] | σ ⊕(0) [S m−1] | σ ⊖(0) [S m−1] | σ NE [S m−1] | |
|---|---|---|---|---|
| Pure pol. | 0.43 | 0.19 | 0.24 | 1.00 |
| Pol. CT | 0.55 | 0.06 | 0.49 | 1.20 |
| Scaled charges | 0.36 | 0.16 | 0.20 | 1.06 |
So far, we have seen an amazing coincidence of the structural and dynamical results of the pure polarizable, the polarizable CT and the scaled charge model. The even better agreement between the pure polarizable and the scaled charge model points out that: First, one should use full charges for analysis as the scaling only mimics an averaged polarizability effect and not charge transfer. Second, as long as one is interested in mesoscopic properties like the static conductivity, charge scaled models are capable of reproducing results from polarizable simulations as noted previously.18 However, we expected local electrostatic interactions to be different in polarizable and charge scaled simulations since the dielectric continuum theory18,22 is not valid anymore at short distances between the interacting charges.
Does charge transfer change the dynamics? At first glance, the answer is no. Pure polarizable simulations seem to be capable of reproducing the structure and dynamics of the CT simulations, although the molecular charges differ significantly, i.e. qpoli = ±1 e and 〈qCTi(t)〉 = ±0.77 e. The different response of the induced dipoles in both cases leads in the end to similar results.
However, at second glance, there is a difference between polarizable charge transfer and pure polarizable simulations as visible in Table 4. The partial conductivities σ⊕(0) and σ⊖(0) are noticeably different among the models. The difference in the cation and anion conductivities are much more pronounced for the CT model, for which σ⊕(0) is much smaller than σ⊖(0).
Comparing the individual contributions to the overall conductivity σ(0), the pure polarizable and the scaled charge simulations predict only a minor enhancement for the anions. Similar results are found for tetrafluoroborate and dicyanamide.75 However, in the polarizable CT simulations the anions become the dominant species for charge transport. Here, the cations play only a minor role. Since the Nernst–Einstein conductivity σNE
 | (20) |
3 Conclusions
Our pure polarizable, charge scaled and polarizable charge transfer MD simulations resulted in very similar structure and dynamics of the ionic liquid 1-ethyl-3-methylimidazolium tetrafluoroborate. The agreement between the pure polarizable and the charge scaled simulations using full charges for analysis demonstrates that the charge scaling mimics an average polarizability rather than charge transfer in ionic liquids. Charge transfer effects in ionic liquids seem to be very subtle. Given that charge transfer amounts depend on the ion pairs,21,28,37 these effects may be different for other ILs. Charge transfer seems to depend more on the identity of the anion than the cation,21,28 and is larger for monatomic ions like chloride than for polyatomic ions,21,37 so these effects could be greater for other ILs. One major discrepancy between the pure polarizable and the polarizable charge transfer simulations was detected for the partial conductivities. Ions can have charges that deviate from average values for about 100 ps (Fig. 4). On this time scale, ions which have transferred more charge, and have an overall charge with a smaller magnitude, diffuse slower than those with a larger charge.Conflicts of interest
There are no conflicts to declare.Acknowledgements
This work was supported by the National Science Foundation under contract number CHE-0611679.Notes and references
- P. Wasserscheid, Nature, 2006, 439, 797 CrossRef CAS.
- R. D. Rogers, Nature, 2007, 447, 917–918 CrossRef CAS.
- C. J. Margulis, H. A. Stern and B. J. Berne, J. Phys. Chem. B, 2002, 106, 12017–12021 CrossRef CAS.
- T. I. Morrow and E. J. Maginn, J. Phys. Chem. B, 2002, 106, 12807–12813 CrossRef CAS.
- J. N. Canongia Lopes, J. Deschamps and A. A. H. Pádua, J. Phys. Chem. B, 2004, 108, 2038–2047 CrossRef.
- M. G. Del Pópolo and G. A. Voth, J. Phys. Chem. B, 2004, 108, 1744–1752 CrossRef.
- T. Yan, C. J. Burnham, M. G. Del Pópolo and G. A. Voth, J. Phys. Chem. B, 2004, 108, 11877–11881 CrossRef CAS.
- T. G. A. Youngs and C. Hardacre, ChemPhysChem, 2008, 9, 1548–1558 CrossRef CAS.
- O. Borodin, J. Phys. Chem. B, 2009, 113, 11463–11478 CrossRef CAS.
- E. J. Maginn, J. Phys.: Condens. Matter, 2009, 21, 373101 CrossRef CAS.
- C. Schröder and O. Steinhauser, J. Chem. Phys., 2010, 133, 154511 CrossRef.
- V. V. Chaban, I. V. Voroshylova and O. N. Kalugin, Phys. Chem. Chem. Phys., 2011, 13, 7910 RSC.
- A. O. Cavalcante, M. C. C. Ribeiro and M. S. Skaf, J. Chem. Phys., 2014, 140, 144108 CrossRef.
- Y. Wu, Y. Li, N. Hu and M. Hong, Phys. Chem. Chem. Phys., 2014, 16, 2674 RSC.
- M. Campetella, L. Gontrani, F. Leonelli, L. Bencivenni and R. Caminiti, Chem. Phys. Chem., 2014, 16, 197–203 CrossRef.
- M. Salanne, Phys. Chem. Chem. Phys., 2015, 17, 14270–14279 RSC.
- O. Borodin and G. D. Smith, J. Phys. Chem., 2006, 110, 11481–11490 CrossRef CAS.
- C. Schröder, Phys. Chem. Chem. Phys., 2012, 14, 3089 RSC.
- D. Bedrov, J.-P. Piquemal, O. Borodin, A. D. MacKerell Jr., B. Roux and C. Schröder, Chem. Rev., 2019, 119, 7940–7995 CrossRef CAS.
- M. Kohagen, M. Brehm, Y. Lingscheid, R. Giernoth, J. Sangoro, F. Kremer, S. Naumov, C. Iacob, J. Kärger, R. Valiullin and B. Kirchner, J. Phys. Chem. B, 2011, 115, 15280–15288 CrossRef CAS.
- A. Mondal and S. Balasubramanian, J. Phys. Chem. B, 2014, 118, 3409–3422 CrossRef CAS.
- I. Leontyev and A. Stuchebrukhov, Phys. Chem. Chem. Phys., 2011, 13, 2613–2626 RSC.
- L. Pegado, O. Marsalek, P. Jungwirth and E. Wernersson, Phys. Chem. Chem. Phys., 2012, 14, 10248–10257 RSC.
- Z. R. Kann and J. L. Skinner, J. Chem. Phys., 2014, 141, 104507 CrossRef CAS.
- J. Li and F. Wang, J. Chem. Phys., 2015, 143, 194505 CrossRef.
- M. Bühl, A. Chaumont, R. Schurhammer and G. Wipff, J. Phys. Chem. B, 2005, 109, 18591–18599 CrossRef.
- J. Schmidt, C. Krekeler, F. Dommert, Y. Zhao, R. Berger, L. Delle Site and C. Holm, J. Phys. Chem. B, 2010, 114, 6150–6155 CrossRef CAS.
- T. Cremer, C. Kolbeck, K. R. J. Lovelock, N. Paape, R. Wölfel, P. S. Schulz, P. S. Wasserscheid, H. Weber, J. Thar, B. Kirchner, F. Maier and H. P. Steinrück, Chem. – Eur. J., 2010, 16, 9018–9033 CrossRef CAS PubMed.
- M. Dal Peraro, S. Raugei, P. Carloni and M. L. Klein, Chem. Phys. Chem., 2005, 6, 1715–1718 CrossRef CAS.
- Z. Zhao, D. M. Rogers and T. L. Beck, J. Chem. Phys., 2010, 132, 014502 CrossRef.
- S. Varma and S. B. Rempe, Biophys. J., 2010, 99, 3394–3401 CrossRef CAS.
- M. Soniat and S. W. Rick, J. Chem. Phys., 2012, 137, 044511 CrossRef.
- B. Sellner, M. Valiev and S. M. Kathmann, J. Phys. Chem. B, 2013, 117, 10869–10882 CrossRef CAS.
- Y. Yao, Y. Kanai and M. L. Berkowitz, J. Phys. Chem. Lett., 2014, 5, 2711–2716 CrossRef CAS.
- Y. Yao, M. L. Berkowitz and Y. Kanai, J. Chem. Phys., 2015, 143, 241101 CrossRef.
- M. Nguyen and S. W. Rick, J. Chem. Phys., 2018, 148, 222803 CrossRef.
- O. Hollóczki, F. Malberg, T. Welton and B. Kirchner, Phys. Chem. Chem. Phys., 2014, 16, 16880 RSC.
- T. Brinzer, E. J. Berquist, Z. Ren, S. Dutta, C. A. Johnson, C. S. Krishner, D. S. Lambrecht and S. Garrett-Roe, J. Chem. Phys., 2015, 142, 212425 CrossRef.
- P. Ayotte, C. G. Bailey, G. H. Weddle and M. A. Johnson, J. Phys. Chem. A, 1998, 102, 3067–3071 CrossRef CAS.
- W. H. Thompson and J. T. Hynes, J. Am. Chem. Soc., 2000, 122, 6278–6286 CrossRef CAS.
- S. G. Ramesh, S. Re and J. T. Hynes, J. Phys. Chem. A, 2008, 112, 3391–3398 CrossRef CAS.
- D. E. Wu, S. Duan, X. M. Liu, Y. C. Xu, Y. X. Jiang, B. Ren, X. Xu, S. H. Lin and Z. Q. Tian, J. Phys. Chem. A, 2008, 112, 1313–1321 CrossRef CAS.
- Q. Wan, L. Spanu, G. A. Galli and F. Gygi, J. Chem. Theory Comput., 2013, 9, 4124–4130 CrossRef CAS PubMed.
- D. Sidler, M. Meuwly and P. Hamm, J. Chem. Phys., 2018, 148, 244504 CrossRef PubMed.
- C. D. Cappa, J. D. Smith, B. M. Messer, R. C. Cohen and R. J. Saykally, J. Phys. Chem. B, 2006, 110, 5301–5309 CrossRef CAS PubMed.
- A. J. Lee and S. W. Rick, J. Chem. Phys., 2011, 134, 184507 CrossRef.
- C. D. Wick, A. J. Lee and S. W. Rick, J. Chem. Phys., 2012, 137, 154701 CrossRef.
- S. W. Rick, J. Comput. Chem., 2016, 37, 2060–2066 CrossRef CAS.
- M. Soniat and S. W. Rick, J. Chem. Phys., 2014, 140, 184703 CrossRef.
- M. Soniat, L. Hartman and S. W. Rick, J. Chem. Theory Comput., 2015, 11, 1658–1667 CrossRef CAS.
- M. Soniat, R. Kumar and S. W. Rick, J. Chem. Phys., 2015, 143, 044702 CrossRef.
- M. Soniat, G. Pool, L. Franklin and S. W. Rick, Fluid Phase Equilib., 2015, 407, 31–38 CrossRef.
- J. P. Piquemal, A. Marquez, O. Parisel and C. Giessner-Prettre, J. Comput. Chem., 2005, 26, 1052–1062 CrossRef CAS.
- Y. Zhao and D. G. Truhlar, Theor. Chem. Acc., 2008, 120, 215–241 Search PubMed.
- M. J. Frisch, G. W. Trucks, H. B. Schlegel, G. E. Scuseria, M. A. Robb, J. R. Cheeseman, G. Scalmani, V. Barone, B. Mennucci, G. A. Petersson, H. Nakatsuji, M. Caricato, X. Li, H. P. Hratchian, A. F. Izmaylov, J. Bloino, G. Zheng, J. L. Sonnenberg, M. Hada, M. Ehara, K. Toyota, R. Fukuda, J. Hasegawa, M. Ishida, T. Nakajima, Y. Honda, O. Kitao, H. Nakai, T. Vreven, J. A. Montgomery, Jr., J. E. Peralta, F. Ogliaro, M. Bearpark, J. J. Heyd, E. Brothers, K. N. Kudin, V. N. Staroverov, R. Kobayashi, J. Normand, K. Raghavachari, A. Rendell, J. C. Burant, S. S. Iyengar, J. Tomasi, M. Cossi, N. Rega, J. M. Millam, M. Klene, J. E. Knox, J. B. Cross, V. Bakken, C. Adamo, J. Jaramillo, R. Gomperts, R. E. Stratmann, O. Yazyev, A. J. Austin, R. Cammi, C. Pomelli, J. W. Ochterski, R. L. Martin, K. Morokuma, V. G. Zakrzewski, G. A. Voth, P. Salvador, J. J. Dannenberg, S. Dapprich, A. D. Daniels, Ö. Farkas, J. B. Foresman, J. V. Ortiz, J. Cioslowski and D. J. Fox, Gaussian 09 Revision A.1, Gaussian Inc., Wallingford CT, 2009 Search PubMed.
- R. F. W. Bader, Acc. Chem. Res., 1985, 18, 9–15 CrossRef CAS.
- T. G. S. Todd and A. Keith, AIMAll (Version 14.06.21), Overland Park KS, USA, (aim.tkgristmill.com), 2014 Search PubMed.
- C. M. Breneman and K. B. Wiberg, J. Comput. Chem., 1990, 11, 361 CrossRef CAS.
- T. A. Manz and D. S. Sholl, J. Chem. Theory Comput., 2012, 8, 2844–2867 CrossRef CAS.
- M. Schmollngruber, C. Schröder and O. Steinhauser, J. Chem. Phys., 2013, 138, 204504 CrossRef.
- B. R. Brooks, C. L. Brooks III, A. D. MacKerell Jr., L. Nilsson, R. J. Petrella, B. Roux, Y. Won, G. Archontis, C. Bartels, S. Boresch, A. Caflisch, L. Caves, Q. Cui, A. R. Dinner, M. Feig, S. Fischer, J. Gao, M. Hodoscek, W. Im, K. Kuczera, T. Lazaridis, J. Ma, V. Ovchinnikov, E. Paci, R. W. Pastor, C. B. Post, J. Z. Pu, M. Schaefer, B. Tidor, R. M. Venable, H. L. Woodcock, X. Wu, W. Yang, D. M. York and M. Karplus, J. Comput. Chem., 2009, 30, 1545 CrossRef CAS.
- L. Martínez, R. Andrade, G. Birgin and J. M. Martínez, J. Comput. Chem., 2009, 30, 2157 CrossRef PubMed.
- M. B. Shiflett and A. Yokozeki, J. Chem. Eng. Data, 2007, 52, 1302–1306 CrossRef CAS.
- S. P. Verevkin, Angew. Chem., Int. Ed., 2008, 47, 5071–5074 CrossRef CAS PubMed.
- A. Noda, K. Hayamizu and M. Watanabe, J. Phys. Chem. B, 2001, 105, 4603–4610 CrossRef CAS.
- A. Stoppa, O. Zech, W. Kunz and R. Buchner, J. Chem. Eng. Data, 2010, 55, 1768–1773 CrossRef CAS.
- J. P. Armstrong, C. Hurst, R. G. Jones, P. Licence, K. R. J. Lovelock, C. J. Satterley and I. J. Villar-Garcia, Phys. Chem. Chem. Phys., 2007, 9, 982–990 RSC.
- S. P. Verevkin, D. H. Zaitsau, V. N. Emelyanenko, A. V. Yermalayeu, C. Schick, H. Liu, E. J. Maginn, S. Bulut, I. Krossing and R. Kalb, J. Phys. Chem. B, 2013, 117, 6473–6486 CrossRef CAS PubMed.
- S. V. Sambasivarao and O. Acevedo, J. Chem. Theory Comput., 2009, 5, 1038–1050 CrossRef CAS.
- G. Raabe and J. Köhler, J. Chem. Phys., 2008, 128, 154509 CrossRef PubMed.
- B. Dünweg and K. Kremer, J. Chem. Phys., 1993, 99, 6983–6997 CrossRef.
- I.-C. Yeh and G. Hummer, J. Phys. Chem. B, 2004, 108, 15873–15879 CrossRef CAS.
- E. Heid, B. Docampo-Àlvarez, L. M. Varela, K. Prosenz, O. Steinhauser and C. Schröder, Phys. Chem. Chem. Phys., 2018, 20, 15106–15117 RSC.
- S. Tsuzuki, W. Shinoda, H. Saito, M. Mikami, H. Tokuda and M. Watanabe, J. Phys. Chem. B, 2009, 113, 10641–10649 CrossRef CAS PubMed.
- V. Zeindlhofer, L. Zehetner, W. Paschinger, A. Bismarck and C. Schröder, J. Mol. Liq., 2019, 288, 110993 CrossRef CAS.
- V. Lesch, H. Montes-Campos, T. Méndez-Molales, L. J. Gallego, A. Heuer, C. Schröder and L. M. Varela, J. Chem. Phys., 2016, 145, 204507 CrossRef PubMed.
- T. Katö, K. Machida, M. Oobatake and S. Hayashi, J. Chem. Phys., 1988, 89, 3211–3221 CrossRef.
- R. P. Daly, J. C. Araque and C. J. Margulis, J. Chem. Phys., 2017, 147, 061102 CrossRef PubMed.
- A. P. Abbott, ChemPhysChem, 2005, 6, 2502–2505 CrossRef CAS PubMed.
- H. Zhao, Z.-C. Liang and F. Li, J. Mol. Liq., 2009, 149, 55–59 CrossRef CAS.
- W. Kob, C. Donati, S. J. Plimpton, P. H. Poole and S. C. Glotzer, Phys. Rev. Lett., 1997, 79, 2827–2830 CrossRef CAS.
- M. Salanne, C. Simon, P. Turq and P. A. Madden, J. Phys. Chem. B, 2007, 111, 4678–4684 CrossRef CAS PubMed.
- C. Schröder, M. Haberler and O. Steinhauser, J. Chem. Phys., 2008, 128, 134501 CrossRef PubMed.
- B. L. Bhargava and S. Balasubramanian, J. Chem. Phys., 2005, 123, 144505 CrossRef CAS PubMed.
- C. Schröder, J. Chem. Phys., 2011, 135, 024502 CrossRef PubMed.
| This journal is © the Owner Societies 2020 |

