 Open Access Article
Creative Commons Attribution 3.0 Unported Licence
Defining aluminum-zoning during synthesis of ZSM-5 zeolites†
Teng
Li
 a,
Frank
Krumeich
 a,
Ming
Chen
b,
Zhiqiang
Ma
a and
Jeroen A.
van Bokhoven
 *ac
*ac
aInstitute for Chemical and Bioengineering, ETH Zurich, 8093 Zurich, Switzerland. E-mail: jeroen.vanbokhoven@chem.ethz.ch; Tel: +41 44 632 55 42
bDepartment of Materials, ETH Zurich, 8093 Zurich, Switzerland
cPaul Scherrer Insitute, 5232 Villigen, Switzerland
First published on 2nd December 2019
Abstract
ZSM-5 zeolites attract considerable attention owing to their wide range of applications in catalysis and separation. The crystals that are synthesized with tetrapropylammonium ions (TPA+) as the template show aluminum-zoning, i.e. aluminum being concentrated in the rim part of the crystal. Here, we study the aluminum distribution within individual crystals as a function of synthesis time and find that the degree of aluminum-zoning evolves. Crystals with inhomogeneous aluminum distribution persist since their emergence from the early stages of hydrothermal treatment. The degree of aluminum-zoning in the crystals increases with the synthesis time, accompanied by an increase in the crystal size and subsequently the formation of a well-defined crystal morphology. This indicates a gradual aluminum migration toward the crystal surface during the course of crystallization. Moreover, the addition of high-aluminum-containing species to the existing crystals preferentially takes place at the late stages of synthesis, which contributes to the inhomogeneous aluminum distribution within a crystal. As a result, the finally formed crystals have not only the largest crystal size but also the highest degree of aluminum-zoning. The insight into the origin of aluminum-zoning that our work provides advances our understanding of the relationship between aluminum distribution in zeolites and the synthesis time to design better catalysts.
Introduction
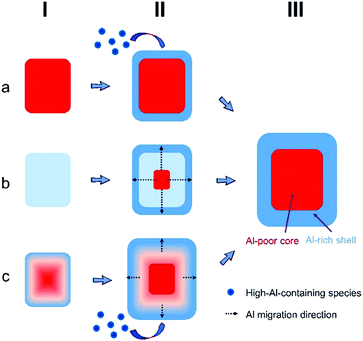
Zeolites attract a lot of attention in heterogeneous catalysis due to their activity, stability, and high selectivity.1,2 Their catalytic performance is intimately related to the spatial distribution of catalytically active aluminum in zeolite crystals. The acid sites located on the outer surface have no steric constraints and thus are easily accessible to the reactant and/or product molecules. The distribution of aluminum over the zeolite crystals varies for different synthesis protocols and is also connected to the performance in mesopore development associated with base or acid etching.3,4 Therefore, understanding how to control the aluminum distribution is important from the view of application.As a high-silica zeolite, ZSM-5 has attracted considerable attention owing to its wide range of applications in catalysis and separation. The phenomenon of aluminum-zoning is well-known for ZSM-5 crystals synthesized with tetrapropylammonium ions (TPA+) as the template. The first report by Von Ballmoos and Meier claims that the rim of ZSM-5 crystals exhibits a higher aluminum content compared to the core part.5 In the next four decades, this phenomenon has repeatedly been confirmed by surface/bulk compositional analysis,6–8 base leaching experiments3,9–11 and catalytic tests12,13 over micron-sized ZSM-5 crystals. The 3D visualization of aluminum zoning over a single particle was also achieved by taking advantage of the sufficient resolution of synchrotron-based micro X-ray diffraction and atom probe tomography (APT).14,15 Recently, Bräuer et al. observed that with a decrease of silicon-to-aluminum ratios in ZSM-5 crystals, the fraction of the external Brønsted sites decreases, which indicates that the distribution of aluminum over a crystal varies with the framework aluminum content.16,17 By adopting different combinations of inorganic and organic structure-directing agents in ZSM-5 crystallization, Chawla et al. found different (homogenous and heterogeneous) aluminum distributions over crystals.18 These results suggest that the distribution of aluminum over a crystal depends on multiple factors. However, to date only a few studies have intended to explore the origin of aluminum-zoning, especially from the view of the evolution of aluminum-zoning during the course of crystallization. Althoff et al. found that only by using TPA+ as a template, aluminum-zoned crystals were produced.19 They proposed that silicate species were firstly incorporated into the zeolite structure due to their interaction with TPA+. After forming a particle with high silicon content, the aluminosilicate species were post-added to the crystal surface, resulting in an extreme aluminum distribution (Fig. 1a). Based on the TPA+-templating synthesis, Jansen et al. observed a homogeneous aluminum distribution in the crystals after a short synthesis period, and a heterogeneous aluminum distribution with a longer reaction time.20 Their results suggest another mode for the origin of aluminum-zoning: while the initially formed particles have a homogeneous aluminum distribution, with an increase of the synthesis time, the aluminum atoms gradually migrate to the surface of particles, leading to more localized aluminum-enrichment in the rim of crystals (Fig. 1b).
In this report, we provide new insights into the origin of aluminum-zoning by employing focused ion beam (FIB), (scanning) transmission electron microscopy ((S)TEM) and energy dispersive X-ray spectroscopy (EDX). The aluminum distribution was explored based on ZSM-5 crystals of a few hundred nanometers in size. Such crystals can be analyzed by STEM-EDX with good resolution. Moreover, FIB milling can be performed on such particles to obtain the exact middle sections, enabling us to quantify the silicon-to-aluminum ratios (SARs) of different parts of a crystal.
Experimental
Zeolite synthesis
Zeolites are synthesized according to our previous studies.21 12 g of tetrapropylammonium hydroxide (TPAOH) solution (25 wt% in water) were added to a Teflon reactor containing 12.5 g tetraethyl orthosilicate (TEOS) and 77.4 g deionized water. The mixture was then gradually heated to 80 °C and stirred for 24 h at 500 rpm. After cooling down to room temperature, a solution of sodium hydroxide (0.24 g), aluminum nitrate nonahydrate (0.46 g) and deionized water (4 g) was added dropwise to this mixture while stirring vigorously. The resulting zeolite precursor gel has a composition of 0.01Al2O3![[thin space (1/6-em)]](https://www.rsc.org/images/entities/char_2009.gif) :
:![[thin space (1/6-em)]](https://www.rsc.org/images/entities/char_2009.gif) 1SiO2
1SiO2![[thin space (1/6-em)]](https://www.rsc.org/images/entities/char_2009.gif) :
:![[thin space (1/6-em)]](https://www.rsc.org/images/entities/char_2009.gif) 0.25TPAOH
0.25TPAOH![[thin space (1/6-em)]](https://www.rsc.org/images/entities/char_2009.gif) :
:![[thin space (1/6-em)]](https://www.rsc.org/images/entities/char_2009.gif) 0.05Na2O
0.05Na2O![[thin space (1/6-em)]](https://www.rsc.org/images/entities/char_2009.gif) :
:![[thin space (1/6-em)]](https://www.rsc.org/images/entities/char_2009.gif) 80H2O. After homogenization, the obtained precursor was transferred to a 100 mL stainless steel autoclave equipped with Teflon inlets and heated to 170 °C for different time intervals under static conditions. The resulting zeolites were separated by centrifugation for 15 min at 15
80H2O. After homogenization, the obtained precursor was transferred to a 100 mL stainless steel autoclave equipped with Teflon inlets and heated to 170 °C for different time intervals under static conditions. The resulting zeolites were separated by centrifugation for 15 min at 15![[thin space (1/6-em)]](https://www.rsc.org/images/entities/char_2009.gif) 000 rpm, washed three times with deionized water, and dried at room temperature by nitrogen flow.
000 rpm, washed three times with deionized water, and dried at room temperature by nitrogen flow.
Zeolite leaching
Zeolite base leaching using NaOH solution (0.15 M, 35 mL g−1 zeolite) was carried out at 80 °C for 10 h. After leaching, the reaction was subsequently quenched in an ice/water bath, and the resulting solid product was separated by centrifugation (15 min, 15![[thin space (1/6-em)]](https://www.rsc.org/images/entities/char_2009.gif) 000 rpm). The retrieved zeolites were washed three times with deionized water and dried overnight at 100 °C. Before leaching, all zeolites have been calcined for 10 h at 550 °C.
000 rpm). The retrieved zeolites were washed three times with deionized water and dried overnight at 100 °C. Before leaching, all zeolites have been calcined for 10 h at 550 °C.
Characterization
Powder X-ray diffraction patterns were collected using a PANalytical X’Pert PRO MPD diffractometer equipped with a Cu Kα source at room temperature. TEM images were obtained with a Tecnai F30 microscope operated at 300 kV. HAADF-STEM and EDX measurements were carried out with a Hitachi HD-2700CS microscope or a Talos F200X both operated at 200 kV. Regarding the focus ion beam (FIB) milling, the zeolite sample was supported on a silicon wafer. Before milling, the sample was coated again with ∼1 μm carbon to protect the sample. The milling was done with a sequence decreasing milling current to avoid amorphization of the sample. The FIB-SEM investigation of the sample was done in the NVision 40 Station. The Si/Al ratio of the liquid was determined using a Varian SpectrAA 220FS atomic absorption spectrometer (AAS). Solid-state 27Al MAS NMR was performed on a Bruker 400 UltraShield spectrometer operating at a resonance frequency of 104.29 MHz. The rotor was spun at 10 kHz and the spectra were recorded with a 4 mm MAS probe, with 3000 scans averaged for each spectrum. The chemical shifts were referenced to (NH4)Al(SO4)2·12H2O for aluminum. Solid-state 29Si MAS NMR measurements were performed at a resonance frequency of 79.51 MHz. The rotor was spun at 10 kHz, with 3000 scans averaged for each spectrum.Results and discussion
Crystal growth
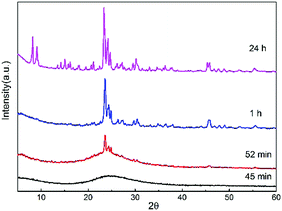
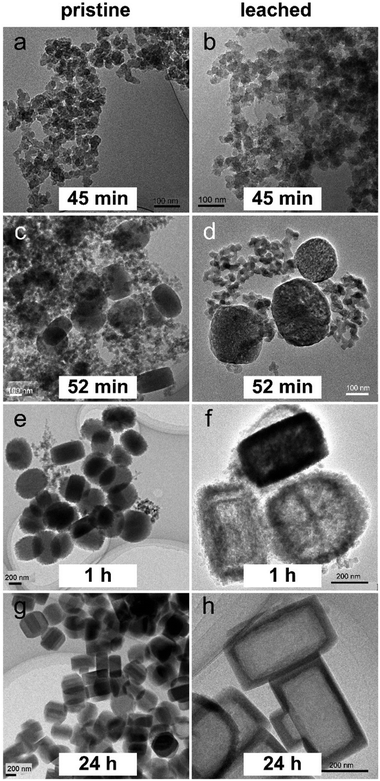
ZSM-5 crystals were synthesized from a mixture of tetraethyl orthosilicate, aluminum nitrate, sodium hydroxide, tetrapropylammonium hydroxide and deionized water at 170 °C. As a dilute gel system, the zeolite precursor solution contains amorphous nanoparticles and their self-assembled aggregates. Hydrothermal treatment induces the self-assembly of the constituent precursor species as well as the amorphous-to-crystalline transformation.22 The sample after 45 min of hydrothermal treatment is amorphous as determined by X-ray diffraction (Fig. 2). This sample contains particles of sizes between 20 and 40 nm (Fig. 3a and Fig. S1, ESI†). Such particles should be the precursor nanoparticles (PNs) of the final crystals as they were gradually consumed over time. A longer hydrothermal treatment (52 min) leads to the appearance of large particles (LPs) of 200–300 nm surrounded by PNs (Fig. 3c). Meanwhile the sample shows characteristic MFI zeolite diffraction (Fig. 2). Over time, the size of large particles increased accompanied by a decrease in the amount of PNs (Fig. 3e). This is in line with the X-ray diffraction results showing that the hump attributed to the amorphous material disappears and the peaks indicating crystal growth around 2θ = 24° evolve around between 45 min and 52 min (Fig. 2). The large particles obtained after 1 h reach a size of 350–500 nm, showing a jagged rough surface (Fig. S2a, ESI†). Crystals with regular protrusions whose directions were aligned in parallel were observed, indicating that oriented attachment of nanoparticles occurs.23,24 After 24 h, a decline in the surface irregularity is observed and most of the crystals exhibit a smooth surface (Fig. 3g and Fig. S2b, ESI†). Considering that oligomers or monomers are smaller building units and usually attach to imperfect locations, their incorporation is also expected to occur in the present case to yield a more perfect crystal structure.25,26 The resulting crystals do not change much further in size, with the largest dimension falling in the range between 400 and 500 nm.Crystal leaching
The process of desilication is affected by the local aluminum content. Base leaching of the zoned crystals leads to the dissolution of aluminum-poor parts of the crystal without creating mesopores in aluminum-rich parts. Thus, for samples with a high degree of aluminum zoning, hollow crystals with an empty core and an intact shell can be created.27,28 The pristine particles were leached under the mild conditions (0.15 M NaOH, 80 °C, 10 h). The pristine and leached samples are labelled as “P_x” and “L_x”, where x stands for the period of hydrothermal synthesis. The right column in Fig. 3 shows typical TEM micrographs of the leached particles, and the overview images are shown in Fig. S3 (ESI†). The morphology of PNs in L_45m does not change much compared to that in P_45m (Fig. 3b). For L_52m, hollow crystals are sometimes observed but most of the large particles only contain mesopores in the core enclosed by a shell of about 15 nm thickness (Fig. 3d). This observation suggests that aluminum-zoning exists already in this stage of synthesis, but that the aluminum distribution is less inhomogeneous within the particle. Hollow crystals with a rough surface were found in L_1h, indicating that the degree of aluminum-zoning increases with the synthesis time (Fig. 3f). Base leaching of P_24h crystals leads to perfect hollow structures in L_24h (Fig. 3h). The leached crystals possess an empty core and an intact shell of an average thickness of about 40 nm. The finally formed crystals possess not only the largest size but also the highest degree of aluminum-zoning compared to their intermediate analogues. The base leaching results seemingly indicate that aluminum tends to propagate outwardly along with the crystallization of ZSM-5. However, more direct evidence is provided in the following.EDX elemental mapping
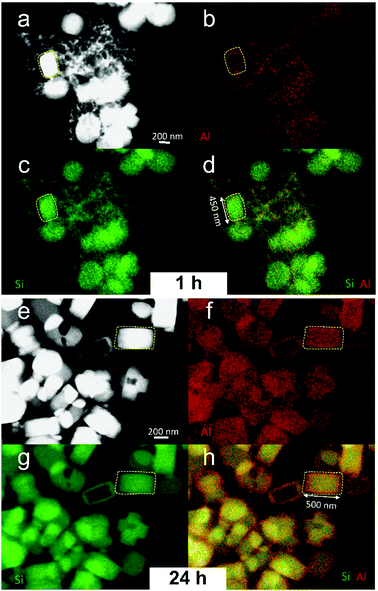
To further explore the difference in the degree of aluminum-zoning of large particles, we probed aluminum distribution by direct EDX elemental mapping. A test of the sample P_45m indicates a homogeneous aluminum distribution among the precursor nanoparticles (Fig. S4, ESI†). Then we compared the aluminum distribution of P_1h and P_24h by direct EDX elemental mapping of the areas containing several particles. Fig. 4 shows the high-angle annular dark field scanning transmission electron micrograph (HAADF-STEM), wherein the crystals can be discriminated by Z contrast. The EDX mapping of silicon shows a homogeneous distribution in both samples. Regarding aluminum distribution, the crystals of P_24h possess a more inhomogeneous aluminum distribution, where aluminum is clearly enriched in the outermost region. Although less clearly, the mappings also indicate a higher aluminum content in the rim of crystals P_1h. A test on the sample P_52m does not indicate an inhomogeneous aluminum distribution (Fig. S5, ESI†), although the leaching result suggests that aluminum zoning has existed in this stage of synthesis (Fig. 3d). This suggests that the sample “P_52m” shows aluminum zoning but the degree of zoning is lower compared to that in P_1h and P_24h.Silicon to aluminium ratio (SAR)
To quantify the aluminum distribution better, we used focused ion beam (FIB) milling to isolate the middle section of a crystal by removing its front and rear ends. As depicted in Fig. 5a, the cross section of one large particle was prepared by gallium FIB milling. The front and rear ends were removed and only the middle cross section with a thickness of 200 nm was maintained and analyzed by STEM-EDX. Such a thickness is suitable considering the complete removal of the aluminum-rich areas in both the front and rear ends, meanwhile leaving a relatively thick lamella for EDX measurement. For the cross sections, mainly two areas were analyzed, including the central part and the rim part. The silicon-to-aluminum ratio (SAR) of different areas was obtained by quantifying the respective element signals. No standard material with a known Si/Al ratio was used for calibration and thus the calculated silicon-to-aluminum ratio (SAR) is used only for comparison. Fig. 5b displays the cross section of one large crystal in P_52m with the SAR value marked close to the analyzed areas. The contrast is due to the compositional difference between zeolite and coating species. Aluminum-zoning is observed for this crystal since its rim part has a lower SAR value. However, the difference between the center (SAR = 33) and the rim (SAR = 20) is not significant. In contrast to P_52m, the degree of aluminum-zoning is higher in P_24h (Fig. 5c). The rim part of the cross section has the highest aluminum content (SAR = 12) while the center (SAR = 114) possesses very low aluminum contents. The Ga beam treatment is rather harsh and possibly deteriorates parts of the zeolite structure. Nonetheless, these observations of different degrees of aluminum-zoning provide further direct evidence of aluminum migration to the surface with the synthesis time, which is consistent with the base leaching results.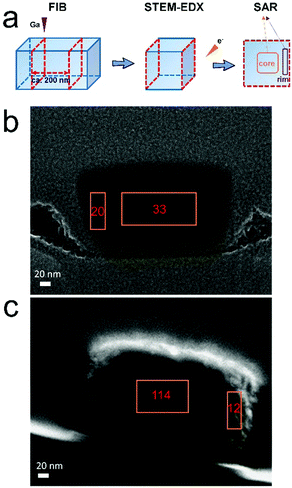 | ||
| Fig. 5 (a) A simplified scheme for employing FIB to prepare lamellar for STEM-EDX point analysis. (b) EDX point analysis of the cross section of one P_52m particle and (c) EDX point analysis of the cross section of one P_24h particle. Silicon-to-aluminum ratios are indicated close to the analyzed area. The cross section of the crystal was prepared by gallium focus ion beam milling and the contrast was due to compositional difference between zeolite and coating species (pure carbon in image b; Pt/carbon in image c). The image c is reproduced from ref. 27 with permission. Copyright 2019 Royal Chemistry Society. | ||
To obtain the trend of the SAR change for all particles within the solid part, i.e. the precursor nanoparticles (PNs) and the large particles (LPs), EDX analysis was performed (Table 1 and Fig. S6–S9, ESI†). Compared to the large particles (SAR = 32–40), the precursor nanoparticles possess a higher aluminum content (SAR = 10–13). During synthesis, the precursor nanoparticles are gradually consumed by attaching them to the large particles (Fig. 2). This not only leads to the continual size increase of large particles but also contributes to the enrichment of aluminum in the rim part of ZSM-5 zeolite crystals.
| Sample | P_45m | P_52m | P_1h | P_24h |
|---|---|---|---|---|
| PNs | 10 | 12 | 13 | — |
| LPs | — | 40 | 36 | 32 |
Aluminum incorporation
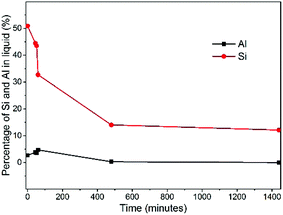
Aluminum-zoned crystals persisted since their appearance during the whole synthesis. To figure out why the initially formed crystals (P_52m) have aluminum-zoning, we measured the percentage of the aluminum and silicon content as function of synthesis time (Fig. 6). The synthesised gel was separated into solid and liquid parts by centrifugation. The liquid part was analyzed by elemental analysis. The initial zeolite precursor was a dilute gel system and about half of silicon was located in the liquid part. In contrast, aluminum was mostly enriched in the solid part and its content was below 5% during the whole synthesis. Once heated, the silicon content in the liquid decreased significantly within the first hour while the aluminum content in the liquid did not change much. The faster consumption of silicon compared to that of aluminum in the liquid part possibly hints at why the first observed crystals possess the feature of uneven aluminum distribution. Fig. 7 shows the 27Al MAS NMR and 29Si MAS NMR spectra of the samples. All the samples were measured under the same conditions. The signal at about 53 ppm is assigned to the framework tetrahedrally coordinated aluminum (Fig. 7a). No octahedrally coordinated aluminum was observed in any of the samples. The peak was broad for the samples synthesized with a time less than one hour. With an increase of the synthesis time, the width of the peak decreased, which indicates that more aluminum atoms became framework tetrahedrally coordinated. Simultaneously, the resolution of the 29Si MAS NMR spectra became better, indicating that more zeolite crystals were produced and their structure became more ordered. The incorporation of aluminum into the zeolite structure is also confirmed by the emergence of a signal at −106 ppm, which is assigned to Q3 (Al–O–Si–[(OSi)3]) in zeolite.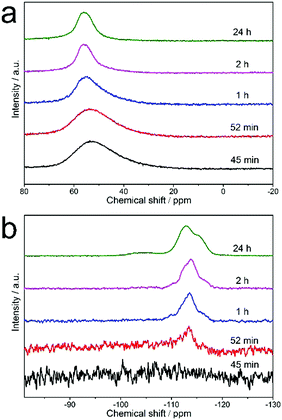 | ||
| Fig. 7 (a) 27Al MAS NMR and (b) 29Si MAS NMR spectra of the solid sample obtained after hydrothermal treatment for different times. | ||
Conclusions
Overall, the formation of aluminum-zoning of ZSM-5 zeolites has two main reasons: (1) the gradual aluminum migration toward the crystal surface with the synthesis time and (2) the addition of high-aluminum-containing species to the crystal surface at the late stages of synthesis. The aluminum migration to the surface direction is possibly related to the instability of aluminum in the early-staged crystal framework. The structural reorganization (hydrolysis and rearrangement) in the alkaline liquid may result in the dissolution of unstable aluminum atoms and the subsequent recrystallization within the surface region. The delayed incorporation of high-aluminum-containing species is possibly caused by their preferential interaction of sodium ions.19 However, a similar system containing tetrapropylammonium ions (TPA+) and sodium ions resulted in crystals with a silicon-rich exterior and a more aluminous interior, indicative of the complexity regarding the priorities of aluminum incorporation.18 Based on the previously proposed models (Fig. 1a and b), we suggest a refined model to define the origin of aluminum zoning (Fig. 1c). Due to a quicker consumption of high-silicon-containing species at the early-stage of crystallization, the initially formed ZSM-5 crystals already have an inhomogeneous aluminum distribution, where the rim part has a higher aluminum content than the core part. With an increase of the synthesis time, aluminum migrates toward the crystal surface and the high-aluminum-containing species are gradually added to the existing crystals. As a result, the finally formed crystals have both the largest crystal size and the highest degree of aluminum-zoning.Conflicts of interest
The authors declare no conflict of interest.Acknowledgements
The authors thank the Scientific Center for Optical and Electron Microscopy of the ETH Zurich for technical support. Mr T. Li thanks the China Scholarship Council (CSC) for the financial support (201506450010).Notes and references
- A. Corma and A. Martinez, Adv. Mater., 1995, 7, 137–144 CrossRef CAS.
- B. M. Weckhuysen and J. Yu, Chem. Soc. Rev., 2015, 44, 7022–7024 RSC.
- R. Dessau, E. Valyocsik and N. Goeke, Zeolites, 1992, 12, 776–779 CrossRef CAS.
- J. Pérez-Ramírez, C. H. Christensen, K. Egeblad, C. H. Christensen and J. C. Groen, Chem. Soc. Rev., 2008, 37, 2530–2542 RSC.
- R. Von Ballmoos and W. Meier, Nature, 1981, 289, 782–783 CrossRef CAS.
- A. Hughes, K. Wilshier, B. Sexton and P. Smart, J. Catal., 1983, 80, 221–227 CrossRef CAS.
- J. Nagy, P. Bodart, H. Collette, J. El Hage-Al Asswad, Z. Gabelica, R. Aiello, A. Nastro and C. Pellegrino, Zeolites, 1988, 8, 209–220 CrossRef CAS.
- L. Karwacki, M. H. Kox, D. M. De Winter, M. R. Drury, J. D. Meeldijk, E. Stavitski, W. Schmidt, M. Mertens, P. Cubillas and N. John, Nat. Mater., 2009, 8, 959 CrossRef CAS PubMed.
- J. C. Groen, T. Bach, U. Ziese, A. M. Paulaime-vanDonk, K. P. de Jong, J. A. Moulijn and J. Pérez-Ramírez, J. Am. Chem. Soc., 2005, 127, 10792–10793 CrossRef CAS PubMed.
- C. Mei, Z. Liu, P. Wen, Z. Xie, W. Hua and Z. Gao, J. Mater. Chem., 2008, 18, 3496–3500 RSC.
- D. Fodor, L. Pacosová, F. Krumeich and J. A. van Bokhoven, Chem. Commun., 2014, 50, 76–78 RSC.
- C. Seebacher, J. Rau, F. W. Deeg, C. Bräuchle, S. Altmaier, R. Jäger and P. Behrens, Adv. Mater., 2001, 13, 1374–1377 CrossRef CAS.
- M. H. Kox, E. Stavitski and B. M. Weckhuysen, Angew. Chem., 2007, 119, 3726–3729 CrossRef.
- Z. Ristanovic, J. P. Hofmann, U. Deka, T. U. Schülli, M. Rohnke, A. M. Beale and B. M. Weckhuysen, Angew. Chem., Int. Ed., 2013, 52, 13382–13386 CrossRef CAS PubMed.
- D. E. Perea, I. Arslan, J. Liu, Z. Ristanovic, L. Kovarik, B. W. Arey, J. A. Lercher, S. R. Bare and B. M. Weckhuysen, Nat. Commun., 2015, 6, 8589 CrossRef PubMed.
- P. Bräuer, P. L. Ng, O. Situmorang, L. Hitchcockb and C. D'Agostino, RSC Adv., 2017, 7, 52604–52613 RSC.
- P. Bräuer, O. Situmorang, P. L. Ng and C. D'Agostino, Phys. Chem. Chem. Phys., 2018, 20, 4250–4262 RSC.
- A. Chawla, R. Li, R. Jain, R. J. Clark, J. G. Sutjianto, J. C. Palmer and J. D. Rimer, Mol. Syst. Des. Eng., 2018, 3, 159–170 RSC.
- R. Althoff, B. Schulz-Dobrick, F. Schüth and K. Unger, Microporous Mater., 1993, 1, 207–218 CrossRef CAS.
- J. Jansen, C. Engelen and H. Van Bekkum, ACS Symp. Ser., Am. Chem. Soc., Washington, DC, 1989 Search PubMed.
- T. Li, Z. Ma, F. Krumeich, A. J. Knorpp, A. B. Pinar and J. A. Van Bokhoven, ChemNanoMat, 2018, 4, 992–999 CrossRef CAS.
- T. Li, J. Ihli, J. T. C. Wennmacher, F. Krumeich and J. A. van Bokhoven, Chem. – Eur. J., 2019, 25, 7689–7694 CAS.
- T. M. Davis, T. O. Drews, H. Ramanan, C. He, J. Dong, H. Schnablegger, M. A. Katsoulakis, E. Kokkoli, A. V. McCormick and R. L. Penn, Nat. Mater., 2006, 5, 400 CrossRef CAS PubMed.
- A. Aerts, L. R. Follens, E. Biermans, S. Bals, G. Van Tendeloo, B. Loppinet, C. E. Kirschhock and J. A. Martens, Phys. Chem. Chem. Phys., 2011, 13, 4318–4325 RSC.
- A. I. Lupulescu and J. D. Rimer, Science, 2014, 344, 729–732 CrossRef CAS PubMed.
- J. J. De Yoreo, P. U. Gilbert, N. A. Sommerdijk, R. L. Penn, S. Whitelam, D. Joester, H. Zhang, J. D. Rimer, A. Navrotsky and J. F. Banfield, Science, 2015, 349, aaa6760 CrossRef PubMed.
- T. Li, H. Wu, J. Ihli, Z. Ma, F. Krumeich, P. H. Bomans, N. A. Sommerdijk, H. Friedrich, J. P. Patterson and J. A. van Bokhoven, J. Mater. Chem. A, 2019, 7, 1442–1446 RSC.
- N. Danilina, F. Krumeich, S. A. Castelanelli and J. A. van Bokhoven, J. Phys. Chem. C, 2010, 114, 6640–6645 CrossRef CAS.
Footnote |
| † Electronic supplementary information (ESI) available: Complementary TEM images and EDX results. See DOI: 10.1039/c9cp05423e |
| This journal is © the Owner Societies 2020 |

