Thermal conductance bottleneck of a three dimensional graphene–CNT hybrid structure: a molecular dynamics simulation†
Zepei
Yu
a,
Yanhui
Feng
 *ab,
Daili
Feng
*ab and
Xinxin
Zhang
ab
aSchool of Energy & Environmental Engineering, University of Science and Technology Beijing, Beijing 100083, China. E-mail: yhfeng@me.ustb.edu.cn; Tel: +86-10-62332599
bBeijing Key Laboratory of Energy Saving and Emission Reduction for Metallurgical Industry, University of Science and Technology Beijing, Beijing 100083, China. E-mail: dlfeng@ustb.edu.cn; Tel: +86-10-62333682
First published on 2nd December 2019
Abstract
Three dimensional (3D) graphene–CNT hybrid structures (GCNTs) are promising materials for applications including capacitors and gas storage and separation devices, however until now their thermal conductance mechanism has scarcely been studied. These hybrid nanomaterials are particularly suitable as next-generation thermal interface materials due to the excellent thermal properties of carbon nanotubes and single atomic layer graphene. In this paper, the out-of-plane thermal conductivities of GCNTs, graphene nanomesh (GNM), and graphene sheets are investigated using molecular dynamics (MD) simulations which apply the Green–Kubo method. Distinct from GNMs and graphene sheets, the GCNTs exhibit a relatively high out-of-plane thermal conductivity, stemming from the CNTs’ ability to accelerate the energy flow. However, the GCNT out-of-plane thermal conductivity is still far lower than that of pristine graphene due to extreme phonon localizations, which are concentrated on the graphene–CNT junction regions as evidenced by the participation ratio, phonon vibrational density of states, and overlap energy. This study provides microscopic insight into the GCNT heat transfer mechanism and offers design guidelines for application of GCNTs in thermal management devices.
1. Introduction
Three dimensional (3D) graphene–CNT hybrid structures (GCNTs) have attracted extensive recent attention due to their unique properties and wide-ranging applications as high-performance capacitances devices,1 hydrogen storage devices,2,3 gas separation membranes,4 lithium batteries,5–7 gas sensors,8 supercapacitors,9–12 conductors,13 and functional and structural composites.14–18 Since the existing synergy between graphene and CNTs is already favorable, a three dimensional hybrid nanostructure consisting of one dimensional CNTs either parallel to the graphene sheets or pillared to act as bridges between adjacent graphene sheets can be expected to yield further enhanced properties. These improved electronic and mechanical properties are mainly attributable to the existence of CNT arrays, whereas the enhanced adsorption properties mainly result from significant porosity. This structure also exhibits outstanding through-plane thermal conductivity,19 and can be easily integrated into high-power electronics and stretchable devices to act as a multi-functional thermal management material. Additionally, the GCNTs could be used as porous carriers to prepare shape-stabilized PCM composites for latent thermal energy storage systems.20–23 The high thermal conductivity of skeleton materials could enhance the heat transfer efficiency.24–26Several studies have described simulations and experiments of GCNTs with remarkable characteristics, shedding light on their potential applications. From a theoretical point of view, GCNTs were considered first by Matsumoto and Saito, who created a series of hybrid materials, including graphene sheets with periodically extracted short (6,6) type carbon nanotube lattices, and reported their energetic stability on the basis of total-energy calculation using the tight-binding model.27
More recently, such theoretical predictions have been confirmed by complementary experimental studies, wherein the structures proposed by theorists have been physically achieved in reality. GCNTs have been synthesized by growing CNTs arrays on graphene sheets,28–33 with the aim of preparing 3D hybrid structures with high surface areas. Kondo et al.33 first reported the chemical vapor deposition (CVD) synthesis of a novel carbon composite structure consisting of multilayered graphene planes and aligned multi-walled carbon nanotubes. Epitaxially grown hybrids are suitable for electronic applications, however scale-up difficulties associated with their preparation detract from their appeal. Therefore, it is important to develop a method to produce regular hybrid structures in a well-controlled manner. Kamaliya et al.32 proposed a novel synthesis procedure for the large scale in situ growth of GCNTs in which the reduction of graphene oxide and the formation of CNT pillars on the reduced GO sheet are simultaneously performed in a single CVD step. Characterizing the thermal transport between the graphene sheets and CNTs is impossible because current experimental methods cannot resolve heat transfer at the molecular scale. Therefore, molecular simulation is an effective tool for characterizing thermal transport properties. This has already been demonstrated19 for a pillared-graphene network structure model characterized via molecular dynamics (MD) simulations, which suggested that the CNT arrays significantly improve thermal transport between the graphene sheets. The thermal conductivity of the GCNTs is still far less than that of pristine graphene, however the impediment to the heat transfer process has been scarcely studied,34 especially at the nanoscale. Further understanding of mechanism governing thermal transport between graphene sheets and CNTs is vitally important for designing a GCNT hybrid structure with superior thermal properties.
In this paper, equilibrium molecular dynamics (EMD) simulations are performed to predict the thermal conductivity of GCNTs, graphene nanomesh (GNM), and graphene. The size and temperature effects of the thermal conductivity are also discussed. The phonon vibrational density of states (VDOS), the overlap phonon energy, and the participation ratio (PR) are analyzed with the aim of providing physical insight into the mechanism of thermal transport, as well as the source of the heat transfer bottleneck in GCNTs. This work intends to pioneer an exploration of GCNT thermal properties and provide efficient design guidelines for heat management in nano-scaled graphene-based devices.
2 Simulation and method
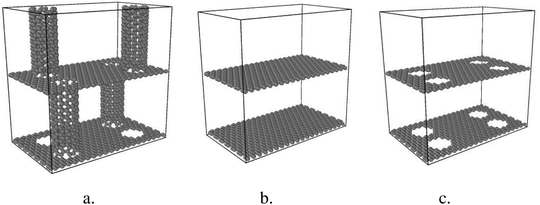
This study systematically investigates thermal conductivity and thermal mechanisms of GCNTs compared to graphene nanomesh and pristine graphene. All models are constructed using Materials Studio (Accelrys Inc.).Two parallel graphene sheets in a periodic boundary condition serve as the basis for the model, depicted in Fig. 1. Circular holes are arranged on the graphene sheets, over which CNTs are positioned vertically. The CNT diameters are equivalent to those of the pores. Finally, tube ends are bonded to the two adjacent graphene sheets. Fig. 1 also shows GNMs with squarely arranged circular pores and multilayered graphene samples. For all samples, the dimensions of one-unit box are 30.1 Å × 48.8 Å × 50.4 Å.
Two molecular dynamics methods are available for performing MD simulations, namely equilibrium (EMD) and nonequilibrium (NEMD) molecular dynamics. In the NEMD method, a steady-state temperature gradient is imposed along the direction of interest. The thermal conductivity is then calculated using Fourier's law of heat conduction.35 To build a stable diffusive temperature profile, NEMD requires simulation cells of a large size. EMD possesses significant advantages over NEMD in that a smaller sized simulation system can achieve reproducible converged results. Thus, in this study EMD is used to calculate the thermal conductivity of GCNTs in the microcanonical ensemble, which is accomplished by monitoring small fluctuations of heat current over time and analyzing these perturbations in equilibrium using the Green–Kubo method.36
LAMMPS37 is used to conduct the simulation with the optimized Tersoff potential, which significantly improves the phonon dispersion relation and lattice constant compared to conventional methods38 to describe the C–C interactions. The van der Waals interaction between carbon atoms in the layered graphene nanomesh and the graphene layers are modeled using the LJ potential for non-bonding interactions between the layers. This involves the standard Lorenz–Bethelot mixing rule, with parameters of e = 0.02578 eV and d = 3.0825 Å.39
The thermal conductivity is described by the Green–Kubo relation:40,41
 | (1) |
![[J with combining right harpoon above (vector)]](https://www.rsc.org/images/entities/i_char_004a_20d1.gif) is heat flux, and 〈〉 denotes time average.
is heat flux, and 〈〉 denotes time average.
The periodic boundary conditions are used for the out-of-plane directions. The total simulation time and step interval are set at 20 ns and 0.25 fs, respectively. The autocorrelation length is set to 100 ps, which is long enough to obtain the converged heat current auto-correlation function (HCACF). At the outset of this work, the system was optimized and relaxed in the NVT ensemble using the Nosé–Hoover thermostat42 for 1 ns, and then relaxed for another 3 ns in the NVE ensemble.
3 Results and discussion
3.1 Effects of finite-size
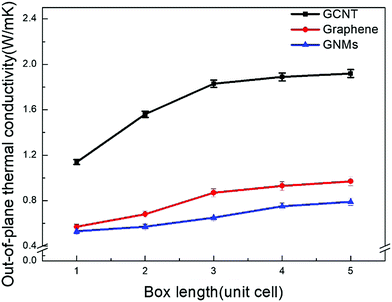
Since the phonon mean free path (MFP) in carbon nanomaterials is several hundred nanometers, size effects may arise if the phonon MFP is not significantly shorter than the lattice length.43,44 While the size dependence of thermal conductivity has been observed in previous studies,45,46 there are relatively few studies exploring size effects in GCNT simulations. Both EMD and NEMD methods are capable of exhibiting finite-size effects, however the EMD method provides a much better resolution than does the NEMD method, which requires a heat source and sink.47Size effects on the thermal conductivity of GCNT, GNMs, and graphene within the simulation box are also investigated. The lattice box ranges from one to four unit cells, whose simulation-size effects are examined at 300 K. Fig. 2 shows the thermal conductivities of GCNT, GNMs, and graphene as a function of box length.
As the number of unit cells studied is extended from four to five, the thermal conductivities increase by only 1–5%. This increase is even smaller and can be neglected as the more unit cells are incorporated, indicating that four unit cells is sufficient to provide a converged value. For all simulations regardless of the number of unit cells, the out-of-plane thermal conductivity of GCNTs is much higher than that of GNMs and graphene layers. Similar results have already been reported in previous studies, however these studies have all neglected to account for the much lower out-of-plane thermal conductivity of GCNTs compared to CNTs single layer graphene, and CNT arrays. Therefore, it is important to investigate the mechanism for this thermal bottleneck. Furthermore, for a GCNT system the four-box width of 20.1 nm is generally smaller than the phonon MFP for single walled CNT and graphene, which is around 240 nm.48 We deduce that the phonon mean free paths of GCNTs in this study were around four unit cells, which is 20 nm. The structure-thermal conductivity relationship is explored further in the following sections. Unless otherwise stated, all results for this study are based on four unit cells.
3.2 Temperature dependence
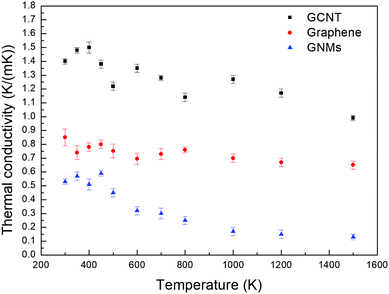
In order to achieve reliable results, three different sets of initial conditions are used in the calculation ensembles and the correlation times are set to 10 ps, such that thermal conductivity is calculated for every 10 ps of heat flux simulation. The accurate thermal conductivity value is obtained by averaging these data. We confirm the convergence of the thermal conductivity when the heat current autocorrelation function (HCACF) approximates zero. These methods are similar to those reported by several other studies for EMD simulation of thermal conductivity.40,49,50The normalized HCACF of GCNTs, GNMs, and graphene at 300 K are shown in Fig. 3a–c, respectively, wherein for each of the curves we observe a two-stage decaying phenomenon, namely an initial violent fluctuation followed by a long tail of a slow decay. The initial stage corresponds to the short wavelength phonons’ contribution to heat transfer, while the second corresponds to long wavelength phonons’ contribution, which becomes dominant for heat transfer at longer correlation times.51 In addition, the HCACF curves decay to approximately zero at a time much shorter than the correlation time of 10 ps, confirming that the selected correlation time is adequate for the simulation. The convergence of thermal conductivity is also confirmed when the heat current autocorrelation function (HCACF) approximates zero.50 The out-of-plane thermal conductivities of GCNTs, graphene, and GNMs at 300 K are about 1.64, 0.68, and 0.53 W (m K)−1. These follow the trend kGCNT> kgraphene> kGNM.
 | ||
| Fig. 3 Normalized HCACFs (heat current autocorrelation functions) of GCNTs (a), GNMs (b), and graphene (c). | ||
Fig. 4 depicts the temperature dependence of the out-of-plane thermal conductivities of GCNTs, GNMs, and graphene. The simulated systems studied are stable up to 1500 K. The same out-of-plane thermal conductivity trend for the three materials is observed for the entire temperature range. In addition, as the temperature increases from 300 to 1500 K, the thermal conductivities vibrate first and then decrease for all three samples, especially for the GCNT and GNMs.
This occurs because the MFP of phonons, which is the grain size, does not change substantially at normal atmospheric temperature, and therefore the main contribution to thermal conductivity is the existence of periodic junction or defect, which is positively correlated to the structure properties. Thus, the thermal conductivities initially vibrate with increased temperature. However, the MFP tends to decrease obviously as the temperature approaches to a higher temperature. Therefore, the MFP becomes the main determining factor affecting thermal conductivity. The MFP decreases as the temperature increases due to increased interphonon scattering, which results from enhanced anharmonicity induced by the higher temperature.52 Therefore, the vibration and decrease of thermal conductivities is devoted to the interaction of junction and MFP of phonons. Our results are also in agreement with observations by Slack et al.53 that the thermal conductivity decreases when the temperature is increased past a certain value.
3.3 Participation ratio
In order to investigate the enhanced thermal conductivity and the thermal bottleneck of GCNTs compared to GNMs and graphene, we study phonon localization using participation ratios (PRs).54,55 The PR for each mode λ describes the fraction of atoms participating in that particular vibration mode, defined as | (2) |
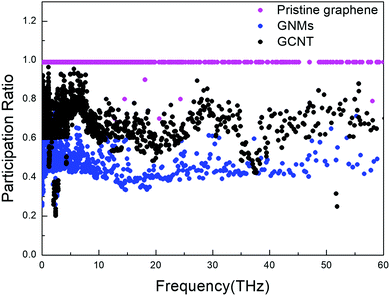
The PR is a very useful quantity for characterizing the phonon mode localization.56,57 This value is 1 for graphene, which indicates that all atoms participate in the motion and explains why graphene exhibits extremely high in-plane thermal conductivity. A lower PR corresponds to more localized phonon modes, and in turn lower thermal conductivity.
The PRs of GCNTs, GNMs, and pristine graphene are compared in Fig. 5. The presence of CNTs prompts an increase in the PR of GCNTs compared to GNMs over nearly entire range of frequency, resulting in increased out-of-plane thermal conductivity since the CNTs act as energy transport channels. However, the PR of GCNTs is still less than that of pristine graphene, resulting in the GCNTs’ relatively lower thermal conductivity. There exists a bottleneck in the heat transfer, which means that phonon modes in the GCNTs tend to be more localized than they are in pristine graphene. Nevertheless, the GCNT PR is large in the low-frequency region, indicating low-frequency phonons are nevertheless non-localized.
3.4 Vibrational density of states
In addition to the heat capacity and phonon MFP, another contributing factor to the thermal conductivity is lattice vibrations. The thermal conductivity bottleneck is related to the suppressed phonon scattering, as illustrated by the vibrational density of states (VDOS). The normalized VDOS is calculated for GCNTs, GNMs, and graphene to elucidate the microscopic mechanisms for enhanced and bottlenecked out-of-plane thermal conductivity in GCNTs. The VDOS of the βth species (DP,β) is calculated from the Fourier transformation of the atomic velocity autocorrelation function (VACF), with the result weighted according to the species concentration cβ:58,59 | (3) |
 | (4) |
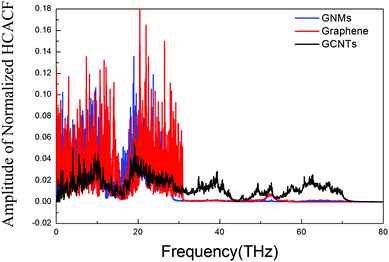
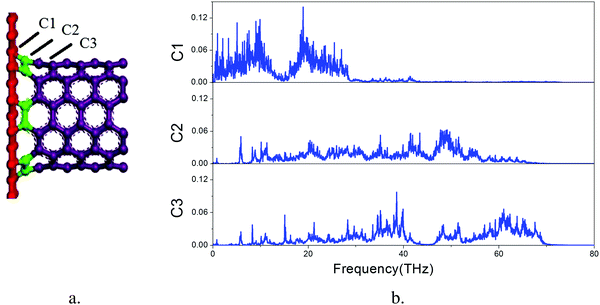
The overall VDOS is calculated for GCNTs, GNMs, and graphene. The results are shown in Fig. 6. The VDOS of graphene is consistent with previous reports,60–63 indicating that the out-of-plane flexural (ZA) modes, which are the main contributors to out-of-plane thermal conductivity, are located in the low frequency range. These out-of-plane flexural (ZA) modes are studied further to analyze GCNT structure. The key structural components, namely those comprising the junction region, are tagged in Fig. 7a. This junction region plays an important role in thermal transport across graphene sheets and includes three types carbon atoms denoted C1, C2, and C3. The VDOS of each of these three types of carbon atoms is shown in Fig. 7b.
The VDOS of C2 is similar to that of C3 across the entire frequency range. The VDOS of both C2 and C3 extends across a wide frequency range, while the VDOS of C1 is nearly zero at frequencies above 30 THz, indicating an inherent mismatch of phonon vibrations across the junction subregions, especially at the area between the graphene and the junctions. This mismatch affords additional resistance to the heat transfer, which indicates that it is this junction mutation that produces the bottleneck for enhanced thermal conductivity.
3.5 Overlap energy
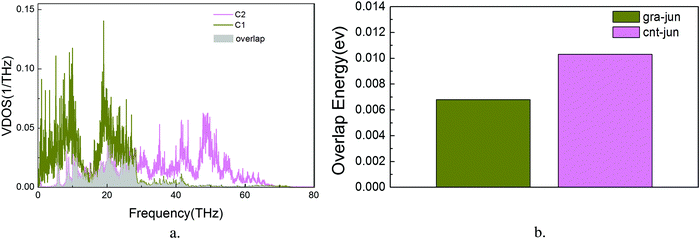
Although the VDOS can qualitatively evaluate mode localizations in the graphene–CNT junction, it cannot provide quantitative information about the relationship between structure and thermal conductivity. Therefore, we calculate the overlap energy between two bonded atoms by40,50 | (5) |
 is the Bose–Einstein distribution; T is absolute temperature; and kB is the Boltzmann's constant. Strong phonon coupling and enhanced heat transport correspond to a large overlap energy. Our calculations apply to the bonded atoms C1–C2 and C2–C3, which are shown in Fig. 8a and comprise the graphene–CNT junction of the GCNTs.
To the best of our knowledge, this is the first report of the overlap energies of C1–C2 and C2–C3 bonded atoms in GCNTs, which are presented in Fig. 8b. Compared to C2–C3, the bonded atoms C1–C2 exhibit a lower overlap energy which weakens the associated phonon coupling. This indicates that the energy localization takes place primarily in the C1–C2 subregion, leading to local increased phonon scattering and decreased energy flow. Therefore, this junction mutation is the bottleneck for further enhanced thermal conductivity in GCNTs.
4 Conclusion
In conclusion, the thermal conductivities of GCNTs, CNMs, and graphene were studied via the Green–Kubo method using equilibrium molecular dynamics simulations. The out-of-plane thermal conductivity of three materials is on the order of 1 W (m K)−1 and 0.1 W (m K)−1 at 300 K. They were in the order of kGCNT > kgraphene > kGNM. The GCNTs were found to have relatively high thermal conductivity, thus demonstrating their potential application in thermal management fields. However, the out-of-plane thermal conductivity of GCNTs is far less than that of pristine graphene or even CNT arrays. It is deduced that the phonon MFP of GCNTs is around 20 nm. This short mean free path for phonons results in the relatively low thermal conductivity for the GCNTs compared to pristine graphene. In addition, as the simulation system temperature increased from 300 to 1500 K, the thermal conductivities first increased first and then decreased for all three samples. The Debye temperature of GCNTs is deduced to be around 400 K. Analysis of the participation ratio, the phonon vibrational density of states (VDOS), and the overlap phonon energy provided insight into the mechanisms underlying the enhanced and bottlenecked thermal conductivity of GCNTs. These analyses revealed that energy localization occurs on the C1 and C2 atoms in the graphene–CNT junction of the GCNTs. Therefore, it is this junction mutation that acts as a bottleneck to energy flow. To optimize the structure of GCNTs further, we should reduce the structural mutation at the graphene–CNT junction and make the interface smoother to obtain better thermal transport performance.To date, reports of the thermal mechanism of these 3D nanoporous materials have been very scarce. More fundamental and in-depth studies will facilitate the design of GCNTs with desired thermal properties, which will be useful for new GCNT applications.
Conflicts of interest
The authors declare no competing financial interest.Acknowledgements
This work was supported by the National Natural Science Foundation of China (No. 51606008, 51876007), the China National Key Research and Development Plan Project (No. 2018YFA0702300), the Fundamental Research Funds for the Central Universities (FRF-TP-19-007B1, FRF-TP-19-002B2) and the Beijing Natural Science Foundation (No. 3192022).References
- Q. Zheng, Z. Li, J. Yang and J.-K. Kim, Prog. Mater. Sci., 2014, 64, 200–247 CrossRef CAS.
- R. P. Wesolowski and A. P. Terzyk, Phys. Chem. Chem. Phys., 2011, 13, 17027–17029 RSC.
- R. K. Paul, M. Ghazinejad, M. Penchev, J. Lin, M. Ozkan and C. S. Ozkan, Small, 2010, 6, 2309–2313 CrossRef CAS PubMed.
- G. K. Dimitrakakis, E. Tylianakis and G. E. Froudakis, Nano Lett., 2008, 8, 3166–3170 CrossRef CAS PubMed.
- W. Shi, J. Chen, Q. Yang, S. Wang and C. Xiong, J. Phys. Chem. C, 2016, 120, 13807–13814 CrossRef CAS.
- M.-Q. Zhao, X.-F. Liu, Q. Zhang, G.-L. Tian, J.-Q. Huang, W. Zhu and F. Wei, ACS Nano, 2012, 6, 10759–10769 CrossRef CAS PubMed.
- D. Wang, D. Choi, J. Li, Z. Yang, Z. Nie, R. Kou, D. Hu, C. Wang, L. V. Saraf and J. Zhang, ACS Nano, 2009, 3, 907–914 CrossRef CAS PubMed.
- H. Y. Jeong, D.-S. Lee, H. K. Choi, D. H. Lee, J.-E. Kim, J. Y. Lee, W. J. Lee, S. O. Kim and S.-Y. Choi, Appl. Phys. Lett., 2010, 96 DOI:10.1063/1.3432446.
- P. Duy Tho, T. H. Lee, D. H. Luong, F. Yao, A. Ghosh, L. Viet Thong, T. H. Kim, B. Li, J. Chang and Y. H. Lee, ACS Nano, 2015, 9, 2018–2027 CrossRef.
- N. Jha, P. Ramesh, E. Bekyarova, M. E. Itkis and R. C. Haddon, Adv. Energy Mater., 2012, 2, 438–444 CrossRef CAS.
- Y.-S. Kim, K. Kumar, F. T. Fisher and E.-H. Yang, Nanotechnology, 2011, 23, 015301 CrossRef.
- Z. Fan, J. Yan, L. Zhi, Q. Zhang, T. Wei, J. Feng, M. Zhang, W. Qian and F. Wei, Adv. Mater., 2010, 22, 3723–3728 CrossRef CAS.
- V. C. Tung, L.-M. Chen, M. J. Allen, J. K. Wassei, K. Nelson, R. B. Kaner and Y. Yang, Nano Lett., 2009, 9, 1949–1955 CrossRef CAS.
- Y. Li, T. Yang, T. Yu, L. Zheng and K. Liao, J. Mater. Chem., 2011, 21, 10844–10851 RSC.
- Q. Su, Y. Liang, X. Feng and K. Müllen, Chem. Commun., 2010, 46, 8279–8281 RSC.
- H. Im and J. Kim, Carbon, 2012, 50, 5429–5440 CrossRef CAS.
- S.-Y. Yang, W.-N. Lin, Y.-L. Huang, H.-W. Tien, J.-Y. Wang, C.-C. M. Ma, S.-M. Li and Y.-S. Wang, Carbon, 2011, 49, 793–803 CrossRef CAS.
- A. P. Singh, M. Mishra, D. P. Hashim, T. N. Narayanan, M. G. Hahm, P. Kumar, J. Dwivedi, G. Kedawat, A. Gupta, B. P. Singh, A. Chandra, R. Vajtai, S. K. Dhawan, P. M. Ajayan and B. K. Gupta, Carbon, 2015, 85, 79–88 CrossRef CAS.
- V. Varshney, S. S. Patnaik, A. K. Roy, G. Froudakis and B. L. Farmer, ACS Nano, 2010, 4, 1153–1161 CrossRef CAS PubMed.
- D. Feng, Y. Feng, Y. Zang, P. Li and X. Zhang, Microporous Mesoporous Mater., 2019, 280, 124–132 CrossRef CAS.
- D. Feng, Y. Feng, L. Qiu, P. Li, Y. Zang, H. Zou, Z. Yu and X. Zhang, Renewable Sustainable Energy Rev., 2019, 109, 578–605 CrossRef CAS.
- S. Sinha-Ray, R. P. Sahu and A. L. Yarin, Soft Matter, 2011, 7, 8823 RSC.
- H. Inaba and P. Tu, Heat Mass Transfer, 1997, 32, 307–312 CrossRef CAS.
- J. Tang, M. Yang, W. Dong, M. Yang, H. Zhang, S. Fan, J. Wang, L. Tan and G. Wang, RSC Adv., 2016, 6, 40106–40114 RSC.
- Y. Cui, C. Liu, S. Hu and X. Yu, Sol. Energy Mater. Sol. Cells, 2011, 95, 1208–1212 CrossRef CAS.
- M. Zhou, H. Bi, T. Lin, X. Lü, D. Wan, F. Huang and J. Lin, Carbon, 2014, 75, 314–321 CrossRef CAS.
- T. Matsumoto and S. Saito, J. Phys. Soc. Jpn., 2002, 71, 2765–2770 CrossRef CAS.
- Y. Zhu, L. Li, C. Zhang, G. Casillas, Z. Sun, Z. Yan, G. Ruan, Z. Peng, A.-R. O. Raji and C. Kittrell, Nat. Commun., 2012, 3, 1225 CrossRef PubMed.
- R. K. Paul, M. Ghazinejad, M. Penchev, J. Lin, M. Ozkan and C. S. Ozkan, Small, 2010, 6, 2309–2313 CrossRef CAS PubMed.
- D. H. Lee, J. E. Kim, T. H. Han, J. W. Hwang, S. Jeon, S. Y. Choi, S. H. Hong, W. J. Lee, R. S. Ruoff and S. O. Kim, Adv. Mater., 2010, 22, 1247–1252 CrossRef CAS PubMed.
- F. Du, D. Yu, L. Dai, S. Ganguli, V. Varshney and A. Roy, Chem. Mater., 2011, 23, 4810–4816 CrossRef CAS.
- R. Kamaliya, B. P. Singh, B. K. Gupta, V. N. Singh, T. K. Gupta, R. Gupta, P. Kumar and R. B. Mathur, Carbon, 2014, 78, 147–155 CrossRef CAS.
- D. Kondo, S. Sato and Y. Awano, Appl. Phys. Express, 2008, 1, 074003 CrossRef.
- J. Lee, V. Varshney, J. S. Brown, A. K. Roy and B. L. Farmer, Appl. Phys. Lett., 2012, 100, 183111 CrossRef.
- X. L. Zhang, H. Xie, M. Hu, H. Bao, S. Y. Yue, G. Z. Qin and G. Su, Phys. Rev. B: Condens. Matter Mater. Phys., 2014, 89, 7 Search PubMed.
- R. N. Salaway and L. V. Zhigilei, Int. J. Heat Mass Transfer, 2014, 70, 954–964 CrossRef CAS.
- S. Plimpton, J. Comput. Phys., 1995, 117, 1–19 CAS.
- J. Tersoff, Phys. Rev. B: Condens. Matter Mater. Phys., 1989, 39, 5566–5568 Search PubMed.
- W. Y. Choi, J. W. Kang and H. J. Hwang, Phys. Rev. B: Condens. Matter Mater. Phys., 2003, 68, 193405 CrossRef.
- X. L. Zhang and J. W. Jiang, J. Phys. Chem. C, 2013, 117, 18441–18447 CrossRef CAS.
- P. K. Schelling, S. R. Phillpot and P. Keblinski, Phys. Rev. B: Condens. Matter Mater. Phys., 2002, 65, 12 CrossRef.
- D. Frenkel and B. Smit, Understanding molecular simulation: from algorithms to applications, Elsevier, 2001 Search PubMed.
- C. Oligschleger and J. Schön, Phys. Rev. B: Condens. Matter Mater. Phys., 1999, 59, 4125 CrossRef CAS.
- R. H. Poetzsch and H. Böttger, Phys. Rev. B: Condens. Matter Mater. Phys., 1994, 50, 15757 CrossRef CAS PubMed.
- D. L. Nika, A. S. Askerov and A. A. Balandin, Nano Lett., 2012, 12, 3238–3244 CAS.
- C. Yu and G. Zhang, J. Appl. Phys., 2013, 113, 044306 Search PubMed.
- L. Cui, Y. Feng and X. Zhang, Phys. Chem. Chem. Phys., 2015, 17, 27520–27526 CAS.
- J. Bai, X. Duan and Y. Huang, Nano Lett., 2009, 9, 2083–2087 CAS.
- H. Zhang, G. Lee and K. Cho, Phys. Rev. B: Condens. Matter Mater. Phys., 2011, 84, 115460 Search PubMed.
- Y. Liu, Y. Feng, Z. Huang and X. Zhang, J. Phys. Chem. C, 2016, 120, 17060–17068 CrossRef CAS.
- J. Chen, G. Zhang and B. Li, Phys. Lett. A, 2010, 374, 2392–2396 CrossRef CAS.
- M. Roufosse and P. Klemens, Phys. Rev. B: Solid State, 1973, 7, 5379 CrossRef CAS.
- G. A. Slack, Solid State Physics, Elsevier, 1979, vol. 34, pp. 1–71 Search PubMed.
- H. Zhang, A. F. Fonseca and K. Cho, J. Phys. Chem. C, 2014, 118, 1436–1442 CrossRef CAS.
- L. Yang, N. Yang and B. Li, Sci. Rep., 2013, 3, 1143 Search PubMed.
- Y. Wang, B. Qiu and X. Ruan, Appl. Phys. Lett., 2012, 101, 013101 Search PubMed.
- J. Chen, G. Zhang and B. Li, J. Chem. Phys., 2011, 135, 104508 Search PubMed.
- B. Huang, A. McGaughey and M. Kaviany, Int. J. Heat Mass Transfer, 2007, 50, 393–404 CrossRef CAS.
- C.-K. Loong, P. Vashishta, R. Kalia, W. Jin, M. Degani, D. Hinks, D. Price, J. Jorgensen, B. Dabrowski and A. Mitchell, Phys. Rev. B: Condens. Matter Mater. Phys., 1992, 45, 8052 CrossRef CAS PubMed.
- B. Liu, J. A. Baimova, C. D. Reddy, S. V. Dmitriev, W. K. Law, X. Q. Feng and K. Zhou, Carbon, 2014, 79, 236–244 CrossRef CAS.
- J. Zhang, Y. Hong and Y. Yue, J. Appl. Phys., 2015, 117, 134307 CrossRef.
- Y. Hong, J. Zhang, X. Huang and X. C. Zeng, Nanoscale, 2015, 7, 18716–18724 RSC.
- L. Cui, X. Du, G. Wei and Y. Feng, J. Phys. Chem. C, 2016, 120, 23807–23812 CrossRef CAS.
Footnote |
| † Electronic supplementary information (ESI) available. See DOI: 10.1039/c9cp05228c |
| This journal is © the Owner Societies 2020 |

