 Open Access Article
Holistic approach to chemical degradation of Nafion membranes in fuel cells: modelling and predictions†
Philipp
Frühwirt
a,
Ambrož
Kregar
 ab,
Jens T.
Törring
a,
Tomaž
Katrašnik
b and
Georg
Gescheidt
 *a
*a
aInstitute of Physical and Theoretical Chemistry, Graz University of Technology, Stremayrgasse 9, 8010 Graz, Austria. E-mail: g.gescheidt-demner@tugraz.at
bFaculty of Mechanical Engineering, University of Ljubljana, Aškerčeva 6, 1000 Ljubljana, Slovenia
First published on 26th February 2020
Abstract
The state of health of polyfluorinated sulfonic-acid ionomer membranes (e.g. Nafion®) in low-temperature proton exchange membrane fuel cells (LT-PEMFCs) is negatively influenced by degradation phenomena occurring during their operation. As a consequence, the performance and durability of the membrane are decreased. In this article, we focus on simulating and predicting chemical membrane degradation phenomena using a holistic zero-dimensional kinetic framework. The knowledge of chemical degradation mechanisms is widely spread. We have collected and evaluated an extensive set of chemical mechanisms to achieve a holistic approach. This yields a set of 23 coupled chemical equations, which provide the whole cause and effect chain of chemical degradation in LT-PEMFCs (based on the Fenton reaction between Fe2+ and H2O2via the attack of hydroxyl radicals on the membrane, loss of ionomer moieties and emission of fluoride). Our kinetic framework allows the reproduction of experimentally accessible data such as fluoride emission rates and concentrations of ionomer moieties (from both in situ and ex situ tests). We present an approach, which allows estimations of the membrane lifetime based on fluoride emission rates. In addition, we outline the demetallation of Fe–N–C catalysts as a source of additional harmful iron species, which accelerate chemical membrane degradation. To demonstrate the expandability and versatility of the kinetic framework, a set of five chemical equations describing the radical scavenging properties of cerium agents is coupled to the main framework and its influence on membrane degradation is analysed. An automated solving routine for the system of coupled chemical equations on the basis of the chemical kinetic simulation tool COPASI has been developed and is freely accessible online (http://ptc-pc-139.tugraz.at/cgi-bin/Membrane_Degradation/).
Introduction
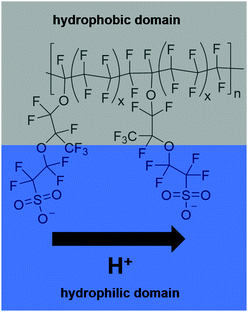
In 2014, two-thirds of the world's total carbon dioxide emissions originated from the industry, electricity/heat and transport sectors. In the US and Europe, transportation accounted for about one-third of the total greenhouse gas emissions in that year.1 Approaches to tackle the decarbonisation in this sector are under development or even commercialised – e.g. hybrid electric vehicles (combination of conventional internal combustion engine and electric power engine), battery electric vehicles, fuel cell electric vehicles and fuel cell hybrid electric vehicles. Except for hybrid electric vehicles, they do not produce pollutants during operation. Provided that the electric power or fuel is produced in an ecologically sound manner from renewable sources, they can provide a CO2 neutral means of transportation. Vehicles powered by fuel cells (FCs) are superior in comparison to those relying on batteries when it comes to range and time required for recharging. However, the fuel cell technology suffers from a different type of problem – the restricted durability of the fuel cell components such as the membrane and the catalyst, and hence a limited long-term reliability of the fuel cells.2–4One of the most frequently used types of FCs in the automotive sector are proton exchange membrane fuel cells (PEMFCs) operated at temperatures between 60 °C and 100 °C.2,5 These low-temperature PEMFCs usually comprise a polyfluorinated sulfonic-acid (PFSA) ionomer as the membrane (e.g. Nafion®). The chemical composition of Nafion® is depicted in Fig. 1. Due to the amphiphilic nature of the membrane, the conduction of the protons from the anode to the cathode side is ensured. This function is indispensable for the overall functionality of the fuel cell system. Thus, all degradation processes affecting the membrane reduce the efficiency of the fuel cell and considerably impact the reliability and durability of the system as a whole.5–7
Membrane integrity is affected by chemical, thermal and mechanical degradation.8 Here, we focus on the chemical membrane degradation in low-temperature PEMFCs. An excellent discussion of various degradation phenomena can be found in the reviews by Borup et al.,6 Kusoglu and Weber7 as well as Zatoń et al.5 Many mechanisms and the corresponding chemical equations9–13 and kinetic details14–28 have been reported. Based on that, several chemical degradation models29–36 have been already presented. This knowledge, however, is spread in physically, chemically and technologically oriented context. Here we present an extensive picture of chemical degradation combining established data to describe chemical conversions in a Nafion® membrane. We use a zero-dimensional (0D) chemical reactor model comprising a set of 23 coupled chemical equations. This powerful model allows monitoring and prediction of experimentally accessible data like time traces of chemical species involved33 and fluoride emission rates (FERs).35–37 Furthermore, we discuss the implications of iron containing ORR catalysts38–40 for membrane degradation and the use of cerium agents41–47 as radical scavengers to protect the chemical integrity of the membrane.
Modelling approach
Our kinetic framework and the assumptions of the model are based on fragmented knowledge spread across several chemical and technical publications. Accordingly, we, in the first instance, provide an overview of the state-of-the-art in terms of chemical membrane degradation.Formation of radical species
Experimental evidence that radical species are formed during the operation of the fuel cell was presented by Panchenko et al.48 By operating a miniature fuel cell within an electron paramagnetic resonance (EPR) spectrometer, radical species which arose from the electrode carbon material were detected. A similar setup was used by Danilczuk et al.49 to detect reactive oxygen species (ROS) such as hydroxyl (˙OH), hydroperoxyl (˙OOH) and additionally, hydrogen (˙H) and membrane-derived radical fragments after capturing them with a spin-trap.The mechanism behind the formation of these species is a matter of debate. Under typical operation conditions oxygen is reduced at the cathode in the oxygen reduction reaction (ORR). This can happen via different reaction routes – either a direct reduction involving 4 electrons (eqn (1)) or two consecutive two-electron reductions (eqn (2) and (3)) forming hydrogen peroxide (H2O2) as an intermediate:50,51
| O2 + 4e− + 4H+ ⇄ 2H2O E0 = 1.229 V | (1) |
| O2 + 2e− + 2H+ ⇄ H2O2 E0 = 0.695 V | (2) |
| H2O2 + 2e− + 2H+ ⇄ 2H2O E0 = 1.763 V | (3) |
By equipping the membrane with Pt microelectrodes, Liu and Zuckerbrod52 were able to detect micromolar concentrations of H2O2 in the membrane during operation (60 °C, open circuit voltage (OCV) conditions). Nevertheless, the formation of H2O2 is not confined to the cathode side. During operation of the fuel cell, oxygen can diffuse to the anode side, where H2O2 is also formed. A dependence of [H2O2] on the thickness of the membrane was also observed – the thinner the membrane, the higher [H2O2]. This is most likely connected to the increased O2 crossover in thinner membranes.52 Similar results were obtained by Chen and Fuller.53 Shah et al.30 calculated [H2O2] in the membrane for different operating conditions (voltage, temperature) – the highest values were found to be near or in the anode catalyst layer (up to 3.5 mM) while the value on the cathode side stayed below 0.5 mM for 60 °C and OCV. Simulations by Wong and Kjeang34 indicate [H2O2] of about 1.5 mM in the membrane under OCV conditions. Inaba et al.54 supposed that due to the elevated boiling point of H2O2 compared to that of water the concentration of H2O2 could be increased when the fuel cell is operated under low humidity conditions.
H2O2 is not a strong enough oxidant to attack the ionomer directly and is, therefore, characterised by a relatively long lifetime within the fuel cell. This leads to a diffusion length of H2O2 in the mm to cm range, which is large compared to the typical membrane thickness (in the μm range).31 Under certain conditions, though, H2O2 is highly active in oxidizing organic substrates (like the fuel cell membrane) – a fact which has been known for more than hundred years. In 1894, Fenton discovered that a mixture of H2O2 and ferrous salts effectively reacts with tartaric acid.55 The reaction between ferrous ions and H2O2 is known as the Fenton reaction:56,57
| Fe2+ + H2O2 + H+ ⇄ Fe3+ + ˙OH + H2O | (4) |
| Fe3+ + H2O2 ⇄ Fe2+ + ˙OOH + H+ | (5) |
| Fe2+ + ˙OH + H+ ⇄ Fe3+ + H2O | (6) |
| Fe2+ + ˙OOH + H+ ⇄ Fe3+ + H2O2 | (7) |
| Fe3+ + ˙OOH ⇄ Fe2+ + H+ + O2 | (8) |
Pozio et al.57 demonstrated that stainless steel (type SS316L) end plates serve as a source of iron contaminants in fuel cells. When using aluminium (Al) end plates in operando the average fluoride concentration measured in the cathode water was only about 1/10 of that with stainless steel end plates. For the anode side a reduction in fluoride emission by 60% was observed when switching from SS316L end plates to Al end plates. In addition, a decrease in Fe concentration in the cathode water from about 600 ppb (for SS316L) to less than 100 ppb (for Al) was also evident. For the anode water in the case of SS316L end plates, a Fe concentration of 925 ppb was determined. Papadias et al.60 found a total ion release rate of about 0.4 μg cm−2 h−1 in the range of 0 to 1 V for stainless steel (type SS316L) bipolar plates. 90% of all released ions were Fe and Ni.
Not only the end plates used in fuel cells, but also the membrane material might contribute to the contamination of the fuel cell with iron. Coms et al.61 estimated the BOL (begin of life) concentration of iron to be 5 to 10 ppm. Liu et al.62 attributed an iron concentration of 5 ppm to an as-received NE112 ionomer. Due to the anionic nature of the sulfonic acid head groups Nafion® is known to immobilise iron ions,63 which could even lead to an accumulation of iron within the membrane during operation. Andersen64 observed in swelling–dehydration experiments with Nafion® 212 that the ionomer tends to have higher selectivity for high-valence cations (like Fe3+), which then replace protons and negatively impact the proton conductivity of the ionomer and its thermochemical properties.7
The observation that ferrous ions accelerate the membrane degradation is actively employed in ex situ degradation tests (so-called Fenton tests)65–67 and also in situ tests41,62 to assess the durability of membrane materials. Other transition metal ions such as Ti3+,66 Co2+![[thin space (1/6-em)]](https://www.rsc.org/images/entities/char_2009.gif) 68,69 or Cu+
68,69 or Cu+![[thin space (1/6-em)]](https://www.rsc.org/images/entities/char_2009.gif) 70–72 are also known to convert H2O2 to ROS like ˙OH and ˙OOH.
70–72 are also known to convert H2O2 to ROS like ˙OH and ˙OOH.
In addition to the formation of radical species via hydrogen peroxide as an intermediate, radicals can also be formed directly on platinum surfaces. Density functional theory (DFT) calculations by Atrazhev et al.73 show that formation of ˙OH might be possible under conditions where the oxygen reduction is prevented by the presence of other adsorbed species. In close vicinity to other Pt particles (e.g. in the electrode) ˙OH might be destroyed effectively before reaching the polymer membrane, as for the adsorption of hydroxyl radicals no activation barrier at any potential is calculated.73 Despite the decreased selectivity for ˙OH to attack the membrane in Pt-rich environments, Pt particles deposited into a PFSA membrane increased the FER compared to the untreated membrane.74 Whether dispersed platinum particles catalyse the formation of radicals or act as scavengers and protect the membrane from radical attack is a function of the metal loading in the membrane. At higher platinum levels (30 to 50 mol%) radical scavenging is predominant while at 10 mol% (nPt/nmembrane) this is outweighed by the generation of radicals.75
Due to the sluggish kinetics of the ORR, high amounts of Pt or Pt alloys need to be used at the cathode side to efficiently catalyse the oxygen reduction. To reduce or avoid the use of the precious noble metal, alternatives such as non-precious metal catalysts (NPMCs) have been developed. Among these are metal/nitrogen/carbon (M–N–C) catalysts, where the metal is mostly iron. Although they are highly active in catalysing the oxygen reduction reaction, there is still room for improvement in terms of durability and stability.38 A lifetime-limiting factor for Fe–N–C catalysts is the Fe demetallation in acidic media (such as the PEMFC). Depending on the synthesis of the catalyst, inactive Fe particles (in addition to the active FeCxNy centres) remain at the surface, which cannot be completely removed by acid washing and lead to iron leaching in operando.39 A recent study by Chenitz et al.40 showed that demetallation at the catalytic Fe–N4 centres of a Fe–N–C catalyst (NC_Ar + NH3) due to the flux of water in the micropores of the catalyst is also possible providing an additional source of iron species.
Overview of degradation mechanisms
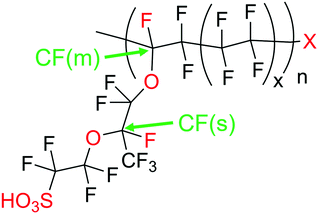
Regardless of the formation mechanism of radical species, Nafion® ionomers offer in principle four different points of attack for ˙OH or ˙H: (1) carboxylic acid (–COOH) end groups in the main chain (unzipping mechanism), (2) the sulfonic acid head groups (–SO3H), (3) ether groups in the side chain and finally (4) the tertiary carbons found in both side chain and main chain (Fig. 2).5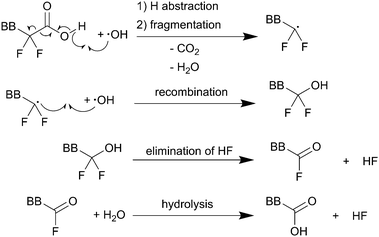 | ||
| Scheme 1 Main chain degradation mechanism as proposed by Curtin et al.9 BB represents the backbone of the PFSA ionomer. Single barbed arrows indicate the formation of new chemical bonds and homolytic cleavage of bonds. | ||
Thermodynamic driving force for hydrogen abstraction is the formation of a strong O–H bond (namely that of H2O) with an experimental bond enthalpy (ΔH298) of 497 kJ mol−1 while cleaving the weaker O–H bond of the carboxylic acid (computed bond enthalpy of 426 kJ mol−1 for CF3COOH).10
The number of unprotected groups can be greatly reduced by chemical stabilisation techniques (e.g. conversion of –COOH to –CF3 by treatment with fluorine).9,79 Cipollini79 found lower FERs for treated Nafion® membranes in Fenton degradation tests. But the same author also observed that in operando (90 °C, 30% relative humidity, anode: H2 + 5% O2, cathode: O2), these differences in FER values between untreated and treated ionomers vanished. These experimental observations indicate the presence of other degradation mechanisms under fuel cell conditions.79
Further experimental evidence for the unzipping mechanism was presented by Danilczuk et al.80 The stability of different polyfluorinated membranes (Nafion®, stabilised Nafion®, 3M ionomer and Aquivion®) was investigated by spin-trapping EPR spectroscopy. ˙OH was generated by photolysis of H2O2 in the presence of the ionomers and then trapped by using DMPO (5,5-dimethyl-1-pyrroline N-oxide). Besides the detection of the expected DMPO–OH radical adduct, carbon-centred radical intermediates were also established for all ionomers. For the 3M and the Aquivion® ionomer it was concluded that the observed radical adduct is a result of an attack of ˙OH on the COOH moieties of the polymers. For Nafion® and stabilised Nafion® another carbon-centred radical species was detected, which was attributed to a side-chain-derived radical.80
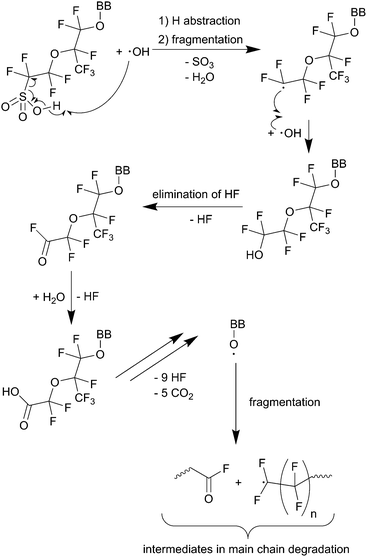 | ||
| Scheme 2 Side chain degradation mechanism as proposed by Ghassemzadeh et al.11 BB represents the backbone of the PFSA ionomer. Single barbed arrows indicate the formation of new chemical bonds and homolytic cleavage of bonds. | ||
The O–H bond of the sulfonic group involved in the first reaction in Scheme 2 features a bond enthalpy of 406 kJ mol−1 (computed for CF3SO3H)10 making the hydrogen abstraction by ˙OH energetically favourable. The following steps finally lead to an unstable alkoxy radical (BB–O˙) which is then inevitably converted to an acid fluoride and a BB–CF2˙ radical – both involved in the main chain unzipping process, too. As an intermediate in the first step a sulfonyl radical (SC–OCF2CF2SO3˙) is postulated,81 which can also be generated by another mechanism involving H2O2 as an oxidant for the sulfonic acid (see Scheme 3).10 The intermediate sulfonyl peroxide can react with another sulfonic acid to form bissulfonyl peroxide, whose O–O bond is finally cleaved to yield two sulfonyl radicals. Again, the cleavage of the weak C–S bond leads to SC–OCF2CF2˙ and SO3.10
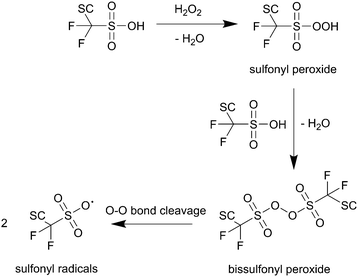 | ||
| Scheme 3 Formation of sulfonyl radicals via peroxide intermediates as proposed by Coms.10 SC represents the side chain of the ionomer. | ||
The mechanism depicted in Scheme 413 starts with a radical-initiated ether cleavage on the side chain, which can happen from both sides of the ether oxygen leading to different side chain fragments, which could be detected by 19F NMR. By using attenuated total reflection Fourier transform infrared spectroscopy (ATR-FTIR) the presence of C![[double bond, length as m-dash]](https://www.rsc.org/images/entities/char_e001.gif) O bonds could be established.13
O bonds could be established.13
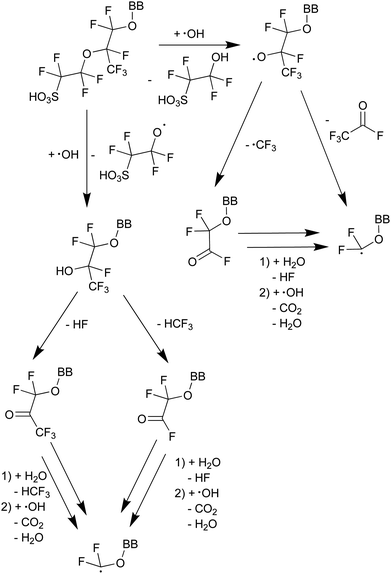 | ||
| Scheme 4 Proposed mechanism of ether cleavage with subsequent fragmentation and side-chain unzipping.13 BB represents the backbone of the PFSA ionomer. | ||
| H2 + ˙OH ⇄ ˙H + H2O | (9) |
As ˙H is produced along with ROS like ˙OH and ˙OOH under fuel cell conditions,49 it is difficult to study the impact of ˙H on membrane degradation in situ. Ghassemzadeh et al.13 were able to generate ˙H selectively by irradiating an aqueous H2SO4 solution with an electron beam in the presence of Nafion® 211. Their results indicate that the points of attack for ˙H are the tertiary C–F bonds located on the main and side chain (see Fig. 2). Based on that, a degradation mechanism involving just ˙H was proposed. In principle, both tertiary C–F bonds are points of attack for the highly reactive ˙H which finally leads to the fragmentation of the side chain at the tertiary carbons.13 These findings are corroborated by DFT calculations10,84 which demonstrate that the bond enthalpy of C–F bonds is the lowest for tertiary carbons. Based on the bond strengths (primary C–F: ≈ 520 kJ mol−1; secondary C–F: ≈ 480 kJ mol−1; tertiary C–F: ≈ 440 kJ mol−1) and HF (571 kJ mol−1) fluorine abstractions from any position of the Nafion® structure should be thermochemically favourable, though only abstractions at secondary and tertiary C–F bonds are estimated to be kinetically feasible.10
One should bear in mind that this mechanism is strictly valid only in a system where just ˙H as radical species is present. Under fuel cell conditions, a synergetic cooperation of the ROS and ˙H should be expected resulting in a more complicated degradation process. ˙H might activate the side chains for following attacks by ROS.
Previously published modelling approaches
On the basis of the degradation mechanisms discussed above several modelling approaches comprising membrane degradation phenomena29–36 have been published. The model by Xie and Hayden29 does not concentrate on the formation of radical species; yet it is possible to distinguish between two possibilities for initiation of PFSA degradation – either at the weak end groups of the main chain or at the side chains. In addition, it is impossible to deduce FERs from the model. A kinetic framework to describe the formation of H2O2 and ROS was provided in an extensive one-dimensional model of Shah et al.30 Gubler et al.31 presented a more comprehensive kinetic framework. With their zero-dimensional chemical reactor model comprising rate constants at room temperature they were able to estimate the quasi-steady state concentrations of ˙H, ˙OH and ˙OOH. FERs for ex situ Fenton and under fuel cell operation conditions after extrapolation to 90 °C were predicted. For the Fenton tests the agreement of the calculated FER with literature data was satisfying; however, the FER for in situ conditions was 2 to 3 orders of magnitude lower than the experimental results.Both the models of Shah et al.30 and Gubler et al.31 rely on the main chain unzipping mechanism as the major membrane degradation mechanism, yet improved chemical post-treatment effectively decreased the number of weak end groups in PFSA ionomers.79 Ghelichi et al.32 used a similar kinetic framework to that of Gubler et al.31 (rate constants at 80 °C instead of room temperature) in their coarse-grained degradation model dividing the PFSA structure into backbone, trunk and head group units. Radical concentrations were calculated following a steady-state approach neglecting the effects of the PFSA ionomer as a sink for radical species. The rate constants for the unzipping reaction and head group dissociation were derived from fitting analytical expressions to experimental data. For both the unzipping and the head group dissociation rate constant a good agreement with rate constants for model compounds determined by Dreizler and Roduner20 was achieved. However, the rate constant for head group dissociation is dependent on the data used for fitting.32
Similar to Ghelichi et al.,32 the approach by Wong and Kjeang33 is also based on the degradation of the side chain and features the radical ether cleavage (shown in Scheme 4) as the initiation step of ionomer destruction. Even though the kinetic framework for radical formation only comprises the Fenton reaction and all reaction constants are given for room temperature, trends observed in in situ tests can be well reproduced with their model. The kinetic framework33 was expanded in a later publication by Wong and Kjeang.34 An analogue model was presented recently by Singh et al.,35 being extended by regarding the temperature dependence of the Fenton reaction and an iron redox cycle, which is established by the reaction of ferric ions with hydrogen radicals.
A recent publication by Futter et al.36 features an extensive radical reaction framework similar to the ones already presented.30–32,34 Furthermore, the degradation reactions displayed in this model are based on the coarse-grained approach,32 with an excellent agreement with experimental data from accelerated stress tests.
Modelling framework
In the following paragraphs our modelling framework is described (for schematic explanation see Scheme 5), which merges and expands the hitherto published ones.30–36 A combination of ionomer degradation reactions33–35 (see Scheme 6) with basic radical chemistry14–28 leads to a system of 23 coupled chemical equations (see Table 1). This set of equations is then solved by an automatisation routine based on the freely available kinetic simulation program COPASI.85 This allows predictions of fluoride emission rates and concentration traces of ionomer moieties and degradation products.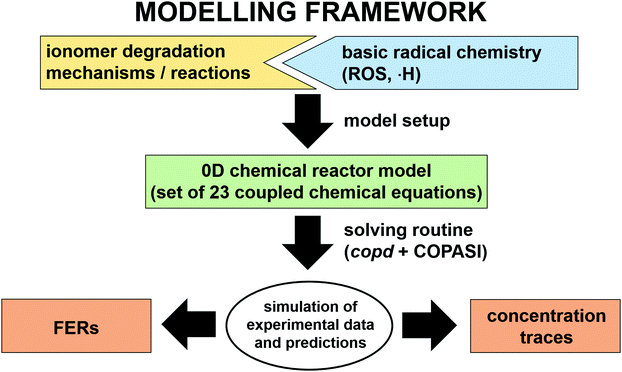 | ||
| Scheme 5 Schematic drawing of the modelling framework presented in this article. Ionomer degradation mechanisms/reactions33–35 (see Scheme 6) are combined with basic radical reactions of ROS and ˙H14–28 to yield a zero-dimensional chemical reactor model comprising a set of coupled chemical equations. This system of differential equations is solved by a combination of the self-developed tool copd and freely available software COPASI.85 Fluoride emission rates and concentration traces (e.g. HF, CO2, ionomer moieties) can be simulated and predicted. | ||
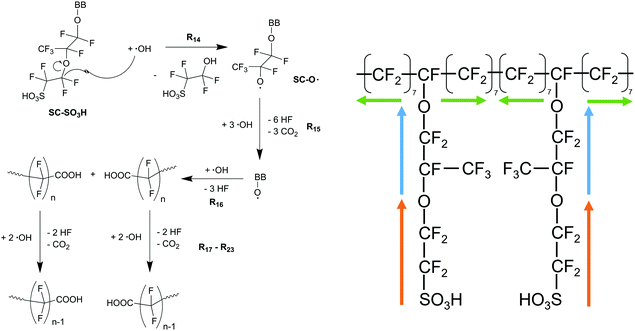 | ||
| Scheme 6 Left: Side chain degradation mechanism33–35 used in the following modelling approach. Right: Upon initiation at the side chain (orange and blue arrows), membrane degradation proceeds in both directions along the backbone equally (indicated by green arrows). | ||
| Reaction | k (T = 298.15 K) [L mol−1 s−1] | E a [kJ mol−1] | A [L mol−1 s−1] | ||
|---|---|---|---|---|---|
| a Rate constants were recalculated for T = 298.15 K. b Activation energy is estimated between 6 and 10 kcal mol−1. c Average activation energy found in various degradation experiments.31,86 d Upper limit for the attack of ˙OH on CF3COOH.28 | |||||
| R1 | Fe2+ + H2O2 + H+ → Fe3+ + ˙OH + H2O | r 1 = k1[Fe2+][H2O2] | 66 | 35.415 | 1.05 × 10⁸![[thin space (1/6-em)]](https://www.rsc.org/images/entities/char_2009.gif) 15 15 |
| R2 | Fe3+ + H2O2 → Fe2+ + ˙OOH + H+ | r 2 = k2[Fe3+][H2O2] | 8.6 × 10⁻⁴ | 12622 | 8.43 × 10¹⁸![[thin space (1/6-em)]](https://www.rsc.org/images/entities/char_2009.gif) 22 22 |
| R3 | Fe2+ + ˙OH + H+ → Fe3+ + H2O | r 3 = k3[Fe2+][˙OH] | 3.6 × 10⁸![[thin space (1/6-em)]](https://www.rsc.org/images/entities/char_2009.gif) 19 19![[thin space (1/6-em)]](https://www.rsc.org/images/entities/char_2009.gif) a a |
919 | 1.37 × 10¹⁰ |
| R4 | Fe2+ + ˙OOH + H+ → Fe3+ + H2O2 | r 4 = k4[Fe2+][˙OOH] | 1.2 × 10⁶![[thin space (1/6-em)]](https://www.rsc.org/images/entities/char_2009.gif) 23 23 |
4223 | 2.74 × 10¹³ |
| R5 | Fe3+ + ˙OOH → Fe2+ + H+ + O2 | r 5 = k5[Fe3+][˙OOH] | 8.1 × 10⁴![[thin space (1/6-em)]](https://www.rsc.org/images/entities/char_2009.gif) 18 18 |
3317,18 | 4.9 × 10¹⁰ |
| R6 | H2O2 → 2˙OH | r 6 = k6[H2O2] | 6.5 × 10⁻²³ [s−1] | 20121 | 1013 [s−1]21 |
| R7 | ˙OH + H2O2 → ˙OOH + H2O | r 7 = k7[˙OH][H2O2] | 3.0 × 10⁷![[thin space (1/6-em)]](https://www.rsc.org/images/entities/char_2009.gif) 26 26![[thin space (1/6-em)]](https://www.rsc.org/images/entities/char_2009.gif) a a |
14![[thin space (1/6-em)]](https://www.rsc.org/images/entities/char_2009.gif) 26 26 |
8.43 × 10⁹ |
| R8 | ˙OOH + H2O2 → ˙OH + H2O + O2 | r 8 = k 8[˙OOH][H2O2] | 3.714 | 33.514![[thin space (1/6-em)]](https://www.rsc.org/images/entities/char_2009.gif) b b |
2.71 × 10⁶ |
| R9 | 2˙OOH → H2O2 + O2 | r 9 = k9[˙OOH]2 | 9.1 × 10⁵![[thin space (1/6-em)]](https://www.rsc.org/images/entities/char_2009.gif) 24 24![[thin space (1/6-em)]](https://www.rsc.org/images/entities/char_2009.gif) a a |
20.616 | 3.70 × 10⁹ |
| R10 | 2˙OH → H2O2 | r 10 = k10[˙OH]2 | 5.3 × 10⁹![[thin space (1/6-em)]](https://www.rsc.org/images/entities/char_2009.gif) 27 27![[thin space (1/6-em)]](https://www.rsc.org/images/entities/char_2009.gif) a a |
825 | 1.33 × 10¹¹ |
| R11 | ˙OOH + ˙OH → H2O + O2 | r 11 = k11[˙OOH][˙OH] | 1.1 × 10¹⁰![[thin space (1/6-em)]](https://www.rsc.org/images/entities/char_2009.gif) 27 27![[thin space (1/6-em)]](https://www.rsc.org/images/entities/char_2009.gif) a a |
14.216 | 3.39 × 10¹² |
| R12 | ˙OH + H2 → H2O + ˙H | r 12 = k12[˙OH][H2] | 3.9 × 10⁷![[thin space (1/6-em)]](https://www.rsc.org/images/entities/char_2009.gif) 27 27![[thin space (1/6-em)]](https://www.rsc.org/images/entities/char_2009.gif) a a |
19.227 | 9.14 × 10¹⁰ |
| R13 | ˙H + O2 → ˙OOH | r 13 = k13[˙H][O2] | 2.2 × 10¹⁰![[thin space (1/6-em)]](https://www.rsc.org/images/entities/char_2009.gif) 27 27![[thin space (1/6-em)]](https://www.rsc.org/images/entities/char_2009.gif) a a |
10.316 | 1.37 × 10¹² |
| R14 | SC–SO3H + ˙OH → SC–O˙ + HOCF2CF2SO3H | r 14 = k14[SC–SO3H][˙OH] | 3.7 × 10⁶![[thin space (1/6-em)]](https://www.rsc.org/images/entities/char_2009.gif) 20 20 |
70c | 6.80 × 10¹⁸ |
| R15 | SC–O˙ + 3˙OH → BB–O˙ + 6HF + 3CO2 | r 15 = k15[SC–O˙][˙OH] | 3 × 10⁷![[thin space (1/6-em)]](https://www.rsc.org/images/entities/char_2009.gif) 33 33 |
70c | 5.51 × 10¹⁹ |
| R16 | BB–O˙ + ˙OH → 2–(CF2)nCOOH + 3HF | r 16 = k16[BB–O˙][˙OH] | 8.5 × 10⁷![[thin space (1/6-em)]](https://www.rsc.org/images/entities/char_2009.gif) 33 33 |
70c | 1.56 × 10²⁰ |
| R17–R23 | –(CF2)nCOOH + 2˙OH → –(CF2)n−1COOH + CO2 + 2HF | r un = kun[–(CF2)nCOOH][˙OH] | 1.0 × 10⁶![[thin space (1/6-em)]](https://www.rsc.org/images/entities/char_2009.gif) 28 28![[thin space (1/6-em)]](https://www.rsc.org/images/entities/char_2009.gif) d d |
70c | 1.84 × 10¹⁸ |
| (7 ≤ n ≤ 1) | |||||
Our model relies on the following assumptions:
1. An isotherm zero-dimensional chemical reactor for the ionomer membrane. This model is characterised by uniform distribution of all involved chemical species over the whole reaction volume, which is equal to the membrane volume. Hence, no diffusion of species is observed. For highly reactive species such as ˙OH diffusion can indeed be neglected, as diffusion length in the nm range is estimated,31 which is 3 orders of magnitude lower than the average thickness of the PFSA ionomer membrane. Once formed, the ˙OH radicals react with other species in close vicinity, and thus the damage induced by the radical attack can be considered as highly localised.
2. Besides ˙OH, the generation of ˙OOH and ˙H is also covered in the model, though their involvement in chemical membrane degradation is neglected. Due to the relatively low enthalpy of the O–H bond in H2O2 (366 kJ mol−1) hydrogen abstraction from PFSA ionomers by ˙OOH radicals is thermodynamically highly unfavoured.10 Nevertheless, the possibility of a recombination of ˙OOH with carbon-centred radicals formed during the degradation cannot be ruled out. Gubler et al.31 argued that, despite the low steady-state concentration of ˙H at room temperature in the presence of ionomer (2 orders of magnitude lower than ˙OH), ˙H might have a considerable effect on the membrane degradation; however due to the lack of kinetic data, its influence cannot be evaluated by the model.
3. The primary source of ROS is assumed to be the reactions of H2O2 and both the ferrous (R1; Fenton reaction) and ferric ions (R2) and to a small extent the homolytic cleavage of the O–O bond in H2O2 (R6). All other sources of ROS and hydrogen radicals (e.g. formation at Pt particles73–75) are neglected in the model. In addition, the potential-dependent redox recycling of iron species34 in the membrane is not taken into account.
4. Although protons are involved in some of the chemical reactions, their rates are basically independent of the pH. Accordingly, pH effects20 are not considered.
5. We consider the changes in concentration due to the swelling of the ionomer membrane34 as negligible.
6. For the 0D chemical reactor a constant concentration (steady-state) of H2O2 is assumed.
7. A constant total iron concentration [Fex+] = [Fe2+] + [Fe3+] within the reactor is assumed, unless otherwise stated.
8. Chemical degradation of the membrane generally starts at the side-chain and proceeds (up to seven CF2 groups) along the backbone (Scheme 6).
9. For R15, R16 and R17–23 it is assumed that the first step (i.e. the attack of the hydroxyl radical) is rate-determining,20,28,33 which leads to the rate laws given in Table 1.
10. To account for the temperature-dependence of the rate constants, the Arrhenius approach (eqn (10)) is chosen. The necessary kinetic data are summarised in Table 1.
 | (10) |
| Parameter | Values |
|---|---|
| a 1 ppm Fe corresponds to 1.79 × 10⁻⁵ M. b [SC–SO3H]0 is calculated as the ratio between dry membrane density ρmembrane and BOL equivalent weight EW0.34 | |
| [H2O2] | 0.1–10 mM (constant) |
| [Fe2+]0 | 1–100 ppma |
| [Fe3+]0 | 1–100 ppma |
| [Fex+] | = [Fe2+]0 + [Fe3+]0 (constant) |
| [SC–SO3H]0 | 1.81 M34![[thin space (1/6-em)]](https://www.rsc.org/images/entities/char_2009.gif) b b |
| [H2] | 10 mM (constant)31 |
| [O2] | 7.5 mM (constant)31 |
| T | 333.15–368.15 K |
| δ membrane | 25–50 μm |
Methods
The system of coupled differential equations was solved by using a combination of the freely available kinetic simulation software COPASI85 (http://copasi.org) and an automatisation routine (COPASI driver, developed by us) implemented in the programming language Perl. All inputs are provided in a plain text file (obeying a certain syntax) and are then interpreted by the routine which generates the inputs for the commandline version of COPASI (version 4.24 (Build 197)). The results are processed by copd to yield output text files and graphical representations (time traces and rate plots; generated via gnuplot (version 5.2 patchlevel 4)), which allow a first fast assessment of the received data. Examples of an input file and output files of the routine are provided in the ESI.† Origin Pro 8 was used to fit the calculated data shown in Fig. 13. Simulations are generally fast (4.4 s for 100 h real-time simulation of a chemical reactor on a Windows 10 64-bit PC equipped with an Intel® Core i5-3210M processor and 8GB RAM). The kinetic framework can also be used with Linux. A web interface of the routine can be freely accessed under http://ptc-pc-139.tugraz.at/cgi-bin/Membrane_Degradation/.To inspect if the results generated by the COPASI driver are of general nature, we have also implemented the equations in Mathematica (Version 11). A comparison of the results obtained from both the copd routine and the Mathematica implementation is shown in the ESI.† The used Mathematica code is available in the ESI† and free to use.
Results and discussion
To establish a holistic chemical degradation modelling framework based on the equations presented in Table 1, several aspects – the interplay of iron species and radicals, their influence on the ionomer degradation and the dependence of fluoride emission on the temperature, [Fex+] and [H2O2] – are highlighted in this section. Furthermore, the model allows analysing the entire cause and effect chain of chemical degradation phenomena ranging from basic radical formation reactions to the (measurable) manifestations of membrane degradation (fluoride emissions, loss of ionomer moieties and loss of ion exchange capacity).Dynamic equilibrium between ferrous and ferric ion
Transition metals like Cu+ or Co2+ are also capable of converting H2O2 to ROS. The modular setup of the framework allows that reactions for additional metal contaminants can be added to the system easily. Iron ions, however, are known as contaminants in fuel cell membranes.57,60–62 We consider iron as a paradigm of all “Fenton-active” metal salts, whose exact distribution and concentrations remain unresolved. Furthermore, the reactions of Fe2+ and Fe3+ with H2O2 and radical species are very well studied (see R1–R5).15,17–19,22,23,58,59,88,89 All 5 reactions can be characterised as redox reactions and constitute a recycling system for the oxidation state of the iron. As a dynamic equilibrium between the two main oxidation states of iron (+II and +III) is established, it should not be relevant in which oxidation state the iron ions are present at the initial state of the simulation.This hypothesis was tested by comparing the time traces for the iron and radical species for two test cases – in the first one 10 ppm Fe is present in +II state at t = 0 and in the second one the same amount of Fe is in the +III state at t = 0. The results are presented in Fig. 3 and indicate that in the first few seconds of the simulation a constant ratio between both iron species is formed. From this moment on 99% of the iron species are in the +III state and lead to matching concentration curves for all depicted chemical species for both cases. The graphical representation of the time traces for the chemical reactor with [Fe2+] = 10 ppm and [Fe3+] = 0 ppm (left side of Fig. 3) reveals a remarkable correlation between the concentrations of the ferrous ion and the radicals ˙OH and ˙H. The time traces representing these radicals are strongly influenced by the transient concentration of ferrous ions. [˙OH] and [˙H] drop as soon as major parts of the ferrous ion are oxidised. This observation is reasonable, as the Fenton reaction (R1) is one of the prominent sources of ˙OH. The concentration of ˙H follows the time trace of ˙OH, as their sole source is the reaction between H2 and ˙OH (R12). Parallel to the oxidation of iron, the concentration of ˙OOH increases (with a short stagnation) until reaching a steady-state concentration after a few seconds.
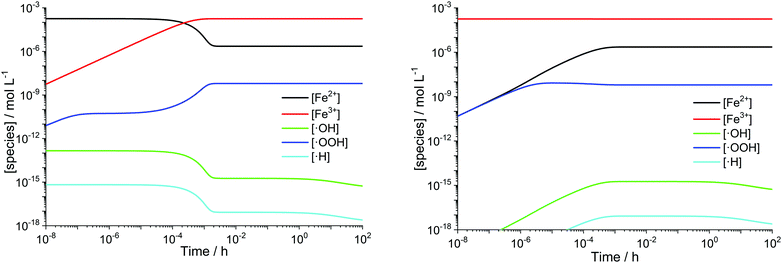 | ||
| Fig. 3 log–log plots of [Fex+] and radical concentrations as a function of time for T = 363.15 K. Left: [H2O2] = 1 mM, [Fe2+]0 = 10 ppm. Right: [H2O2] = 1 mM, [Fe3+]0 = 10 ppm. | ||
A similar behaviour is observable for the inverse case – all iron ions are in +III at t = 0 – shown on the right side of Fig. 3. The reduction of ferric ions to ferrous ions is only carried out via the reaction with H2O2 (R2) and subsequently with newly formed ˙OOH (R5). Up to 10−6 s, the concentrations of Fe2+ and ˙OOH, which are both products of R2, are the same and afterwards, the participation of the species in other chemical reactions leads to a bifurcation of the curves. The concentration of Fe3+ is only weakly influenced, as just about 1% of the ferric ions are reduced to ferrous ions. This finding is in good agreement with the results from the quasi-steady-state approach by Gubler et al.,31 who found that in the steady-state >99% of the iron ions are Fe3+.
The obtained range of the radical concentrations for the time between 10−3 h and 100 h are in accordance with the results by Gubler et al.,31 who calculated [˙OOH] ≈ 10−10 M, [˙OH] ≈ 10−16 M and [˙H] ≈ 10−19 M. Discrepancies might be explained by the fact that the model presented here does not rely on a steady-state approach and additionally, the temperature dependence of the chemical reactions is included.
Time evolution of membrane degradation
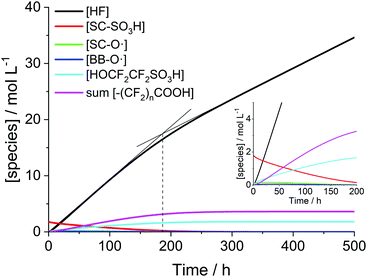
The time-scale at which a steady-state of the iron and radical species (except for ˙OH and ˙H) is established is clearly separated from that of the evolution of the membrane degradation products. As shown in Fig. 3 iron and radical species reach their final concentrations after a few seconds (and then do not depend on differences in the initial concentrations of Fe2+ and Fe3+ anymore). The evolution of the ionomer moieties and degradation products (HF and CO2) happens on a much longer time-scale as shown in Fig. 4. The radical ether cleavage at the side chain (first step in the degradation mechanism) leads to a decrease in sulfonic acid head group concentration (see Scheme 6). Immediately after the start of degradation the product of the radical ether cleavage SC–O˙ is built up and, with a certain delay, also BB–O˙ and the carboxylic acid terminated main chain fragments are generated. The occurrence of the intermediates also correlates with the drop of concentration of ˙OH observed after a few hours (see Fig. 3), as the degradation of these intermediates (R15–R23) consumes additional ˙OH. Despite the favourable kinetics for the attack of the membrane by ˙OH with rate constants >106 L mol−1 s−1 membrane degradation is greatly decelerated by the low steady-state concentration of ˙OH (see Fig. 3).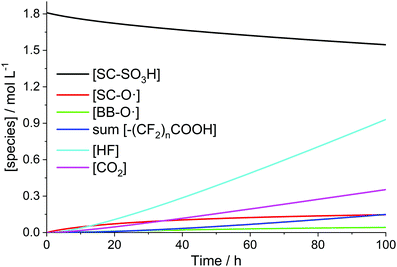 | ||
| Fig. 4 Time traces of PFSA ionomer functional groups and degradation products for [H2O2] = 1 mM, [Fe2+]0 = 10 ppm and T = 363.15 K. | ||
When plotting the concentration traces for harsher conditions ([H2O2] = 5 mM, [Fe2+]0 = 10 ppm and T = 368.15 K; Fig. 5), the curve for HF levels off in the area around 200 h. Up to this point, the fast degradation reactions of the side chain (R15 and R16) mainly contribute to the fluoride emission. As soon as most of the side chain is consumed (at around 200 h), the emitted fluoride stems exclusively from the unzipping of the main chain (R17–23), which is characterized by a smaller rate constant and becomes rate-determining in terms of fluoride emission.
Trends in fluoride emission rates
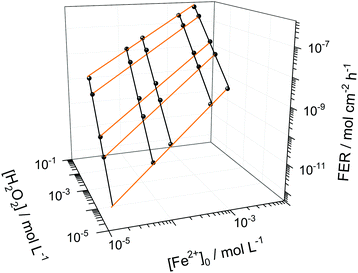
Among the most important parameters to assess the state of health of an ionomer membrane is the fluoride emission rate, which is usually determined in effluent water by using fluoride sensitive electrodes or high performance liquid chromatography.5 The FER is inversely proportional to the life-time of the membrane as it is directly linked to its loss of mass, which will be highlighted further below in the text.Besides time traces for the concentrations of the chemical species, the copd routine outputs FER data derived from the concentration of HF. The FER values (averaged over 100 h) were calculated for different [Fe2+]0 and [H2O2] values and T = 70 °C (see Fig. 6). For low [Fe2+]0 and [H2O2], small FER values are obtained, as expected. The FER shows a strong dependency on both [Fe2+]0 and [H2O2] which is indicated by the orange and black lines. Hence, a low concentration of both iron contaminants and detrimental hydrogen peroxide is necessary to protect the chemical integrity of the membrane.
Another factor which greatly influences the fluoride emission is the temperature within the fuel cell membrane (see Fig. 7). By increasing the temperature by only 10 K (e.g. going from 333.15 K to 343.15 K) while keeping [Fe2+] constant, a gain in the fluoride emission rate of up to one order of magnitude results. The increase in fluoride emission is less pronounced for higher initial concentrations of Fe2+.
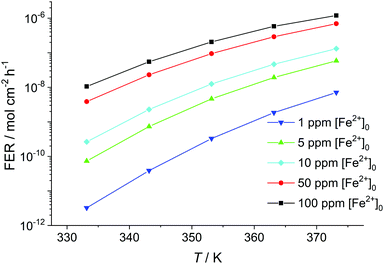 | ||
| Fig. 7 Fluoride emission rate (averaged over 100 h) given in mol cm−2 h−1 calculated as a function of temperature in K for [H2O2] = 1 mM and δmembrane = 50 μm. | ||
In addition to the FER, the ion exchange capacity of the ionomer is also an indicator of the chemical integrity of the membrane. When the sulfonic acid moieties are eliminated due to degradation phenomena, the ion exchange capacity (IEC) decreases. To investigate the correlation with the fluoride emission rate, we calculated the IEC (at BOL) as the ratio of the amount of sulfonic acid groups in mmol (n0) and the dry mass of the ionomer in g (mdry,0) in the following equation:33
 | (11) |
 | (12) |
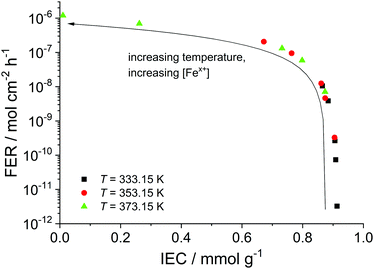 | ||
| Fig. 8 Fluoride emission rate (averaged over 100 h) is plotted as a function of the ion exchange capacity (at t = 100 h). The arrow indicates increasing temperature and iron concentration. | ||
Influence of iron input and leaching on membrane degradation
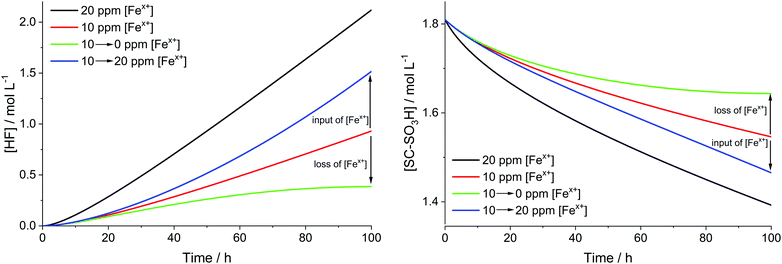
For the results presented so far, the total iron concentration [Fex+] was kept constant over the whole course of the simulation. The implications of changing the total iron concentration due to input of additional iron (e.g. demetallation of the Fe–N–C catalyst;38,39 originating from stainless steel end plates57,60) or loss of iron are demonstrated in the following paragraphs.For the analysis, it was assumed that all iron, which is added or lost, is in the oxidation state +II. This assumption is justified, as simulations presented above show that the dynamic equilibrium between both oxidation states of iron is established within seconds. The rate constant, which describes the input or loss (output) of iron (kI/O), was calculated so that the final total iron concentrations are reached at the end of the simulation (linear increase and decrease). This means that kI/O = ±4.972 × 10⁻¹⁰ mol L−1 s−1 (positive for 10 → 20 ppm and negative for 10 → 0 ppm) is obtained. The differential equation for [Fe2+] can be written as
 | (13) |
The results, which are depicted in Fig. 9, reveal that the input or leaching of Fex+ has a great influence on the kinetics of the degradation, as expected. The green curves show the cases when [Fex+] is decreased from 10 to 0 ppm. At the end of the simulation the slope of the green curves tends to 0, as the system becomes almost depleted of [Fex+]. For the increase of [Fex+] from 10 to 20 ppm (blue curves) the slope of the curves grows until the blue curves are parallel to the black curves (20 ppm [Fex+]). To avoid the acceleration of chemical degradation, it is highly important to optimize the constituents of the fuel cell (e.g. the end plates or the Fe–N–C catalysts) in a way that the input of additional iron species is minimized.
Comparison with experimental data
The simulation results presented so far were derived from a model that assumes a 0D chemical reactor. In reality, membrane degradation is a complex interplay of chemical and physical (thermal and mechanical) processes. To demonstrate that our model, despite its limitations, produces reasonable results, we will compare simulation results with a number of experimental data sets in the following paragraphs.Wong and Kjeang33 validated their membrane degradation model by comparing it to the results from a cyclic open circuit voltage accelerated stress test (COCV AST). 19F NMR spectroscopy was employed to monitor the loss of functional groups (–SO3H, CF(s), CF(m); for assignment see Fig. 2) during the AST. The measured concentrations of these groups after 0, 20, 50 and 70 h are shown in Fig. 10. Based on the experimental parameters ([Fex+] = 6 ppm) the results were reproduced by the simulation. The concentrations of the tertiary carbon moieties in Fig. 10 were calculated using the following relations:33
| [CF(s)] = [SC–SO3H] + [SC–O˙] | (14) |
| [CF(m)] = [SC–SO3H] + [SC–O˙] + [BB–O˙] | (15) |
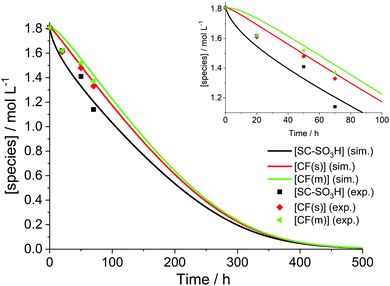 | ||
| Fig. 10 Temporal evolution of the ionomer functional moieties. The inset shows the curves and the experimental data during the first 100 h. Simulation (sim.) parameters: T = 368.15 K, [H2O2] = 5.2 mM, [Fe2+]0 = 6 ppm. Experimental (exp.) results were taken from an AST ([Fex+] = 6 ppm) by Wong and Kjeang.33 | ||
Since [H2O2] and the exact temperature at which the test was run were not stated33,91 (OCV phase under high temperature/low RH (relative humidity) conditions as described by Lim et al.91), these parameters were adjusted in the simulation to give the best agreement between the experimental data and the simulation. [H2O2] was set to 5.2 mM and the temperature to 368.15 K to yield the time traces in Fig. 10. The temperature (95 °C) is reasonable, as compatible temperatures are employed in fuel cell tests to accelerate degradation.37,92 The values of [H2O2] used in the simulations will be discussed below. Under these conditions, a complete consumption of ionomer moieties (SC–SO3H, CF(s) and CF(m)) is accomplished within approx. 500 hours. From this moment on only –COOH terminated main chain fragments are present in the chemical reactor.
As no error bars were presented with the experimental data33 used in Fig. 10, errors were estimated based on similar 19F NMR data.12,13 The results, which are outlined in Table 4, indicate that the relative deviations for both CF(s) and CF(m) are below or the same as the lowest experimental errors. For SC–SO3H the experimental errors are about half the size of the relative deviations between experimental and simulated data in Fig. 10. These findings might also provide an explanation for the similarity of the concentration values for all three monitored groups at 20 h in Fig. 10. Upon consideration of the experimental errors shown in Table 4 a similar trend in concentration (as for 50 and 70 h) is expected.
| PFSA moiety | Relative deviations between experimental (cexp) and simulated concentrations (csim)a | Experimental errorsb | |||
|---|---|---|---|---|---|
| 20 h | 50 h | 70 h | Lowest | Highest | |
a Calculated as  .
b Determined from the error bars of the experimental results. .
b Determined from the error bars of the experimental results.
|
|||||
| –CF2SO3H (≙SC–SO3H) | 5% | 6% | 6% | ±2% | ±3% |
| CF(s) | 6% | 2% | 3% | ±7% | ±9% |
| CF(m) | 8% | 3% | 4% | ±8% | ±10% |
Not only the loss of ionomer moieties during in situ tests but also the temporal evolution of the FER during such experiments can be simulated. The red dots in Fig. 11 show the experimental FER values obtained in a 10 h long OCV hold experiment by Singh et al.35 The data could be well reproduced (black line) by the kinetic framework ([H2O2] = 4 mM, [Fe2+]0 = 10 ppm, δmembrane = 50 μm). Due to the lack of diffusion in the 0D chemical reactor model a differentiation between fluoride emission on the cathode and anode side is not possible. Therefore, the sum of the experimental FER values, which were higher for the cathode side, had to be used for comparison.
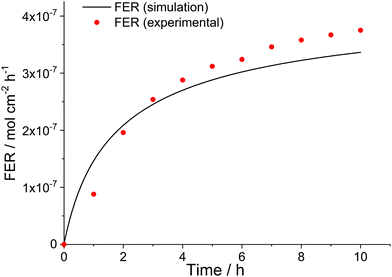 | ||
| Fig. 11 Time evolution of fluoride emission rate during an OCV hold test. Simulation parameters: T = 368.15 K, [H2O2] = 4 mM, [Fe2+]0 = 10 ppm; δmembrane = 50 μm. Experimental results (sum of fluoride emission rate for both anode and cathode side) were taken from an OCV hold test (T = 368.15 K) by Singh et al.35 | ||
Recently, Futter et al.36 obtained FER values in the range of 10−7 to 6 × 10⁻⁷ mol cm−2 h−1 depending on the conditions of the performed ASTs (panode = 1.5–2.5 bar, pcathode = 1.5–2.3 bar, RH = 30–75%). To compare the experimental results with the model, the authors multiplied the experimentally obtained FER values by a factor of 20.8 to account for non-detectable fluorine (in the form of membrane fragments). Thus, the FER values for detectable fluorine were found to be between 5 × 10⁻⁹ and 3 × 10⁻⁸ mol cm−2 h−1.36 As our model only calculates the FER based on detectable fluorine, the modelling result will be compared with these values. When taking the conditions from the stress test and the model36 ([Fex+] = 2.5 ppm; [Fe2+]0/[Fe3+]0 = 1; T = 368.15 K, Nafion® XL membrane (δmembrane = 25 μm) with a 8.33 μm thick reinforcement layer) and setting [H2O2] from 0.5 to 3 mM, FER values ranging from 3 × 10⁻⁹ to 3 × 10⁻⁸ mol cm−2 h−1 (averaged over 100 h) were obtained from the simulation. In addition to the reinforcement layer, cerium ions are incorporated into the membrane to protect the ionomer from ROS-mediated degradation. The role of cerium ions as scavengers will be discussed in more detail at the end of the Results section.
These examples demonstrate that predictions for the concentration of ionomer functional groups and the FER with reasonable assumptions are possible for in situ conditions. For the first two examples (shown in Fig. 10 and 11) the assumed values for [H2O2] are higher compared to experimental52,53 and simulated data.30,31 For the last example discussed in the paragraph above, the cerium scavengers incorporated into the membrane lead to a decreased FER; hence the FER value without any cerium additives is estimated to be 10−7 to 10−5 mol cm−2 h−1 (2 orders of magnitude higher, see below for discussion). This means that the parameters [H2O2] and [Fex+] have to be set to a higher value to reproduce the fluoride emission rates obtained by Futter et al.36
It should, however, be kept in mind that the 0D reactor can neither account for additional formation mechanisms of radical species (e.g. at Pt surfaces73–75) and additional membrane degradation mechanisms (such as the ˙H mediated membrane degradation13) nor for potential-dependent redox recycling of iron species.34 Furthermore, the experimental [H2O2] values (micromolar range) were obtained under OCV conditions and a temperature of 60 °C,52,53 whereas the simulations were performed at 95 °C. The situation is aggravated by the fact that under low humidity conditions the concentrations of H2O2 and contaminants are higher, as the membrane contains less water. All these effects contribute to the membrane degradation and hence a [H2O2] lower than that used in the simulation might be sufficient to cause the same effects. In this case the [H2O2] used in the simulation can be regarded as an “effective” concentration to trigger the analogue behaviour in the 0D chemical reactor model. When implementing the input of additional iron species, which are migrating from other parts of the PEMFC into the membrane (as shown in Fig. 9), [H2O2] can be set to a lower value to obtain the same FER values.
Simulation of Fenton experiments
To demonstrate the versatility of the kinetic framework, ex situ conditions in a Fenton test (i.e. high [H2O2] and (optionally) high [Fe2+]0) were also simulated. In contrast to the fuel cell conditions, in a typical Fenton test a membrane is dipped into a mixture of H2O2 and Fe2+ salts. Once H2O2 is consumed completely, the formation of reactive oxygen species, and hence the membrane degradation process, is paused. Sethuraman et al.37 measured the fluoride emission for a Nafion® 112 ionomer membrane impregnated with Fe2+ ions (13 ppm) and submerged into a 3% hydrogen peroxide solution. Further experimental details are summarised in Table 5.| Parameter | Values |
|---|---|
| T | 80 °C = 353.15 K |
| A membrane | ca. 25 cm2 |
| δ membrane | 50 μm |
| [H2O2]0 | 3 wt% = 0.98 M |
| [Fe2+]0 | 13 ppm (impregnated into the membrane) |
| Duration of test | 96 h |
For the simulation (Fig. 12) it was assumed that the total iron concentration stays constant within the membrane (no leaching out of Fex+). The only species which are washed out of the membrane are the side chain fragment formed in R14 and HF. The replacement of the H2O2 solution every 24 hours made it necessary to divide the whole process into 4 0D chemical reactors. The final concentrations of the chemical species obtained from one chemical reactor serve as initial concentrations for the subsequent chemical reactor. In the case of HF, the concentration values were accumulated. It is clearly visible in Fig. 12 that upon exchange of the H2O2 solution the degradation reactions resume. They are stopped again when H2O2 is consumed completely, which is accomplished within 2 hours after the replacement. However, it should be kept in mind that the simulations are geared toward in situ situations, where all species are contained within the hydrophilic domains of the membrane. In contrast, Fenton tests are characterised by a phase boundary between the ionomer membrane and the solution, in which the membrane is immersed. This comparison was done anyway as, under the assumption that there is no leaching of iron species, the Fenton reaction is confined to the ionomer and does not take place outside the membrane. In addition, H2O2 has to diffuse from the solution into the membrane to initiate the Fenton reaction. For a water swollen Nafion® membrane the time for H2O2 to diffuse through the whole ionomer membrane (50 μm) is calculated to be 9 s.31 This value is considerably lower than the time needed for the total consumption of H2O2 in the model (ca. 2 h); however this might have implications for the concentration within the membrane. In the 0D model a possible concentration gradient between the membrane and the solution is not considered.
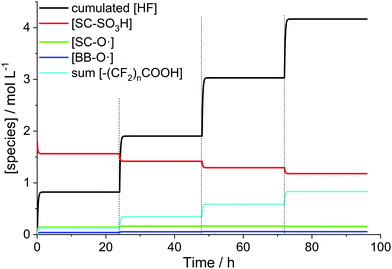 | ||
| Fig. 12 Simulated time evolution of the concentrations of hydrogen fluoride and ionomer moieties for a Nafion® 112 membrane (impregnated with 13 ppm Fe2+) submerged into a 3% H2O2 solution at 80 °C.37 The dashed lines mark the replacements of the H2O2 solution. | ||
Despite the caveats stated in the paragraph above, an average fluoride emission rate of 2.2 × 10⁻⁷ mol cm−2 h−1 could be obtained from the final hydrogen fluoride concentration (4.17 M). This value is in the same order of magnitude as 4 × 10⁻⁷ mol cm−2 h−1 determined by experiment.31,37
Membrane lifetime and fluoride emission rate
The side chain degradation mechanism employed in the kinetic framework leads to gradual loss of the side chain altering the properties of the hydrophilic domain. At first, the mechanical stability is not influenced by the degradation process, as only the head group and the first ether bridge are lost. Subsequently, R16 leads to a fragmentation of the main chain at the anchor position followed by shortening of the main chain (R17–23). From this point on, the mechanical properties of the membrane are affected.As stated in the introduction, this paper focuses only on the chemical membrane degradation phenomena, neglecting the mechanically and thermally induced destruction of the ionomer. Hence, their contributions to the lifetime of the membrane cannot be evaluated; however an estimation solely based on the results given by the kinetic framework is possible.
The question which still needs to be answered is how to define a criterion for the membrane lifetime. In principle, the FER as an indicator of the state of health of the membrane could serve as this criterion, although it will be more illustrative if a lifetime given in hours is obtained.
As the time traces of the functional moieties of the ionomer can be easily obtained by the copd routine, the lifetime could be, in principle, defined based on the concentration of a decisive functional group. The most important functional moiety in the ionomer is, without doubt, the sulfonic acid head group being responsible for the conduction of H+. Singh et al.35 observed in a COCV AST experiment that a loss of 15.6% of all sulfonic acid groups did not lead to a diminished proton conductivity. At the same time, the membrane was subjected to thinning (decrease of thickness by 1.4%). Lim et al.91 suggested that the decrease of [SC–SO3H] could be compensated by membrane thinning. Moreover, it was also argued that a fraction of the membrane fragments with intact sulfonic acid groups could reside within the membrane sustaining its conductivity.35
Based on these considerations, we define the parameter t99 as the time span, which is necessary to degrade 99% of all sulfonic acid groups (i.e. almost completion of reaction R14; due to the kinetics of the degradation reactions a degradation of 100% is not possible). Since R15 and R16 feature higher rate constants, all side chains are removed immediately once R14 is completed and only main chain fragments are left.
For different conditions33,35,36 the t99 values and the associated FER (averaged over 100 h) are given in Table 6. It is evident that the higher the [H2O2] and [Fex+] values the shorter the t99 value of the membrane. For the FER a reciprocal behaviour compared to t99 is visible. Thus, the calculated t99 and FER values are plotted and fitted with a reciprocal function (see Fig. 13). With this empirical correlation at hand, it is possible to estimate the t99 value based on the fluoride emission rate (averaged over 100 h).
| Conditions | t 99/h | FER/mol cm−2 h−1 |
|---|---|---|
| [H2O2] = 4 mM | 360 | 3.70 × 10⁻⁷ |
| [Fe2+]0 = 10 ppm | ||
| [H2O2] = 5.2 mM | 460 | 5.15 × 10⁻⁸ |
| [Fe2+]0 = 6 ppm | ||
| [H2O2] = 3 mM | 1920 | 2.86 × 10⁻⁸ |
| [Fex+] = 2.5 ppm, [Fe2+]0/[Fe3+]0 = 1 | ||
| [H2O2] = 0.5 mM | 11![[thin space (1/6-em)]](https://www.rsc.org/images/entities/char_2009.gif) 400 400 |
2.63 × 10⁻⁹ |
| [Fex+] = 2.5 ppm, [Fe2+]0/[Fe3+]0 = 1 | ||
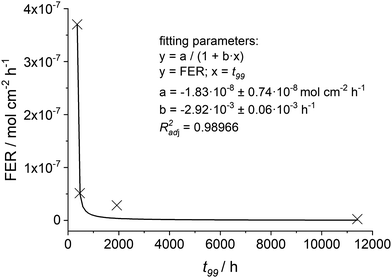 | ||
| Fig. 13 The calculated fluoride emission rate (averaged over 100 h) is plotted as function of t99. The crosses mark the four different conditions given in Table 6 and the black line indicates the fitted function. | ||
Nevertheless, t99 should be considered as an upper limit of the membrane lifetime based on chemical degradation phenomena. It is expected to be further decreased by thermal and mechanical degradation. Yoon and Huang93 performed gas-phase Fenton experiments, in which a Nafion® 212 membrane was conditioned with Fex+ salts and subjected to gaseous H2O2 while keeping the membrane under mechanical stress. The authors observed an acceleration of chemical degradation.93 In a similar study by Kusoglu et al.94 (liquid-phase Fenton test of a compressed membrane), it was observed that the fluoride emission increases with the applied pressure. From these findings it was concluded that mechanical and chemical stressors act together, thereby influencing the kinetics of the degradation reactions.94
Mitigation of fuel cell degradation with cerium salts
To protect the chemical integrity of the membrane, two strategies are feasible: First, the input of transition metal contaminants and the amount of H2O2 produced during operation should be minimized. If this basic mitigation strategy is not possible, the number of reactive oxygen species can be reduced using radical scavengers. In the last two decades, various mitigation strategies have been investigated – an excellent overview is given in the review by Zatoń et al.5Cerium serves either in its ionic form (Ce3+, Ce4+)41–44 or as solid cerium oxide (ceria, CeO2)45,46 as a radical scavenger. When ceria is incorporated into the membrane, it dissolves under operating conditions and produces both trivalent and tetravalent cerium ions.45,99 A detailed scheme describing how CeO2 mitigates membrane degradation by scavenging ROS was presented by Prabhakaran et al.47 The most stable oxidation states +III and +IV form a redox couple (E0(Ce3+/Ce4+) = −1.44 V in 0.5 M or 1 M H2SO4100) rendering it a potent reactant in one-electron redox processes (i.e. quenching of radicals). The trivalent ion reacts with ˙OH to form H2O and Ce4+,83 whereas the tetravalent ion reacts with H2O2 to regenerate Ce3+.95 Ce4+ is also known to oxidize Fe2+ to Fe3+;98 hence the presence of tetravalent cerium ions slows down the Fenton reaction.101Table 7 gives an overview of the kinetic data for the reactions involving Cex+ species.45,83,95–98,102 Wong and Kjeang45 estimated the same activation energy for reactions R24–R27 in their model to describe the membrane degradation in ceria-supported fuel cells.
| Reaction | k (T = 298.15 K) [L mol−1 s−1] | E a [kJ mol−1] | A [L mol−1 s−1] | ||
|---|---|---|---|---|---|
| a For all four reactions the same activation energy is given in ref. 45. | |||||
| R24 | Ce4+ + H2O2 → Ce3+ + ˙OOH + H+ | r 24 = k24[Ce4+][H2O2] | 106![[thin space (1/6-em)]](https://www.rsc.org/images/entities/char_2009.gif) 95 95 |
5845![[thin space (1/6-em)]](https://www.rsc.org/images/entities/char_2009.gif) a a |
1.45 × 10¹⁶ |
| R25 | Ce4++ ˙OOH → Ce3+ + O2 + H+ | r 25 = k25[Ce4+][˙OOH] | 2.7 × 10⁶![[thin space (1/6-em)]](https://www.rsc.org/images/entities/char_2009.gif) 95,96 95,96 |
5845![[thin space (1/6-em)]](https://www.rsc.org/images/entities/char_2009.gif) a a |
3.92 × 10¹⁶ |
| R26 | Ce3+ + ˙OH + H+ → Ce4+ + H2O | r 26 = k26[Ce3+][˙OH] | 3 × 10⁸![[thin space (1/6-em)]](https://www.rsc.org/images/entities/char_2009.gif) 83 83 |
5845![[thin space (1/6-em)]](https://www.rsc.org/images/entities/char_2009.gif) a a |
4.35 × 10¹⁸ |
| R27 | Ce3+ + ˙OOH + H+ → Ce4+ + H2O2 | r 27 = k27[Ce3+][˙OOH] | 2.1 × 10⁵![[thin space (1/6-em)]](https://www.rsc.org/images/entities/char_2009.gif) 97 97 |
5845![[thin space (1/6-em)]](https://www.rsc.org/images/entities/char_2009.gif) a a |
3.05 × 10¹⁵ |
| R28 | Ce4+ + Fe2+ → Fe3+ + Ce3+ | r 28 = k28[Ce4+][Fe2+] | 1.3 × 10⁶![[thin space (1/6-em)]](https://www.rsc.org/images/entities/char_2009.gif) 98 98 |
39.7 | 1.20 × 10¹³ |
To study the influence of cerium scavengers on the ROS-initiated membrane degradation, the reactions from Table 7 were coupled to the main kinetic framework (Table 1). For a set of parameters ([H2O2] = 1 mM, [Fe2+]0 = 5 ppm and T = 353.15 K) simulations with different concentrations of Ce3+ were performed (see Fig. 14). Per Ce3+ ion three protons in the membrane are displaced and thus, three sulfonic acid groups (BOL concentration 1.81 M) undergo complexation with Ce3+.41 It is clearly evident that Ce salts mitigate the destructive effects of the ROS. The higher the concentration of the cerium ions, the more ROS are quenched by the Ce3+/Ce4+ system leading to lower fluoride emission rates and a smaller loss of hydrophilic head groups. When 30% of the SC–SO3H sites are complexed with Ce3+ (at BOL), the FER (averaged over 100 h) is reduced by 2 orders of magnitude.
A situation similar to the dynamic equilibrium between the redox states of iron is evident for the cerium system. Simulations show that more than 99% of the cerium ions reside in the trivalent state and hence, are active for quenching ˙OH, the most destructive oxygen species. This is well in line with the modelling results by Gubler et al.101 and Wong and Kjeang,45,103 who also found that the dominant oxidation state in the cerium system is +III.
Coms et al.41 incorporated Ce3+ ions (15% of SC–SO3H complexed) into the membrane and found that the FER is reduced by 3 orders of magnitude (from 10−6 mol cm−2 h−1 to 1.6 × 10⁻⁹ mol cm−2 h−1). When Ce3+ ions were introduced by spraying on both anode and cathode side (about 1% of SC–SO3H complexed), the same FER value of 1.6 × 10⁻⁹ mol cm−2 h−1 was measured.41 Similar results were presented by Zatoń et al.,44 who observed a reduction of 2 orders of magnitude when loading the membrane with 0.04 mmol Ce3+ g−1 membrane.
The experimental results mentioned here demonstrate that Ce3+ ions are highly effective in protecting the chemical integrity of the membrane. In principle, the simulations illustrate the trend that higher [Ce3+] values lead to lower fluoride emission. However, the fact that at a ratio of complexation of 1% the FER drops by 3 orders of magnitude cannot satisfactorily be explained by the kinetic framework.
A fundamental assumption in the kinetic framework presented here is that all chemical species are distributed homogeneously throughout the membrane, though it is known that cerium ions migrate during the assembly and operation of the fuel cell. Stewart et al.104 measured the cerium levels in Nafion® XL membranes, and found that the cerium level decreased from the BOL value of 7 μg cm−2 upon pressing and conditioning and subsequently during accelerated stress testing. The authors concluded that the cerium ions leave the membrane and enrich at both anode and cathode catalyst.104 Zatoń et al.44 also presented evidence that cerium migrates to the electrodes and is additionally eluted from the fuel cell, which limits the applicability of cerium scavengers in PEMFCs. Moreover, at increased Ce loadings (e.g. of SC–SO3H complexed41) the performance of the fuel cell is also diminished.41,43
In addition to the reactions shown in Table 7 other pathways are also possible. A reduction of Ce4+ by H2 or H2O could also happen on Pt deposits in the membrane or Ce3+ can be oxidized by hydrogen radicals.42 Under operating conditions, Ce4+ is also reduced to Ce3+ electrochemically.45 Without doubt, these reactions influence the equilibrium of Ce3+ and Ce4+ and hence, also the radical scavenging.
Instead of using the expensive lanthanide cerium, a cheaper transition metal such as manganese can also be employed to quench ROS due to its rich redox chemistry.41,44 A similar kinetic framework for manganese species was presented by Gubler et al.101
Conclusions
The zero-dimensional kinetic framework presented in this work allows to simulate chemical degradation phenomena in a fuel cell and (with caution) also under ex situ (Fenton) conditions. The kinetic framework relies on the assumption that the PFSA ionomer membrane in a fuel cell behaves like a 0D chemical reactor, and hence inhomogeneous distributions of chemical species are not covered here. Nevertheless, the said kinetic framework, which combines published data14–28,33 and frameworks,30–36 reproduces various sets of recent experimental data33,35–37 (concentrations of ionomer moieties and FERs). To account for effects like additional sources of radicals73–75 or the potential-dependent redox recycling of iron species,34 the used Fex+ and H2O2 concentrations might be higher than in a real fuel cell under working or OCV conditions.At the core of the model is the Fenton reaction between hydrogen peroxide and Fe2+, which leads to the formation of hydroxyl radicals. The role of the Pt catalyst or Pt deposits in the membrane in the overall degradation is not considered in this kinetic framework. This is mainly due to the fact that the dimensionality of the reactor model conflicts with processes happening at phase boundaries such as Pt surfaces, which request a higher dimensionality of the model and the implementation of diffusive processes. The implications of Pt catalyst for the chemical membrane degradation will be addressed in an upcoming publication.
Instead of Pt, the involvement of alternative ORR catalysts in membrane degradation is outlined. Such catalysts offer in principle a cheap, though effective, replacement for precious Pt; however, the demetallation in the case of Fe–N–C should be regarded with care. Leaching of iron species from the catalyst (or other constituents of the fuel cell system) in combination with hydrogen peroxide poses a major threat to the chemical integrity of the membrane. Thus, is it imperative to minimize the Fe contamination and the input of additional Fe species into the system. Not only iron species, but also other metal species like Ti3+,66 Co2+![[thin space (1/6-em)]](https://www.rsc.org/images/entities/char_2009.gif) 68,69 or Cu+
68,69 or Cu+![[thin space (1/6-em)]](https://www.rsc.org/images/entities/char_2009.gif) 70–72 are known to produce ROS. This should be borne in mind when developing and testing new materials and catalysts to be used in PEMFC systems.
70–72 are known to produce ROS. This should be borne in mind when developing and testing new materials and catalysts to be used in PEMFC systems.
Since Fe is present in both the +II and +III oxidation states in our kinetic framework, the interplay of ferrous and ferric ions (redox recycling) was investigated. Interestingly, the simulation results (concentration traces, FERs) do not depend on the oxidation state of Fe at t = 0. It was found that a dynamic equilibrium between both oxidation states of iron is established rather rapidly (within several seconds), compared to the long simulation times (usually 100 hours). In this dynamic equilibrium 99% of the iron resides in the +III state (i.e. the Fenton-inactive redox state), which greatly decelerates the degradation of the membrane. For a real PEMFC system, a potential-dependent redox recycling of Fenton-active iron species was proposed by Wong and Kjeang.34 The authors found in their simulations that the fluoride emission is lowered when the system is operated at voltages below 0.7 V, as [Fe2+] is decreased.
In an approach to describe membrane lifetimes the parameter t99 was introduced. It represents the time necessary to degrade 99% of all sulfonic acid head groups. A reciprocal correlation between this calculated parameter and the average FER was found. Hence, it is possible to predict chemical membrane lifetimes (or to be more precise, an upper limit) from FER values, which are accessible by experiment. Degradation phenomena of thermal and mechanical nature5–7 are not considered here. It can be expected that these degradation mechanisms lower the lifetime based on chemical degradation, as mechanical stress exacerbates the damage induced by chemical stressors.93,94
To demonstrate the facile expandability of the kinetic framework, five additional equations describing reactions of H2O2, ROS and Fe2+ with cerium ions, which act as radical quenchers, are coupled to the main framework. Simulations with the expanded framework show that the addition of cerium ions to the membrane reduces the loss of sulfonic acid head groups and decreases the fluoride emission. Yet, the fact that the FER is reduced by 3 orders of magnitude, when about 1% of all sulfonic acid groups are complexed with Ce3+,41 cannot be explained satisfactorily by the extended 0D reactor model. A reduction of the FER by 2 orders of magnitude is observed when 30% of all SC–SO3H groups are complexed with Ce3+ (at BOL).
We have developed a routine providing extensive data sets in a short amount of time. Graphical representations generated by the copd routine via gnuplot allow a fast assessment of the data prior to further manipulation of data. A web interface of the kinetic framework is available under http://ptc-pc-139.tugraz.at/cgi-bin/Membrane_Degradation/.
In the future, further steps to explore the connection between simulated and experimental data will be undertaken. To do so, the 0D chemical reactor model will be integrated into a more extensive fuel cell degradation model.
Conflicts of interest
There are no conflicts to declare.Acknowledgements
Financial support by the Austrian Research Promotion Agency (FFG; project number: 854867) is gratefully acknowledged. This work is part of the SoH4PEM (State of Health Monitoring for Proton Exchange Membrane Fuel Cell Stacks) project. The research is partially funded by the Slovenian Research Agency (research core funding no. P2-0401).Notes and references
- I. Staffell, D. Scamman, A. Velazquez Abad, P. Balcombe, P. E. Dodds, P. Ekins, N. Shah and K. R. Ward, Energy Environ. Sci., 2019, 12, 463–491 RSC.
- T. Wilberforce, Z. El-Hassan, F. N. Khatib, A. Al Makky, A. Baroutaji, J. G. Carton and A. G. Olabi, Int. J. Hydrogen Energy, 2017, 42, 25695–25734 CrossRef CAS.
- R. J. Detz, J. N. H. Reek and B. C. C. van der Zwaan, Energy Environ. Sci., 2018, 11, 1653–1669 RSC.
- M. R. Shaner, H. A. Atwater, N. S. Lewis and E. W. McFarland, Energy Environ. Sci., 2016, 9, 2354–2371 RSC.
- M. Zatoń, J. Rozière and D. J. Jones, Sustainable Energy Fuels, 2017, 1, 409–438 RSC.
- R. Borup, J. Meyers, B. Pivovar, Y. S. Kim, R. Mukundan, N. Garland, D. Myers, M. Wilson, F. Garzon, D. Wood, P. Zelenay, K. More, K. Stroh, T. Zawodzinski, J. Boncella, J. E. McGrath, M. Inaba, K. Miyatake, M. Hori, K. Ota, Z. Ogumi, S. Miyata, A. Nishikata, Z. Siroma, Y. Uchimoto, K. Yasuda, K. Kimijima and N. Iwashita, Chem. Rev., 2007, 107, 3904–3951 CrossRef CAS PubMed.
- A. Kusoglu and A. Z. Weber, Chem. Rev., 2017, 117, 987–1104 CrossRef CAS PubMed.
- A. Collier, H. Wang, X. Z. Yuan, J. Zhang and D. P. Wilkinson, Int. J. Hydrogen Energy, 2006, 31, 1838–1854 CrossRef CAS.
- D. E. Curtin, R. D. Lousenberg, T. J. Henry, P. C. Tangeman and M. E. Tisack, J. Power Sources, 2004, 131, 41–48 CrossRef CAS.
- F. D. Coms, ECS Transactions, ECS, 2008, vol. 16, pp. 235–255 Search PubMed.
- L. Ghassemzadeh, K.-D. Kreuer, J. Maier and K. Müller, J. Phys. Chem. C, 2010, 114, 14635–14645 CrossRef CAS.
- L. Ghassemzadeh and S. Holdcroft, J. Am. Chem. Soc., 2013, 135, 8181–8184 CrossRef CAS PubMed.
- L. Ghassemzadeh, T. J. Peckham, T. Weissbach, X. Luo and S. Holdcroft, J. Am. Chem. Soc., 2013, 135, 15923–15932 CrossRef CAS PubMed.
- F. S. Dainton and J. Rowbottom, Trans. Faraday Soc., 1953, 49, 1160–1173 RSC.
- T. Rigg, W. Taylor and J. Weiss, J. Chem. Phys., 1954, 22, 575–577 CrossRef CAS.
- T. Lundström, H. Christensen and K. Sehested, Radiat. Phys. Chem., 2001, 61, 109–113 CrossRef.
- Y. Lee, C. Lee and J. Yoon, Chemosphere, 2003, 51, 963–971 CrossRef CAS PubMed.
- C. Lee and J. Yoon, Chemosphere, 2004, 56, 923–934 CrossRef CAS PubMed.
- T. Lundström, H. Christensen and K. Sehested, Radiat. Phys. Chem., 2004, 69, 211–216 CrossRef.
- A. M. Dreizler and E. Roduner, Fuel Cells, 2012, 12, 132–140 CrossRef CAS.
- P. A. Giguère and I. D. Liu, Can. J. Chem., 1957, 35, 283–293 CrossRef.
- C. Walling and A. Goosen, J. Am. Chem. Soc., 1973, 95, 2987–2991 CrossRef CAS.
- G. G. Jayson, B. J. Parsons and A. J. Swallow, J. Chem. Soc., Faraday Trans. 1, 1973, 69, 236–242 RSC.
- B. H. J. Bielski, Photochem. Photobiol., 1978, 28, 645–649 CrossRef CAS.
- H. Christensen and K. Sehested, Radiat. Phys. Chem., 1981, 18, 723–731 CrossRef CAS.
- H. Christensen, K. Sehested and H. Corfitzen, J. Phys. Chem., 1982, 86, 1588–1590 CrossRef CAS.
- H. Christensen and K. Sehested, J. Phys. Chem., 1983, 87, 118–120 CrossRef CAS.
- P. Maruthamuthu, S. Padmaja and R. E. Huie, Int. J. Chem. Kinet., 1995, 27, 605–612 CrossRef CAS.
- T. Xie and C. A. Hayden, Polymer, 2007, 48, 5497–5506 CrossRef CAS.
- A. A. Shah, T. R. Ralph and F. C. Walsh, J. Electrochem. Soc., 2009, 156, B465–B484 CrossRef CAS.
- L. Gubler, S. M. Dockheer and W. H. Koppenol, J. Electrochem. Soc., 2011, 158, B755–B769 CrossRef CAS.
- M. Ghelichi, P.-É. A. Melchy and M. H. Eikerling, J. Phys. Chem. B, 2014, 118, 11375–11386 CrossRef CAS PubMed.
- K. H. Wong and E. Kjeang, J. Electrochem. Soc., 2014, 161, F823–F832 CrossRef CAS.
- K. H. Wong and E. Kjeang, ChemSusChem, 2015, 8, 1072–1082 CrossRef CAS PubMed.
- R. Singh, P. C. Sui, K. H. Wong, E. Kjeang, S. Knights and N. Djilali, J. Electrochem. Soc., 2018, 165, F3328–F3336 CrossRef CAS.
- G. A. Futter, A. Latz and T. Jahnke, J. Power Sources, 2019, 410–411, 78–90 CrossRef CAS.
- V. A. Sethuraman, J. W. Weidner, A. T. Haug and L. V. Protsailo, J. Electrochem. Soc., 2008, 155, B119–B124 CrossRef CAS.
- D. Banham, S. Ye, K. Pei, J. Ozaki, T. Kishimoto and Y. Imashiro, J. Power Sources, 2015, 285, 334–348 CrossRef CAS.
- C. H. Choi, C. Baldizzone, G. Polymeros, E. Pizzutilo, O. Kasian, A. K. Schuppert, N. Ranjbar Sahraie, M.-T. Sougrati, K. J. J. Mayrhofer and F. Jaouen, ACS Catal., 2016, 6, 3136–3146 CrossRef CAS.
- R. Chenitz, U. I. Kramm, M. Lefèvre, V. Glibin, G. Zhang, S. Sun and J.-P. Dodelet, Energy Environ. Sci., 2018, 11, 365–382 RSC.
- F. D. Coms, H. Liu and J. E. Owejan, ECS Transactions, ECS, 2008, vol. 16, pp. 1735–1747 Search PubMed.
- M. Danilczuk, S. Schlick and F. D. Coms, Macromolecules, 2009, 42, 8943–8949 CrossRef CAS.
- A. M. Baker, R. Mukundan, D. Spernjak, E. J. Judge, S. G. Advani, A. K. Prasad and R. L. Borup, J. Electrochem. Soc., 2016, 163, F1023–F1031 CrossRef CAS.
- M. Zatoń, B. Prélot, N. Donzel, J. Rozière and D. J. Jones, J. Electrochem. Soc., 2018, 165, F3281–F3289 CrossRef.
- K. H. Wong and E. Kjeang, J. Electrochem. Soc., 2017, 164, F1179–F1186 CrossRef CAS.
- B. P. Pearman, N. Mohajeri, R. P. Brooker, M. P. Rodgers, D. K. Slattery, M. D. Hampton, D. A. Cullen and S. Seal, J. Power Sources, 2013, 225, 75–83 CrossRef CAS.
- V. Prabhakaran, C. G. Arges and V. Ramani, Proc. Natl. Acad. Sci. U. S. A., 2012, 109, 1029–1034 CrossRef CAS PubMed.
- A. Panchenko, H. Dilger, E. Möller, T. Sixt and E. Roduner, J. Power Sources, 2004, 127, 325–330 CrossRef CAS.
- M. Danilczuk, F. D. Coms and S. Schlick, J. Phys. Chem. B, 2009, 113, 8031–8042 CrossRef CAS PubMed.
- H. S. Wroblowa, Y.-C. Pan and G. Razumney, J. Electroanal. Chem. Interfacial Electrochem., 1976, 69, 195–201 CrossRef CAS.
- A. M. Gómez-Marín, R. Rizo and J. M. Feliu, Catal. Sci. Technol., 2014, 4, 1685–1698 RSC.
- W. Liu and D. Zuckerbrod, J. Electrochem. Soc., 2005, 152, A1165–A1170 CrossRef CAS.
- C. Chen and T. Fuller, ECS Transactions, ECS, 2007, vol. 11, pp. 1127–1137 Search PubMed.
- M. Inaba, T. Kinumoto, M. Kiriake, R. Umebayashi, A. Tasaka and Z. Ogumi, Electrochim. Acta, 2006, 51, 5746–5753 CrossRef CAS.
- H. J. H. Fenton, J. Chem. Soc., Trans., 1894, 65, 899–910 RSC.
- G. Ruppert, R. Bauer and G. Heisler, J. Photochem. Photobiol., A, 1993, 73, 75–78 CrossRef CAS.
- A. Pozio, R. F. Silva, M. De Francesco and L. Giorgi, Electrochim. Acta, 2003, 48, 1543–1549 CrossRef CAS.
- W. G. Barb, J. H. Baxendale, P. George and K. R. Hargrave, Trans. Faraday Soc., 1951, 47, 462–500 RSC.
- W. G. Barb, J. H. Baxendale, P. George and K. R. Hargrave, Trans. Faraday Soc., 1951, 47, 591–616 RSC.
- D. D. Papadias, R. K. Ahluwalia, J. K. Thomson, H. M. Meyer, M. P. Brady, H. Wang, J. A. Turner, R. Mukundan and R. Borup, J. Power Sources, 2015, 273, 1237–1249 CrossRef CAS.
- F. D. Coms, S. Schlick and M. Danilczuk, in The Chemistry of Membranes Used in Fuel Cells: Degradation and Stabilization, ed. S. Schlick, John Wiley & Sons, Inc., Hoboken, NJ, USA, 2018, pp. 75–106 Search PubMed.
- H. Liu, J. Zhang, F. D. Coms, W. Gu, B. Litteer and H. A. Gasteiger, ECS Transactions, ECS, 2006, vol. 3, pp. 493–505 Search PubMed.
- P. Maletzky, R. Bauer, J. Lahnsteiner and B. Pouresmael, Chemosphere, 1999, 38, 2315–2325 CrossRef CAS.
- S. M. Andersen, J. Fuel Cell Sci. Technol., 2016, 12, 061010 CrossRef.
- C. Walling, Acc. Chem. Res., 1975, 8, 125–131 CrossRef CAS.
- A. Bosnjakovic and S. Schlick, J. Phys. Chem. B, 2004, 108, 4332–4337 CrossRef CAS.
- L. Ghassemzadeh, K. D. Kreuer, J. Maier and K. Müller, J. Power Sources, 2011, 196, 2490–2497 CrossRef CAS.
- M. B. Kadiiska, K. R. Maples and R. P. Mason, Arch. Biochem. Biophys., 1989, 275, 98–111 CrossRef CAS PubMed.
- P. M. Hanna, M. B. Kadiiska and R. P. Mason, Chem. Res. Toxicol., 1992, 5, 109–115 Search PubMed.
- J. W. Moffett and R. G. Zika, Environ. Sci. Technol., 1987, 21, 804–810 CrossRef CAS PubMed.
- F. J. Millero, V. K. Sharma and B. Karn, Mar. Chem., 1991, 36, 71–83 CrossRef CAS.
- A. D. Bokare and W. Choi, J. Hazard. Mater., 2014, 275, 121–135 CrossRef CAS PubMed.
- V. Atrazhev, E. N. Timokhina, S. F. Burlatsky, V. I. Sultanov, T. H. Madden and M. Gummalla, ECS Transactions, ECS, 2008, vol. 6, pp. 69–74 Search PubMed.
- D. Zhao, B. L. Yi, H. M. Zhang and M. Liu, J. Power Sources, 2010, 195, 4606–4612 CrossRef CAS.
- M. P. Rodgers, B. P. Pearman, L. J. Bonville, D. A. Cullen, N. Mohajeri and D. K. Slattery, J. Electrochem. Soc., 2013, 160, F1123–F1128 CrossRef CAS.
- M. I. Bro and C. A. Sperati, J. Polym. Sci., 1959, 38, 289–295 CrossRef CAS.
- K. E. Schwiebert, K. G. Raiford, G. Escobedo and G. Nagarajan, ECS Transactions, ECS, 2006, vol. 1, pp. 303–311 Search PubMed.
- C. Zhou, M. A. Guerra, Z.-M. Qiu, T. A. Zawodzinski and D. A. Schiraldi, Macromolecules, 2007, 40, 8695–8707 CrossRef CAS.
- N. E. Cipollini, ECS Transactions, ECS, 2007, vol. 11, pp. 1071–1082 Search PubMed.
- M. Danilczuk, A. J. Perkowski and S. Schlick, Macromolecules, 2010, 43, 3352–3358 CrossRef CAS.
- M. K. Kadirov, A. Bosnjakovic and S. Schlick, J. Phys. Chem. B, 2005, 109, 7664–7670 CrossRef CAS PubMed.
- A. Bosnjakovic, M. K. Kadirov and S. Schlick, Res. Chem. Intermed., 2007, 33, 677–687 CrossRef CAS.
- G. V. Buxton, C. L. Greenstock, W. P. Helman and A. B. Ross, J. Phys. Chem. Ref. Data, 1988, 17, 513–886 CrossRef CAS.
- T. Tokumasu, I. Ogawa, M. Koyama, T. Ishimoto and A. Miyamoto, J. Electrochem. Soc., 2011, 158, B175–B179 CrossRef CAS.
- S. Hoops, S. Sahle, R. Gauges, C. Lee, J. Pahle, N. Simus, M. Singhal, L. Xu, P. Mendes and U. Kummer, Bioinformatics, 2006, 22, 3067–3074 CrossRef CAS PubMed.
- T. Madden, D. Weiss, N. Cipollini, D. Condit, M. Gummalla, S. Burlatsky and V. Atrazhev, J. Electrochem. Soc., 2009, 156, B657–B662 CrossRef CAS.
- Y. Zhao, M. Yamaguchi, E. Tsuchida, Y.-K. Choe and T. Ikeshoji, J. Phys. Chem. C, 2018, 122, 20135–20143 CrossRef CAS.
- J. D. Rush and B. H. J. Bielski, J. Phys. Chem., 1985, 89, 5062–5066 CrossRef CAS.
- G. G. Jayson, B. J. Parsons and A. J. Swallow, J. Chem. Soc., Faraday Trans. 1, 1972, 68, 2053–2058 RSC.
- V. A. Sethuraman, J. W. Weidner, A. T. Haug, S. Motupally and L. V. Protsailo, J. Electrochem. Soc., 2008, 155, B50–B57 CrossRef CAS.
- C. Lim, L. Ghassemzadeh, F. Van Hove, M. Lauritzen, J. Kolodziej, G. G. Wang, S. Holdcroft and E. Kjeang, J. Power Sources, 2014, 257, 102–110 CrossRef CAS.
- M. Chandesris, R. Vincent, L. Guetaz, J.-S. Roch, D. Thoby and M. Quinaud, Int. J. Hydrogen Energy, 2017, 42, 8139–8149 CrossRef CAS.
- W. Yoon and X. Huang, ECS Transactions, 2010, vol. 33, pp. 907–911 Search PubMed.
- A. Kusoglu, M. Calabrese and A. Z. Weber, ECS Electrochem. Lett., 2014, 3, F33–F36 CrossRef CAS.
- G. Czapski, B. H. J. Bielski and N. Sutin, J. Phys. Chem., 1963, 67, 201–203 CrossRef CAS.
- B. H. J. Bielski, D. E. Cabelli, R. L. Arudi and A. B. Ross, J. Phys. Chem. Ref. Data, 1985, 14, 1041–1100 CrossRef CAS.
- D. Meisel, Y. A. Ilan and G. Czapski, J. Phys. Chem., 1974, 78, 2330–2334 CrossRef CAS.
- G. Dulz and N. Sutin, Inorg. Chem., 1963, 2, 917–921 CrossRef CAS.
- S. A. Hayes, P. Yu, T. J. O’Keefe, M. J. O’Keefe and J. O. Stoffer, J. Electrochem. Soc., 2002, 149, C623–C630 CrossRef CAS.
- E. Wadsworth, F. R. Duke and C. A. Goetz, Anal. Chem., 1957, 29, 1824–1825 CrossRef CAS.
- L. Gubler and W. H. Koppenol, J. Electrochem. Soc., 2011, 159, B211–B218 CrossRef.
- T. J. Sworski, H. A. Mahlman and R. W. Matthews, J. Phys. Chem., 1971, 75, 250–255 CrossRef CAS.
- K. H. Wong and E. Kjeang, J. Electrochem. Soc., 2019, 166, F128–F136 CrossRef CAS.
- S. M. Stewart, D. Spernjak, R. Borup, A. Datye and F. Garzon, ECS Electrochem. Lett., 2014, 3, F19–F22 CrossRef CAS.
Footnote |
| † Electronic supplementary information (ESI) available: General scheme of the used automated solving routine, examples for input and output files, implementation of the model in Mathematica, Mathematica script. See DOI: 10.1039/c9cp04986j |
| This journal is © the Owner Societies 2020 |

