 Open Access Article
Atomic arrangement in CuZr-based metallic glass composites under tensile deformation
Huali
Hao
a,
Wenzhao
Zhou
b,
Yang
Lu
 bc and
Denvid
Lau
 *ad
*ad
aDepartment of Architecture and Civil Engineering, City University of Hong Kong, Hong Kong, China
bNanomanufacturing Lab, Centre for Advanced Structural Materials, Shenzhen Research Institute of City University of Hong Kong, Shenzhen 518057, China
cDepartment of Mechanical Engineering, City University of Hong Kong, Hong Kong, China
dDepartment of Civil and Environmental Engineering, Massachusetts Institute of Technology, Cambridge, Massachusetts 02139, USA. E-mail: denvid@mit.edu
First published on 22nd November 2019
Abstract
Lacking macroscopic plasticity severely limits structure applications of bulk metallic glasses (BMGs). In general, particle-reinforced BMGs have an enhanced ductility but show reduced strength, whereas body-centered-cubic CuZr phase (B2 phase)-reinforced bulk MGs display improved ductility and strength. The underlying reason for the improvement in B2 phase-reinforced BMGs is still ambiguous. Herein, the atomic arrangement in Cu48Zr48Al4 BMGs with and without the B2 phase under tensile deformation is studied using molecular dynamics simulation. Different from pure MG where shear transformation zones (STZs) are activated along the same direction to form the domain shear band, STZs in the B2 phase-reinforced MG are activated along different directions disturbing the formation of a domain shear band. More plastic deformation and increased stress are allowed because of the phase transformations of B2 phases. The revealed deformation mechanism of B2 phase-reinforced MGs enables us to design heterogeneous structures with excellent strength and toughness.
Introduction
Metallic glasses (MGs) have attracted substantial attention and been considered potential candidates for applications in the fields of microelectromechanical systems, nanoelectromechanical systems, biomedical implants, precious microparts, surgical tools, and micromachines due to their high strength and hardness, large elastic strain, outstanding corrosion resistance, and good wear resistance.1–5 Although nanoscale MGs can have a high ductility, the deformation of bulk MGs is attributed to the localization of plastic strain to shear bands, causing bulk MGs to exhibit little extensibility under ambient tension where the ductility is less than 0.5%.6–8 Bulk MGs can fail catastrophically along a single domain shear band that evolves into a crack at vanishingly small tensile strain, limiting the reliability of MGs and their potential engineering applications.9–14In recent years, crystalline phases are in situ or ex situ induced to improve the tensile ductility of bulk MGs by inhibiting the rapid propagation of domain shear bands. For example, extrinsic crystalline phases such as TiC, TiB, WC, ZrC or ZrO2, dendrites (a tree-like crystalline structure) and crystalline phases that undergo the diffusionless phase transformation during plastic deformation can improve ductility to more than 5%.15–18 It has been reported that the improved ductility in the extrinsic phase and dendrite-reinforced MGs associates with work-softening, whereas a diffusionless phase transformation during plastic deformation can significantly enhance the ductility of MGs accompanied with obvious work-hardening.19–21 Up to now, the discovered parent phase with diffusionless transformation in the MG matrix is only the equiatomic CuZr intermetallic compound with a body-centered-cubic (bcc) structure (B2 phase).22,23 This new kind of an MG composite with improvements both in tensile ductility and strength provides a novel approach for designing practical MGs with excellent performance. However, the underlying reason for the enhancements in both the tensile ductility and strength in a crystalline phase with martensitic transformation-reinforced MGs is still ambiguous. A thorough understanding of the atomic arrangement in MGs with and without the B2 phase during tensile deformation enables us to figure out the underlying reason for the excellent performance of B2 phase-reinforced MGs.
It is noticeable that the plastic deformation of MGs and crystalline phases are dominant through different mechanisms. The plastic deformation of crystalline structures is normally accomplished through the motion and production of dislocations that are the result of the rupture of the atomic bonds along a line in the lattice.24–26 Moreover, the B2 phase is plastically deformed with a new monoclinic ZrCu phase (B19′ phase) formed by diffusionless transformation under the shear strain.27,28 In contrast to conventional crystalline materials deforming plastically through dislocation activity and phase transformation, plastic deformation of MGs occurs through the activation of the shear transformation zones (STZs).29–31 STZs experiencing the largest nonaffine strain are preferentially activated in the matrix involving weakly bonded atoms, and coalesce from tens of atoms to hundreds of atoms.32,33 The STZs behave as Eshelby inclusions where the matrix exhibits a quadrupolar deformation symmetry and the inclusions represent the size of STZs.34 STZs have the highest atomistic strains, whereas the matrix surrounding the STZs displays the lowest strain and relatively higher stresses.35 The percolation of STZs along a plane of maximum shear stress causes the formation of a domain shear band.36 The domain shear band has a highly localized plastic flow and propagates rapidly, resulting in the low tensile ductility of MGs.32 On one hand, compared to heterogeneous materials made up of nanocrystals,37 the interface that can significantly affect the crack propagation between adjacent phases also plays a significant role in the enhanced mechanics in crystalline phase-reinforced MGs. On the other hand, the orientation of adjacent crystals determines the crack propagation in heterogeneous materials made up of nanocrystals, whereas the structure of MGs near the interface significantly affects the crack propagation path in crystalline phase-reinforced MGs. This is because the structure of MGs is heterogeneous with different atom packing densities. The crack is prone to propagation in the region having a low packing density causing minimized energy dissipated. The coordination and interactions of different plastic behaviors in the B2 phase-reinforced MGs should be revealed in order to shed light on their deformation mechanism.
The objective of this study is to investigate the interactions between the crystalline and glassy structures in the B2 phase-reinforced Cu48Zr48Al4 MGs under tensile deformation. The underlying cause for the failure of this composite has been analyzed to determine a way to enhance both tensile strength and ductility. First, Cu48Zr48Al4 MGs with and without the B2 phase have been constructed, which suffer from uniaxial tensile deformation at a fixed strain of 10−2 ps−1 at 50 K. Subsequently, the atomistic local strain during the deformation of different modeled structures is characterized to determine whether the STZs activated in the amorphous matrix. The effect of the crystalline structure on the atomic rearrangement in the amorphous matrix is analyzed by comparing the atom displacement in two-modeled structures. Our study reveals the relationship between the structural evolution and mechanical response in the B2 phase-reinforced MGs under tensile deformation and figures out the underlying reason for the improvement of strength and ductility. Our revealed failure mechanism can provide an insight into the design and fabrication of new heterogeneous materials that have outstanding strength and ductility and can be practically applied.
Simulation methodology
Methods
The molecular simulations are performed using a large-scale atomic/molecular massively parallel simulator (LAMMPS).38 A developed embedded-atom method (EAM) potential for the Cu–Zr–Al ternary system based on the ab initio calculations has been successfully applied to predict the properties of configurations, such as the crystalline phase, liquids and metallic glasses (MGs), and the EAM-derived results are comparable with both ab initio and experimental data.39–41 The total energy of a solid in EAM is a unique function of electron density, where the total energy of a system is approximated as:39,42 | (1) |
 | (2) |
Physical and mechanical properties predicted by the EAM potential
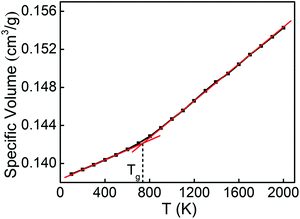
The physical and mechanical properties of Cu48Zr48Al4 MGs and the B2 phase are predicted by the EAM potential. Fig. 1 shows the temperature dependence of the specific volume for the Cu48Zr48Al4 MGs during the cooling process. The specific volume continuously changes with temperature, indicating the formation of a glassy structure for the Cu48Zr48Al4 liquid at a cooling rate of 0.01 K ps−1. The intersect of the extrapolations for the undercooled melt and the metallic glass lines denote the glass transition temperature (Tg) of Cu48Zr48Al4 of about 712 K, which is slightly higher than the experimental value of 688 K.50 The simulated Tg is reasonable in comparison with the experimental one considering the much higher cooling rate in the simulation than that in the experiment.51 The radial distribution function (RDF) analysis is among one of the most important methods to reveal the structural features of a system, particularly for liquids and amorphous structures.52Fig. 2 shows the total and partial RDF of the Cu48Zr48Al4 MG. After the simulated system is cooled down from the liquid state to the glassy state, the second peak of RDF for the Cu48Zr48Al4 MG is split into two peaks, as shown in Fig. 2a. The emergence of the subpeak on the second peak is generally a signal of the local ordering in the amorphous structure, implying the formation of a glassy state.53 Furthermore, the nearest neighbor distance (the first peak) of RDF for the Cu48Zr48Al4 MG is about 2.75. This has a good agreement with the value (2.71) of the structure factor for the Cu48Zr48Al4 MGs measured via X-ray diffraction.54 Here, the structure factor is sine Fourier transformed to obtain RDF.55 The atomistic radii of the Cu, Zr and Al atoms determined from the first peak positions of the Cu–Cu, Zr–Zr, and Al–Al curves are 2.55, 3.15, and 2.85, respectively, as shown in Fig. 2b. This is in good agreement with the experimental data, where the atomistic radii of the Cu, Zr and Al atoms are 2.56, 3.14 and 2.86, respectively, suggesting that the EAM potential is appropriate for expressing the real force filed in the Cu–Zr–Al system. The Young's modulus (E) of the B2 phase is also predicted by the MD simulation, which is about 85.4 GPa. The predicted E of the modeled materials is closer to that predicted in the experimental data, where the experimental E of the B2 phase is 82.0 GPa.56,57 The simulation result of E is higher than the experimental values. This is because the strain rate in the MD simulation is several orders of magnitude higher, making less contribution of thermal motions to the mechanical response of the material. In addition, the constructed model is free of structural defects and voids, which normally exist in the macroscopic samples. All these result in the overestimation of elastic moduli. The error between the simulation results and the experimental values is less than 5%. This indicates the reliability of the EAM potential to predict the mechanical properties of CuZr materials.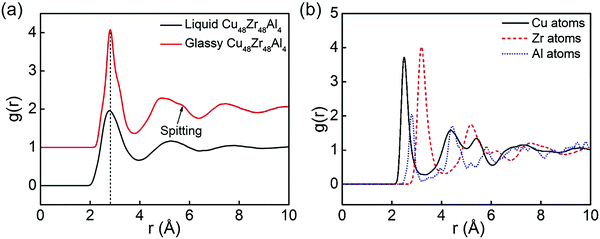 | ||
| Fig. 2 (a) Total pair distribution function for Cu48Zr48Al4 obtained by MD with EAM potential; (b) partial RDF of Cu48Zr48Al4 MG configuration predicted by MD with EAM potential. | ||
Results and discussion
Effect of temperature and strain rate on the tensile behavior of modeled MGs
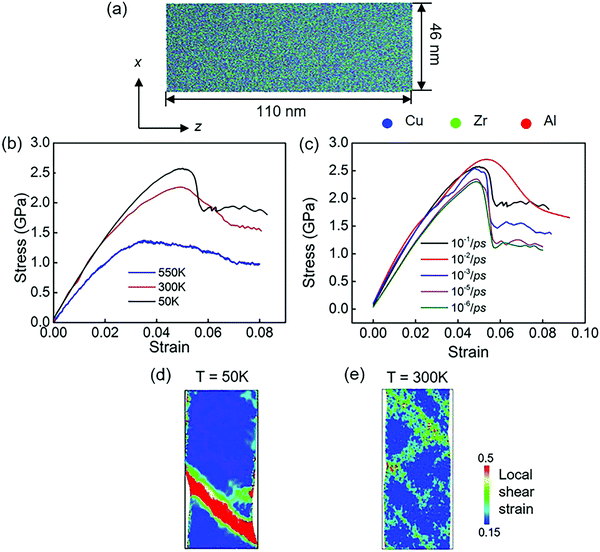
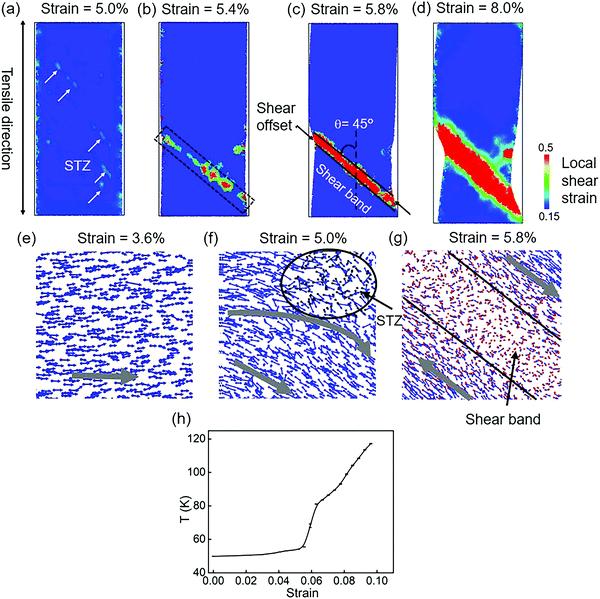
Fig. 3 shows the stress–strain curves of modeled Cu48Zr48Al4 MGs under the uniaxial tensile deformation of a fixed strain at different temperatures below the glass transition temperature. It is found that at a low temperature of 50 K, the modeled MG failed because of the inhomogeneous deformation where the strain is mainly limited in the domain shear band, whereas with an increase in temperature, the plastic deformation becomes homogeneous, as shown in Fig. 3b. This indicates that the failure mechanism depends on the temperature because the cooling rate to obtain the glassy structure in the MD simulation can be several orders of magnitude higher compared with that in the experiment. Such a fast cooling rate does not provide enough time for structure relaxation.14 The shorter time of diffusion in modeled MGs reduce the distance between two neighbor atoms in MGs constructed in the MD simulation at 300 K, which is smaller than that in MGs fabricated in the experiments at 300 K. The structure of modeled MG at 300 K is much unstable compared with the structure of MG fabricated in the experiment. In the MD simulation, it takes more than one month to obtain the glassy structure at the similar cooling rate to that of the experiment. We reduce the temperature to 50 K to give enough time for the structure relaxation. Moreover, the short-range-ordered structures of MG that have a detrimental effect on the mechanical properties at different temperatures are quantified. It is found that when the temperature is below the glass transition temperature, it has a negligible effect on the short-range-ordered structure of MGs. Therefore, the atomistic structure of the modeled MGs at 50 K is comparable with the structure of MGs obtained in the experiment at 300 K. Our simulation results for the stress–strain response also indicate that the modeled MG failed by inhomogeneous deformation at 50 K, which is consistent with the failure mode of MG fabricated in the experiment at 300 K. In simulation, when the temperature is increased to 300 K, the failure mode is changed with a homogeneous plastic deformation. Taking all these into consideration, the structural evolution of modeled MGs at 50 K gives an insight to understand the structural evolution of MG experimentally obtained at 300 K. Fig. 3c shows the stress–strain response of modeled Cu48Zr48Al4 MGs at 50 K under the uniaxial tensile deformation at different strain rates. The strain rate can also affect the failure mechanism of modeled Cu48Zr48Al4 MGs. A too high strain rate can promote the flow of atoms. When the strain rate is smaller than 10−2 ps−1, the stress is rapidly reduced related to the formation of shear bands. When the strain rate is larger than 10−2 ps−1, the stress is gradually reduced with a relatively homogeneous plastic deformation. Moreover, it is found that the stress–strain rate at 10−5 ps−1 is very close to that at 10−6 ps−1. This indicates that a reduced strain rate lower than 10−5 ps−1 does not have a significant effect on the stress–strain curve. The simulated results at 10−5 ps−1 can be identical to the experimental results. When the strain rate is increased to 10−2 ps−1, the strain rate affects the value of stress, but it has no effect on the critical strain when the stress is significantly changed. This means that the stress–strain curve at a strain rate of 10−2 ps−1 can also reflect the experimental results. Considering the computational cost, the strain rate of 10−2 ps−1 is a cutoff for the different deformation mechanisms of MGs. The selected strain rate of 10−2 ps−1 can ensure a similar deformation mechanism obtained from the experiments.In order to understand the atomic arrangement under tensile deformation and to reveal its failure mechanism, the local shear strain evolution of the Cu48Zr48Al4 MGs at 50 K under the fixed strain rate of 10−2 ps−1 is shown in Fig. 4. The isolated STZs are activated before the stress reduces, as shown in Fig. 4a. With the strain increased, the STZs with the density increased percolated along the plane with the maximum shear stress (Fig. 4b). A dominant shear band formed as a result of activation, percolation and annihilation of STZs (Fig. 4c). This shear band propagates rapidly along the direction of an angle of 45° with respect to the tensile axis causing the failure of MGs. With the strain increased to more than 6%, the size of the shear band and shear offset increased (Fig. 4d). After the domain shear band is formed, the upper and lower parts of the MG samples slip oppositely along the shear plane causing the shear offset to increase. The energy accumulation during shear sliding leads to an increase in the heat energy in the shear band.58 The increased heat energy can affect the critical shear stress required for the slip, causing the fluctuation of the stress during the shear sliding. The atom displacement at different deformation stages without considering the homogeneous deformation is also represented in order to explain how the STZs are activated and percolated. The atoms first move under shear stress. As the homogeneous displacement along the tensile direction is not considered, the motion of atoms is perpendicular to the tensile axis (Fig. 4e). The activated STZs significantly deflect the surrounding matrix motion making it to displace preferentially on the plane with the maximum shear stress (Fig. 4f). The motion of atoms in the STZs is random, whereas the atoms near the STZs have a vortex-like motion. A strong antisymmetric strain field can be generated near the STZs and the following STZs along the plane with maximum shear stress are activated when the local stress exceeds a threshold value. The increased STZs can significantly disturb the vortex-like motion of the surrounding matrix, resulting in the percolation and annihilation of individual STZs. Eventually, a domain shear band is formed, and the matrix near the domain shear band eventually displaces along the direction with maximum shear stress (Fig. 4g). Moreover, for the STZs with a minimum stress,59 the significant increase in both the density and size of STZs can cause a reduction in the stress response for Cu48Zr48Al4 MGs. The local temperature of the shear band region is quantified. It is found that when the domain shear band is formed, the local temperature of the shear band increased along with the increment in the overall strain (Fig. 4h). This is because, after the domain shear band is formed, the upper and lower parts of the MG samples slip oppositely along the shear plane causing the shear offset. The shear stress required to slide on the slip plane along the slip direction is constant; the stress almost remained constant during the slip. The energy accumulation during shear sliding leads to an increase in the temperature in shear bands. The increased temperature can affect the critical shear stress required for the slip causing fluctuation in the stress.
Stress response of Cu48Zr48Al4 MGs with embedded B2 phase
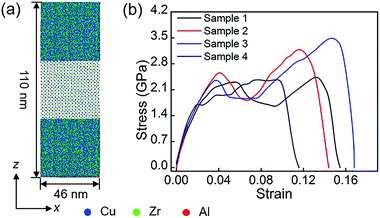
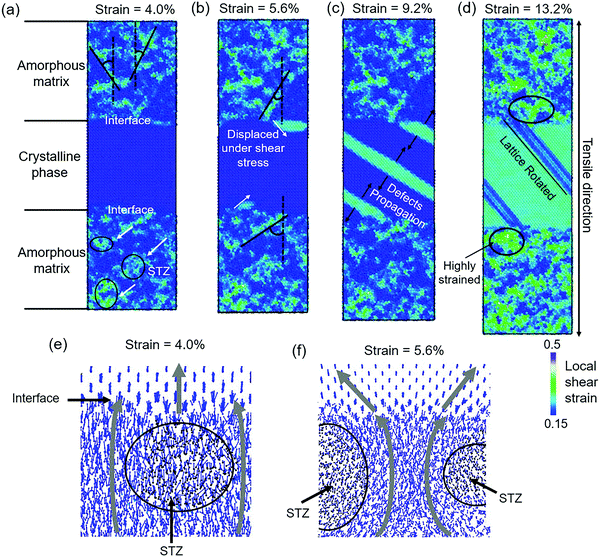
Fig. 5 shows the stress–strain response of MGs with embedded B phases at 50 K at a fixed strain rate of 10−2 ps−1. The [001] direction of the B2 phase is tilted to increase the angle between the tensile direction and the [001] direction of the B2 phase. In these 4 samples, the tensile direction is parallel to the [001], [112], and [111] directions of the B2 phase, respectively. Different from the tensile behavior of Cu48Zr48Al4 MG, where there is a nearly linear stress–strain relationship before the stress drops precipitously at a strain of about 5.0%, the stress of the modeled Cu48Zr48Al4 MG with the B2 phase is reduced after yielding followed by work-hardening before reaching the peak. The ductility is obviously increased compared with that of MGs. As the volume fraction of the crystalline phase was kept unchanged in different samples, the Young's modulus remained nearly constant. Table 1 shows the yield strength, the ultimate strength and elongation of different samples. The yield strength, ultimate strength and elongation are highly dependent on the orientation. As the amorphous matrix undergoes homogeneous deformation in MGs with the B2 phase, the yielding of MGs with the B2 phase is a result of the yielding of the B2 phase. The crystalline phase is plastically deformed by slipping on the plane with the highest atom packing density and along the direction with the highest atom packing density, because minimized stress is required for the motion of dislocations on such plane and along such directions. As the B2 phase has the body-centered-cubic structure, it can slip on the {110} and {112} planes along the 〈111〉 directions. The restored shear stress (τ) can be expressed as:60τ = σ![[thin space (1/6-em)]](https://www.rsc.org/images/entities/char_2009.gif) cos cos![[thin space (1/6-em)]](https://www.rsc.org/images/entities/char_2009.gif) λ λ![[thin space (1/6-em)]](https://www.rsc.org/images/entities/char_2009.gif) cos cos![[thin space (1/6-em)]](https://www.rsc.org/images/entities/char_2009.gif) φ φ | (3) |
![[thin space (1/6-em)]](https://www.rsc.org/images/entities/char_2009.gif) φ
φ![[thin space (1/6-em)]](https://www.rsc.org/images/entities/char_2009.gif) cos
cos![[thin space (1/6-em)]](https://www.rsc.org/images/entities/char_2009.gif) λ (named the Schmid factor). Table 2 shows a summary of the Schmid factor, slip systems and cos
λ (named the Schmid factor). Table 2 shows a summary of the Schmid factor, slip systems and cos![[thin space (1/6-em)]](https://www.rsc.org/images/entities/char_2009.gif) λ of the B2 phase in different samples. It is clear that larger the Schmid factor, lower is the value of applied stress σ required for the slip. This indicates that there is a lower yield strength in the samples, where the crystalline phase has a higher Schmid factor. When the Schmid factor is similar in samples, a high value of cos
λ of the B2 phase in different samples. It is clear that larger the Schmid factor, lower is the value of applied stress σ required for the slip. This indicates that there is a lower yield strength in the samples, where the crystalline phase has a higher Schmid factor. When the Schmid factor is similar in samples, a high value of cos![[thin space (1/6-em)]](https://www.rsc.org/images/entities/char_2009.gif) λ means a higher shear stress along the slip direction promoting the slip. Therefore, for samples with a similar Schmid factor, there is a lower yield strength in the samples with a larger value of cos
λ means a higher shear stress along the slip direction promoting the slip. Therefore, for samples with a similar Schmid factor, there is a lower yield strength in the samples with a larger value of cos![[thin space (1/6-em)]](https://www.rsc.org/images/entities/char_2009.gif) λ. This is the reason that there is a minimized yield strength in the sample where the tensile direction is parallel to the [111] direction of B2 phases, whereas there is a maximum yield strength in the sample, where the tensile direction is parallel to the [112] direction of the B2 phases.
λ. This is the reason that there is a minimized yield strength in the sample where the tensile direction is parallel to the [111] direction of B2 phases, whereas there is a maximum yield strength in the sample, where the tensile direction is parallel to the [112] direction of the B2 phases.
| Sample | 1 | 35° | 45° | 55° | Average |
|---|---|---|---|---|---|
| 2 | 3 | 4 | |||
| Yield strength (GPa) | 2.20 | 2.34 | 2.24 | 1.42 | 2.05 ± 0.4 |
| Ultimate strength (GPa) | 2.48 | 3.17 | 3.30 | 2.41 | 2.84 ± 0.37 |
| Elongation (%) | 13.2 | 12.7 | 13.7 | 10.6 | 12.8 ± 1.18 |
![[thin space (1/6-em)]](https://www.rsc.org/images/entities/char_2009.gif) λ of the B2 phase in different samples
λ of the B2 phase in different samples
| Tensile direction | cos![[thin space (1/6-em)]](https://www.rsc.org/images/entities/char_2009.gif) λ λ |
Schmid factor for slip | Slip systems | cos![[thin space (1/6-em)]](https://www.rsc.org/images/entities/char_2009.gif) φ on (101) plane φ on (101) plane |
|
|---|---|---|---|---|---|
| Slip directions | Slip plane | ||||
| z [001] | 0.33 | 0.47 | 〈111〉 | {112} | 0.71 |
| z [112] | 0.47 | 0.41 | [1![[1 with combining macron]](https://www.rsc.org/images/entities/char_0031_0304.gif) 1], [ 1], [![[1 with combining macron]](https://www.rsc.org/images/entities/char_0031_0304.gif) 11] 11] |
(101), (011) | 0.87 |
z [10![[1 with combining macron]](https://www.rsc.org/images/entities/char_0031_0304.gif) ] ] |
0.82 | 0.41 | [11![[1 with combining macron]](https://www.rsc.org/images/entities/char_0031_0304.gif) ], [1 ], [1![[1 with combining macron]](https://www.rsc.org/images/entities/char_0031_0304.gif) ![[1 with combining macron]](https://www.rsc.org/images/entities/char_0031_0304.gif) ], [ ], [![[1 with combining macron]](https://www.rsc.org/images/entities/char_0031_0304.gif) ![[1 with combining macron]](https://www.rsc.org/images/entities/char_0031_0304.gif) 1], [1 1], [1![[1 with combining macron]](https://www.rsc.org/images/entities/char_0031_0304.gif) ![[1 with combining macron]](https://www.rsc.org/images/entities/char_0031_0304.gif) ] ] |
(01![[1 with combining macron]](https://www.rsc.org/images/entities/char_0031_0304.gif) ), (110), (1 ), (110), (1![[1 with combining macron]](https://www.rsc.org/images/entities/char_0031_0304.gif) 0), (011) 0), (011) |
0 |
| z [111] | 1 | 0.47 | [111] | (![[1 with combining macron]](https://www.rsc.org/images/entities/char_0031_0304.gif) 12), (1 12), (1![[1 with combining macron]](https://www.rsc.org/images/entities/char_0031_0304.gif) 2) 2) |
0.82 |
The phase transformation of the B2 phase occurs in the (101) plane direction. The stress on the (101) plane is determined by cos![[thin space (1/6-em)]](https://www.rsc.org/images/entities/char_2009.gif) φ. A large cos
φ. A large cos![[thin space (1/6-em)]](https://www.rsc.org/images/entities/char_2009.gif) φ indicates a large stress on the (101) plane. The failure of the sample is due to the high stress concentration near the interface contributing to the formation of pores. The large stress in the (101) plane promotes the phase transformation of the B2 phase and the formation of pores resulting in a low elongation. Therefore, there is a low elongation in samples where the tensile direction is parallel to the [112] and [111] directions. The slip systems can interfere with each other causing a difficulty in the slip movement. These interactions among slip systems contribute to the improvement in the ultimate strength. A higher ultimate strength can be found in samples with a larger number of initial slip systems. The ultimate strength is relatively high in samples where the tensile direction is parallel to [112] and [10
φ indicates a large stress on the (101) plane. The failure of the sample is due to the high stress concentration near the interface contributing to the formation of pores. The large stress in the (101) plane promotes the phase transformation of the B2 phase and the formation of pores resulting in a low elongation. Therefore, there is a low elongation in samples where the tensile direction is parallel to the [112] and [111] directions. The slip systems can interfere with each other causing a difficulty in the slip movement. These interactions among slip systems contribute to the improvement in the ultimate strength. A higher ultimate strength can be found in samples with a larger number of initial slip systems. The ultimate strength is relatively high in samples where the tensile direction is parallel to [112] and [10![[1 with combining macron]](https://www.rsc.org/images/entities/char_0031_0304.gif) ].
].
To understand the structural evolution of modeled Cu48Zr48Al4 MGs with the B2 phase during tensile deformation, the sample where the z direction is parallel to the [001] direction of the B2 phase is selected as an example. The local shear strain and atom displacement of the modeled Cu48Zr48Al4 MG with the B2 phase under the tensile deformation are shown in Fig. 6. The STZs are activated in the amorphous matrix similar to that in Cu48Zr48Al4 MGs and the crystalline structure is non-deformed (Fig. 6a), causing a linear stress–strain response. With the strain increased, the neighboring STZs are activated along different planes (Fig. 6b). The crystalline structure is inhomogeneously deformed with a strain relaxation in the amorphous matrix (Fig. 6c). The highly strained crystalline structure is rotated with an increment of the strain (Fig. 6d). Fig. 6e shows the effect of the crystalline structure on the atom motion. The vortex-like motion of the matrix surrounding the STZs is deflected by the interface, resulting in the crystalline structure being displaced nearly along the direction parallel to the tensile axis. A high local strain at the interface promotes the activation of the STZs along the direction parallel to the interface instead of the direction of 45° with respect to the tensile axis (Fig. 6f). The different activation plane of STZs destructs the vortex-like motion in the amorphous matrix preventing the formation of the domain shear band. The highly strained interface is then relaxed by the deformation of the crystalline structure, causing a reduction in the stress response. With the deformation continuing, the stress–strain response is dominant due to the crystalline structure deformation. When the whole crystalline structure has a higher strain than the surrounding amorphous matrix, more STZs are activated and percolated. In turn, the highly strained amorphous matrix can promote the deformation of the crystalline structure. This interaction between the amorphous matrix and crystalline structure results in an improvement of stress with the strain increased.
Interactions between the crystalline phase and the amorphous matrix
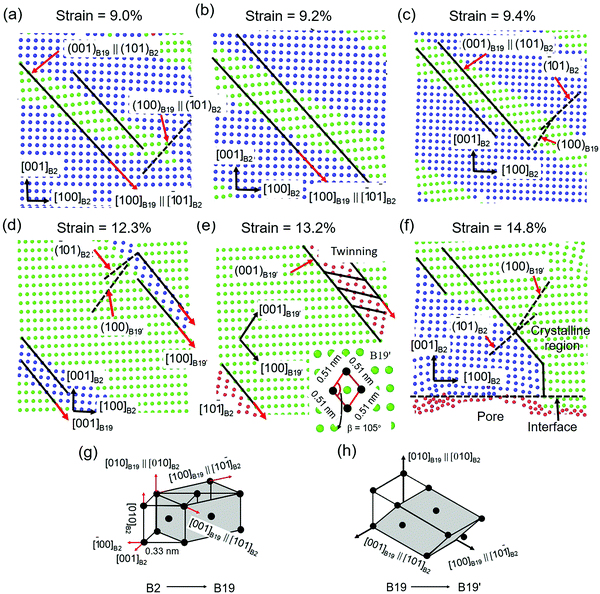
Fig. 7 shows the details of the crystalline phase deformation at different strains. Before the stress reduces, the crystalline structure is non-deformed. The large displacement of the crystalline atoms near the interface causes a diffusionless phase transformation from the B2 phase to the orthonormal ZrCu phase (B19 phase). The B19 phase is formed because of the displacement of the B2 phase on the plane (101)B2 along the [101]B2 direction and the (100)B19 plane is parallel to the (10![[1 with combining macron]](https://www.rsc.org/images/entities/char_0031_0304.gif) )B2 plane, as shown in Fig. 7a. The B19 phase is grown along the [10
)B2 plane, as shown in Fig. 7a. The B19 phase is grown along the [10![[1 with combining macron]](https://www.rsc.org/images/entities/char_0031_0304.gif) ]B2 direction, resulting in the rotation of the B2 phase, and the (100)B19 plane is not parallel to the (10
]B2 direction, resulting in the rotation of the B2 phase, and the (100)B19 plane is not parallel to the (10![[1 with combining macron]](https://www.rsc.org/images/entities/char_0031_0304.gif) )B2 plane, shown as dotted lines in Fig. 7b. This diffusionless phase transformation releases the stress stored in the crystalline structure, causing a decreased stress response. The newly formed B19 phase is deformed because of the shear on the (010)B2 plane along the [10
)B2 plane, shown as dotted lines in Fig. 7b. This diffusionless phase transformation releases the stress stored in the crystalline structure, causing a decreased stress response. The newly formed B19 phase is deformed because of the shear on the (010)B2 plane along the [10![[1 with combining macron]](https://www.rsc.org/images/entities/char_0031_0304.gif) ]B2 direction, as shown in Fig. 7c. The shear deformation of the B19 phase leads to the formation of the B19′ phase, allowing more plastic deformation and work-hardening. As shown in Fig. 7d, with the increase in strain, more of the B2 phase is transformed to the B19 and B19′ phases. The angle between the (10
]B2 direction, as shown in Fig. 7c. The shear deformation of the B19 phase leads to the formation of the B19′ phase, allowing more plastic deformation and work-hardening. As shown in Fig. 7d, with the increase in strain, more of the B2 phase is transformed to the B19 and B19′ phases. The angle between the (10![[1 with combining macron]](https://www.rsc.org/images/entities/char_0031_0304.gif) )B2 plane and (100)B19 plane increased due to the rotation of the crystalline structure. When the B2 is totally transformed to the B19′ phase, twins are formed to coordinate the neighboring B19′ phases, as shown in Fig. 7e. The twinning is prevented at the interface, resulting in stress concentration. The interfacial stress concentration facilities the percolation of the STZs. A pore is nucleated at the interface when the free volume of STZs near the interface is over a threshold, as shown in Fig. 7f. The nucleation of the pore leads to strain relaxation, causing the formed B19′ phase to transform reversibly into the B2 phase. Fig. 7g shows the details of the phase transformation from the B2 phase to the B19 phase. It is clear that [100]B19 is parallel to [10
)B2 plane and (100)B19 plane increased due to the rotation of the crystalline structure. When the B2 is totally transformed to the B19′ phase, twins are formed to coordinate the neighboring B19′ phases, as shown in Fig. 7e. The twinning is prevented at the interface, resulting in stress concentration. The interfacial stress concentration facilities the percolation of the STZs. A pore is nucleated at the interface when the free volume of STZs near the interface is over a threshold, as shown in Fig. 7f. The nucleation of the pore leads to strain relaxation, causing the formed B19′ phase to transform reversibly into the B2 phase. Fig. 7g shows the details of the phase transformation from the B2 phase to the B19 phase. It is clear that [100]B19 is parallel to [10![[1 with combining macron]](https://www.rsc.org/images/entities/char_0031_0304.gif) ]B2, [010]B19 is parallel to [010]B2, and [001]B19 is parallel to [101]B2. The phase transformation from the B19 phase to the B19′ phase is shown in Fig. 7h, which is the result of shear on the (010)B2 plane along the [10
]B2, [010]B19 is parallel to [010]B2, and [001]B19 is parallel to [101]B2. The phase transformation from the B19 phase to the B19′ phase is shown in Fig. 7h, which is the result of shear on the (010)B2 plane along the [10![[1 with combining macron]](https://www.rsc.org/images/entities/char_0031_0304.gif) ]B2 direction, [001]B19′ is parallel to [101]B2.
]B2 direction, [001]B19′ is parallel to [101]B2.
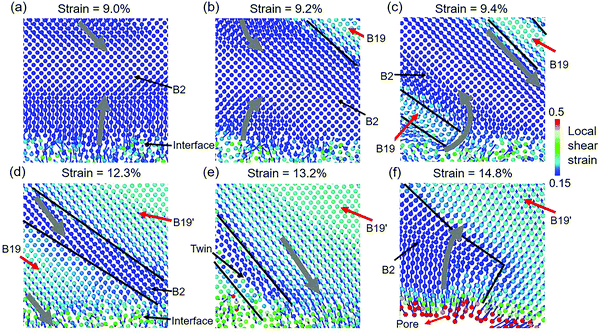
The details of interactions between the crystalline structure and the amorphous matrix in Cu48Zr48Al4 MGs with the B2 phase are shown in Fig. 8. Before the deformation of the crystalline structure, the atoms at the interface move parallel to the tensile direction, as shown in Fig. 8a. As the new phase is formed by shear of the basal plane (101)B2 along the [10![[1 with combining macron]](https://www.rsc.org/images/entities/char_0031_0304.gif) ]B2 direction, the motion of atoms surrounding the new phase is obviously rotated toward the direction with the maximum shear stress, as shown in Fig. 8b. As a result of the lattice-invariant shear, there is no displacement for atoms in the newly formed B19 phase, as shown in Fig. 8c. The B2 phase, confined among the newly formed B19 phase, is deformed under shear stress, contributing to the transformation of the B2 phase. With the decrease in volume of the B2 phase, the newly formed B19 phase surrounding the B2 phase suffers from the shear deformation to transform to the B19′ phase, as shown in Fig. 8d. The displacement of atoms in the B19′ phase and near the interface significantly is increased under the shear, as shown in Fig. 8e. The large displacement of atoms in STZs near the interface promotes the STZs to evolve into a pore. The high strain and stress stored in the crystalline phase are greatly relaxed because of the generation of pores, leading to the stress filed in the crystalline phase significantly reversed, as shown in Fig. 8f. Under the reversed shear stress, the B19′ phase transforms back to the B2 phase. After the failure of the modeled structure, all of the B19′ phase transferred to the B2 phase.
]B2 direction, the motion of atoms surrounding the new phase is obviously rotated toward the direction with the maximum shear stress, as shown in Fig. 8b. As a result of the lattice-invariant shear, there is no displacement for atoms in the newly formed B19 phase, as shown in Fig. 8c. The B2 phase, confined among the newly formed B19 phase, is deformed under shear stress, contributing to the transformation of the B2 phase. With the decrease in volume of the B2 phase, the newly formed B19 phase surrounding the B2 phase suffers from the shear deformation to transform to the B19′ phase, as shown in Fig. 8d. The displacement of atoms in the B19′ phase and near the interface significantly is increased under the shear, as shown in Fig. 8e. The large displacement of atoms in STZs near the interface promotes the STZs to evolve into a pore. The high strain and stress stored in the crystalline phase are greatly relaxed because of the generation of pores, leading to the stress filed in the crystalline phase significantly reversed, as shown in Fig. 8f. Under the reversed shear stress, the B19′ phase transforms back to the B2 phase. After the failure of the modeled structure, all of the B19′ phase transferred to the B2 phase.
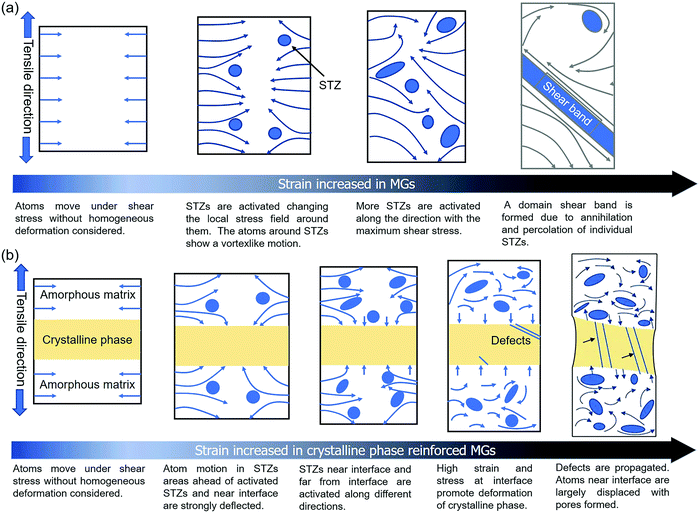
According to the previous statement, we can draw a conclusion that the different stress–strain responses in the modeled MGs without and with the crystalline phase are mainly related to atom displacement. Fig. 9 shows a schematic of atom displacement under tensile deformation, explaining the failure mechanism of MG composites. STZs are activated along the maximum shear stress plane in the MGs, and the atoms around the STZs display a vortex-like motion, as shown in Fig. 9a. The vortex-like motion of the matrix can cause the annihilation of smaller STZs. The percolation of STZs along the plane with the maximum shear stress evolves into a domain shear band, which is the underlying reason for the low tensile ductility of MGs. With the existence of the crystalline phase, the amorphous matrix is deformed first where the vortex-like motion of the atoms in the amorphous matrix near the interface is disturbed, as shown in Fig. 9b. The STZs near and far from the interface are percolated along different planes, avoiding the formation of a domain shear band. The crystalline phase is deformed to relax the high stress stored at the interface, leading to a reduction in the stress response. The propagation of the crystallographic defects can result in the failure of the crystalline phase. As a result, there is a reduction in the stress response and a limited ductility improvement. The increase in stress followed by a decrease with the increase of strain has been observed in the particles (such as TiC and TiB) and the dendrite-reinforced MG matrix. The B2 phase can undergo diffusionless phase transformation under the tensile deformation. This diffusionless phase transformation causes the rotation of the crystalline structure. In contrast to other particle-reinforced MGs where the crystallographic defects are propagated after formation, the B2 phase undergoes phase transformation under shearing, leading to an increment in the deformation ability. Improvements in both the tensile ductility and strength can be obtained. The STZs near the interface suffer from shearing, resulting in an increment in the free volume of STZs. The increased free volume of STZs near the interface provides the sites to nucleate the pores. Our results reveal the underlying reason for the improvement in both the strength and ductility under the tensile deformation of the B2 phase-reinforced MGs by tracing the atom displacement. The growth of the B19 phase under shearing results in stress reduction with a limited increment in the ductility. The B19 phase is transformed to the B19′ phase under shearing, leading to an increment in the stress. The revealed deformation mechanism in this study can motivate us to design and fabricate a practical MG composite with higher tensile ductility and strength. For example, reinforcements with different crystalline structures and strengths can be added into the MG matrix. In addition, our study provides an insight for figuring out the interactions between the crystalline structure and glassy structure, inspiring us to design heterogeneous materials with a good combination of strength and toughness.
Conclusions
In summary, B2 phase-reinforced MGs can overcome the low tensile ductility of MGs without sacrificing the strength to solve the brittleness of bulk MGs without reducing their competition edge. This work has studied the atomic arrangement under the tensile deformation, figuring out the deformation mechanism of the Cu48Zr48Al4 MG without and with the B2 phase using the molecular dynamics simulation. The interactions between the crystalline structure and the amorphous matrix are characterized. The deformation of the amorphous matrix dominates the linear stress–strain response, and the crystalline phase evolution is responsible for the nonlinear stress–strain response of B2 phase-reinforced Cu48Zr48Al4 MGs. When the embedded crystalline phase is tilted, the variation of mechanical properties in MGs with the B2 phase is due to the shear stress required for the slip of the B2 phase change. The revealed deformed mechanism of MGs with and without a crystalline phase enables us to improve the tensile ductility of MGs with work-hardening. Moreover, our findings provide an insight for designing and fabricating MGs with both improved strength and toughness for industrial availability.Conflicts of interest
There are no conflicts to declare.Acknowledgements
The authors are grateful to the support from the Research Grants Council (RGC) in Hong Kong through the General Research Fund (GRF) with the Grant No. 11255616, and the funding supporting from Shenzhen Science and Technology Innovation Committee under the grants JCYJ20170413141157573 and JCYJ20170818103206501.References
- G. Kumar, P. Neibecker, Y. H. Liu and J. Schroers, Nat. Commun., 2013, 41536 Search PubMed.
- H. Kou, J. Lu and Y. Li, Adv. Mater., 2014, 26(31), 5518 CrossRef CAS PubMed.
- Q. Wang, Y. Yang, H. Jiang, C. T. Liu, H. H. Ruan and J. Lu, Sci. Rep., 2014, 4, 4757 CrossRef CAS PubMed.
- E. Ma and J. Ding, Mater. Today, 2016, 19(10), 568–579 CrossRef CAS.
- Q. Wang, J. J. Liu, Y. F. Ye, T. T. Liu, S. Wang, C. T. Liu, J. Lu and Y. Yang, Mater. Today, 2017, 20(6), 293–300 CrossRef CAS.
- R. Liontas, M. Jafary-Zadeh, Q. Zeng, Y.-W. Zhang, W. L. Mao and J. R. Greer, Acta Mater., 2016, 118, 270–285 CrossRef CAS.
- Y. Zou, P. Kuczera, A. Sologubenko, T. Sumigawa, T. Kitamura, W. Steurer and R. Spolenak, Nat. Commun., 2016, 712261 Search PubMed.
- L. Liu, M. Hasan and G. Kumar, Nanoscale, 2014, 6(4), 2027–2036 RSC.
- M. Wakeda, Y. Shibutani, S. Ogata and J. Park, Appl. Phys. A: Mater. Sci. Process., 2008, 91(2), 281–285 CrossRef CAS.
- Y. Yang, J. C. Ye, J. Lu, P. K. Liaw and C. T. Liu, Appl. Phys. Lett., 2010, 96(1), 011905 CrossRef.
- L. Wang, H. Bei, Y. F. Gao, Z. P. Lu and T. G. Nieh, Acta Mater., 2011, 59(7), 2858–2864 CrossRef CAS.
- B. Gludovatz, M. D. Demetriou, M. Floyd, A. Hohenwarter, W. L. Johnson and R. O. Ritchie, Proc. Natl. Acad. Sci. U. S. A., 2013, 110(46), 18419–18424 CrossRef CAS PubMed.
- B. Sarac and J. Schroers, Nat. Commun., 2013, 42158 Search PubMed.
- L. Wang, L. Wang, Z. Nie, Y. Ren, Y. Xue, R. Zhu and H. Fu, Mater. Des., 2016, 111473–111481 Search PubMed.
- J. Eckert, J. Das, S. Pauly and C. Duhamel, J. Mater. Res., 2011, 22(2), 285–301 CrossRef.
- C. Suryanarayana and N. Al-Aqeeli, Prog. Mater. Sci., 2013, 58(4), 383–502 CrossRef CAS.
- J. Qiao, J. Mater. Sci. Technol., 2013, 29(8), 685–701 CrossRef CAS.
- X. Su, H. Hu and X. Kong, ICMSE, 2017, 275, 012002 Search PubMed.
- K. K. Song, S. Pauly, Y. Zhang, P. Gargarella, R. Li, N. S. Barekar, U. Kühn, M. Stoica and J. Eckert, Acta Mater., 2011, 59(17), 6620–6630 CrossRef CAS.
- Z. Y. Zhang, Y. Wu, J. Zhou, H. Wang, X. J. Liu and Z. P. Lu, Scr. Mater., 2013, 69(1), 73–76 CrossRef CAS.
- S. H. Hong, J. T. Kim, H. J. Park, Y. S. Kim, J. M. Park, J. Y. Suh, Y. S. Na, K. R. Lim and K. B. Kim, Appl. Microsc., 2015, 45(2), 37–43 CrossRef.
- H. C. Sun, Z. L. Ning, G. Wang, W. Z. Liang, S. Pauly, Y. J. Huang, S. Guo, X. Xue and J. F. Sun, Sci. Rep., 2018, 8(1), 4651 CrossRef CAS PubMed.
- Y. Feng, W. B. Liao, J. Zheng, L. W. Wang, Y. Zhang, J. Sun and F. Pan, Nanoscale, 2017, 9(40), 15542–15549 RSC.
- J. W. Christian and D. E. Laughlin, Acta Metall., 1988, 36, 1617–1642 CrossRef.
- C. G. Andres, F. G. Caballero, C. Capdevila and L. F. Alvarez, Mater. Charac., 2002, 48, 101–111 CrossRef.
- M. J. Buehler and T. Ackbarow, Mater. Today, 2007, 10, 46–58 CrossRef CAS.
- X. Ren and O. Kazuhiro, Scr. Mater., 1998, 38(11), 1669–1675 CrossRef CAS.
- K. G. Vishnu and A. Strachan, Acta Mater., 2010, 58(3), 745–752 CrossRef.
- J. Langer, Scr. Mater., 2006, 54(3), 375–379 CrossRef CAS.
- Y. Q. Cheng, E. Ma and H. W. Sheng, Phys. Rev. Lett., 2009, 102(24), 245501 CrossRef CAS.
- Y. C. Hu, P. F. Guan, M. Z. Li, C. T. Liu, Y. Yang, H. Y. Bai and W. H. Wang, Phys. Rev. B: Condens. Matter Mater. Phys., 2016, 93(21), 214202 CrossRef.
- J. H. Perepezko, S. D. Imhoff, M. W. Chen, J. Q. Wang and S. Gonzalez, Proc. Natl. Acad. Sci. U. S. A., 2014, 111(11), 3938–3942 CrossRef CAS.
- C. Zhong, H. Zhang, Q. P. Cao, X. D. Wang, D. X. Zhang, U. Ramamurty and J. Z. Jiang, J. Non-Cryst. Solids, 2016, 445–446, 61–68 CrossRef CAS.
- P. h. Cao, H. S. Park and X. Lin, Phys. Rev. E: Stat., Nonlinear, Soft Matter Phys., 2013, 88, 042402 CrossRef PubMed.
- E. R. Homer and C. A. Schuh, Acta Mater., 2009, 57(9), 2823–2833 CrossRef CAS.
- R. Maaß, D. Klaumünzer, G. Villard, P. M. Derlet and J. F. Löffler, Appl. Phys. Lett., 2012, 100(7), 071904 CrossRef.
- E. Beniash, C. A. Stifler, C. Y. Sun, G. S. Jung, Z. Qin., M. J. Buehler and P. U. P. A. Gilbert, Nat. Commun., 2019, 10, 4383 CrossRef.
- S. Plimpton, J. Comput. Phys., 1995, 117, 1–19 CrossRef CAS.
- Y. Q. Cheng, E. Ma and H. W. Sheng, Phys. Rev. Lett., 2009, 102, 245501 CrossRef CAS PubMed.
- J. G. Wang, Y. C. Hu, P. F. Guan, K. K. Song, L. Wang, G. Wang, Y. Pan, B. Sarac and J. Eckert, Sci. Rep., 2017, 7, 7076 CrossRef CAS PubMed.
- X. F. Zhang, S. P. Pan, J. W. Qiao and A. D. Lan, Comput. Mater. Sci., 2017, 128, 343–347 CrossRef CAS.
- M. Imran, F. Hussain, M. Rashid, Y. Cai and S. A. Ahmad, Chin. Phys. B, 2013, 22, 096101 CrossRef.
- Y. Q. Cheng and E. Ma, Prog. Mater. Sci., 2011, 56, 379–473 CrossRef CAS.
- P. Xue, Y. J. Huang, S. Pauly, S. S. Jiang, S. Guo, H. B. Fan, Z. L. Ning, F. Y. Cao and J. F. Sun, J. Alloys Compd., 2019, 782, 961–966 CrossRef CAS.
- M. Jafary-Zadeh, R. Tavakoli, D. J. Srolovitz and Y.-W. Zhang, Extreme Mech. Lett., 2016, 9, 215–225 CrossRef.
- S. Kim and S. Ryu, Sci. Rep., 2017, 7(1), 13472 CrossRef PubMed.
- Z. D. Sha, S. X. Qu, Z. S. Liu, T. J. Wang and H. Gao, Nano Lett., 2015, 15(10), 7010–7015 CrossRef CAS PubMed.
- M. L. Manning, J. S. Langer and J. M. Carlson, Phys. Rev. E: Stat., Nonlinear, Soft Matter Phys., 2007, 76056106 Search PubMed.
- A. Stukowski, Modell. Simul. Mater. Sci. Eng., 2010, 18, 015012 CrossRef.
- Q. Zhang, W. Zhang, G. Xie and A. Inoue, Mater. Trans., 2007, 48(7), 1626–1630 CrossRef CAS.
- Y. L. Sun and J. Shen, J. Non-Cryst. Solids, 2009, 355(31-33), 1557–1560 CrossRef CAS.
- G. Duan, D. Xu, Q. Zhang, G. Zhang, T. Cagin, W. L. Johnson and W. A. Goddard, Phys. Rev. B: Condens. Matter Mater. Phys., 2005, 71(22), 224208 CrossRef.
- F. Li, X. J. Liu and Z. P. Lu, Comput. Mater. Sci., 2014, 85, 147–153 CrossRef CAS.
- Q. Wang, Y. Yang, H. Jiang, C. T. Liu, H. H. Ruan and J. Lu, Sci. Rep., 2014, 4, 4757 CrossRef CAS PubMed.
- B. Sarac, A. Bernasconi, J. Wright, M. Stoica, F. Spieckermann, M. Mühlbacher, J. Keckes, X. Bian, G. Wang and J. Eckert, Mater. Sci. Eng., A, 2017, 707, 245–252 CrossRef CAS.
- Y. Wu, H. Wang, Y. Cheng, X. Liu, X. Hui, T. Nieh, Y. Wang and Z. Lu, Sci. Rep., 2015, 5, 12137 CrossRef CAS.
- S. Pauly, G. Liu, G. Wang, U. Kühn, N. Mattern and J. Eckert, Acta Mater., 2009, 57(18), 5445–5453 CrossRef CAS.
- Z. Y. Liu, Y. Yang and C. T. Liu, J. Iron Steel Res. Int., 2016, 23(1), 53–56 CrossRef.
- D. Sopu, A. Stukowski, M. Stoica and S. Scudino, Phys. Rev. Lett., 2017, 119(19), 195503 CrossRef CAS PubMed.
- H. C. Sun, Z. L. Ning, G. Wang, W. Z. Liang, S. Pauly, Y. J. Huang, S. Guo, X. Xue and J. F. Sun, Sci. Rep., 2018, 8(1), 4651 CrossRef CAS PubMed.
| This journal is © the Owner Societies 2020 |

