 Open Access Article
Creative Commons Attribution 3.0 Unported Licence
Phase diagrams and dynamical evolution of the triple-pathway electro-oxidation of formic acid on platinum
Joana G.
Freire
 a,
Alfredo
Calderón-Cárdenas
 bc,
Hamilton
Varela
 *bde and
Jason A. C.
Gallas
 def
def
aInstituto Dom Luiz (IDL), Faculdade de Ciências, Universidade de Lisboa, 1749-016 Lisboa, Portugal
bInstituto de Química de São Carlos, Universidade de São Paulo, 13560-970 São Carlos, SP, Brazil. E-mail: hamiltonvarela@usp.br
cGIFBA, Universidad de Nariño, A.A.1175, San Juan de Pasto, Nariño, Colombia
dMax-Planck Institute for the Physics of Complex Systems, Nöthnitzer Str. 38, 01187 Dresden, Germany
eInstituto de Altos Estudos da Paraíba, Rua Silvino Lopes 419-2502, 58039-190 João Pessoa, Brazil
fComplexity Sciences Center, 9225 Collins Avenue Suite 1208, Surfside, FL 33154-3001, USA
First published on 6th December 2019
Abstract
Recently, an electro-kinetic model based on a specified reaction scheme for the electro-oxidation of formic acid on platinum was reported. The model evaluated three reaction pathways towards the production of CO2: the dehydrogenation and the dehydration of formic acid, and the third and most active pathway includes fast oxidation of the formate ion. Numerical integrations showed that the model is well-suited to describe the experimental results in voltammetric and oscillatory regimes. In the present paper, we provide detailed stability phase diagrams characterizing the dynamical evolution of this system under galvanostatic and potentiostatic regimes. We find the triple-pathway electro-oxidation of formic acid on platinum to have rather intertwined stability phases and, surprisingly, a total absence of chaotic oscillations. To the best of our knowledge, this is the first study in this direction using a realistic electrochemical model.
1 Introduction
The electro-oxidation of organic compounds on catalytic surfaces has great interest from fundamental and applied perspectives.1,2 The formic acid electro-oxidation reaction (FAEOR) on platinum has been studied several decades ago,3,4 but the reaction mechanism is not yet completely clear.5 Recently, a plausible proposal was presented6 for this electrochemical process, based on different experimental and theoretical observations reported in the literature.5,7–14 The reaction scheme proposed for the FAEOR is illustrated schematically in Fig. 1, and considers three reaction pathways towards the CO2 production.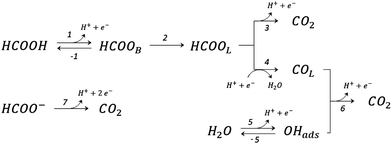 | ||
| Fig. 1 The recently proposed6 reaction scheme for triple-pathway electro-oxidation of formic acid on platinum. | ||
Each of the reaction steps in Fig. 1 are explicitly described by the following chemical equations:
 | (r1) |
 | (r2) |
 | (r3) |
 | (r4) |
 | (r5) |
 | (r6) |
 | (r7) |
In these equations, asterisks represent a free surface reaction site, the ‘B’ and ‘L’ subindices indicate that the chemical species are adsorbed on the electrode surface in a bridge-bonded or linear-bonded configuration, respectively.
The first pathway, the so-called formate pathway, is represented by three chemical eqn (r1)–(r3) for dehydrogenation of formic acid.10–12,14–22 The indirect pathway (r4)–(r6) is the COad and OHad formation and the further reaction via Langmuir–Hinshelwood mechanism.11,12,19,23–31 In this way, we considered a very important aspect in contrast with previous models.14,21,25,32,33 Our proposal considers that the formation of COL in platinum can also proceed from a monodentate adsorbed formate, that is, after the reaction steps indicated in eqn (r1) and (r2). This idea was initially suggested for the solid–gas interface27 and supported by experiments in which a kinetic isotopic effect was attributed to the faster decomposition of HCOOad than DCOOad.7 Recent experiments and calculations using density functional theory also support this idea.11,12,19,28 In turn, this proposal allows us to consider that the (r4) dehydration process is initiated by an electroreduction process. This can also successfully explain the dependence on the potential of COL formation. The third pathway, (r7), is the direct one. Unlike a previous model,14 we consider that the active species in this third way is the anion formate which is quickly oxidized to CO2 by a dehydrogenation process.34,35 Some experimental observations corroborate the involvement of the solution formate in the oxidation process.11,36
The electro-oxidation of organic compounds can be performed under conditions in which unusual and very interesting behaviors are observed. For example, behaviors in which electrochemical variables oscillate in time are rather common, and periodic, mixed mode and chaotic oscillations have been reported. Based on the proposed reaction scheme, we presented a renewed electrochemical model for FAEOR and compared the numerical results with experimental data.6 The model consists of 4 + 1 differential equations, which will be presented in the next Section, corresponding to the mass balance of the concentration of the reactants on the electrode surface and the charge balance at the electrochemical surface.
The results of the numerical integration showed that the model is well suited to describe the experimental results under voltammetric and oscillatory regimes. Phase diagrams can provide a comprehensive and detailed description of the system's dynamics. Since they display features in relevant two-parameter sections and discriminate simultaneously regions with different types of periodic motions or regions where there is chaotic behavior.37 These diagrams present a powerful tool to study nonlinear systems because they uncover the fine structure within the oscillatory regions, allows at classifying the dynamics in a broader context, and also permit the identification of emergent universalities found in disparate models. In this work, we report high-resolution stability diagrams in which parametric regions are classified by counting the number of spikes (local maxima) per period of sustained periodic oscillations. For details, see section Computational procedures below. The stability diagrams were computed for both galvanostatic and potentiostatic regimes. Previous studies in electrochemical systems were carried out with minimal and generic models,37,38 in contrast, herein we use a realistic electrochemical model solidly built in experimental evidences.6
2 Model equations
With the mechanism for the FAEOR described above,6 we derived the following equations for the reaction rate of each step. During oxidative adsorption of formic acid (r1), formate adsorbs on the electrode surface in the so-called bridge-bonded, HCOOB, configuration, i.e., via two oxygen atoms occupying two platinum sites. Steps (r1) can thus be given as: | (1) |
 | (2) |
After the initial step, the model considers the need for a configurational change of the HCOOB species11 before the formation reactions of COL or CO2 by formate and indirect pathways. This configurational change corresponds to reaction (r2) that forms the HCOOL species in which the C–H bond is oriented with the hydrogen atom pointing to the metal surface.12 Due to the presence of other neighboring adsorbed species, such as sulfate or other HCOOB molecules39 a simple rotation around the O–CHO bond is difficult. The need for some neighboring catalytic sites for the interaction of the molecule lying down on the platinum surface is considered. The following equation describes the rate of step (r2):
| v2 = k2θHCOOBθvac2, | (3) |
 | (4) |
Experimental observations have been reported showing that the COad formation requires the presence of at least three contiguous Pt atoms for the dehydration of HCOOH to COad.30 Considering that COad is formed from the species HCOOL, (r2)11,12,19,28 which is already occupying a site, it is clear that two other active sites are involved in this process. Therefore, a reaction order 2 with respect to θvac is considered. Just as it was considered in the case of reaction (2), the HCOOL species must lie down on the electrode surface before or simultaneously to a process in which the adsorption mode should change from a Pt–O to a Pt–C binding mode.11 The rate of step (r4) is thus given as:
 | (5) |
Reactions steps 5 and −5 consider the oxygenated species formation on the surface of the electrode from water and its respective reverse reaction, and the corresponding rate equations read:
 | (6) |
 | (7) |
 | (8) |
Finally, the direct pathway considers that the formate in solution is quickly oxidized to CO2 by a dehydrogenation process with the following rate law:
 | (9) |
| ϕ 1 | ϕ −1 | ϕ 3 | ϕ 4 | ϕ 5 | ϕ −5 | ϕ 6 | ϕ 7 |
|---|---|---|---|---|---|---|---|
| −0.04 | 0.02 | 0.38 | 0.6 | 0.4 | 0.71 | 0.78 | −0.4 |
The exponential terms in the previous equations correspond to the electrochemical rate constants of each reaction step according to the Butler–Volmer theory, i.e. or
or  . However, to decrease the number of kinetic parameters in the model, the standard rate constants k0m and the reaction standard potentials k0m have been grouped by the following substitutions:
 | (10) |
 | (11) |
From arbitrarily chosen initial values, the parameters ϕm and ϕ−m were varied in intervals of 0.01 units until the best possible congruence between the numerical results and the experimental results (observed oscillations and the voltammetry response) was achieved. The fitting values of ϕm and ϕ−m are reported in Table 1.
The five variables that describe the dynamic of the electro-oxidation process in our model are θHCOOB, θHCOOL, θCOL, θOH, and ϕ. The core model consist of the equations
 | (12) |
 | (13) |
 | (14) |
 | (15) |
These equations are supplemented by an additional equation, depending on the experiment under consideration. For galvanostatic experiments, eqn (12)–(15) are supplemented by the equation
 | (16) |
 | (17) |
Regarding the first model, the current density is a parameter easy controllable in galvanostatic experiment and therefore it is thus an obvious parameter to be explored. Other interesting parameters that may have a determining role in the dynamic behavior of the electrochemical system are the ϕm terms.6 Each of these parameters groups together two others: the standard (or formal) potential and the heterogeneous rate constant associated with the respective electrochemical reaction step.6,14,21,25 Consequently, each ϕm can be a function that depends on the nature of the electro-catalytic surface, on the chemical environment, and on factors that affect the activation energy of the m-th reaction step. Thus, ϕm are not factors individually manipulated in traditional electro-chemical experiments. In other words, it is difficult to modify the rate of a single reaction step without altering the rate of the other reactions involved in the FAEOR. In this work, the parameter space j × ϕ5 is presented under the premise that it is possible to modulate the intrinsic rate constant of COL formation through ϕ5. The choice of ϕ5 is justified by the leading role of θCOL in the positive feedback loop associated with HNDR in the pseudo-stationary voltammograms.40
In potentiostatic experiments, the electrical resistance of the system is a parameter that plays a decisive role, as it gives the freedom to the interfacial potential differ from the applied one, allowing thus the emergence of oscillations. To modulate the resistance of the system as a bifurcation parameter, an external resistance can be experimentally connected in series with the electrochemical cell. Thus, the change in the value of the electrical resistance allows shifting the dynamics of the process to a region where bistability in the system is favored.41 Hence, in the potentiostatic case, the isospike diagrams were constructed to represent the parameter space E × Rext.
3 Computational procedures
Before presenting stability phase diagrams for the galvanostatic and the potentiostatic models, we briefly describe how such diagrams were obtained.The stability diagrams reported in this work are the so-called isospike diagrams,37,42–47 namely diagrams discriminating not only periodicity from chaos but, in addition, providing a detailed cartographic representation of the number of spikes per period of the oscillations. Several illustrative examples of isospike diagrams are shown, e.g., in Fig. 3. Such phase diagrams were computed as follows. Given a parameter window of interest, we start by discretizing it into a N × N grid of equally space points. Then, for each point of the grid, the equations of motion are integrated numerically using the standard fourth-order Runge–Kutta algorithm with fixed time step h = 5 × 10⁻⁵. For simplicity, integrations are always started from the same fixed initial condition (θHCOOB,θHCOOL,θCOL,θOH,ϕ) = (0,0,0,0,0). The first 30 × 106 integration steps are discarded as a transient time needed to approach the attractor. Next, to compute the isospike diagrams, integrations are further continued for 30 × 106 additional time-steps when up to 1600 extrema (maxima and minima) of the five variables are recorded. We always recorded maxima and minima during an interval of time identical to the transient time used. In some cases, to get clean diagrams it was necessary to increase transient and integration times from the above reference value. Below, the figure captions contain the actual values used. From such records of maxima and minima it is possible to determine for each parameter point whether pulses repeated or not. Isospike diagrams are not difficult to construct based on experimental time series.48
The typical computer time needed to obtain a stability diagram with, say, 400 × 400 parameter points is of the order of 180 hours when running on 50 processors of a relatively outdated (2011) SGI Altix ICE system with 16 compute blades within the individual rack unit. It is a cluster with 1536 processors and a theoretical peak performance of 16 Tflops. Unless stated otherwise, all phase diagrams of this paper display the analysis of 400 × 400 parameter points.
All phase diagrams below use 17 colors to represent the number of spikes per period of the oscillations, as indicated by the colorbars in the figures. Oscillations that contain more than 17 spikes per period are plotted recycling modulo 17 the 17 basic colors. Black is used to represent lack of numerically detectable periodicity for a given integration step and transient time used in the Runge–Kutta integrator. To simplify diagrams, white is used to collectively represent divergent, undefined and nonoscillatory solutions, if any. The integration of differential equations for large sets of parameters and initial conditions is a quite demanding numerical task and can only be performed using computer clusters and suitable ad hoc programming.
4 Results and discussion
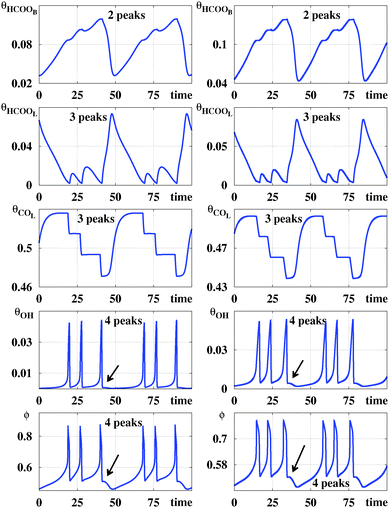
Fig. 2 compares time series for the five variables generated by the galvanostatic model and the potentiostatic model. The (arbitrary) parameters used to generate such series were chosen so that, individually, they display similar structures. From Fig. 2 one sees that while the number of spikes per period may be easily counted in the panels displaying θHCOOL, θOH and ϕ this is not the case for θHCOOB and θCOL. For these two variables, spikes are rather small and confined to narrow intervals. However, the number of spikes are not difficult to recognize by simply magnifying suitable segments of the periodic signals (not shown here). Signals are never zero but may reach values as small as 10−4. These variations in the coverage of the surface by adsorbed chemical species are only accessible through the modeling of the dynamic process. Experimentally, oscillatory patterns of the adsorbed formate coverage and adsorbed carbon monoxide coverage, calculated from the intensity of the IR bands, have been recorded in spectroelectrochemical experiments.21 However, the current experimental resolution probably would not permit distinguishing those slight variations in the coverage of adsorbate. In contrast, the electrode potential ϕ can be measured.Fig. 2 clearly shows that the number of spikes per period depends sensitively on the variable used to count them. So, it is natural to inquire if stability diagrams derived from such time series will look similar. An answer to this question is provided by the five panels in the top row of Fig. 3, which show parameter regions centered around the experimental values studied in ref. 6. These five panels shows that, indeed, diagrams obtained by counting spikes in θHCOOB and θCOL show greater similarities than the corresponding ones obtained from the spikes in θHCOOL, θOH and ϕ. The second row from the top in Fig. 3 shows magnifications of details contained in the rectangular boxes seen on the panels on the top row. While phase diagrams for θHCOOL, θOH and ϕ contain a rich alternation of stripes of different colors, diagrams for θHCOOB and θCOL display striation of a single color, corresponding to two spikes per period. As j increases, the initially continuous color of such striations starts to be mediated by the blue color of the background, corresponding to periodic oscillation having one spike per period.
The mixed-mode oscillations depicted in Fig. 2 consist of at least for two types of oscillators with different frequencies. In one case, the positive feedback loop can be assigned to the process in which an increase in potential from 0.56 V accelerates the production of θOH, which blocks active sites and causes further increase of the electrode potential. When the potential reaches the high limiting value (around to 0.85 V), the amount of θOH on the surface decreases, releasing active sites, and the potential decreases in order to maintain the current level set in the experiment, this process is defined as the negative feedback loop. The θOH participation in this oscillator was evidenced through the time series analysis, where large amplitudes are observed at higher frequency oscillations. This process has already been reported in the literature and associated with the origin of the NDR during the voltammetric experiments of the FAEOR.31
The second oscillator mainly involves the variables θHCOOB and θCOL. In this case, the positive feedback loop can be rationalized as follows: an increase of the electrode potential accelerates the production of θHCOOB, and consequently the θHCOOL and θCOL also increase, reactions (r1), (r2) and (r4), respectively. Those species block the active sites on the surface and, in order to keep the current level, a further rise of the potential results. Then, when the oxidation of COL at high potentials releases surface active sites, the negative feedback loop takes part. Once the sites are available, the oxidation reaction rates rise and the potential decrease. Hence, the amplitudes of the oscillations of θHCOOB and θCOL seem determined by the lower frequency oscillator.
The lower frequency oscillator determines the oscillation period while the higher frequency oscillator provides the number of peaks computed in the isospike diagrams, Fig. 3. Therefore, it is to be expected that the isospike diagrams of θHCOOB and θCOL are similar to each other but clearly different from that for θOH. Regarding θHCOOL and ϕ, they are affected by the changes in the other variables, responding to the behavior of both oscillators. Thus, the number of spikes counted from those variables should correspond to the number of spikes produced by the higher frequency oscillator, i.e. the number of peaks for θHCOOB and ϕ is close to the number of peaks for the variable θOH, which explains the similarity between those isospike diagrams.
Now, before describing the mechanism underlying all these phase diagrams, we mention an interesting feature in Fig. 3 that, in fact, is a significant finding of our work. As defined in Section 3, our phase diagrams use black to represent solutions, which, although not divergent, lack any numerically detectable periodicity. This type of behavior is characteristic of ‘chaotic’ oscillations. Accordingly, the upper left corner in most panels of Fig. 3 seem to indicate periodic oscillations to end up abruptly into a phase of chaotic oscillations. That this is not the case is demonstrated by comparing the black phases seen in the three bottom rows of Fig. 3. The phase diagrams in the second row from the top were obtained after removing a transient of 30 × 106 time steps, the third after 60 × 106 steps, and the forth after 120 × 106. As it is not difficult to realize, the size of the black phases decrease continuously when the transient time removed increases. This tendency indicates that, rather than chaos, the black phase merely records parameter regions that require removing considerably longer transients before finally revealing that they correspond to periodic oscillations. Several additional ad hoc tests corroborated this to be the case. Chaotic oscillations were never observed in our simulations. Incidentally, we observe that similar chaos-free oscillations were recently reported in a rather different context, namely, in the low-frequency limit of externally driven systems: in a driven Duffing oscillator, a popular model of micro- and nanomechanical devices, and for the so-called Brusselator,49 which were shown to display wide mosaics of stability phases arising from periodic oscillations of ever increasing periodicity, but with no chaos. Here, in contrast, we find chaos-free phases to arise in non-driven systems, and to emerge only in the form of stripes, not as mosaics.
Fig. 4(a) shows a magnification of essentially the same box shown on the top row of Fig. 3, obtained by counting spikes of the θHCOOL variable. Basically, Fig. 4(a) shows a division of the control parameter window into three phases displaying characteristic behaviors. First, for low ϕ5 and high j the galvanostatic model displays divergent solutions. Second, for high ϕ5 and low j one sees a black phase, indicating that although numerical solutions do not diverge in this region, no periodic oscillations are observed. Third, between the two phases above, one finds a wide intermediary region, an ‘oscillatory phase’, characterized by a large number of colored stripes, indicating the presence of stable periodic oscillations containing an apparently unbounded number of spikes (local maxima). Fig. 4(b) shows a magnification of the box in Fig. 4(a), where one sees the continuation of the sequence of points ci. The stability diagram in Fig. 4(c) shows the same parameter window depicted in Fig. 4(a), but displaying the continuous variation of the period of the θHCOOL oscillations. Fig. 4(c) complements the information provided in Fig. 4(a) and conspicuously shows the division into the three aforementioned phases. Noteworthy in this figure is the rather fast increase of the period length towards the boundary with the black phase. As already mentioned, the transition to the black phase is simply pointing out an increase in the number of spikes per period and a decrease of their amplitudes. By adjusting the integration step and neglecting longer transient times we found that it was possible to decrease continuously and systematically the size of the black phase. As before, no chaos was ever found. All these tests consume large amounts of computer time. Therefore, we have not attempted to eliminate completely the black phase. At any rate, periodic oscillations in the black phase contain large amounts of fast-oscillating small-amplitude peaks that are likely to be out of reach in experiments.
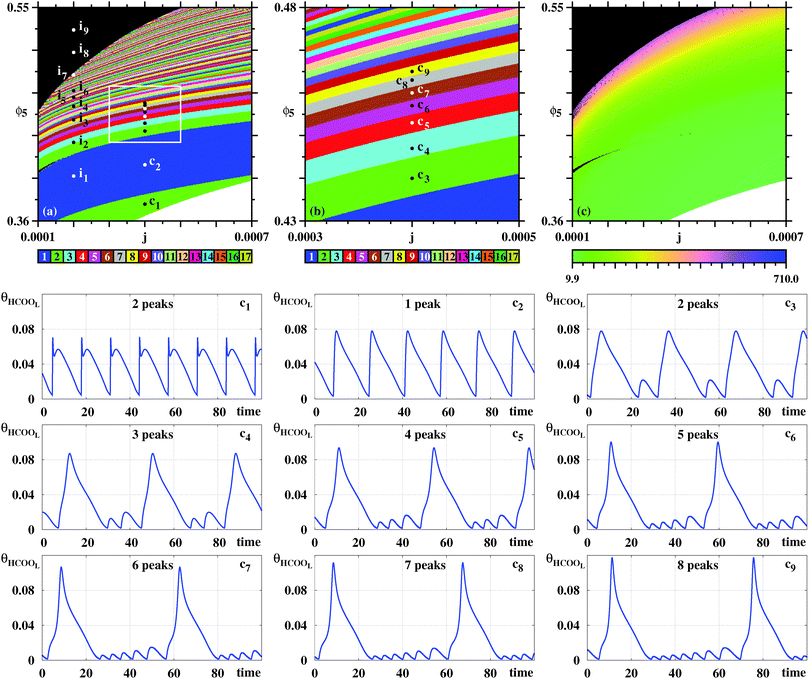 | ||
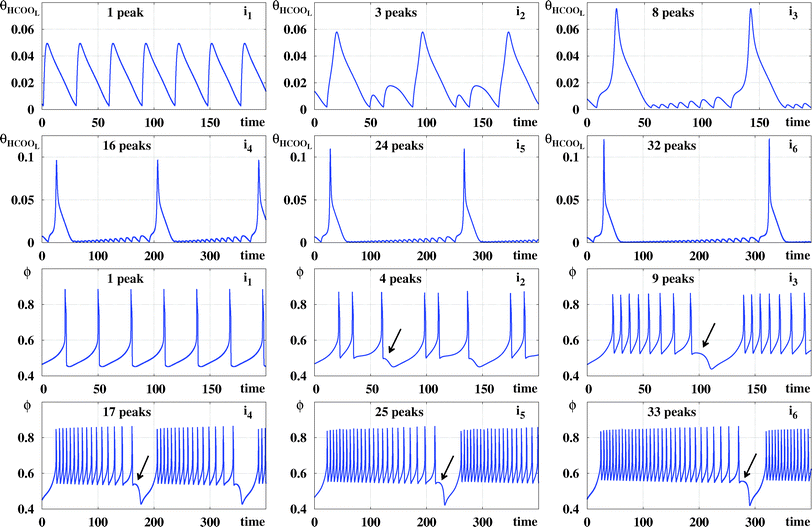
| Fig. 4 Systematic pattern complexification of the θHCOOL oscillations. (a) Isospike diagram, colors indicating the number of spikes per period of periodic oscillations of θHCOOL. (b) Magnification of the box in (a). (c) Diagram displaying the continuous variation of the period. The period grows fast by about two orders of magnitude near the black boundary. Under panels (a)–(c): plots of the temporal evolution of θHCOOL for the points labeled ci in (a) and (b), along the vertical j = 0.0004. Time series for the points ii are given below, in Fig. 6. Details of these oscillations are given in Table 2. | ||
In Fig. 4(a) there are two vertical sequences of points labeled ii and ci. Under the stability diagrams, Fig. 4 shows typical time series observed when increasing the value of ϕ5 while maintaining j constant. Such time series make plain the meaning of the stripes in Fig. 4(a): as ϕ5 increases, there is a smooth and regular complexification of the time series through the acquisition of more and more spikes. The mod 17 recycling of colors seems to indicate that their number of spikes may continue to increase continuously without bound. It is worth mentioning that the rate of COad formation on the electro-catalytic surface decreases when ϕ5 grows. This relationship increases the period of the oscillations and consequently a larger number of spikes is obtained.
Next, we investigate what happens when computing phase diagrams using a variable different from θHCOOL, used in Fig. 4. Experimentally, the variable ϕ is directly accessible in conventional electrochemical experiments, while θHCOOB and θCOL can be measured through the coupling of in situ infrared spectrophotometer with the electrochemical setup.21 The variable θOH, however, while an important component of the model, is rather difficult to study experimentally.
Fig. 5 reproduces the same numerical experiment used to obtain Fig. 4, but now based on ϕ (instead of θHCOOL). A cursory comparison between the phase diagrams in Fig. 4 and 5 may give the impression that all three diagrams coincide. However, a closer look shows that there are some differences among them. For instance, the divergent phase in Fig. 5 connect directly to the one-spike blue phase, not displaying the two-spikes phase which mediates these phases in Fig. 4. Furthermore, although Fig. 4(b) and (b) display the same parameter window, their inner content is slightly different. As a consequence, in Fig. 5 we consider a series di of points, distinct from the ci in Fig. 4. Fig. 5 contains arrows indicating the location of very small spikes. As illustrated by this sequence of time series, the arrows also indicate were new spikes are added to the oscillatory patterns when ϕ5 increases.
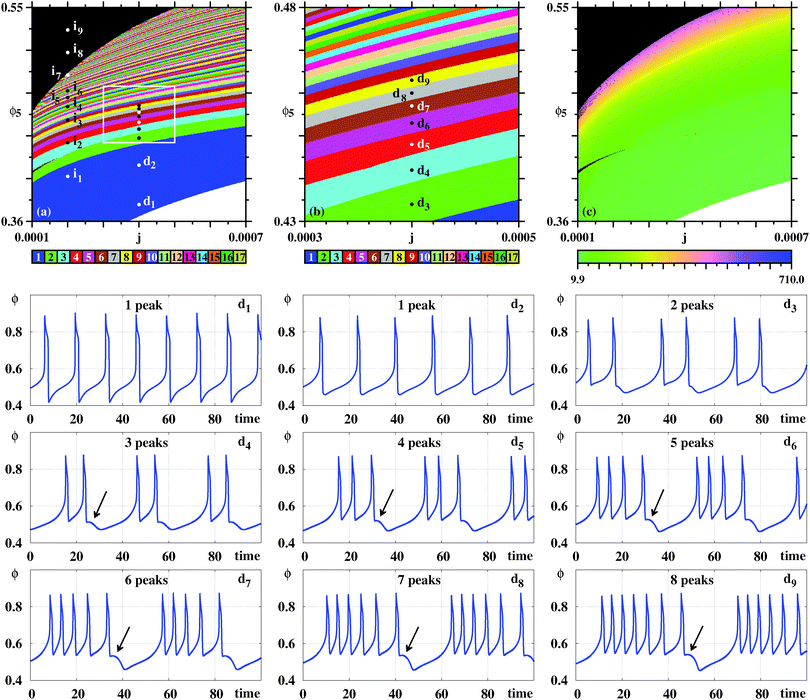 | ||
| Fig. 5 Same as in Fig. 4, but now considering the ϕ oscillations, the variable that is directly accessible in electrochemical experiments. (a) Global view. (b) Magnification of the box in (a). (c) The continuous variation of the period. The period grows fast by about two orders of magnitude when approaching the black boundary. Under panels (a)–(c): illustrative temporal evolution of ϕ obtained for j = 0.0004 when increasing ϕ5, as indicated by the points d1,…,d9. Details of these oscillations are given in Table 2. Black arrows mark location of small spikes. | ||
Taking into account the rather distinct patterns of the time series θHCOOL and ϕ, it seems remarkable that the stability phases agree so well over such wide parameter window. Noteworthy is the fact Fig. 4(c) and 5(c) display practically the same distribution of the periods, independently of the local number of spikes per period of the variables used to detect them.
Fig. 6 compares time series of θHCOOL and ϕ for the points i![[small script l]](https://www.rsc.org/images/entities/char_e146.gif) represented in Fig. 4 and 5. This figure shows clearly that, as ϕ5 grows, θHCOOL develops more and more high-frequency and low-amplitude oscillations within a period. Similarly, the difference between adjacent peaks in one oscillation period of θHCOOL becomes smaller and smaller for increasing values of ϕ5. As time grows, peaks grow further and further apart. At the end of this growth, a new peak emerges at the location indicated by the arrow in each panel. Thus, the sustained oscillations recorded for θHCOOL and ϕ display the same regular dynamical evolution as a function of both ϕ5 and j. Of course, according to two groups of behaviors discussed in connection to Fig. 3, we expect the dynamics described in detail for θHCOOL and ϕ to be always the same, independently of the variable used to record local peaks.
represented in Fig. 4 and 5. This figure shows clearly that, as ϕ5 grows, θHCOOL develops more and more high-frequency and low-amplitude oscillations within a period. Similarly, the difference between adjacent peaks in one oscillation period of θHCOOL becomes smaller and smaller for increasing values of ϕ5. As time grows, peaks grow further and further apart. At the end of this growth, a new peak emerges at the location indicated by the arrow in each panel. Thus, the sustained oscillations recorded for θHCOOL and ϕ display the same regular dynamical evolution as a function of both ϕ5 and j. Of course, according to two groups of behaviors discussed in connection to Fig. 3, we expect the dynamics described in detail for θHCOOL and ϕ to be always the same, independently of the variable used to record local peaks.
Table 2 collects the coordinates for the six points i![[small script l]](https://www.rsc.org/images/entities/char_e146.gif) considered in Fig. 6 as well as for the points i7, i8, and i9 located in the black phases in Fig. 4 and 5. Also recorded in Table 2 are the period and the number of spikes per period for each individual point. Periodic points for i8 and i9 were obtained after discarding transients of 60 × 106 and 90 × 106, respectively. As before, after suitable transients, both points located in the black phase display periodic oscillations.
considered in Fig. 6 as well as for the points i7, i8, and i9 located in the black phases in Fig. 4 and 5. Also recorded in Table 2 are the period and the number of spikes per period for each individual point. Periodic points for i8 and i9 were obtained after discarding transients of 60 × 106 and 90 × 106, respectively. As before, after suitable transients, both points located in the black phase display periodic oscillations.
| c1 | c2 | c3 | c4 | c5 | c6 | c7 | c8 | c9 | |
|---|---|---|---|---|---|---|---|---|---|
| j | 0.0004 | 0.0004 | 0.0004 | 0.0004 | 0.0004 | 0.0004 | 0.0004 | 0.0004 | 0.0004 |
| ϕ 5 | 0.375 | 0.41 | 0.44 | 0.447 | 0.453 | 0.457 | 0.46 | 0.463 | 0.465 |
| T | 13.19 | 16.23 | 30.66 | 37.83 | 43.28 | 48.7 | 54.02 | 58.93 | 64.44 |
| p HCOOL | 2 | 1 | 2 | 3 | 4 | 5 | 6 | 7 | 8 |
| d1 | d2 | d3 | d4 | d5 | d6 | d7 | d8 | d9 | |
|---|---|---|---|---|---|---|---|---|---|
| j | 0.0004 | 0.0004 | 0.0004 | 0.0004 | 0.0004 | 0.0004 | 0.0004 | 0.0004 | 0.0004 |
| ϕ 5 | 0.375 | 0.41 | 0.434 | 0.442 | 0.448 | 0.453 | 0.457 | 0.46 | 0.463 |
| T | 13.19 | 16.23 | 23.86 | 30.87 | 37.41 | 43.28 | 48.7 | 54.02 | 58.93 |
| p ϕ | 1 | 1 | 2 | 3 | 4 | 5 | 6 | 7 | 8 |
| i1 | i2 | i3 | i4 | i5 | i6 | i7 | i8 | i9 | |
|---|---|---|---|---|---|---|---|---|---|
| j | 0.0002 | 0.0002 | 0.0002 | 0.0002 | 0.0002 | 0.0002 | 0.0002 | 0.0002 | 0.0002 |
| ϕ 5 | 0.4 | 0.43 | 0.45 | 0.462 | 0.47 | 0.476 | 0.49 | 0.51 | 0.53 |
| T | 29.38 | 76.68 | 116.86 | 180.6 | 239.2 | 295.27 | 477.61 | 881.54 | 1448.4 |
| p HCOOL | 1 | 3 | 8 | 16 | 24 | 32 | 60 | 128 | 233 |
| p ϕ | 1 | 4 | 9 | 17 | 25 | 33 | 61 | 129 | 234 |
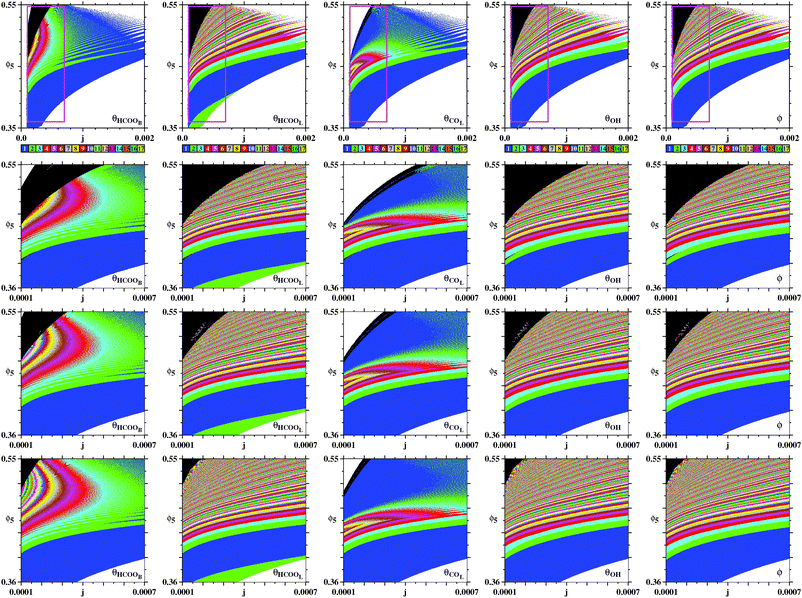
Fig. 7 complements our results for the galvanostatic model, describing the organization of the sustained oscillations as recorded for θHCOOB. To understand the origin of the ‘finger-like’ intertwined wedges corresponding to one and two, two and three, etc spikes, we computed bifurcation diagrams along the three lines in Fig. 7(a). Such diagrams display the evolution of the local maxima, spikes, of θHCOOB. Fig. 7(b) shows the bifurcation diagram obtained along the vertical line at j = 0.001, highlighting the situation for the eight arbitrary points belonging to the 1–2–1–2 spikes alternation. This bifurcation diagram shows the curious repetition of a simple pattern. As ϕ5 increases, the initial one-spiked oscillation eventually acquires a second spike. Upon further increase of ϕ5, the former one spike disappears with what was the second spike then becoming the single spike in existence for an interval of ϕ5. As this happens, the amplitude of the θHCOOB oscillations grow steadily. This cycle repeats again, with the intervals that contain one and two spikes getting narrower and narrower.
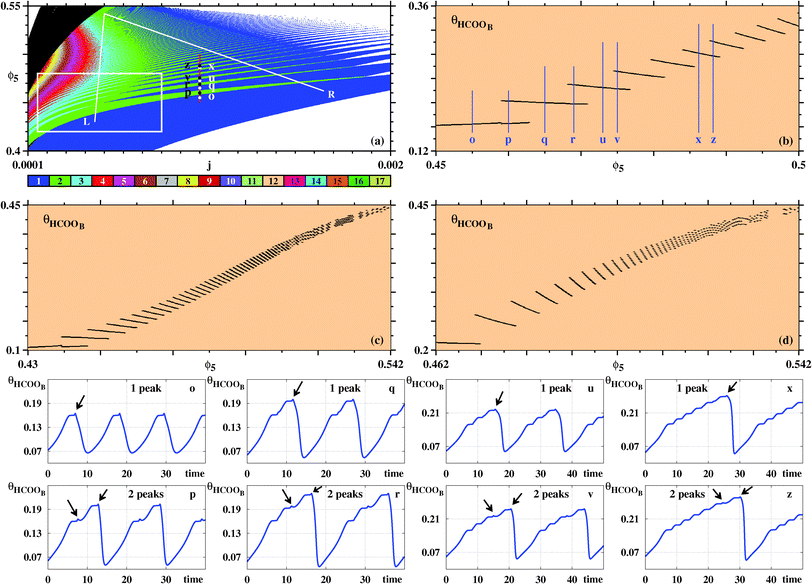 | ||
| Fig. 7 (a) Wide view of control parameter space displaying alternations of ‘finger-like’ solutions, obtained from oscillations of θHCOOB. The box is shown magnified in Fig. 8. Bifurcation diagram of θHCOOB: (b) Along the vertical line j = 0.001 in (a) illustrating the alternation between one and two peaks of θHCOOB. Points o, p, q, r, u, v, x, z are located at ϕ5 = 0.455, 0.46, 0.465, 0.469, 0.473, 0.475, 0.4862, 0.4882, respectively. (c) Along the left line L. (d) Along the right line R. Bottom two rows: The subsequent temporal evolutions highlight the alternation between one and two peaks at points o, p, q, r, u, v, x, z, along the vertical line in (a). Black arrows indicate the location of the comparatively small maxima. Panel (a) shows 600 × 600 parameter points. | ||
Additional bifurcation diagrams were computed along other two lines, namely for the left line running between (j,ϕ5) = (0.0005,0.542) to (0.00045,0.43), and the right line going between (0.0005,0.542) and (0.00165,0.462). Note that such diagrams involve the simultaneous variation of two control parameters, not the common single parameter variation. From the bifurcations along the L line one sees that the above 1–2–1–2 now turns into a 2–3–2–3 repetitive pattern, occurring also for narrower and narrower parameter intervals and for increasing amplitudes of θHCOOB. Moving to higher values of j, the bifurcations along the R line show that the intervals where two spikes coexist become quite narrow, in agreement to the organization displayed in Fig. 7(a). The last two rows in Fig. 7 display the time series proving explicit details of the regular complexification of the time evolutions for the eight selected points in Fig. 7(a). Note the different vertical scales of these latter plots, showing the steady amplitude increase of θHCOOB.
Fig. 8 presents more detailed diagrams illustrating the complex but regular unfolding of the 2–3–2–3 pattern. As seen, from this figure, it is possible to discern an apparently unbounded sequence of analogous m–n–m–n spike patterns, where m and n are integers differing by one unit.
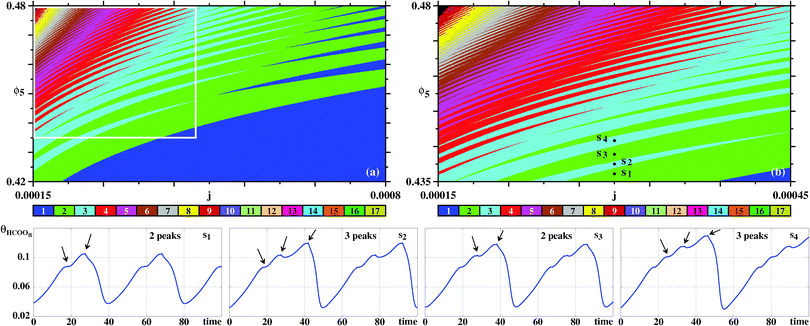 | ||
| Fig. 8 Details of the sustained oscillations of θHCOOB. (a) Magnification of the box in Fig. 7(a). (b) Magnification of the box in (a). Bottom row: Time series for points s1, s2, s3, s4 highlighting alternation of solutions with two and three peaks per period. Arrows indicate the relative maxima within the periods. | ||
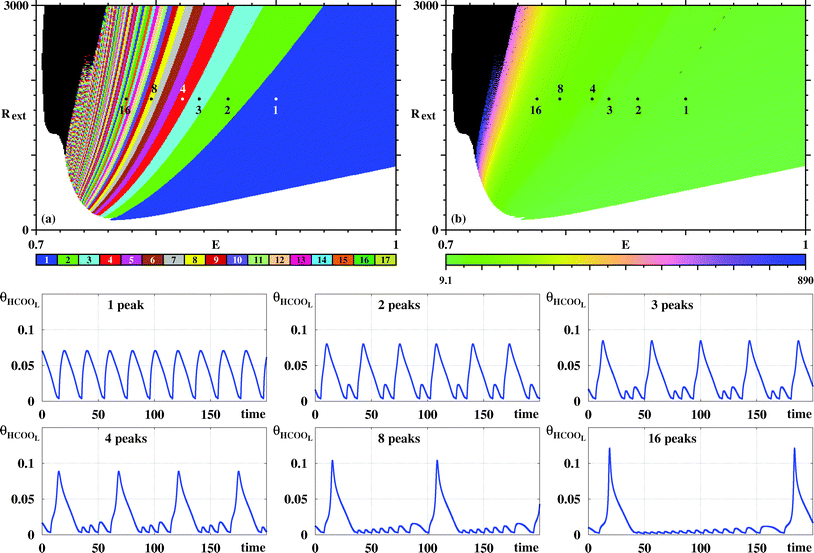
So far, we have discussed only the galvanostatic model. Now we report stability diagrams obtained for the potentiostatic model. Similarly to Fig. 3, Fig. 9 compares stability diagrams illustrating the E × Rext control parameter planes obtained by counting peaks for the five variables of the model. For the potentiostatic model, the integration step used is h = 10−5, five times smaller than the one used for the galvanostatic model. As it is not difficult to see, both models produce phase diagrams, which largely agree. Furthermore, as for the galvanostatic model, Fig. 9 shows that black phases of the potentiostatic model decrease systematically in size as the transient time increases. This indicates that, here also, no chaotic oscillations are present in the system.
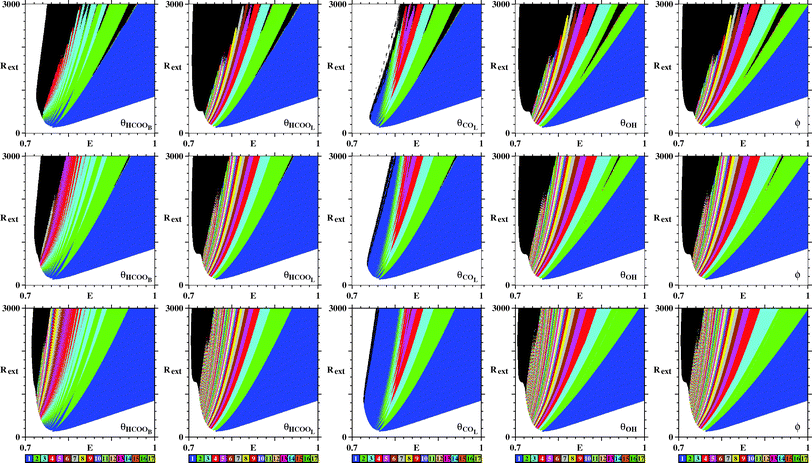 | ||
| Fig. 9 Similar to Fig. 3 but illustrating the E × Rext control parameter planes for the potentiostatic model. All integrations start from the same initial condition (θHCOOB,θHCOOL,θCOL,θOH,ϕ) = (0.05,0,0.64,0,0). Transient time increases from top to bottom being, respectively, 30 × 106, 60 × 106, and 180 × 106 time steps. Note the continuous decrease of the black region in the panels. See text. | ||
Fig. 10 illustrates the stripes observed for the potentiostatic model when counting spikes from θHCOOL while moving towards smaller values of E. The organization parallels the one found in Fig. 4 for the galvanostatic model. Remarkably, the time series obtained for the potentiostatic model look quite similar to the corresponding ones in Fig. 4. This seems to indicate that, at least in this region of control parameters, the dynamics of both models is the same. This corroborates the great similarity already transparent from the comparison of the time series presented in Fig. 2.
5 Conclusions and outlook
This work reported sets of high-resolution stability diagrams for parameter windows around recently studied experimental values.6 By classifying the spikes per period37,42–48 of the sustained periodic oscillations, stability diagrams were computed both for the galvanostatic and for the potentiostatic control modes.The major findings distilled from our phase diagrams are briefly as follows. From Fig. 3, it is possible to recognize two types of phase diagrams, obtained either from θHCOOL, θOH, ϕ or from θHCOOB and θCOL. The difference between these two types of phase diagrams is related with the involvement of those variables in two oscillators present in the electrooxidation of the formic acid. One of these oscillators involves the θOH species that blocks the active sites from 0.56 V up to 0.85 V approximately when θOH is consumed. The other oscillator involve the θHCOOB and θCOL species in blocking and unblocking cycles of the active sites of the platinum. This oscillator has a lower frequency than the first one.
The first type of diagrams, illustrated in Fig. 4 and 5, displays a regular series of striations, which arise from periodic oscillations acquiring more and more spikes when ϕ5 increases. The second type of diagrams, illustrated in Fig. 7 and 8, contains an intertwining of finger-like structures which arise from the peculiar way in which local maxima arise when ϕ5 is increased. For the potentiostatic model, Fig. 9 shows that the distribution of periodic oscillations closely resembles the ones obtained for the galvanostatic model (Fig. 3). Phase diagrams displaying the period of the oscillations were also computed. They reveal the existence of certain accumulation limits of the period characterized large period following a regular acquisition of a large number of small-amplitude and fast oscillations local maxima. Such large-period oscillations exist in the black regions of our phase diagrams.
A startling finding is that careful numerical experimentation seems to indicate that, in the parameter windows investigated, chaotic oscillations are nowhere to be found in the control parameter space of both models. Similar wide chaos-free phase were recently observed,49 but only in externally driven systems. In the present case, we find chaos-free oscillations to arise in distinct setup, namely in the self-organization of the oscillations in an autonomous (non driven) system. The striations observed in the galvanostatic and potentiostatic models resemble similar one previously seen in nested arithmetic progressions of oscillatory phases in Olsen's enzyme reaction model.50 However, in the present cases they are never mediated by chaotic oscillations. The systematic complexification of the oscillations of both models was found to occur in a rather systematic way in control parameter space. It would be now interesting to characterize the metric properties of such regular unfolding of the time series, to investigate their eventual dependence with other parameters of the models, and to compare all these predictions with experimental results.
Conflicts of interest
There are no conflicts to declare.Acknowledgements
JGF was supported by project UID/GEO/50019/2019, FCT Portugal. HV (Grant 306060/2017-5) and JACG acknowledge Conselho Nacional de Desenvolvimento Científico e Tecnológico (CNPq), Brazil, for financial support. HV acknowledges São Paulo Research Foundation (FAPESP) for financial support (#2013/16930-7). Work partially financed by the Coordenação de Aperfeiçoamento de Pessoal de Nível Superior (CAPES), Brazil, Finance Code 001. This work was partially done in the framework of an Advanced Study Group on Forecasting with Lyapunov vectors, at the Max-Planck Institute for the Physics of Complex Systems, Dresden, Germany. All bitmaps were computed in the CESUP-UFRGS clusters located in Porto Alegre, Brazil. Open Access funding provided by the Max Planck Society.Notes and references
- K. Jiang, H. X. Zhang, S. Zou and W. B. Cai, Electrocatalysis of formic acid on palladium and platinum surfaces: from fundamental mechanisms to fuel cell applications, Phys. Chem. Chem. Phys., 2014, 16, 20360–20376 RSC.
- S. Uhm, H. J. Lee and J. Lee, Understanding underlying processes in formic acid fuel cells, Phys. Chem. Chem. Phys., 2009, 11, 9326–9336 RSC.
- A. Capon and R. Parsons, The oxidation of formic acid on noble metal electrodes I. Review of previous work, J. Electroanal. Chem. Interfacial Electrochem., 1973, 44, 239–254 CrossRef CAS.
- A. Capon and R. Parsons, The oxidation of formic acid on noble metal electrodes II. A comparison of the behavior of pure electrodes, J. Electroanal. Chem. Interfacial Electrochem., 1973, 44, 239–254 CrossRef CAS.
- A. Cuesta, Encyclopedia of Interfacial Chemistry: Surface Science and Electrochemistry, Elsevier, 2017, pp. 620–632.
- A. Calderón-Cárdenas, F. W. Hartl, J. A. C. Gallas and H. Varela, Modeling the triple-path electro-oxidation of formic acid on platinum: cyclic voltammetry and oscillations, Catal. Today, 2020, 34 DOI:10.1016/j.cattod.2019.04.054.
- M. Osawa, K. I. Komatsu, G. Samjeské, T. Uchida, T. Ikeshoji, A. Cuesta and C. Gutiérrez, The role of bridge-bonded adsorbed formate in the electrocatalytic oxidation of formic acid on platinum, Angew. Chem., Int. Ed., 2011, 50, 1159–1163 CrossRef CAS PubMed.
- Y. X. Chen, M. Heinen, Z. Jusys and R. J. Behm, Kinetic isotope effects in complex reaction networks: Formic acid electro-oxidation, ChemPhysChem, 2007, 8, 380–385 CrossRef CAS PubMed.
- Y. X. Chen, M. Heinen, Z. Jusys and R. J. Behm, Kinetics and mechanism of the electrooxidation of formic acid-spectroelectrochemical studies in a flow cell, Angew. Chem., Int. Ed., 2016, 45, 981–985 CrossRef PubMed.
- Y.-X. Chen, M. Heinen, Z. Jusys and R. J. Behm, Bridge-bonded formate: Active intermediate or spectator species in formic acid oxidation on a Pt film electrode?, Langmuir, 2006, 22, 10399–10408 CrossRef CAS PubMed.
- A. Ferre-Vilaplana, J. V. Perales-Rondón, C. Buso-Rogero, J. M. Feliu and E. Herrero, Formic acid oxidation on platinum electrodes: a detailed mechanism supported by experiments and calculations on well-defined surfaces, J. Mater. Chem. A, 2017, 5, 21773–21784 RSC.
- W. Gao, E. H. Song, Q. Jiang and T. Jacob, Revealing the active intermediates in the oxidation of formic acid on Au and Pt(111), Chem. – Eur. J., 2014, 20, 11005–11012 CrossRef CAS PubMed.
- J. Jiang, J. Scott and A. Wieckowski, Direct evidence of a triple-path mechanism of formate electrooxidation on Pt black in alkaline media at varying temperature. Part I: The electrochemical studies, Electrochim. Acta, 2013, 104, 124–133 CrossRef CAS.
- D. Mei, Z. D. He, D. C. Jiang, J. Cai and Y. Chen, Modeling of Potential Oscillation during Galvanostatic Electrooxidation of Formic Acid at Platinum Electrode, J. Phys. Chem. C, 2014, 118, 6335–6343 CrossRef CAS.
- Y. X. Chen, S. Ye, M. Heinen, Z. Jusys, M. Osawa and R. J. Behm, Application of in situ attenuated total reflection-Fourier transform infrared spectroscopy for the understanding of complex reaction mechanism and kinetics: Formic acid oxidation on a pt film electrode at elevated temperatures, J. Phys. Chem. B, 2006, 110, 9534–9544 CrossRef CAS PubMed.
- G. Samjeské, A. Miki, S. Ye and M. Osawa, Mechanistic study of electrocatalytic oxidation of formic acid at platinum in acidic solution by time-resolved surface-enhanced infrared absorption spectroscopy, J. Phys. Chem. B, 2006, 110, 16559–16566 CrossRef PubMed.
- G. Samjeské and M. Osawa, Current oscillations during formic acid oxidation on a Pt electrode: Insight into the mechanism by time-resolved IR spectroscopy, Angew. Chem., Int. Ed., 2005, 44, 5694–5698 CrossRef PubMed.
- G. Samjeské, A. Miki, S. Ye, A. Yamakata, Y. Mukouyama, H. Okamoto and M. Osawa, Potential oscillations in galvanostatic electrooxidation of formic acid on platinum: A time-resolved surface-enhanced infrared study, J. Phys. Chem. B, 2005, 109, 23509–23516 CrossRef PubMed.
- W. Gao, J. A. Keith, J. Anton and T. Jacob, Theoretical elucidation of the competitive electro-oxidation mechanisms of formic acid on Pt(111), J. Am. Chem. Soc., 2010, 132, 18377–18385 CrossRef PubMed.
- A. Miki, S. Ye and M. Osawa, Surface-enhanced IR absorption on platinum nanoparticles: an application to real-time monitoring of electrocatalytic reactions, Chem. Commun., 2002, 1500–1501 RSC.
- Y. Mukouyama, M. Kikuchi, G. Samjeské, M. Osawa and H. Okamoto, Potential oscillations in galvanostatic electrooxidation of formic acid on platinum: A mathematical modeling and simulation, J. Phys. Chem. B, 2006, 110, 11912–11917 CrossRef CAS PubMed.
- L. A. Kibler and M. Al-Shakran, Adsorption of Formate on Au(111) in Acid Solution: Relevance for Electro-Oxidation of Formic Acid, J. Phys. Chem. C, 2016, 120, 16238–16245 CrossRef CAS.
- B. Beden, A. Bewick and C. Lamy, A study by electrochemically modulated infrared reflectance spectroscopy of the electrosorption of formic acid at a platinum electrode, J. Electroanal. Chem., 1983, 148, 147–160 CrossRef CAS.
- W. Zhong and D. Zhang, New insight into the CO formation mechanism during formic acid oxidation on Pt(111), Catal. Commun., 2012, 29, 82–86 CrossRef CAS.
- H. Okamoto, N. Tanaka and M. Naito, Modelling temporal kinetic oscillations for electrochemical oxidation of formic acid on Pt, Chem. Phys. Lett., 1996, 248, 289–295 CrossRef CAS.
- H. Okamoto, Mechanistic studies of the potential oscillation and induction period in the oxidation of formic acid on platinum, Electrochim. Acta, 1992, 37, 37–42 CrossRef CAS.
- W. Gao, J. A. Keith, J. Anton and T. Jacob, Oxidation of formic acid on the Pt(111) surface in the gas phase, Dalton Trans., 2010, 39, 8450 RSC.
- W. Gao, J. E. Mueller, Q. Jiang and T. Jacob, The role of Co-adsorbed CO and OH in the electrooxidation of formic acid on Pt(111), Angew. Chem., Int. Ed., 2012, 51, 9448–9452 CrossRef CAS PubMed.
- V. Grozovski, V. Climent, E. Herrero and J. M. Feliu, Intrinsic activity and poisoning rate for HCOOH oxidation on platinum stepped surfaces, Phys. Chem. Chem. Phys., 2010, 12, 8822–8831 RSC.
- A. Cuesta, M. M. Escudero, B. Lanova and H. Baltruschat, Cyclic voltammetry, FTIRS, and DEMS study of the electrooxidation of carbon monoxide, formic acid, and methanol on cyanide-modified Pt(111) electrodes, Langmuir, 2009, 25, 6500–6507 CrossRef CAS PubMed.
- L. W. Liao, M. F. Li, J. Kang, D. Chen, Y. X. Chen and S. Ye, Electrode reaction induced pH change at the Pt electrode/electrolyte interface and its impact on electrode processes, J. Electroanal. Chem., 2013, 688, 207–215 CrossRef CAS.
- F. N. Albahadily and M. Schell, Observation of several different temporal patterns in the oxidation of formic acid at a rotating platinum-disk electrode in an acidic medium, J. Electroanal. Chem., 1991, 308, 151–173 CrossRef CAS.
- P. Strasser, M. Eiswirth and G. Ertl, Oscillatory instabilities during formic acid oxidation on Pt(100), Pt(110) and Pt(111) under potentiostatic control. II. Model calculations, J. Chem. Phys., 1997, 107, 991–1003 CrossRef CAS.
- H.-F. Wang and Z. P. Liu, Formic acid oxidation at Pt/H2O interface from periodic DFT calculations integrated with a continuum solvation model, J. Phys. Chem. C, 2009, 113, 17502–17508 CrossRef CAS.
- K. A. Schwarz, R. Sundararaman, T. P. Moffat and T. C. Allison, Formic acid oxidation on platinum: A simple mechanistic study, Phys. Chem. Chem. Phys., 2017, 17, 20805–20813 RSC.
- J. V. Perales-Rondón, E. Herrero and J. M. Feliu, Effects of the anion adsorption and pH on the formic acid oxidation reaction on Pt(111) electrodes, Electrochim. Acta, 2014, 140, 511–517 CrossRef.
- M. A. Nascimento, J. A. C. Gallas and H. Varela, Self-organized distribution of periodicity and chaos in an electrochemical oscillator, Phys. Chem. Chem. Phys., 2011, 13, 441–446 RSC.
- M. A. Nascimento, R. Nagao, M. Eiswirth and H. Varela, Coupled slow and fast surface dynamics in an electrocatalytic oscillator: Model and simulations, J. Chem. Phys., 2014, 141, 234701 CrossRef PubMed.
- N. Garcia-Araez, V. Climent, P. Rodriguez and J. M. Feliu, Thermodynamic analysis of (bi)sulphate adsorption on a Pt(111) electrode as a function of pH, Electrochim. Acta, 2008, 53, 6793–6806 CrossRef CAS.
- T. Gojuki, Y. Numata, Y. Mukouyama and H. Okamoto, Hidden negative differential resistance in the oxidation of formic acid on platinum, Electrochim. Acta, 2014, 129, 142–151 CrossRef CAS.
- K. Krischer and H. Varela, in Handbook of Fuel Cells: Fundamentals, Tecnology and Applications, Fuel Cell Electrocatalysis., ed. W. Vielstich, A. Lamm and H. A. Gasteier, Wiley-VCH Verlag GmbH & Co. KGaA, Chichester, 2010, vol. 2, pp. 1–23 Search PubMed.
- J. G. Freire and J. A. C. Gallas, Stern-Brocot trees in cascades of mixed-mode oscillations and canards in the extended Bonhoeffer-van der Pol and the FitzHugh-Nagumo models of excitable systems, Phys. Lett. A, 2011, 375, 1097–1103 CrossRef CAS.
- J. G. Freire and J. A. C. Gallas, Stern-Brocot trees in the periodicity of mixed-mode oscillations, Phys. Chem. Chem. Phys., 2011, 13, 12191–12198 RSC.
- X. Rao, Y. Chu, L. Xu, Y. Chang and J. Zhang, Fractal structures in centrifugal flywheel governor system, Commun. Nonlinear Sci. Numer. Simul., 2017, 50, 330–339 CrossRef.
- K. Klapcsik and F. Hegedüs, The effect of high viscosity on the evolution of the bifurcation set of a periodically excited gas bubble, Chaos, Solitons Fractals, 2017, 104, 198–208 CrossRef.
- C. Manchein, H. A. Albuquerque and L. F. Mello, Exploring the dynamics of a third-order phase-locked loop model, Int. J. Bif, Chaos, 2018, 28, 1830038 Search PubMed.
- J. A. C. Gallas, in Advances in Atomic, Molecular, and Optical Physics, ed. E. Arimondo, C. C. Lin and S. F. Yelin, Academic Press, Burlington, 2016, vol. 65, ch. 3, pp. 127–191 Search PubMed.
- A. Sack, J. G. Freire, E. Lindberg, T. Pöschel and J. A. C. Gallas, Discontinuous spirals of stable periodic oscillations, Sci. Rep., 2013, 3, 3350 CrossRef PubMed.
- J. G. Freire, M. R. Gallas and J. A. C. Gallas, Chaos-free oscillations, Europhys. Lett., 2017, 118, 38003 CrossRef.
- M. R. Gallas and J. A. C. Gallas, Nested arithmetic progressions of oscillatory phases in Olsen's enzyme reaction model, Chaos, 2015, 25, 064603 CrossRef PubMed.
| This journal is © the Owner Societies 2020 |

![[thin space (1/6-em)]](https://www.rsc.org/images/entities/char_2009.gif) Ω and
Ω and