 Open Access Article
Creative Commons Attribution 3.0 Unported Licence
Unravelling the early oxidation mechanism of zinc phosphide (Zn3P2) surfaces by adsorbed oxygen and water: a first-principles DFT-D3 investigation†
Nelson Y.
Dzade

School of Chemistry, Cardiff University, Main Building, Park Place, CF10 3AT, Cardiff, UK. E-mail: N.Y.Dzade@cardiff.ac.uk
First published on 20th December 2019
Abstract
Zinc phosphide (Zn3P2) is a novel earth-abundant photovoltaic material with a direct band gap of 1.5 eV. Herein, the incipient oxidation mechanism of the (001), (101), and (110) Zn3P2 surfaces in the presence of oxygen and water, which severely limits the fabrication of efficient Zn3P2-based photovoltaics, has been investigated in detail by means of dispersion-corrected density functional theory (DFT-D3) calculations. The fundamental aspects of the oxygen and water adsorption, including the initial adsorption geometries, adsorption energies, structural parameters, and electronic properties, are presented and discussed. A chemical picture and origin of the initial steps of Zn3P2 surface oxidation are proposed through analyses of Bader charges, partial density of states, and differential charge density isosurface contours. The results presented show that while water interacts weakly with the Zn ions on the Zn3P2 surfaces, molecular and dissociative oxygen species interact strongly with the (001), (101), and (110) surface species. The adsorption of oxygen is demonstrated to be characterized by a significant charge transfer from the interacting surface species, causing them to be oxidized from Zn2+ to Zn3+ formal oxidation states. Preadsorbed oxygen species are shown to facilitate the O–H bond activation of water towards its dissociation, with the adsorbed hydroxide species (OH−) demonstrated to draw a significant amount of charges from the interacting surface sites. Despite the fact that the semiconducting nature of the different Zn3P2 surfaces is preserved, we observe noticeable adsorption induced changes in their electronic structures, with the covered surface exhibiting smaller band gaps than the naked surfaces. The present study demonstrates the importance of the oxygen–water/solid interface to understand the oxidation mechanism of Zn3P2 in the presence of oxygen and water at the molecular level. The study also highlights the need for Zn3P2 nanoparticles to be protected against possible oxidation in the presence of oxygen and moisture via in situ functionalization, wherein the Zn3P2 nanoparticles are exposed to a vapour of organic functional molecules immediately after synthesis.
1. Introduction
The development of sustainable and inexpensive photovoltaics (PV) on the terawatt scale requires low-cost and earth abundant solar absorber materials with excellent optoelectronic properties.1–3 From a recent cost–benefit analysis performed on earth-abundant semiconducting materials with electronic structures suitable for photovoltaic applications to determine possible alternatives to crystalline silicon, zinc phosphide (Zn3P2) was identified among the most promising materials to have the capacity to meet or exceed annual worldwide electricity consumption with a significant cost-reduction over crystalline silicon.1 Zinc phosphide is an attractive potential candidate for scalable thin-film photovoltaic applications owing to its direct band gap of 1.5 eV,4 high visible-light absorption coefficient (>104 cm−1),5,6 long minority-carrier diffusion length (∼10 μm),7 high extinction coefficient,8 passive grain boundaries,9 and large range of potential doping concentrations (1013–1018 cm−3),10 as well as due to both of its constituent elements that are relatively inexpensive and abundantly available in the earth's crust.Despite its germane optoelectronic properties, to date, a Zn3P2 device of sufficient efficiency for commercial applications has not been demonstrated.11–16 Besides problems such as poor band-alignment with buffer layers and inadequate interface passivation,17,18 low surface stability and oxidation in the presence of oxygen18–20 and moisture21 remain major problems that severely limit the fabrication of efficient Zn3P2-based photovoltaics. Zn3P2 typically reacts with moisture to form zinc hydroxide and with oxygen to form zinc phosphate. The issue of surface oxidation gets worse when Zn3P2 is synthesized in a nanomaterial format due to the higher specific surface area, and consequently, higher reactivity relative to the bulk.22,23 Efforts have been made to passivate Zn3P2 surfaces via in situ functionalization, wherein the Zn3P2 nanoparticles of thin films are exposed to a vapour of organic functional molecules immediately after synthesis.24 This approach has been demonstrated to enhance the surface stability of Zn3P2 particles against air and moisture assisted degradation.
Protection of Zn3P2 surfaces against unwanted oxidation requires a detailed understanding of the underlying reaction mechanisms of environmental agents such as oxygen and water. However, there has been no dedicated study aimed at unravelling the interactions of oxygen and water with Zn3P2 surfaces, and with the mechanism of the early oxidation of Zn3P2 surfaces yet to be elucidated, this investigation is timely. In the present work periodic DFT-D3 calculations have been performed to elucidate the oxidation mechanism of Zn3P2 surfaces in the presence of oxygen and water. First, the surface structures, composition and the relative stability of the (001), (101), and (110) surfaces were characterized. The reactivity of the Zn3P2 surfaces with respect to O2 and H2O is then investigated considering both molecular and dissociative adsorption. Finally, atomic-level insights and a chemical picture of the initial steps of the reaction leading to the oxidation of Zn and P sites on the surface were provided via electronic structure analyses (Bader charges, partial density of states (PDOS), and differential charge density isosurface plots). The results revealed that the adsorption of oxygen, water, and their dissociated products on the (001), (101), and (110) surfaces is characterized by significant charge from the interacting surface species, which is demonstrated to be the primary origin of the oxidation of Zn3P2 surfaces.
2. Computational details
The electronic structure calculations were performed using density functional theory (DFT) within periodic boundary conditions as implemented in the Vienna Ab initio Simulation Package (VASP).25–27 The interactions between the valence and core electrons were described with the projected augmented wave (PAW) method.28,29 The electronic exchange–correlation potential was calculated using the GGA-PBE functional30,31 and the long-range dispersion forces are accounted for using the Grimme DFT-D3 method.32 A plane-wave basis set with a kinetic energy cut-off of 600 eV was tested to be sufficient to converge the total energy of the ferrihydrite to within 10−6 eV and the residual Hellmann–Feynman forces on all relaxed atoms reached 10−3 eV Å−1. The Brillouin zone of the bulk Zn3P2 was sampled using a 5 × 5 × 3 Monkhorst–Pack33K-points mesh, whereas the (001), (101), and (110) surfaces were sampled using 5 × 3 × 1, 5 × 3 × 1, and 3 × 3 × 1 K-points meshes respectively, which ensures electronic and ionic convergence.The fully optimized tetragonal bulk structure of Zn3P2 with space group P42/nmc (Fig. 1) was employed in the creation of the (001), (101), and (110) surfaces of Zn3P2 using the METADISE code,34 which ensures the creation of surfaces with zero dipole moment perpendicular to the surface plane.35 The slabs were constructed with identical surfaces in order to avoid artificial electric-fields in the vacuum for studies of polar surfaces. However, due to the adsorption of O2 and H2O on only one side of the slab, the Makov–Payne dipole correction perpendicular to the surface, as implemented in the VASP code,36 was applied to ensure that there is no net charge or monopole/dipole perpendicular to the surfaces, which might otherwise affect the adsorption energetics and structures. The adsorption calculations were carried out on (1 × 2), (1 × 1), and (1 × 1) supercells of the (001), (101), and (110) surfaces, respectively, as shown in Fig. 2. These simulation supercells are large enough to minimize the lateral interactions between the adsorbate molecules and their dissociated products in neighbouring image cells.
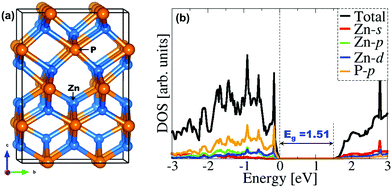 | ||
| Fig. 1 (a) The tetragonal unit cell of Zn3P2 and (b) the partial DOS calculated with the HSE06 functional. | ||
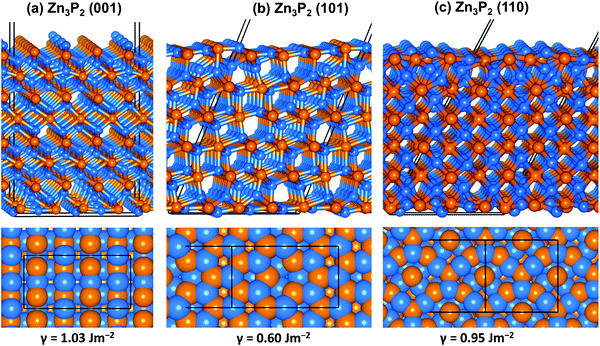 | ||
| Fig. 2 Optimized structure of the (001), (101) and (110) surface of Zn3P2 in side and top views colour scheme: Zn = blue and S = orange. | ||
To determine the optimum adsorption sites and geometries, the atoms of the adsorbate and the topmost seven layers of the slab are allowed to relax unconstrainedly until residual forces on all atoms had reached 10−3 eV Å−1. The adsorption energy (Eads) which is considered as a measure of the strength of adsorbate–surface interaction is defined as follows:
| Eads = Eadsorbate+surface − (Esurface + Eadsorbate) | (1) |
 | (2) |
Prior to the adsorption of O2 and H2O molecules on the Zn3P2 surfaces, the reference energies, bond length (d), and stretching vibrational frequencies (ν) of H2O and O2 in the spin triplet state were computed in a cubic cell of size 15 Å, sampling only the Γ-point of the Brillouin zone, and compared with available experimental data to ensure that our calculations are accurate and reliable. The d(O–O) and ν(O–O) of O2 are calculated at 1.24 Å and 1545 cm−1, respectively, both of which are in close agreement with the experimental values of 1.21 Å,37 and 1555 cm−1,38 as well as with other DFT results.39–41 The d(O–H) and α(HOH) angles of water are calculated to be 0.972 Å and 104.7° respectively, and the calculated asymmetric and symmetric stretching vibrational frequencies are predicted at 3713 and 3623 cm−1, all of which are in good agreement with experimental values.42 To characterize the extent of oxidation or reduction of the surface species due to the adsorption of O2 and H2O molecules, Bader charge analysis44 was performed on all stable adsorbate–surface systems and the results were compared to those of the naked surface counterparts. Further insights into the adsorption-induced changes to the electronic structures of the Zn3P2 surfaces were ascertained through analyses of the partial density of states (PDOS) and differential charge density isosurface contours.
3. Results and discussion
3.1 Bulk and surface characterization
Zn3P2 crystallizes at room temperature in a tetragonal system with space group P42/nmc (D154h) and lattice parameters a = b = 8.089 Å, c = 11.396 Å (Fig. 1a).45–50 The primitive unit cell contained 16 P atoms and 24 Zn atoms. Each cation atom (Zn) has a tetrahedral coordination with its nearest neighbours, i.e. with four phosphorus atoms, whereas each phosphorus ion is surrounded by six Zn atoms. A full unit cell relaxation yielded a strain-free Zn3P2 with lattice parameters a = b = 8.053 Å, c = 11.327 Å, which compares very well with known experimental data.45–50 To overcome the limitation of standard DFT methods in accurately predicting the electronic band gap of semiconducting materials, the screened hybrid DFT functional with 25% Hartree–Fock exchange51 was employed to determine the electronic structure of Zn3P2 (Fig. 1b). The band gap is predicted at 1.51 eV in excellent agreement with experimental estimation4 and previous DFT predictions.17,52 It is evident from the partial density of states (PDOS) plot that the electronic states of the Zn-pd and P-p orbitals dominate the valence band, whereas the conduction band is composed of the Zn-sd orbitals.From the relaxed Zn3P2 structure, the (001), (101), and (110) surfaces were created and modelled in order to determine their structure, composition and relative stability. The (001) surface has three unique terminations, whereas the (101) and (110) surfaces have two unique possible terminations, all of which were considered and fully relaxed in order to determine the most stable terminations. For each surface, the slab thickness was increased until convergence of the surface energy was achieved within 1 meV per cell. The converged slab thickness of the (001), (101), and (110) surfaces is 22.67, 19.65, and 17.02 Å, respectively. A vacuum region of 20 Å was tested to be large enough to avoid any spurious interactions between periodic slabs. The relaxed structure of the most stable termination of each surface is schematically shown in Fig. 2, whereas the unrelaxed and relaxed structures of all possible terminations of each surface are shown in ESI,† Fig. S1–S3. The relative stability of the different surfaces terminations was determined according to their relaxed surface energy (γr) calculated using the equation
 | (3) |
| Surface | Termination | γ unrelaxed (J m−2) | γ relaxed (J m−2) | % relaxation |
|---|---|---|---|---|
| (001) | Zn | 1.48 | 1.03 | 30.4 |
| P–(A) | 1.67 | 1.18 | 29.3 | |
| P–(B) | 1.89 | 1.48 | 21.7 | |
| (101) | Zn–(A) | 0.90 | 0.60 | 33.3 |
| Zn–(B) | 1.05 | 0.69 | 34.2 | |
| (110) | Zn | 1.60 | 0.95 | 40.6 |
| P | 1.73 | 1.17 | 32.2 | |
3.2 Adsorption of O2 and H2O oxygen on the Zn3P2(001) surface
The adsorption of oxygen and water molecules on the Zn3P2 surfaces represents an important starting step towards their oxidation process. Hence the first interest of this study is to determine the lowest-energy adsorption configurations of oxygen and water on the (001), (101), and (110) surfaces. For the adsorption of molecular oxygen on the pure Zn3P2(001), two initial adsorption modes, the end-on and side-on modes, wherein O2 binds vertically or parallel to the surface were considered. In all adsorbate/surface calculations, the surface atoms and the O2 molecule were free to relax unconstrainedly during energy minimization in order to obtain the lowest-energy adsorption structures. The calculated adsorption energies, atomic charges, optimized interatomic bond distances, and stretching vibrational frequencies of adsorbed O2 on the (001) surface are summarized in Table 2. The side-on adsorption modes in which both ends of the O2 molecule bind at two different surface sites are found to be energetically more favourable than the end-on configurations. The lowest-energy O2 adsorption geometry on the (001) surface is predicted to be a side-on configuration, wherein one end of O2 binds at the Zn site and the other end at the P site (Fig. 3a-M1). The adsorption energy of this structure is −3.20 eV and the optimized O–O, O–Zn and O–P interatomic bonds are predicted at 1.500, 1.926, and 1.668 Å, respectively. Similar adsorption energies are predicted for two other side-on configurations in which both ends of the O2 molecule bind at different Zn sites (Fig. 3b-M2 and c-M3). In the M2 geometry, the O2 molecule interacts with Zn ions in the topmost 1st and 2nd layers releasing an adsorption energy of −3.01 eV, whereas in the M3 geometry it interacts with two topmost Zn ions releasing an adsorption energy of −2.86 eV. The O–O bond distance in the M2 and M3 geometries is calculated at 1.467 and 1.389, respectively, both of which suggest elongation compared to the gas phase O–O distance of 1.24 Å. The interacting O–Zn bond distances in the M2 structure are 1.896 and 1.912 Å, whereas in the M3 structure, they are 1.931 and 1.939 Å.| Surface | Config. | E ads (eV) | |q| (e−) | d(O–Zn) (Å) | d(O–P) (Å) | d(O–O) (Å) | ν(O–O)/cm−1 |
|---|---|---|---|---|---|---|---|
| (001) | M1 | −3.23 (−3.17) | −1.72 | 1.926 | 1.668 | 1.500 | 780.3 |
| M2 | −3.01 (−2.98) | −1.12 | 1.896/1.912 | — | 1.467 | 815.5 | |
| M3 | −2.86 (−2.79) | −0.93 | 1.931/1.939 | — | 1.389 | 952.2 | |
| M4 | −1.63 (−1.56) | −0.57 | 1.941 | — | 1.321 | 1151.4 | |
| M5 | −1.52 (−1.43) | −0.70 | 2.062 | — | 1.372 | 1055.3 | |
| D1 | −6.90 (−6.75) | −2.98 | 1.849 | 1.603 | — | — | |
| (101) | M1 | −2.06 (−2.01) | −1.87 | 1.942 | 1.664 | 1.527 | 717.6 |
| M2 | −0.79 (−0.73) | −0.53 | 2.014 | — | 1.309 | 1186.1 | |
| M3 | −0.52 (−0.49) | −0.70 | 2.096 | — | 1.366 | 1050.1 | |
| M4 | −0.34 (−0.30) | −0.66 | 2.234/2.271 | — | 1.329 | 1098.8 | |
| D1 | −6.28 (−6.13) | −3.75 | 1.909 | 1.586 | — | — | |
| D2 | −6.02 (−5.94) | −3.62 | 2.021 | 1.636 | — | — | |
| (110) | M1 | −1.77 (−1.72) | −0.92 | 1.942/1.978 | — | 1.395 | 910.6 |
| M2 | −1.68 (−1.60) | −1.81 | 1.913 | 1.676 | 1.476 | ||
| M3 | −1.03 (−0.99) | −0.68 | 2.132/2.013 | — | 1.365 | 1043.4 | |
| M4 | −0.96 (−0.92) | −0.55 | 1.979 | — | 1.313 | 1171.3 | |
| D1 | −4.95 (−4.84) | −3.54 | 1.848 | 1.646 | — | — | |
| D2 | −2.26 (−2.13) | −2.64 | 1.766 | 1.637 | — | — | |
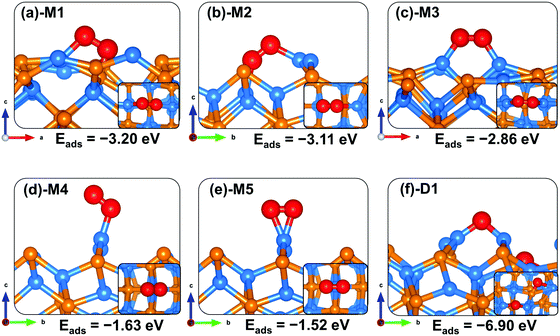 | ||
| Fig. 3 Optimized adsorption structures of an oxygen molecule on Zn3P2(001). The insets show the top views. Color scheme: Zn = blue, P = orange, and O = red. | ||
The end-on configuration of O2 on the (001) surface (Fig. 3d-M4) released an adsorption energy of −1.63 eV, with the O–O and O–Zn distances calculated at 1.321 Å and 1.941 Å, respectively. A side-on adsorption geometry at the same Zn site (Fig. 3e-M5) released an adsorption energy of −1.52 eV, with the O–O and O–Zn distances calculated at 1.372 Å and 2.062 Å, respectively. Consistent with the predicted elongated/weaker O–O bonds, lower stretching vibrational frequencies are calculated for all adsorbed O2 compared to the gas phase O2 molecule (Table 2). The stretching O2 vibrational frequencies are calculated at M1 (780.3 cm−1), M2 (815.5 cm−1), M3 (952.2 cm−1), M4 (1151.4 cm−1) and M5 (1055.3 cm−1), all of which are lower than the gas phase O2 molecule value of 1558 cm−1. Based on the calculated stretching frequencies and the O–O bond lengths of the adsorbed O2 (1.46–1.50 Å for M1 and M2, and 1.32–1.39 Å for M3–M5 configurations), which are similar to that of the O2− ion (1.33 Å) and O22− (1.44 Å),53,54 the adsorbed molecular oxygen species on the Zn3P2(001) surface can be assigned to superoxo (O2−) and peroxo (O22−) species. The weaker O–O bonds suggest that the peroxo and superoxo species are likely precursors for O2 dissociation on the Zn3P2(001) surface. Investigation of the dissociative O2 adsorption revealed that compared to the molecular adsorption modes, the dissociative adsorption is highly exothermic (Eads = −6.90 eV), which suggests that on a regular Zn3P2(001) surface dissociative O2 adsorption is energetically favoured over molecular adsorption. Compared to the O2 bond dissociation energy of 5.13 eV,43 the highly exothermic energetics predicted for the dissociative O2 adsorption suggest that on a normal Zn3P2(001) surface, oxygen will exist as dissociated O species. The dissociated O species adsorbs preferentially at bridge Zn–Zn and Zn–P sites as shown in Fig. 3f-D1, with the average O–Zn and O–P bond distances predicted at 1.849 and 1.603, respectively.
For the water–Zn3P2(001) interactions (Fig. 4), water is found to bind preferentially at the two distinct Zn sites via the O atom (Fig. 4b-M1 and c-M2) releasing an adsorption energy of −0.66 and −0.59 eV (Table 3). The interacting O–Zn distance is calculated at 2.146 and 2.201 Å for the M1 and M2 configurations, respectively. When the water is adsorbed with the hydrogen atoms pointing towards surface P sites (Fig. 4c-M3), a physical adsorption is predicted (Eads = −0.36 eV) and the shortest H–P interatomic distance converged at 2.446 Å. The asymmetric and symmetric stretching vibrational modes of the adsorbed water are M1 (3661.6 and 3547.9 cm−1), M2 (3784.8 and 3650.5 cm−1) and M3 (3791.9 and 3653.4 cm−1).
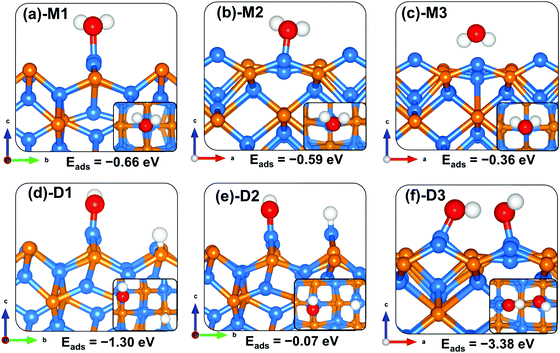 | ||
| Fig. 4 Optimized adsorption structures of a water molecule on Zn3P2(001). The insets show the top views. Color scheme: Zn = blue, P = orange, O = red, and H = white. | ||
| Surface | Configuration | E ads (eV) | |q| (e−) | d(O–H) (Å) | d(Zn–Owat) (Å) | d(Zn–Ooxy) (Å) | d(P–Ooxy) (Å) | d(Zn–H) (Å) | d(P–H) (Å) |
|---|---|---|---|---|---|---|---|---|---|
| (001) | M1 (H2O) | −0.66 (−0.62) | 0.03 | 0.981/0.976 | 2.146 | — | — | — | — |
| M2 (H2O) | −0.59 (−0.55) | −0.06 | 0.974/0.981 | 2.201 | — | — | — | — | |
| M3 (H2O) | −0.36 (−0.31) | 0.00 | 0.985/0.978 | 2.887 | — | — | — | 2.446 | |
| D1 (OH + H) | −1.30 (−1.21) | −1.83 | 0.973 | 1.847 | — | — | — | 1.414 | |
| D2 (OH + H) | −0.07 (+0.02) | −0.91 | 0.978 | 1.832 | 1.529 | — | |||
| D3 (OH + OH) | −3.38 (−3.22) | −1.16 | 0.986 | 1.845 | 1.797 | — | — | — | |
| (101) | M1 (H2O) | −0.89 (−0.83) | 0.02 | 0.982/0.979 | 2.239 | — | — | — | — |
| D1 (OH + H) | −0.19 (−0.13) | −1.88 | 0.975 | 1.880 | — | — | — | 1.443 | |
| D2 (OH + H) | +1.35 (+1.41) | −0.92 | 0.976 | 1.871 | — | — | 1.561 | — | |
| D3 (OH + OH) | −2.39 (−2.23) | −1.70 | 0.973 | 1.877 | 2.108 | 1.735 | — | — | |
| (110) | M1 (H2O) | −0.54 (−0.50) | 0.04 | 0.974/0.974 | 2.181 | — | — | — | — |
| D1 (OH + H) | +0.13 (+0.19) | −1.88 | 0.975 | 1.833 | — | — | — | 1.434 | |
| D2 (OH + H) | +0.95 (+1.02) | −0.94 | 0.970 | 1.837 | — | — | 1.543 | — | |
| D3 (OH + OH) | −1.98 (−1.91) | −1.60 | 0.974 | 1.876 | 1.933 | 1.808 | — | — | |
Compared to the molecular water adsorption, the dissociative adsorption of water is found to be energetically more favourable (Eads = −1.30 eV) when the dissociated H atom binds at P sites and the OH is bound to the Zn site (Fig. 4d-D1). A much less favourable dissociation (Eads = −0.07 eV) is observed when both the dissociated H and OH fragment bind at Zn sites (Fig. 4e-D2), suggesting that the dissociated protons will preferentially bind at P sites on the Zn3P2(001) surface. The adsorption of water adjacent to a preadsorbed atomic O gave rise to a spontaneous proton transfer from the water to the O atom, resulting in the formation of two hydroxyl species (Fig. 4f-D3) with the coadsorption energy predicted at −3.38 eV. The highly exothermic energy suggests that preadsorbed oxygen species facilitates the O–H bond activation of water towards its dissociation. The predicted dissociative exothermic adsorption energies for H2O are more favourable than the endothermic bond dissociation energy of H2O (OH + H), 5.04 eV,43 indicating that the Zn3P2(001) surface favours dissociative H2O adsorption over molecular adsorption. Similar results have been observed at iron sulfide mackinawite39 and on metallic Au(111)55 and Pd(100)56 surfaces, where the surfaces were shown to readily promote the dehydrogenation of water when precovered with oxygen.
3.3 Adsorption of O2 and H2O oxygen on the Zn3P2(101) surface
Like on the (001) surface, two adsorption modes were considered on the Zn3P2(101) surface: the end-on type, where O binds vertically to the surface atom, and a side-on type, where O2 binds parallel to the surface atom. When adsorbed in a side-on configuration such that one end of O2 binds at the Zn-site and the other at the P-site (Fig. 5a-M1), a favourable adsorption energy of −2.06 eV was calculated. A much less favourable adsorption energy of −0.34 eV is released when the two ends of O2 bind at two adjacent Zn-sites (Fig. 5d-M4). The interacting O–Zn and O–P distances and O–O bond length in the most stable M1 adsorption configuration are 1.942 Å, 1.664 Å, and 1.527 Å, respectively. The next most stable adsorption configuration is predicted to be an end-on binding mode (Fig. 5b-M2), which released an adsorption energy of −0.79 eV and the O–O bond length is converged at 1.309 Å. The interacting O–Zn interatomic bond distance is calculated at 2.014 Å. The side-on adsorption configuration, wherein both ends of O2 bind at the same Zn-site (Fig. 5c-M3), released an adsorption energy of −0.57 eV, with the optimized O–O and O–Zn interatomic bond distances predicted at 1.366 and 2.096 Å, respectively. A comparison of the calculated O–O bond lengths for the adsorbed O2 with that of the gas phase O2 (1.24 Å) suggests elongation and therefore weakening of the adsorbed O–O bonds, which is confirmed via vibration frequency analysis (Table 2). The O–O stretching vibrational frequencies for O2 adsorbed in configurations M1, M2, M3, and M4 are assigned to 717.6, 1186.1, 1050.1 and 1098.8 cm−1, respectively, all of which are lower than that of the gas phase O2 molecule (1558 cm−1). The calculated stretching frequencies and the O–O bond lengths of the adsorbed O2 (1.53 Å for M1, and 1.30–1.37 Å for M2–M4 configurations) are similar to that of the O2− ion (1.33 Å) and O22− (1.44 Å),53,54 suggesting that the adsorbed molecular oxygen species on the Zn3P2(101) surface can be assigned to superoxo (O2−) and peroxo (O22−) species.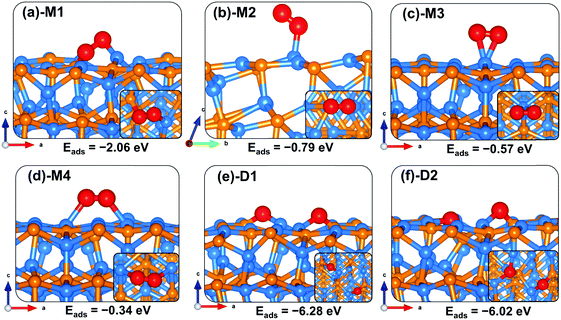 | ||
| Fig. 5 Optimized adsorption structures of an oxygen molecule on Zn3P2(101). The insets show the top views. Color scheme: Zn = blue, P = orange, and O = red. | ||
The elongated O–O bonds suggest that the adsorbed peroxo and superoxo species are likely precursors for O2 dissociation on the Zn3P2(101) surface. When dissociated such that both the O atoms bind at two adjacent bridge Zn–P sites (Fig. 5e-D1), the adsorption energy is calculated at −6.28 eV, whereas when one of the dissociated O atoms binds at the bridge Zn–P site and the other at the near subsurface interacting with two Zn and one P species (Fig. 5f-D2), the adsorption energy is −6.02 eV. As on the (001) surface, the highly exothermic adsorption energies calculated for the dissociated O2 species compared to their molecular adsorption suggest that on a normal Zn3P2(101) surface, the oxygen molecule will preferentially adsorb dissociatively.
The lowest-energy adsorption structure for molecular water on the (101) surface (Fig. 6a-M1) released an adsorption energy of −0.89 eV. In this structure, the water molecule binds at the Zn-site via the O atom (Zn–O = 2.239 Å) with the two O–H bonds predicted at 0.982 and 0.979 Å (Table 3). The asymmetric and symmetric stretching vibrational modes of the adsorbed water are predicted at 3800.5 and 3689.5 cm−1. Compared to the molecular water adsorption, the direct dissociative adsorption is found to be less favoured energetically. When dissociated such that the H proton binds at the P-site with the OH fragment bound to the Zn site (Fig. 6b-D1), the adsorption is predicted at −0.19 eV. An endothermic adsorption of +1.35 eV is calculated for the dissociative configuration in which both the H proton and OH fragments bind at adjacent Zn sites (Fig. 6c-D2). Investigation of the effect of preadsorbed O atoms on the adsorption of H2O on the Zn3P2(101) surface revealed that the preadsorbed O atoms facilitate spontaneous proton transfer from the water to the preadsorbed O atom resulting in the formation of two surface hydroxyl species. A favourable coadsorption energy of −2.39 eV is released, which indicates that preadsorbed O atoms on the Zn3P2(101) surface would promote the dissociation of water.
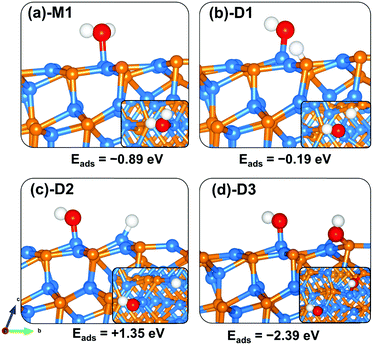 | ||
| Fig. 6 Optimized adsorption structures of a water molecule on Zn3P2(101). The insets show the top views. Color scheme: Zn = blue, P = orange, O = red, and H = white. | ||
3.4 Adsorption of O2 and H2O oxygen on the Zn3P2(110) surface
The lowest-energy adsorption configurations of O2 on the Zn3P2(110) surface are shown in Fig. 7, whereas the calculated adsorption energies and the optimized interatomic bond distances are summarized in Table 2. The most stable adsorption configuration is predicted to be a side-on binding mode in which the ends of the O2 molecule bind at two adjacent Zn sites (Fig. 7a-M1), releasing an adsorption energy of −1.77 eV. A similar adsorption energy of −1.68 eV is released when one end of the O2 molecule binds at the Zn site and the other at the P site (Fig. 7b-M2). The two interacting O–Zn bonds in the M1 configuration are predicted at 1.942 and 1.978 Å, respectively, whereas in the M2 configuration, the interacting O–Zn and O–P bonds are predicted at 1.913 and 1.676, respectively. The optimized O–O bond length in the M1 and M2 configurations is calculated at 1.395 and 1.476 Å, respectively, which when compared to the gas-phase O–O distance of 1.24 Å indicates elongation of the O2 bond upon adsorption on the Zn3P2(110) surface. The side-on (Fig. 7c-M3) and end-on (Fig. 7d-M4) adsorption configurations at the Zn-site released adsorption energies of 1.03 and 0.96 eV, respectively. The average interacting O–Zn distance is calculated at 1.979 and 2.073 Å, respectively, for the M3 and M4 configurations. The optimized O–O bond distance in the M3 and M4 configurations is calculated at 1.313 and 1.365 Å, respectively. The weakened O–O bonds especially in the side-on adsorption configurations suggest that these molecularly adsorbed states are likely precursors for O2 dissociation on the Zn3P2(110) surface. When investigated, the dissociative adsorption of O2 on the (110) surface is found to be highly exothermic, releasing an adsorption energy of −4.95 eV for the configuration in which the dissociated O atoms bind at bridge Zn–P sites. When one of the dissociated O atoms binds at the Zn-site and the other at bridge Zn–P sites, the adsorption energy is −2.26 eV, which suggests that the bridge Zn–P site is the most active site for atomic O on the (110) surface.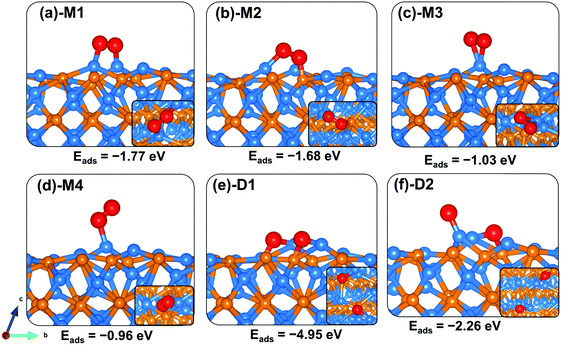 | ||
| Fig. 7 Optimized adsorption structures of an O2 molecule on Zn3P2(110). The insets show the top views. Color scheme: Zn = blue, P = orange, and O = red. | ||
The adsorption of water on the Zn3P2 surface at the Zn site released an adsorption energy of −0.54 eV with the interacting O–Zn distance calculated at 2.181 Å (Table 3). The asymmetric and symmetric stretching vibrational modes of the adsorbed water are predicted at 3861.2 and 3708.5 cm−1. Compared to the (001) and (101) surfaces, the direct dissociative adsorption of water on the clean (110) surface is found to be endothermic by +0.13 and +0.95 eV for configurations wherein the dissociated proton H binds at the P-site (Fig. 8b-D1) and Zn-site (Fig. 8c-D2), respectively, with the OH fragment bound to the Zn site. This indicates that without the presence of promoters, for example, atomic O species on the surface, water on the clean Zn3P2(110) surface will remain molecularly adsorbed. Interestingly, when water is adsorbed adjacent to a preadsorbed atomic O Zn3P2(110) surface, a spontaneous proton transfer from the water to the O atom occurred resulting in the formation of two hydroxyl species adsorbed on the surface with a favourable coadsorption energy of −1.98 eV (Fig. 8d-D3).
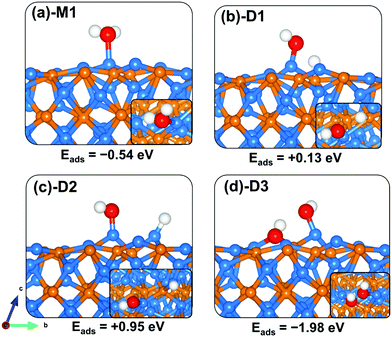 | ||
| Fig. 8 Optimized adsorption structures of a water molecule on Zn3P2(110). The insets show the top views. Color scheme: Zn = blue, P = orange, O = red, and H = white. | ||
3.5 Charge transfers and oxidation mechanism of Zn3P2 surfaces
In order to gain a chemical picture of the initial steps of the oxidation process of Zn3P2 surfaces and to ascertain the extent of oxidation of the surface species upon O2 and H2O adsorption, we have determined their Bader charges and compared them to those on the clean surface counterparts. Summarized in Tables 4 and 5 are the Bader charges of the interacting surface species with O2 and H2O, respectively. It is found that the Zn atoms to which molecular oxygen is bound become more positively charged (0.69–0.93 e−) compared to the clean surface Zn charges of 0.56–0.62 e−, which from the qZn2+/qZn3+ ratio is enough to suggest that they have been oxidized from Zn2+ to Zn3+. In the most stable side-on adsorption configuration at the (001) surface, where one end of O2 binds at the Zn site and the other at the P site (Fig. 3a-M1), the interacting surface P ion is significantly oxidized, becoming positively charged (+0.49 e−) compared to the negative charge of −0.84 e− on the clean surface. Similarly, the interaction of dissociated O species at P sites on the (001) surface (Fig. 3f-D1) caused them to be significantly oxidized to +1.08 e− (Table 4). The interacting surface species of the (101) surface are also demonstrated to undergo oxidation to a large extent upon O2 adsorption. This is reflected in the higher positive (0.77–0.88 e−) Bader charges of the interacting Zn sites compared to the clean surface Zn charges of 0.69 e−. Interacting P sites with molecular or atomic oxygen are also found to undergo significant oxidation as reflected in the calculated positive charges (0.66–0.87 e−) compared to the negative charge of −0.94 e− on the clean (101) surface (Table 4). At the (110) surface, the adsorption of O2 at Zn sites is demonstrated to oxidize the interacting Zn ions, which become more positively charged (0.81–0.87 e−) compared to the clean surface Zn charges of 0.58–0.61 e−. This is enough to suggest that they have been oxidized from Zn2+ to Zn3+ formal oxidation states. Whereas molecular water oxidizes the Zn3P2 surface to a smaller extent, the dissociated species enhances the oxidation of the interacting surface species as reflected in the higher positive charge of the interacting Zn sites relative to the naked surface. The transfer of H protons to the P sites resulted in their significant oxidation, which become positively charged with a charge of +0.61, +0.65, and +0.66 at the (001), (101), and (110) surfaces compared to the negative charge of −0.84, −0.94, and −0.85 e− on the naked surfaces.| Surface | Configuration | Zn | P | ||
|---|---|---|---|---|---|
| Before | After | Before | After | ||
| (001) | M1 | 0.56 | 0.69 | −0.84 | +0.49 |
| M2 | 0.60 | 0.79 | — | — | |
| M3 | 0.62 | 0.81 | — | — | |
| M4 | 0.61 | 0.88 | — | — | |
| M5 | 0.61 | 0.93 | — | — | |
| D1 | 0.62 | 0.82 | −0.84 | +1.08 | |
| (101) | M1 | 0.69 | 0.88 | −0.94 | +0.66 |
| M2 | 0.69 | 0.83 | — | — | |
| M3 | 0.69 | 0.88 | — | — | |
| M4 | 0.69 | 0.77 | — | — | |
| D1 | 0.68 | 0.79 | −0.94 | +0.72 | |
| D2 | 0.69 | 0.83 | −0.94 | +0.87 | |
| (110) | M1 | 0.63 | 0.84 | ||
| M2 | 0.69 | 0.87 | −0.83 | 0.65 | |
| M3 | 0.56 | 0.86 | — | — | |
| M4 | 0.56 | 0.81 | — | — | |
| D1 | 0.56 | 0.82 | −0.83 | +0.71 | |
| D2 | 0.58 | 0.86 | −0.83 | +0.73 | |
| Surface | Configuration | Zn | P | ||
|---|---|---|---|---|---|
| Before | After | Before | After | ||
| (001) | M1 (H2O) | 0.65 | 0.83 | — | — |
| M2 (H2O) | 0.56 | 0.63 | — | — | |
| M3 (H2O) | 0.61 | 0.76 | — | — | |
| D1 (OH + H) | 0.65 | 0.90 | −0.84 | +0.61 | |
| D2 (OH + H) | 0.56 | 0.90 | — | — | |
| D3 (OH + OH) | 0.61 | 0.91 | — | — | |
| (101) | M1 (H2O) | 0.68 | 0.79 | — | — |
| D1 (OH + H) | 0.68 | 0.88 | −0.94 | +0.66 | |
| D2 (OH + H) | 0.68 | 0.88 | — | — | |
| D3 (OH + OH) | 0.68 | 0.87 | −0.86 | +0.42 | |
| (110) | M1 (H2O) | 0.56 | 0.71 | — | — |
| D1 (OH + H) | 0.56 | 0.87 | −0.85 | +0.65 | |
| D2 (OH + H) | 0.56 | 0.86 | — | — | |
| D3 (OH + OH) | 0.56 | 0.85 | −0.85 | +0.25 | |
The observed significant extent oxidation of the Zn3P2 surfaces is consistent with the notable amount of charge drawn from interacting surface Zn and P sites by the adsorbed oxygen and water species. The charge gained by the adsorbed O2 molecule at the (001) surface is calculated to be in the range of (0.70–1.72 e−) for the molecularly adsorbed O2, and for the dissociated state a combined amount of 2.98 e− is drawn by the dissociated O species (Table 2). At the (101) surface, the molecularly adsorbed O2 species draws a charge of 0.53–1.87 e− from the interacting surface species, whereas the dissociated O species draws a combined charge of 3.62–3.75 e− from the interacting surface species. Similarly, at the (110) surface, the molecular and dissociated O2 species draw a charge of 0.55–1.81 e− and 2.64–3.54 e−, respectively, from the interacting surface species. The significant charge gained by the O2 molecules upon adsorption on the (001), (101) and (110) surfaces is responsible for the elongation of the O–O bonds, which characterizes the adsorbed O2 molecule as a superoxo (O2−) and peroxo (O22−) species. A number of earlier ab initio calculations have also identified the formation of a superoxo and peroxo species via electron transfer from iron sulfide mackinawite39 and pyrite57–59 surfaces. For water adsorption, whereas less charge is transferred from the (001), (101) and (110) surfaces to the molecular water species, a significant amount of charge is drawn by the dissociated species. At the (001) surface, the molecular adsorbed water gained a charge of 0.06 e−, but when dissociated the OH and H fragments draw a combined charge of 1.83 e−, with the H alone gaining 1.21 e−. The 2OH− species formed at the O-covered (001) surface draws a combined charge of 1.16 e−. Similarly, at the (101) surface, the molecularly adsorbed water gained only 0.02 e−, whereas in the preferred direct dissociation (OH + H) and oxygen-assisted dissociation (2OH), a combined charge of 1.88 e− and 1.17 was drawn from the surface, respectively. At the (110) surface, molecular water gained 0.04 e−, whereas in the preferred direct dissociation (OH + H) and oxygen-assisted dissociation (2OH−) a combined charge of 1.88 and 1.60 e− was drawn. The significant amount of charge loss by the interacting surface species to the adsorbing oxygen and water molecules is the primary origin of the initial oxidation of Zn3P2 surfaces.
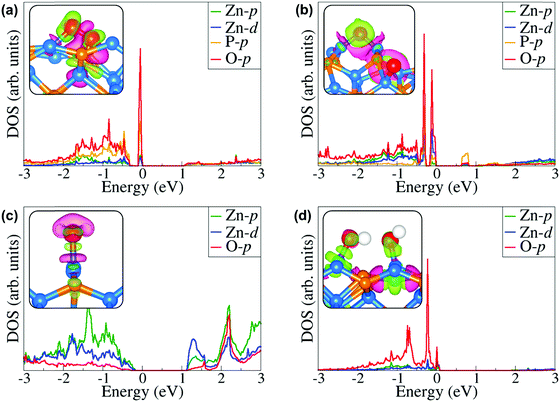
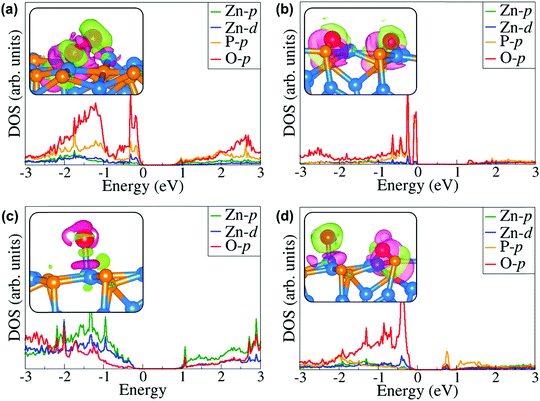
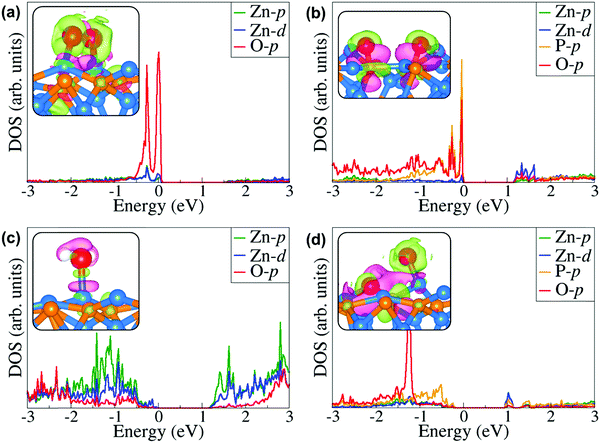
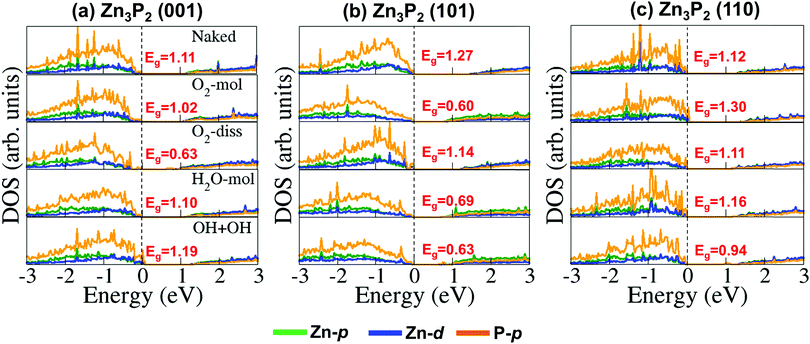
Further atomic-level insights into the nature and effect of the interaction of oxygen and water molecules on the (001), (101) and (110) Zn3P2 surfaces were provided through the partial density of states (PDOS) and differential charge density isosurface contours, which give a chemical picture of hybridization and electron density redistribution with the adsorbate–surface systems. Shown in Fig. 9–11 are the partial DOS projected on the interacting surface Zn-pd-states, P-p-states and O-p-states for the most stable molecular O2, dissociated O2, molecular H2O, and O enhanced dissociated H2O on the (001), (101) and (110) Zn3P2 surfaces. The PDOS plots reveal strong hybridization between the interacting surface and adsorbate orbitals, which is characterized by charge transfer from the interacting surface ions to the adsorbed oxygen and water molecules. The insets in Fig. 9–11 show the corresponding differential charge density isosurface contours, highlighting the regions of electron density depletion and accumulation. The effect of oxygen and water adsorption on the electronic structure of the (001), (101) and (110) Zn3P2 surfaces was investigated by comparing the partial DOS of the naked surface with those covered with molecular O2, dissociated O2, molecular H2O, and O enhanced dissociated H2O as shown in Fig. 12. Generally, the semiconducting nature of the surfaces is found to be essentially preserved but there are noticeable changes in the PDOS of the adsorbed surfaces compared to the naked surfaces, especially for the dissociated oxygen and O enhanced dissociated water surfaces. Most of the adsorbed surfaces possess slightly narrower band gaps than their naked counterparts, which can be attributed to the small adsorption induced changes in the atomic positions of the interacting surface species. For instance the band gap of the Zn3P2(001) surface is 1.11 eV, whereas the band gaps of the surface covered with molecular O2, dissociated O2, molecular H2O, and O enhanced dissociated H2O are predicted at 1.02, 0.63, 1.10 and 1.19 eV, respectively. This shows that the dissociated O2 induced the most significant changes to the electronic structure of the Zn3P2(001) surface and this is consistent with the stronger binding of the dissociated O species, which draws significant amount of charge from the interacting surface species. At the Zn3P2(101) surfaces, the molecular O2, dissociated O2, molecular H2O, and O enhanced dissociated H2O covered surfaces exhibit band gaps of 0.60, 1.14, 0.69 and 0.63 eV respectively, compared to the naked surface band gap of 1.27 eV, Here, it is evident that the molecular O2, molecular H2O, and O enhanced dissociated H2O covered surfaces are altered the most by these adsorbed species. For the Zn3P2(110) surface, the O enhanced dissociated H2O covered surfaces are altered the most with a predicted band gap of 0.94 eV compared to the naked surface band gap of 1.12 eV.
4. Summary and conclusions
The mechanism of the initial steps of Zn3P2(001), (101) and (110) surface oxidation in the presence of oxygen and water was comprehensively investigated using first-principles DFT-D3 calculations. It is clear from the results presented that while water interacts weakly with the Zn3P2 surfaces, the molecular and dissociative oxygen species interact quite strongly with the surface species by drawing a significant amount of charge from them, causing the interacting cation sites to be oxidized from Zn2+ to Zn3+. Reactions involving oxygen interacting with P sites are shown to be characterized by significant charge transfer from these sites to the adsorbing oxygen species, resulting in the significant oxidation of the P sites, which become positively charged compared to their negative charge in the naked surfaces. The adsorbed O2 molecule on the different surfaces exhibits characteristics of a superoxo (O2−) and peroxo (O22−) species with an elongated O–O bond distance, confirmed through our vibrational frequency and Bader charge analyses. Preadsorbed atomic oxygen species are demonstrated to enhance O–H bond activation, which plays a key role in the dissociation reaction of water on the Zn3P2 surfaces. Compared to molecular water adsorption, dissociated water species enhances the oxidation of the Zn3P2 surfaces as the formation of adsorbed OH + H fragments or two adsorbed hydroxide species (OH−) draws a significant amount of charges from the interacting surface sites. Consistent with the significant extent of oxidation of the different Zn3P2 surfaces by the adsorbed oxygen and water species, we observe changes in their electronic structures, with the covered surface exhibiting smaller band gaps than the naked surfaces. These findings provide the fundamental and general insight into the adsorption processes and the incipient oxidation of Zn3P2 surfaces in the presence of oxygen and water. It is suggested that efforts be made to passivate Zn3P2 surfaces via in situ functionalization, wherein the Zn3P2 nanoparticles of thin films are exposed to a vapour of organic functional molecules immediately after synthesis. Functionalization of Zn3P2 nanoparticles can enhance their surface stability against temperature and possible oxidation in the presence of oxygen and moisture that could result in their degradation.60Conflicts of interest
There are no conflicts to declare.Acknowledgements
N. Y. D. acknowledges the UK Engineering and Physical Sciences Research Council (EPSRC) for funding (Grant No. EP/S001395/1). This work was performed using the computational facilities of the Advanced Research Computing@Cardiff (ARCCA) Division, Cardiff University. This work also made use of the facilities of ARCHER (http://www.archer.ac.uk), the UK's national supercomputing service via our membership of the UK's HEC Materials Chemistry Consortium, which is funded by EPSRC (EP/L000202). Information on the data that underpins the results presented here, including how to access them, can be found in the Cardiff University data catalogue at http://doi.org/10.17035/d.2019.0088117956.References
- C. Wadia, A. P. Alivisatos and D. M. Kammen, Environ. Sci. Technol., 2009, 43, 2072–2077 CrossRef CAS PubMed.
- S. P. Vasekar and T. P. Dhakal, Thin film solar cells using earthabundant materials, Sol. Cells: Res. Appl. Perspect., 2013, 145–168, DOI:10.5772/51734.
- L. Wu, N. Y. Dzade, L. Gao, D. O. Scanlon, Z. Öztürk, N. Hollingsworth, B. M. Weckhuysen, E. J. M. Hensen, N. H. de Leeuw and J. P. Hofmann, Adv. Mater., 2016, 28, 9602–9607 CrossRef CAS PubMed.
- E. A. Fagen, J. Appl. Phys., 1979, 50, 6505–6515 CrossRef CAS.
- G. M. Kimball, A. M. Mueller, N. S. Lewis and H. A. Atwater, Appl. Phys. Lett., 2009, 95, 112103 CrossRef.
- J. M. Pawlikowski, Phys. Rev. B: Condens. Matter Mater. Phys., 1982, 26, 4711–4713 CrossRef CAS.
- N. C. Wyeth and A. Catalano, J. Appl. Phys., 1979, 50, 1403–1407 CrossRef CAS.
- J. P. Bosco, S. B. Demers, G. M. Kimball, N. S. Lewis and H. A. Atwater, J. Appl. Phys., 2012, 112, 093703 CrossRef.
- M. Bhushan and A. Catalano, Appl. Phys. Lett., 1981, 38, 39–41 CrossRef CAS.
- G. M. Kimball, N. S. Lewis and H. A. Atwater, Mg Doping and Alloying in Zn3P2 Heterojunction Solar Cells, 35th IEEE Photovolt. Special. Conf. 2010, pp. 1039–1043.
- E. J. Luber, M. H. Mobarok and J. M. Buriak, ACS Nano, 2013, 7, 8136–8146 CrossRef CAS PubMed.
- O. Vazquez-Mena, J. P. Bosco, O. Ergen, H. I. Rasool, A. Fathalizadeh, M. Tosun, M. Crommie, A. Javey, H. A. Atwater and A. Zettl, Nano Lett., 2014, 14, 4280–4285 CrossRef CAS PubMed.
- P. S. Nayar and A. Catalano, Appl. Phys. Lett., 1981, 39, 105 CrossRef CAS.
- K. Kakishita, K. Aihara and T. Suda, Sol. Energy Mater. Sol. Cells, 1994, 35, 333–340 CrossRef CAS.
- T. Suda, M. Suzuki and S. Kurita, Jpn. J. Appl. Phys., 1983, 22, L656 CrossRef.
- M. Ginting and J. D. Leslie, Can. J. Phys., 1989, 67, 448 CrossRef CAS.
- J. P. Bosco, D. O. Scanlon, G. W. Watson, N. S. Lewis and H. A. Atwater, J. Appl. Phys., 2013, 113, 203705 CrossRef.
- G. M. Kimball, J. P. Bosco, A. M. Muller, S. F. Tajdar, B. S. Brunschwig, H. A. Atwater and N. S. Lewis, J. Appl. Phys., 2012, 112, 106101 CrossRef.
- G. Chen, S. B. Visbeck, D. C. Law and R. F. Hicks, J. Appl. Phys., 2002, 91, 9362–9367 CrossRef CAS.
- P. Soukiassian, M. H. Bakshi, H. I. Starnberg, A. S. Bommannavar and Z. Hurych, Phys. Rev. B: Condens. Matter Mater. Phys., 1988, 37, 6496 CrossRef CAS PubMed.
- C. H. Hsu, B. C. Han, M. Y. Liu, C. Y. Yeh and J. E. Casida, Free Radicals Biol. Med., 2000, 28, 636–642 CrossRef CAS PubMed.
- M. Y. Bashouti, T. Stelzner, A. Berger, S. Christiansen and H. Haick, J. Phys. Chem. C, 2008, 112, 19168–19172 CrossRef CAS.
- T. Hanrath and B. A. Korgel, J. Am. Chem. Soc., 2004, 126, 15466–15472 CrossRef CAS PubMed.
- L. Brockway, M. Van Laer, Y. Kang and S. Vaddiraju, Phys. Chem. Chem. Phys., 2013, 15, 6260–6267 RSC.
- G. Kresse and J. Hafner, Phys. Rev. B: Condens. Matter Mater. Phys., 1993, 47, 558–561 CrossRef CAS PubMed.
- G. Kresse and J. Hafner, Phys. Rev. B: Condens. Matter Mater. Phys., 1994, 49, 14251–14269 CrossRef CAS PubMed.
- G. Kresse and J. Furthmüller, Phys. Rev. B: Condens. Matter Mater. Phys., 1996, 54, 11169–11186 CrossRef CAS PubMed.
- P. E. Blöchl, Phys. Rev. B: Condens. Matter Mater. Phys., 1994, 50, 17953 CrossRef PubMed.
- G. Kresse and D. Joubert, Phys. Rev. B: Condens. Matter Mater. Phys., 1999, 59, 1758 CrossRef CAS.
- J. P. Perdew, K. Burke and M. Ernzerhof, Phys. Rev. Lett., 1997, 78, 1396 CrossRef CAS.
- J. P. Perdew, K. Burke and M. Ernzerhof, Phys. Rev. Lett., 1996, 77, 3865–3868 CrossRef CAS PubMed.
- S. Grimme, J. Antony, S. Ehrlich and S. Krieg, J. Chem. Phys., 2010, 132, 154104 CrossRef PubMed.
- H. J. Monkhorst and J. D. Pack, Phys. Rev. B: Solid State, 1976, 13, 5188 CrossRef.
- G. W. Watson, E. T. Kelsey, N. H. de Leeuw, D. J. Harris and S. C. Parker, J. Chem. Soc., Faraday Trans., 1996, 92, 433 RSC.
- P. W. Tasker, J. Phys. C: Solid State Phys., 1979, 12, 4977 CrossRef CAS.
- G. Makov and M. C. Payne, Phys. Rev. B: Condens. Matter Mater. Phys., 1995, 51, 4014 CrossRef CAS PubMed.
- D. R. Lide, Handbook of Chemistry and Physics, CRC Press, Boca Raton, FL, 82nd edn, 2001 Search PubMed.
- G. Herzberg, Molecular Spectra and Molecular Structure. II. Infrared and Raman Spectra of Polyatomic Molecules, Lancaster Press, New York, 1946, p. 365 Search PubMed.
- N. Y. Dzade, A. Roldan and N. H. de Leeuw, J. Phys. Chem. C, 2016, 120, 21441–21450 CrossRef CAS.
- B. Yoon, H. Häkkinen and U. Landman, J. Phys. Chem. A, 2003, 107, 4066–4971 CrossRef CAS.
- G. Mattioli, F. Filippone and A. A. Bonapasta, J. Am. Chem. Soc., 2006, 128, 13772–13780 CrossRef CAS PubMed.
- T. Shimanouchi, Tables of Molecular Vibrational Frequencies, Consolidated Volume II, NSRDS NBS-39, J. Phys. Chem. Ref. Data, 1977, 6, 365 CrossRef.
- B. B. Darwent, Bond dissociation energies in simple molecules (Bond dissociation energies in simple inorganic compounds), Natl. Standard Ref. Data Ser., 31, Natl. Bur. of Standards, Washington, D.C, 1970.
- W. Tang, E. Sanville and G. Henkelman, J. Phys.: Condens. Matter, 2009, 21, 084204 CrossRef CAS PubMed.
- J. Andrzejewski and J. Misiewicz, Phys. Status Solidi B, 2001, 227, 515 CrossRef CAS.
- J. Hanuza, A. Lemiec and J. Misiewicz, Vib. Spectrosc., 1998, 17, 93 CrossRef CAS.
- K. Sieranski, J. Szatkowski and J. Misiewicz, Phys. Rev. B: Condens. Matter Mater. Phys., 1994, 50, 7331 CrossRef CAS PubMed.
- A. Weber, P. Sutter and H. von Kanel, J. Appl. Phys., 1994, 75, 7448 CrossRef CAS.
- J. Misiewicz, J. Phys.: Condens. Matter, 1990, 2, 2053 CrossRef CAS.
- I. E. Zanin, K. B. Aleinikova, M. M. Afanasiev and M. Y. Antipin, J. Struct. Chem., 2004, 45, 844–848 CrossRef CAS.
- A. V. Krukau, O. A. Vydrov, A. F. Izmaylov and G. E. Scuseria, J. Chem. Phys., 2006, 125, 224106 CrossRef PubMed.
- W. J. Yin and Y. Yan, J. Appl. Phys., 2013, 113, 013708 CrossRef.
- P. H. Sit, M. H. Cohen and A. Selloni, J. Phys. Chem. Lett., 2012, 3, 2409–2414 CrossRef CAS PubMed.
- U. Aschauer, J. Chen and A. Selloni, Phys. Chem. Chem. Phys., 2010, 12, 12956–12960 RSC.
- R. Liu, Comput. Theor. Chem., 2013, 1019, 141–145 CrossRef CAS.
- Z. Jiang, L. Li, M. Li, R. Li and T. Fang, Appl. Surf. Sci., 2014, 301, 468–474 CrossRef CAS.
- A. R. Lennie, S. A. T. Redfern, P. E. Champness, C. P. Stoddart, P. F. Schofield and D. J. Vaughan, Am. Mineral., 1997, 82, 302–309 CAS.
- P. H. L. Sit, M. H. Cohen and A. Selloni, J. Phys. Chem. Lett., 2012, 3, 2409–2414 CrossRef CAS PubMed.
- T. Rozgonyi and A. Stirling, J. Phys. Chem. C, 2015, 119, 7704–7710 CrossRef CAS.
- N. Y. Dzade, ACS Omega, 2019 DOI:10.1021/acsomega.9b02736.
Footnote |
| † Electronic supplementary information (ESI) available. See DOI: 10.1039/c9cp03902c |
| This journal is © the Owner Societies 2020 |

